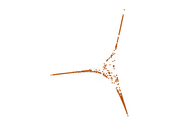
Wiktionary edits (om)
This is the bipartite edit network of the Oromo Wiktionary. It contains users
and pages from the Oromo Wiktionary, connected by edit events. Each edge
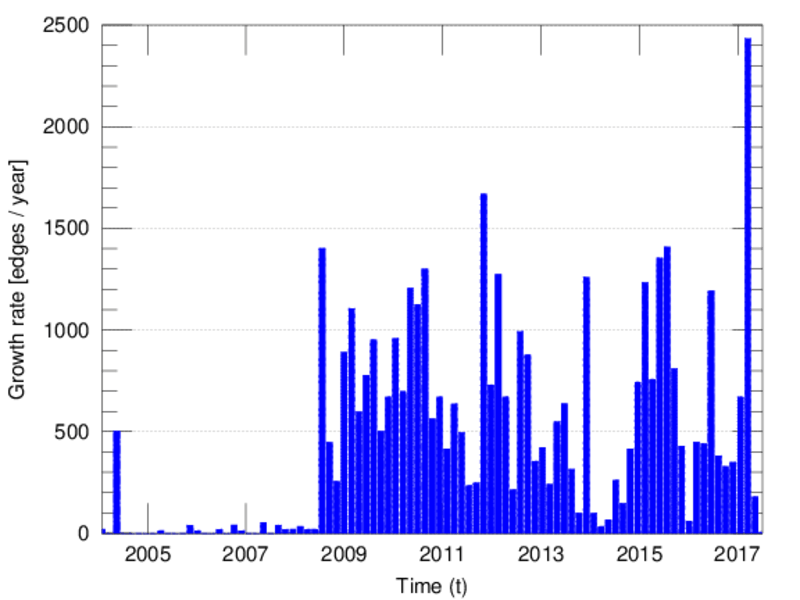
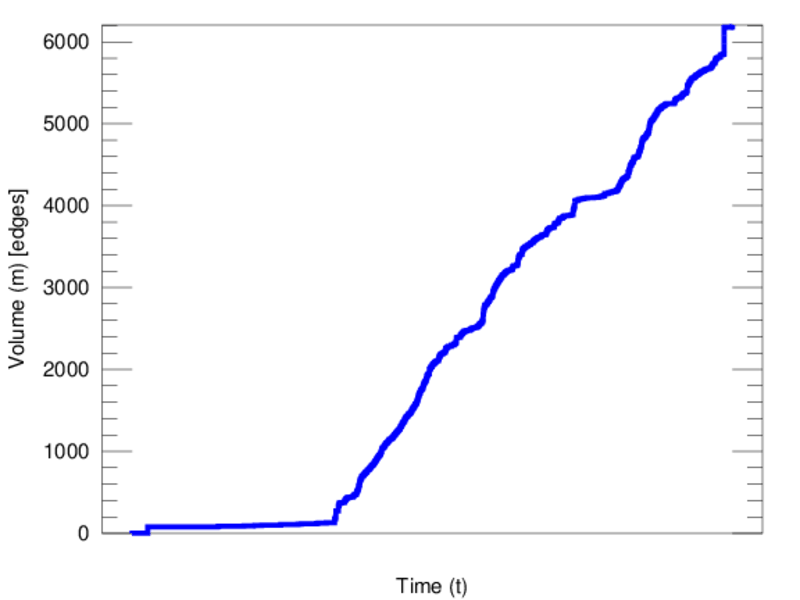
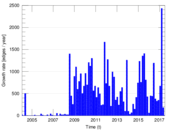
represents an edit. The dataset includes the timestamp of each edit.
Metadata
Statistics
| Size | n = | 1,124
|
| Left size | n1 = | 177
|
| Right size | n2 = | 947
|
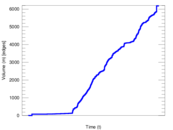
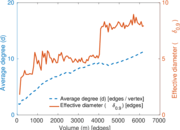
| Volume | m = | 6,205
|
| Unique edge count | m̿ = | 2,864
|
| Wedge count | s = | 242,982
|
| Claw count | z = | 19,042,409
|
| Cross count | x = | 1,294,430,294
|
| Square count | q = | 368,342
|
| 4-Tour count | T4 = | 3,924,700
|
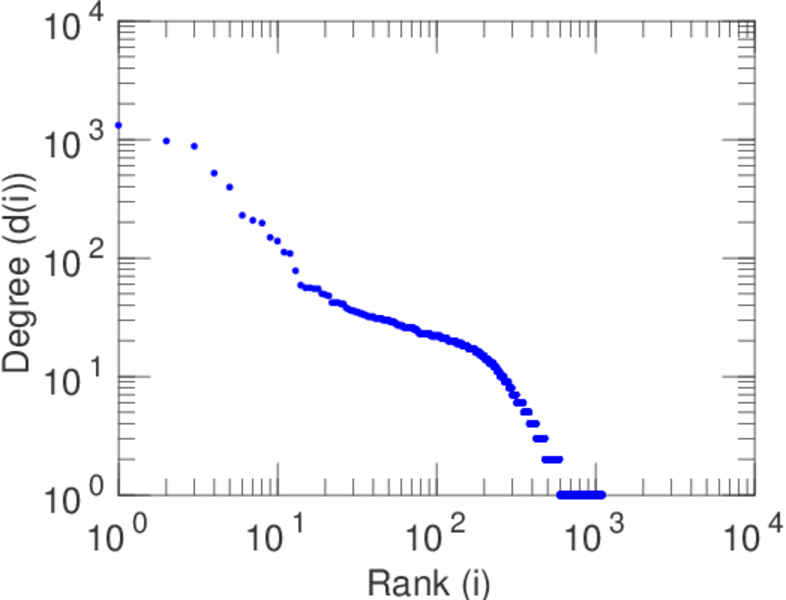
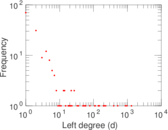
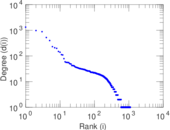
| Maximum degree | dmax = | 1,318
|
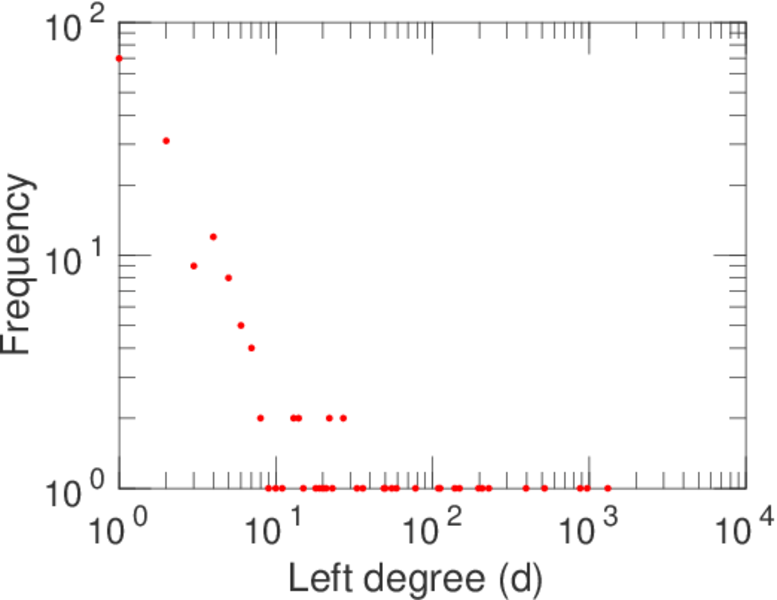
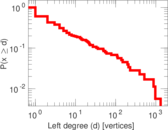
| Maximum left degree | d1max = | 1,318
|
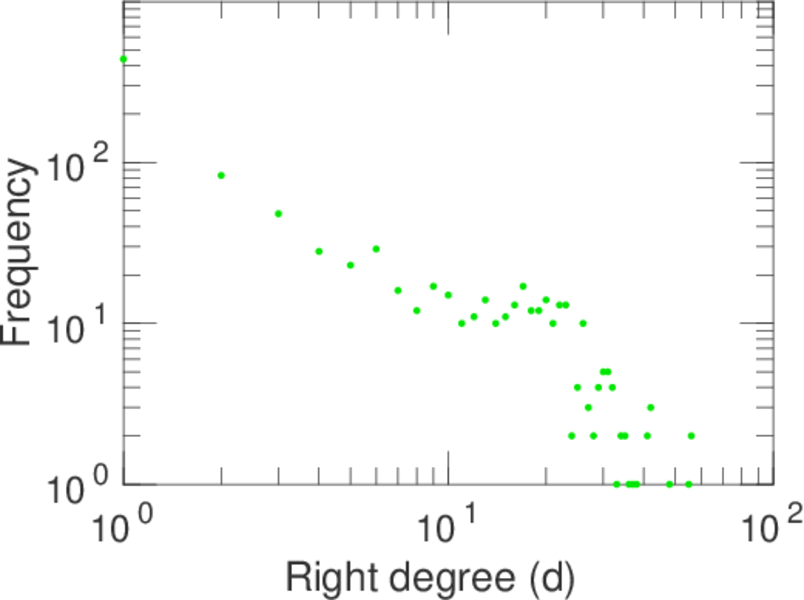
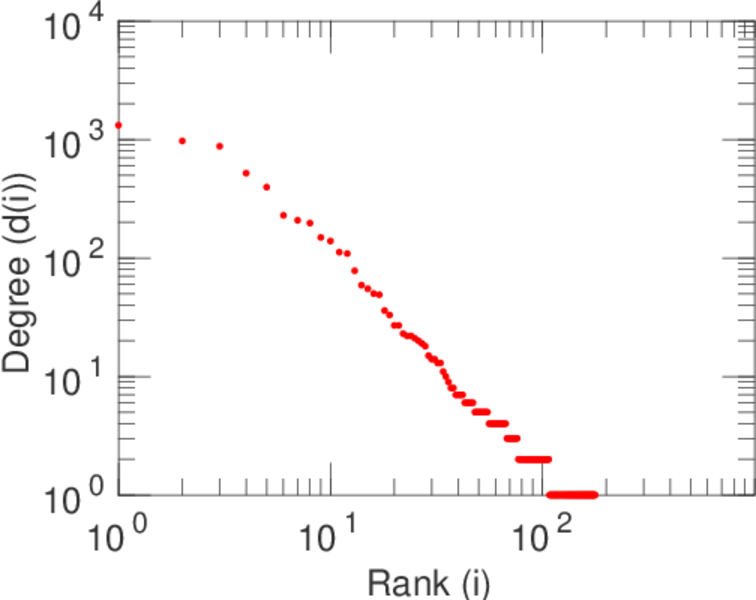
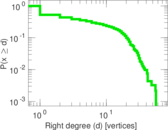
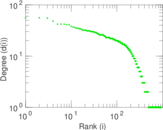
| Maximum right degree | d2max = | 56
|
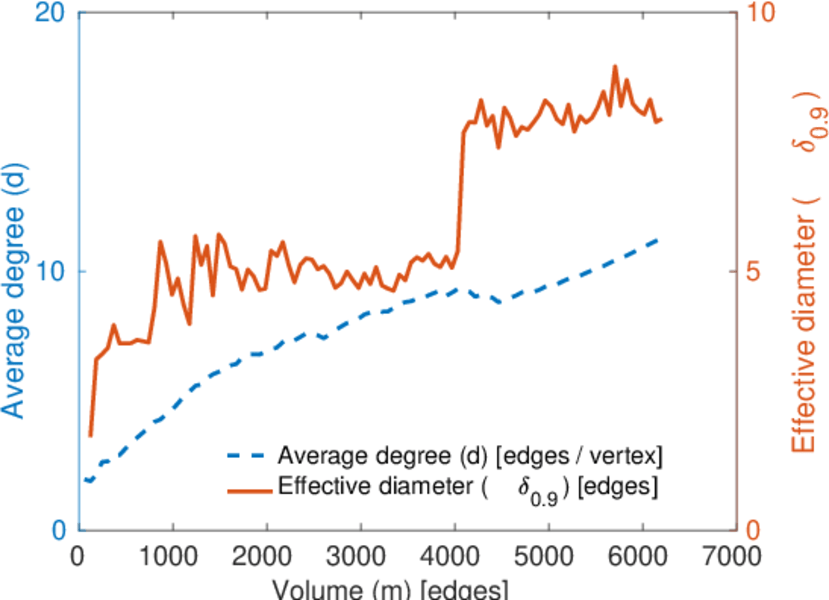
| Average degree | d = | 11.040 9
|
| Average left degree | d1 = | 35.056 5
|
| Average right degree | d2 = | 6.552 27
|
| Fill | p = | 0.017 086 4
|
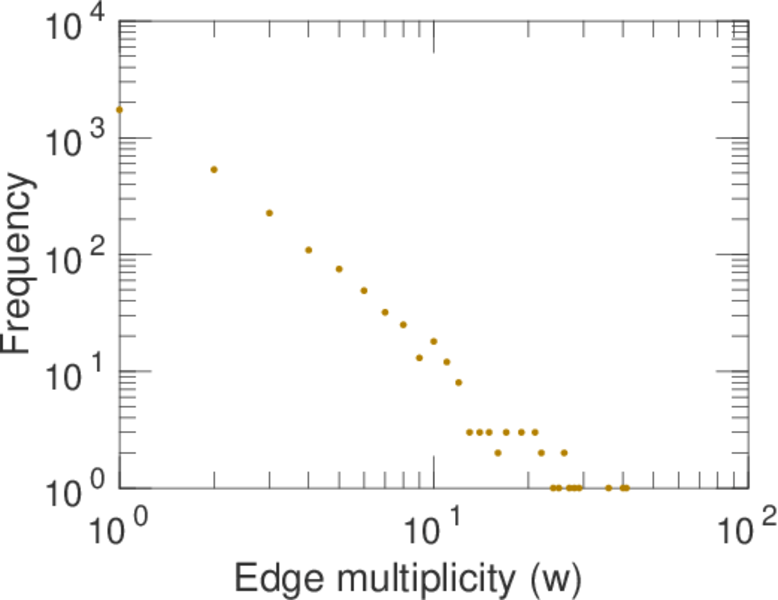
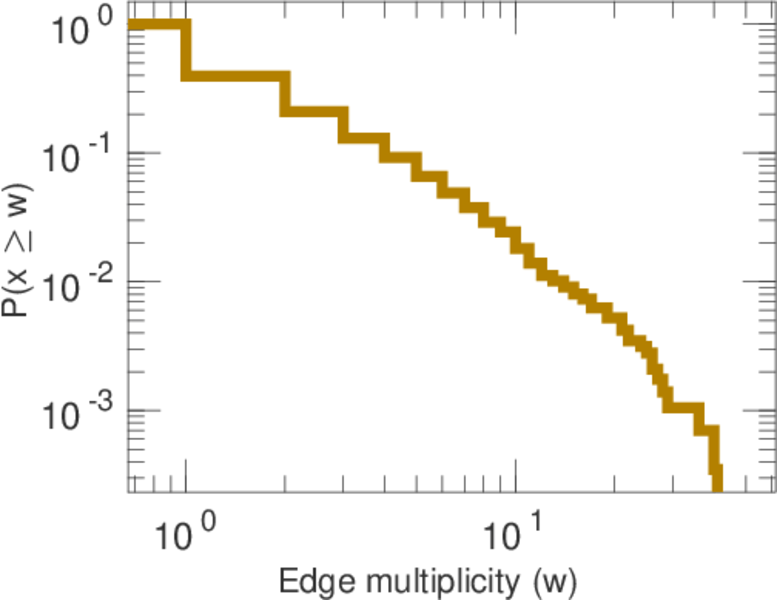
| Average edge multiplicity | m̃ = | 2.166 55
|
| Size of LCC | N = | 819
|
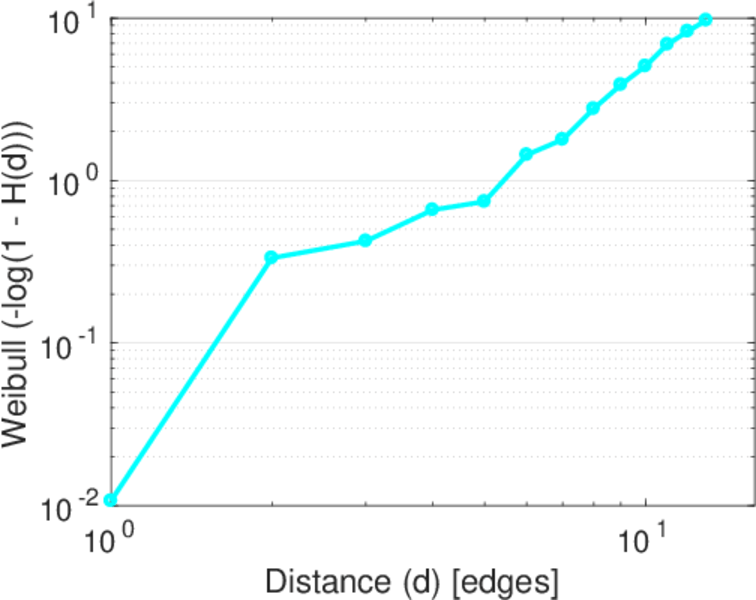
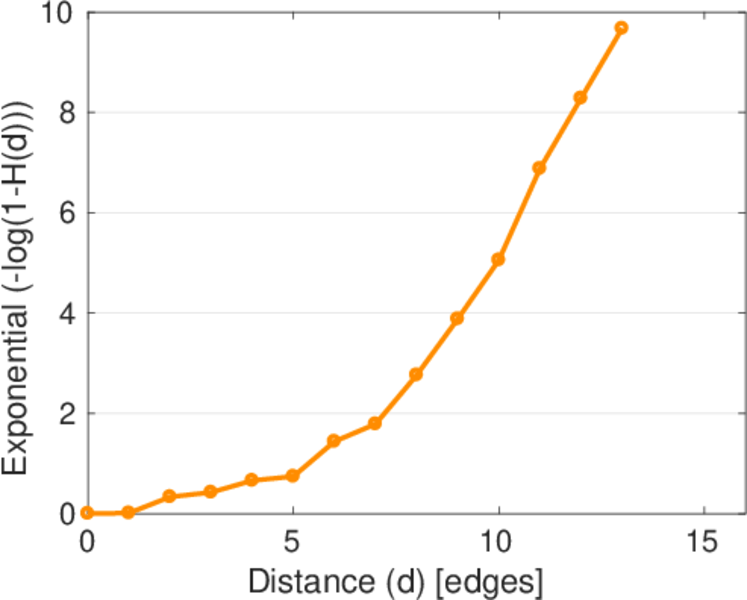
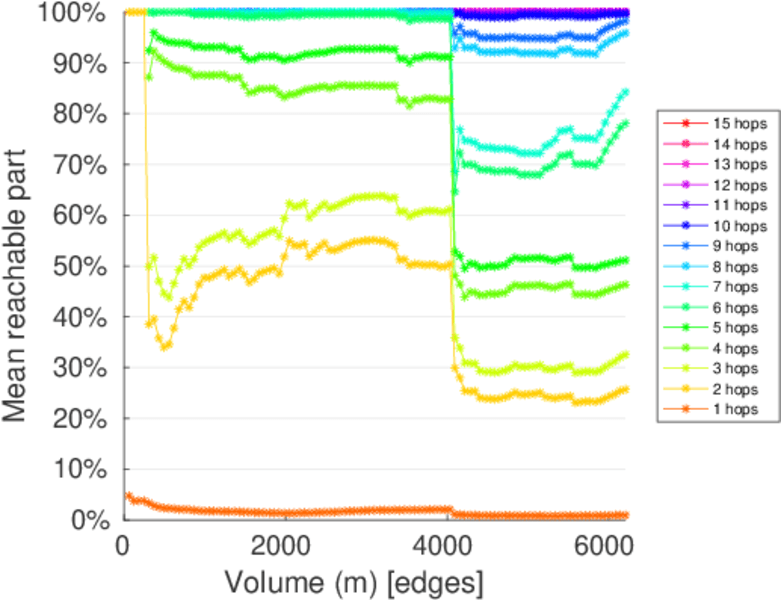
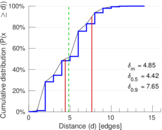
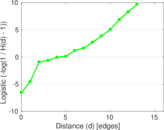
| Diameter | δ = | 14
|
| 50-Percentile effective diameter | δ0.5 = | 4.423 73
|
| 90-Percentile effective diameter | δ0.9 = | 7.647 08
|
| Median distance | δM = | 5
|
| Mean distance | δm = | 4.849 24
|
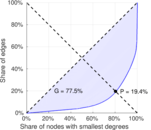
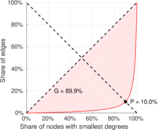
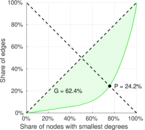
| Gini coefficient | G = | 0.757 696
|
| Balanced inequality ratio | P = | 0.209 347
|
| Left balanced inequality ratio | P1 = | 0.099 758 3
|
| Right balanced inequality ratio | P2 = | 0.242 063
|
| Relative edge distribution entropy | Her = | 0.803 865
|
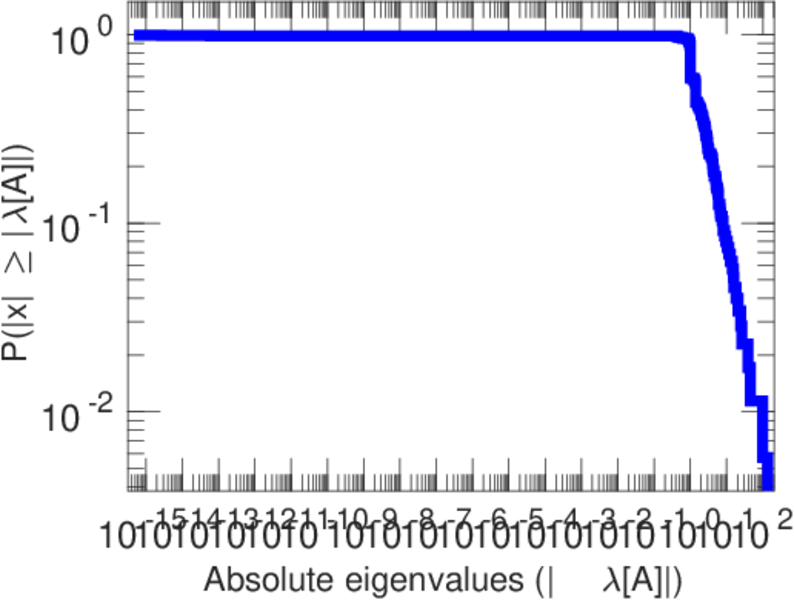
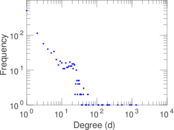
| Power law exponent | γ = | 2.274 80
|
| Tail power law exponent | γt = | 1.811 00
|
| Tail power law exponent with p | γ3 = | 1.811 00
|
| p-value | p = | 0.000 00
|
| Left tail power law exponent with p | γ3,1 = | 1.651 00
|
| Left p-value | p1 = | 0.644 000
|
| Right tail power law exponent with p | γ3,2 = | 8.991 00
|
| Right p-value | p2 = | 0.069 000 0
|
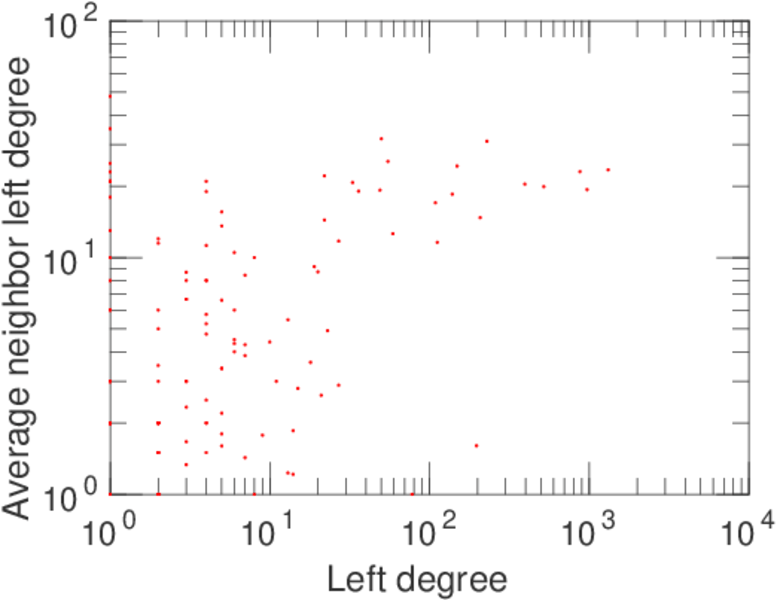
| Degree assortativity | ρ = | +0.283 060
|
| Degree assortativity p-value | pρ = | 6.564 74 × 10−54
|
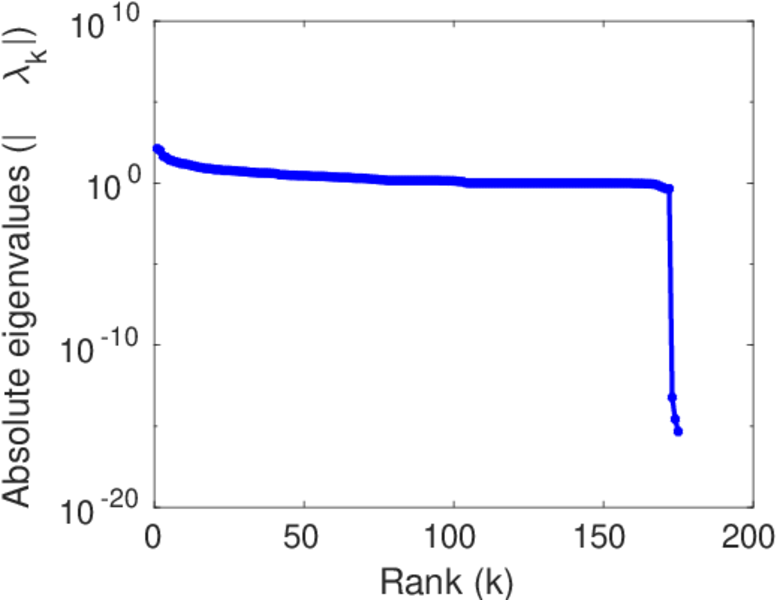
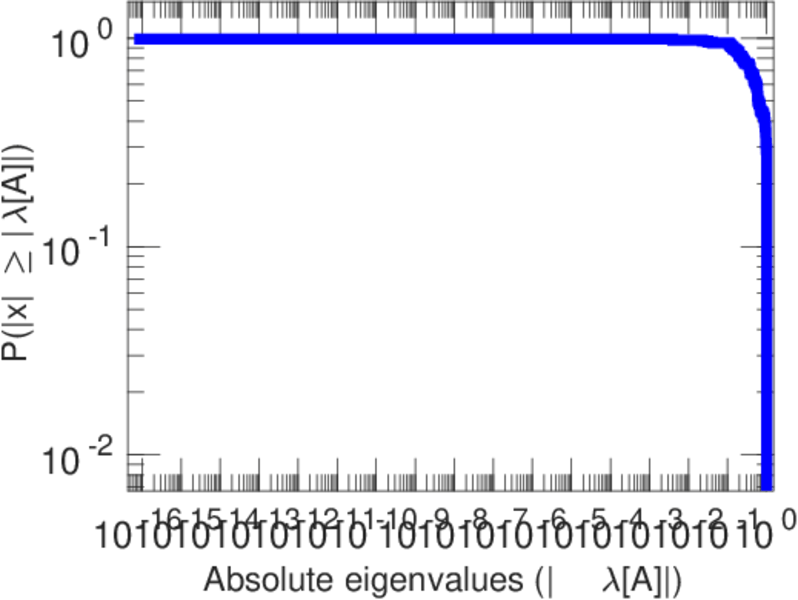
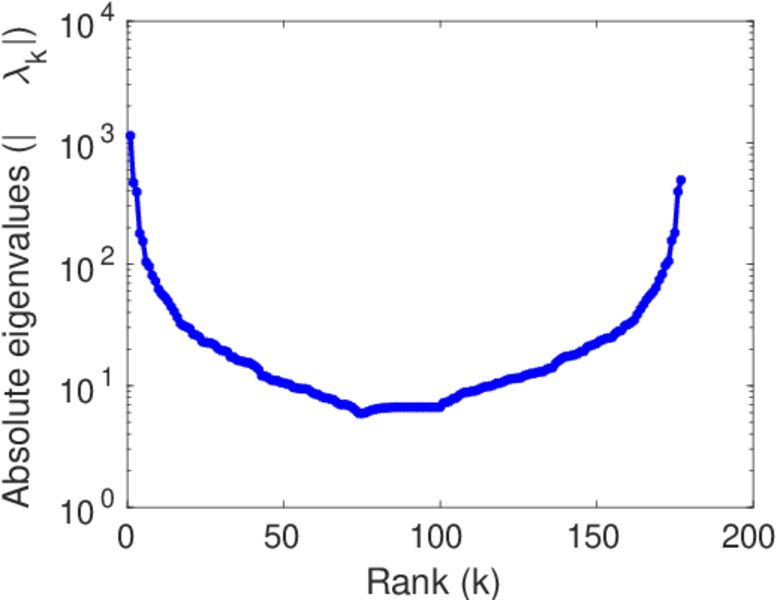
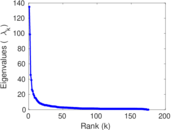
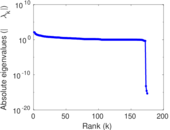
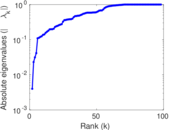
| Spectral norm | α = | 134.889
|
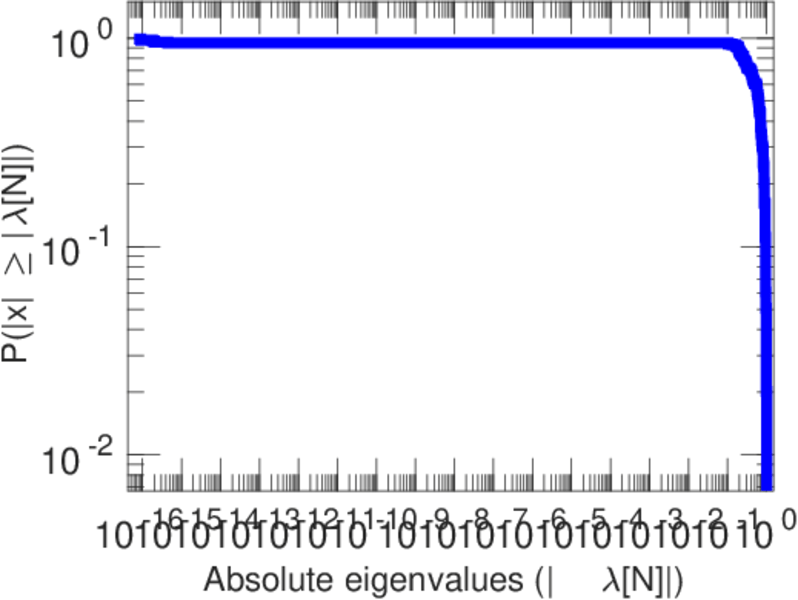
| Algebraic connectivity | a = | 0.003 996 42
|
| Spectral separation | |λ1[A] / λ2[A]| = | 1.367 03
|
| Controllability | C = | 759
|
| Relative controllability | Cr = | 0.688 123
|
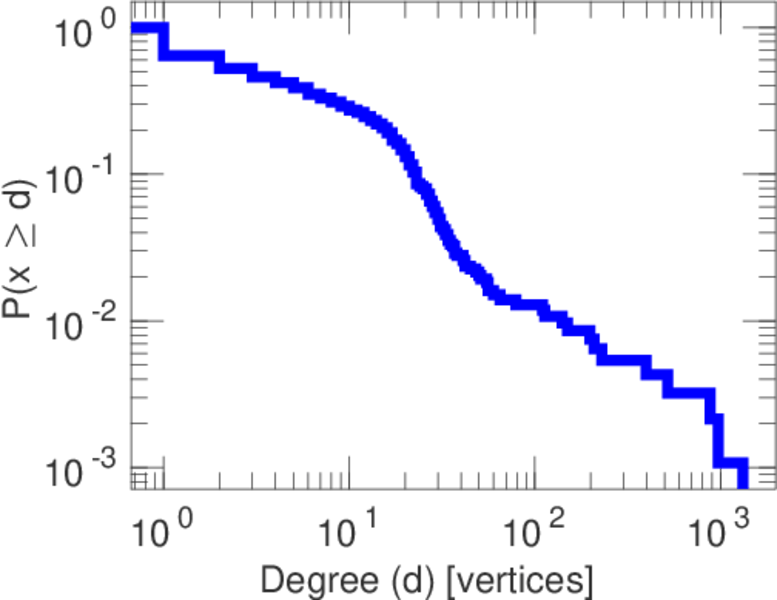
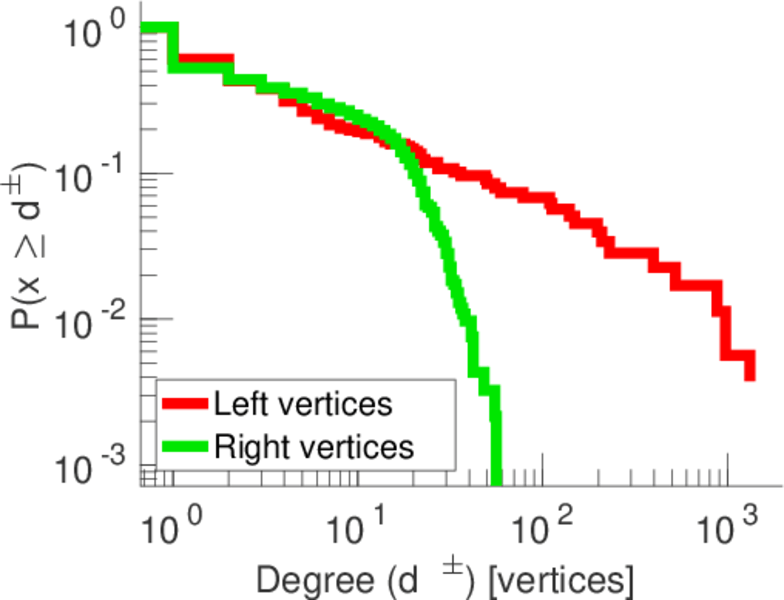
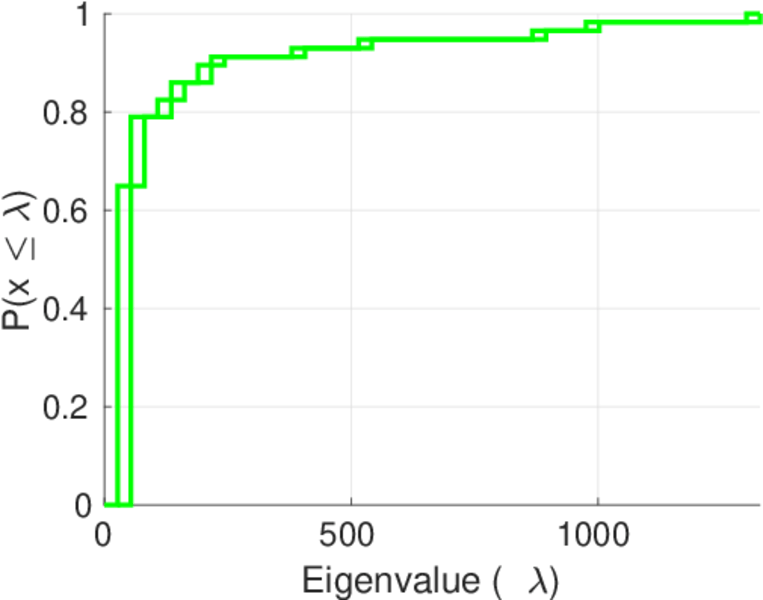
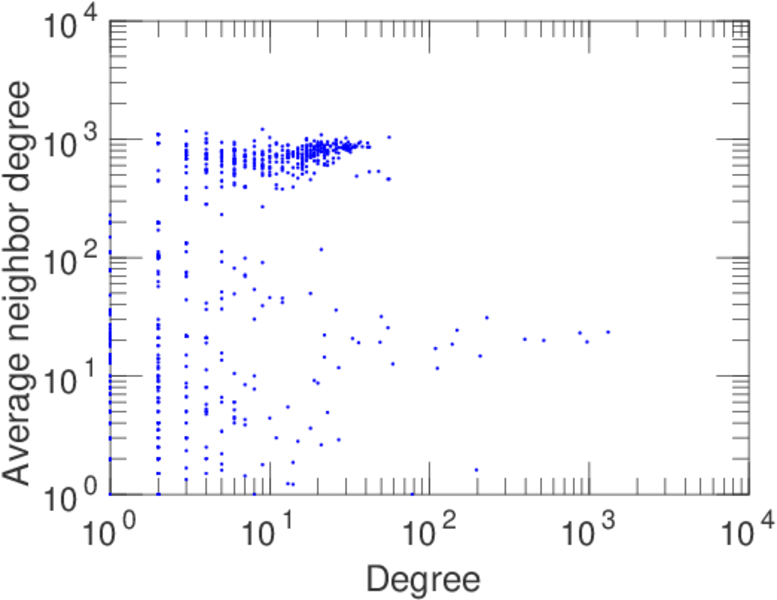
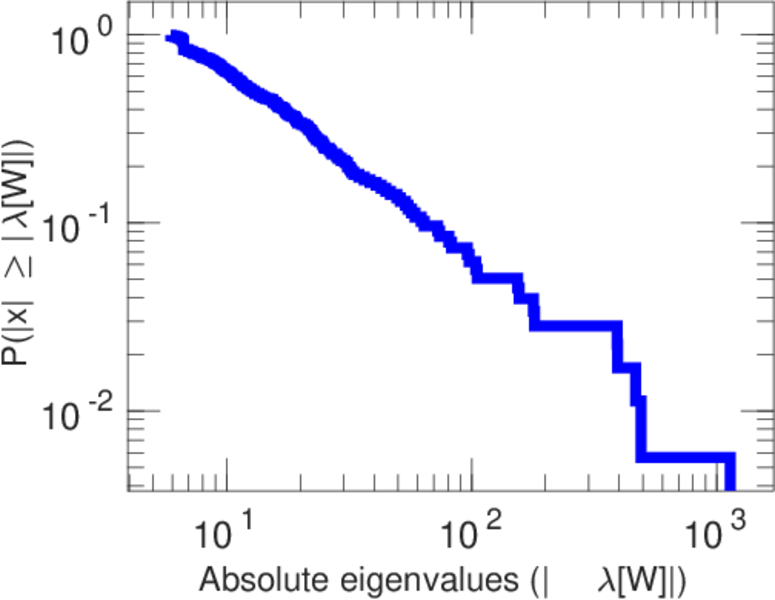
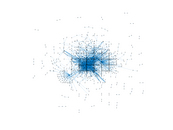
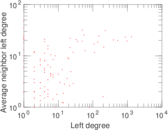
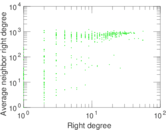
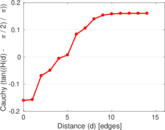
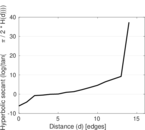
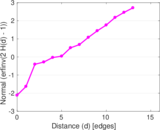
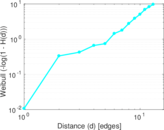
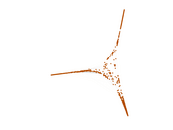
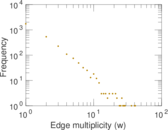
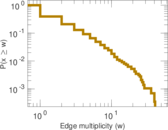
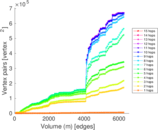
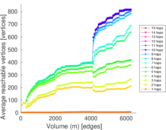
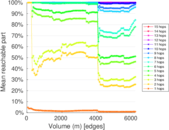
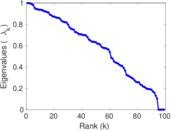
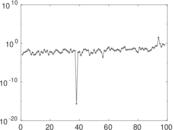
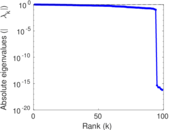
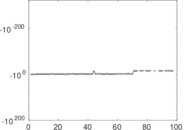
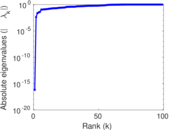
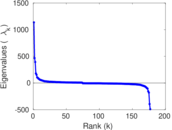
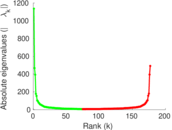
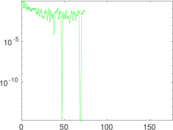
Plots


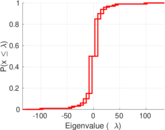
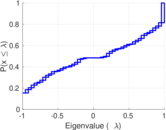


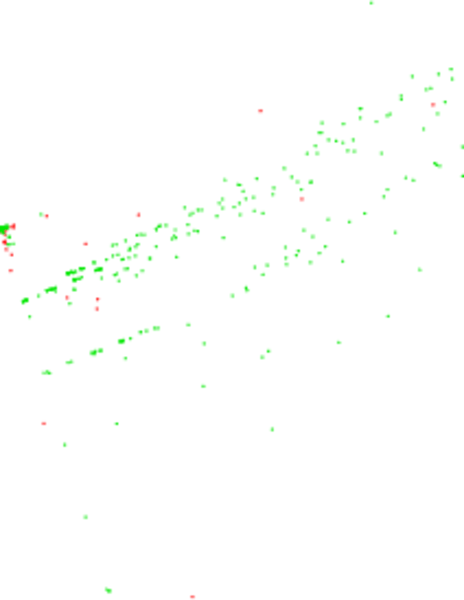
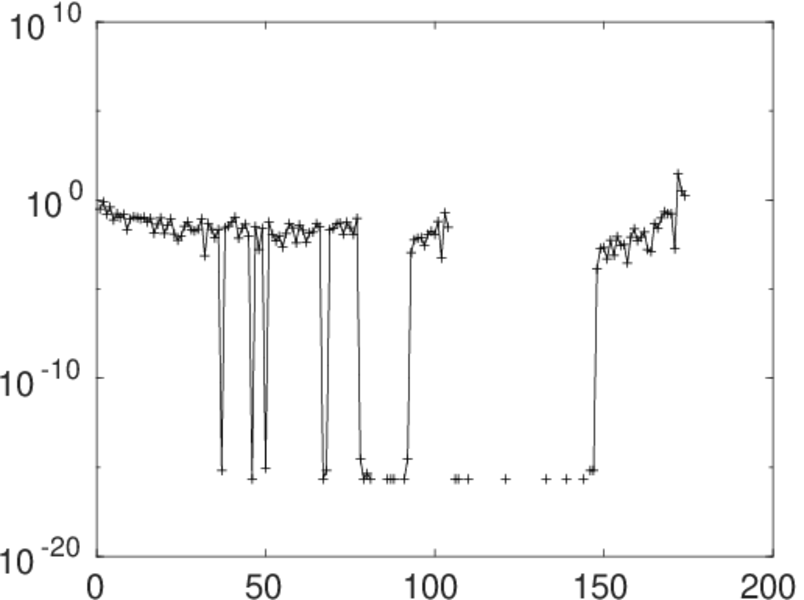
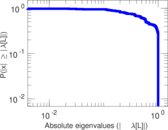
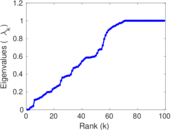
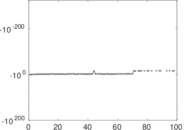
Matrix decompositions plots


Downloads
References
|
[1]
|
Jérôme Kunegis.
KONECT – The Koblenz Network Collection.
In Proc. Int. Conf. on World Wide Web Companion, pages
1343–1350, 2013.
[ http ]
|
|
[2]
|
Wikimedia Foundation.
Wikimedia downloads.
http://dumps.wikimedia.org/, January 2010.
|
 KONECT ‣ Networks ‣
Buy Me a Coffee
KONECT ‣ Networks ‣
Buy Me a Coffee