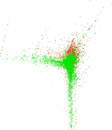
Wikipedia edits (or)
This is the bipartite edit network of the Odia Wikipedia. It contains users and
pages from the Odia Wikipedia, connected by edit events. Each edge represents
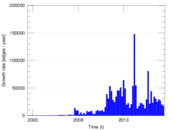
an edit. The dataset includes the timestamp of each edit.
Metadata
Statistics
| Size | n = | 59,154
|
| Left size | n1 = | 3,116
|
| Right size | n2 = | 56,038
|
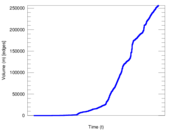
| Volume | m = | 256,511
|
| Unique edge count | m̿ = | 125,787
|
| Wedge count | s = | 385,152,806
|
| Claw count | z = | 1,429,924,083,058
|
| Cross count | x = | 4,618,970,553,888,471
|
| Square count | q = | 79,698,740
|
| 4-Tour count | T4 = | 2,178,520,682
|
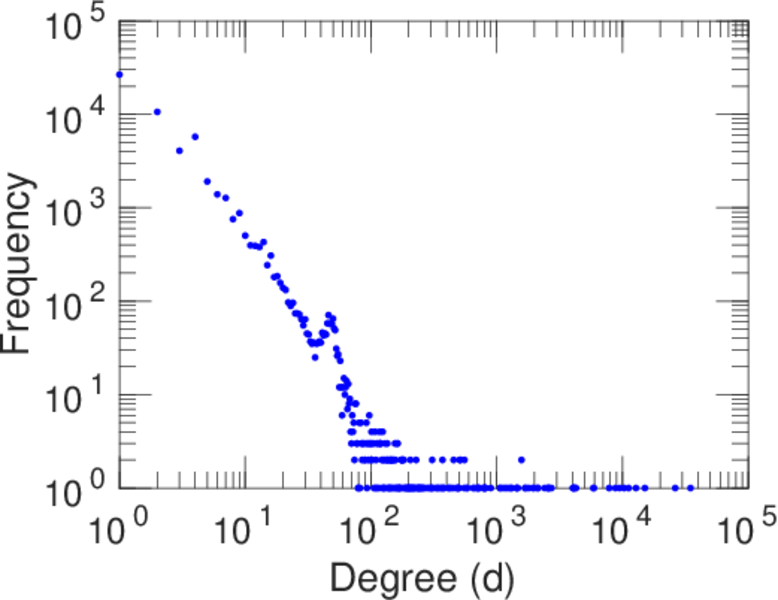
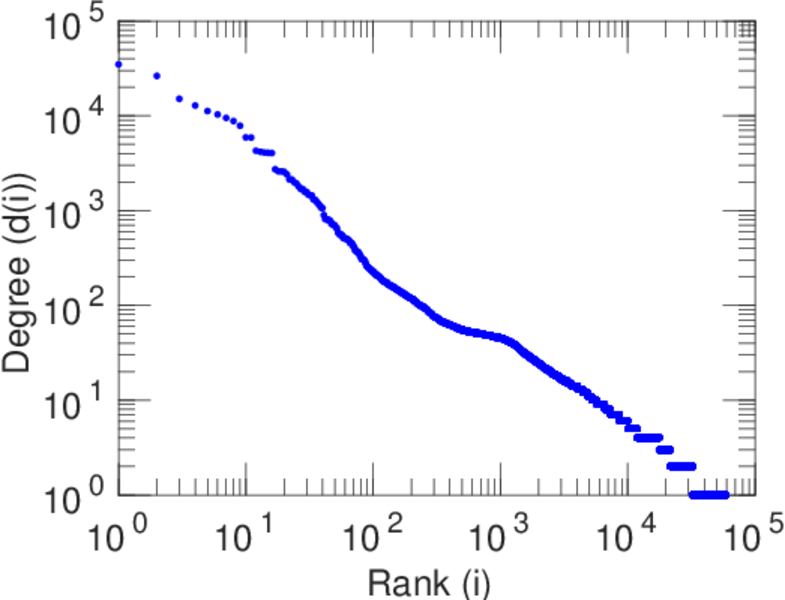
| Maximum degree | dmax = | 34,842
|
| Maximum left degree | d1max = | 34,842
|
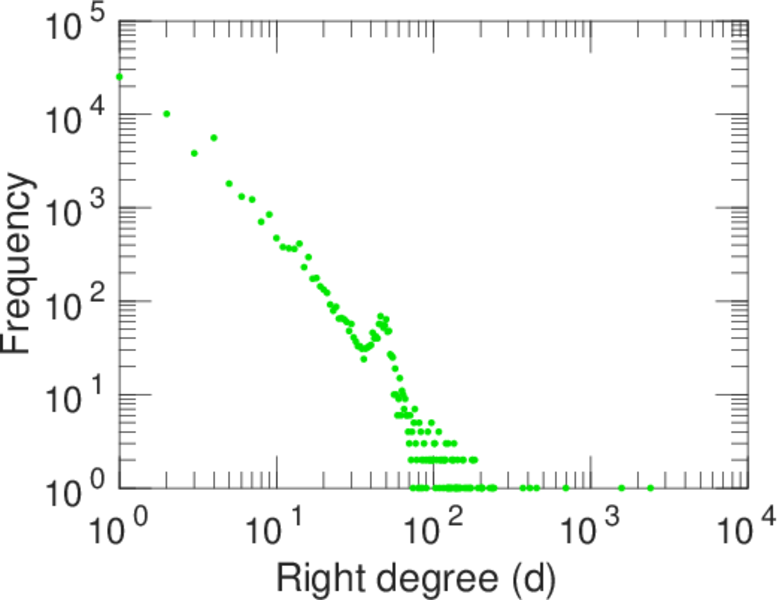
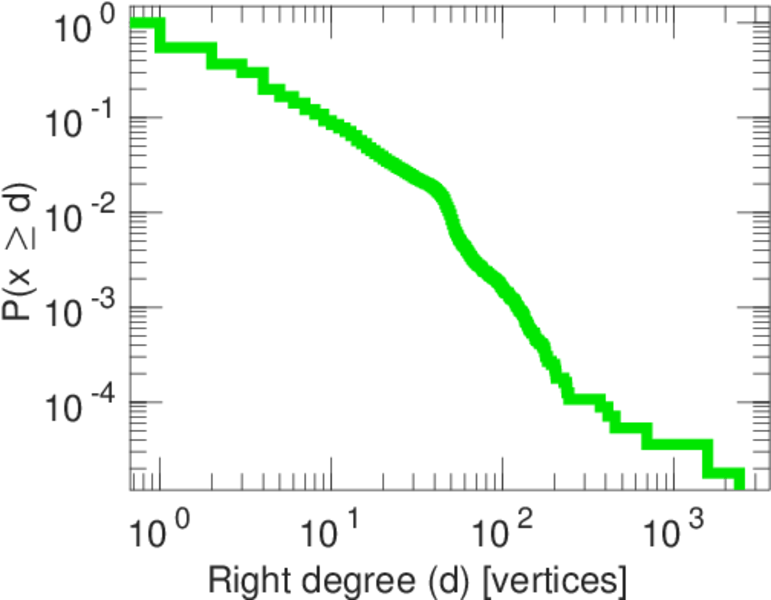
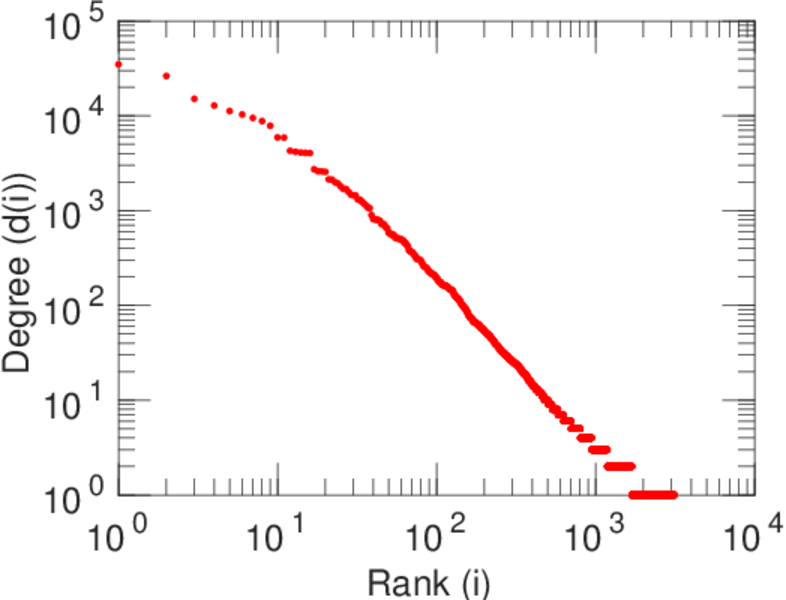
| Maximum right degree | d2max = | 2,409
|
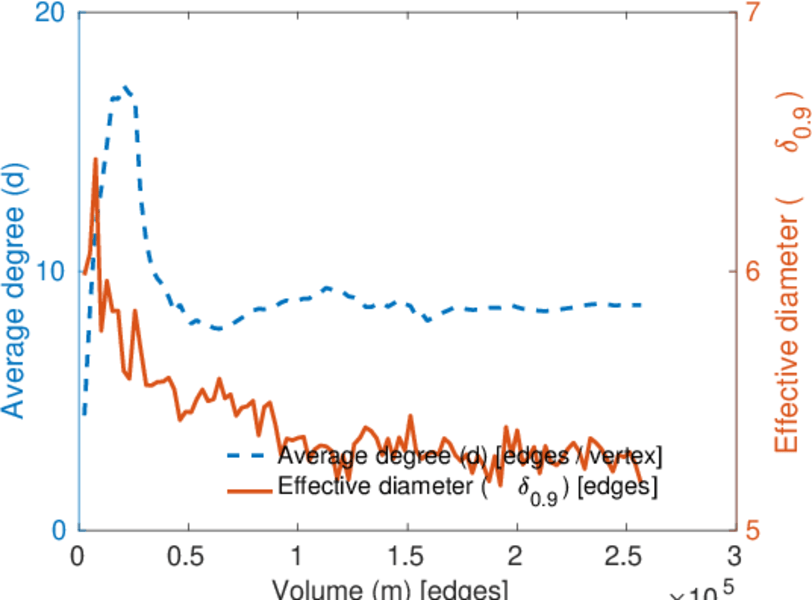
| Average degree | d = | 8.672 65
|
| Average left degree | d1 = | 82.320 6
|
| Average right degree | d2 = | 4.577 45
|
| Fill | p = | 0.000 720 370
|
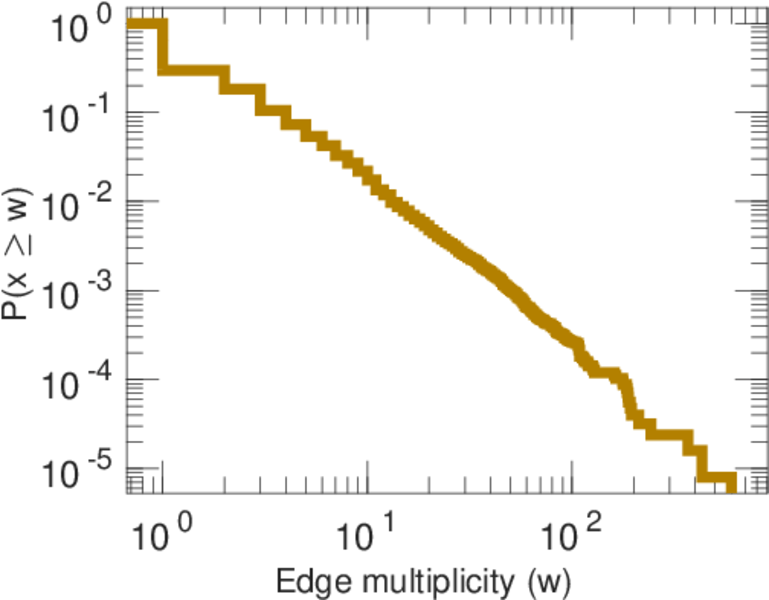
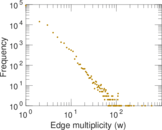
| Average edge multiplicity | m̃ = | 2.039 25
|
| Size of LCC | N = | 58,330
|
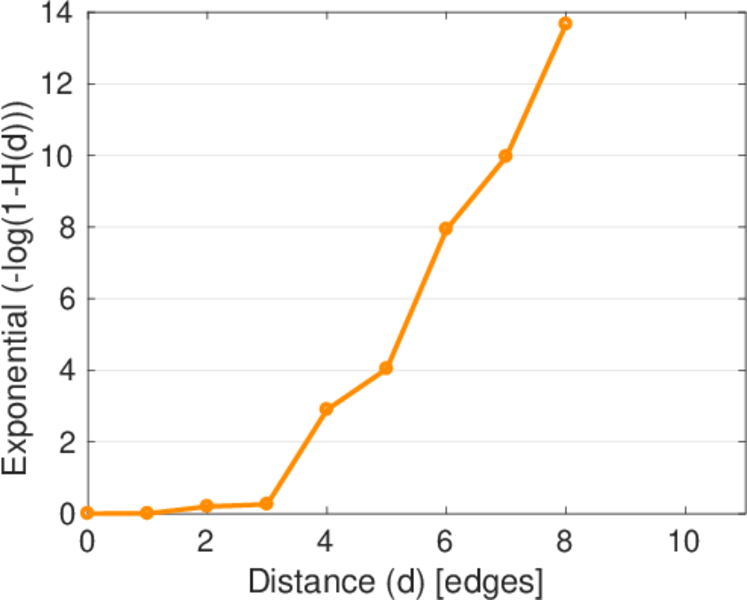
| Diameter | δ = | 10
|
| 50-Percentile effective diameter | δ0.5 = | 3.379 47
|
| 90-Percentile effective diameter | δ0.9 = | 3.937 25
|
| Median distance | δM = | 4
|
| Mean distance | δm = | 3.666 47
|
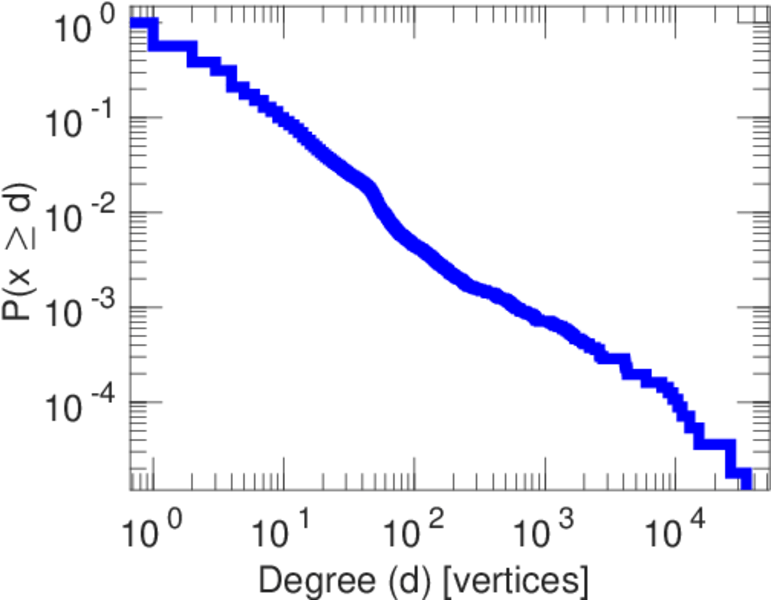
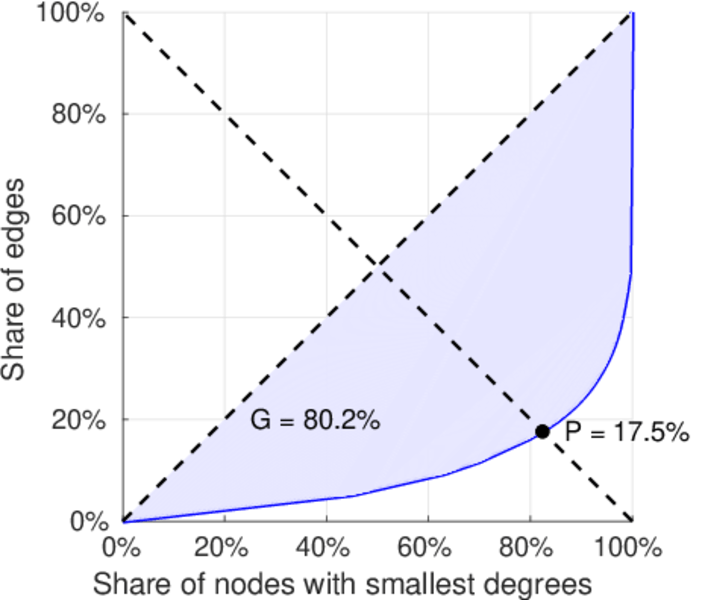
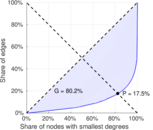
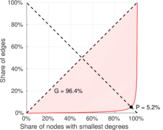
| Gini coefficient | G = | 0.806 722
|
| Balanced inequality ratio | P = | 0.174 429
|
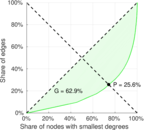
| Left balanced inequality ratio | P1 = | 0.051 736 6
|
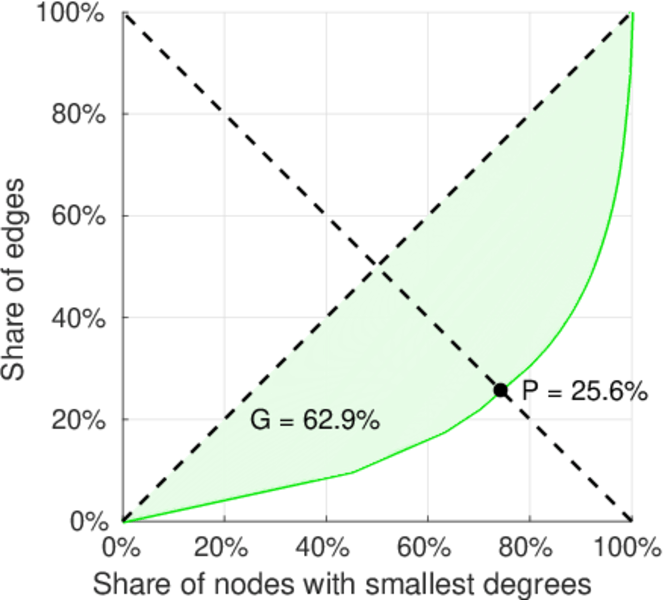
| Right balanced inequality ratio | P2 = | 0.256 094
|
| Relative edge distribution entropy | Her = | 0.726 704
|
| Power law exponent | γ = | 2.934 36
|
| Tail power law exponent | γt = | 2.631 00
|
| Tail power law exponent with p | γ3 = | 2.631 00
|
| p-value | p = | 0.000 00
|
| Left tail power law exponent with p | γ3,1 = | 1.591 00
|
| Left p-value | p1 = | 0.022 000 0
|
| Right tail power law exponent with p | γ3,2 = | 2.741 00
|
| Right p-value | p2 = | 0.000 00
|
| Degree assortativity | ρ = | −0.249 620
|
| Degree assortativity p-value | pρ = | 0.000 00
|
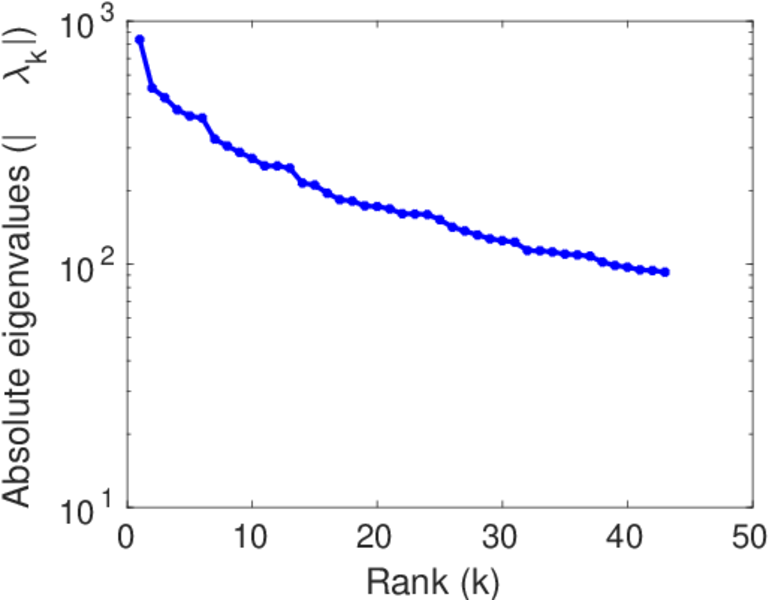
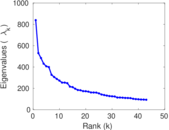
| Spectral norm | α = | 838.874
|
| Algebraic connectivity | a = | 0.039 667 9
|
| Spectral separation | |λ1[A] / λ2[A]| = | 1.583 01
|
| Controllability | C = | 54,201
|
| Relative controllability | Cr = | 0.918 770
|
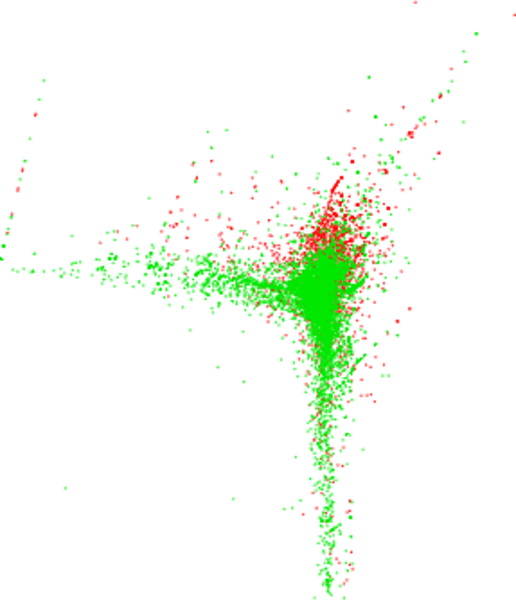
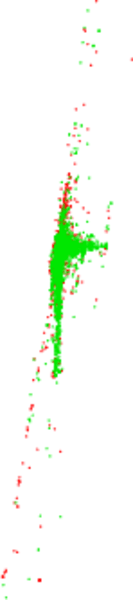
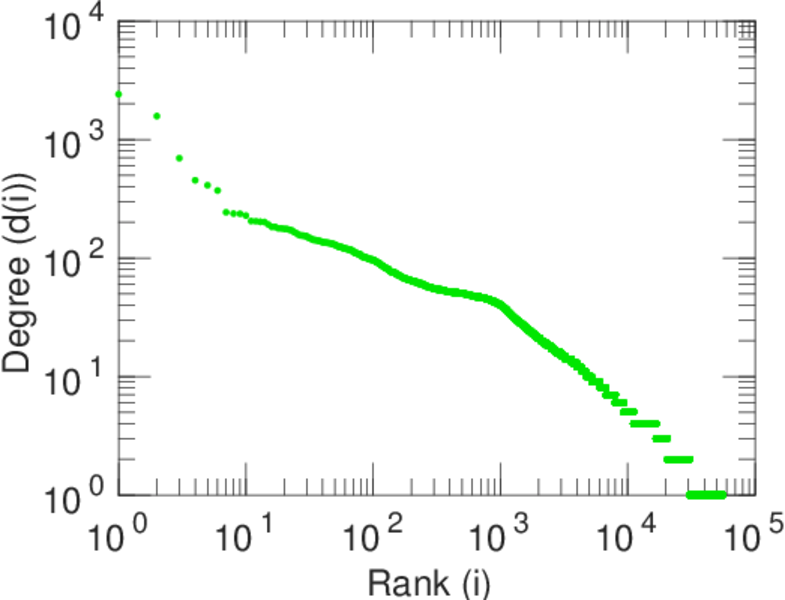
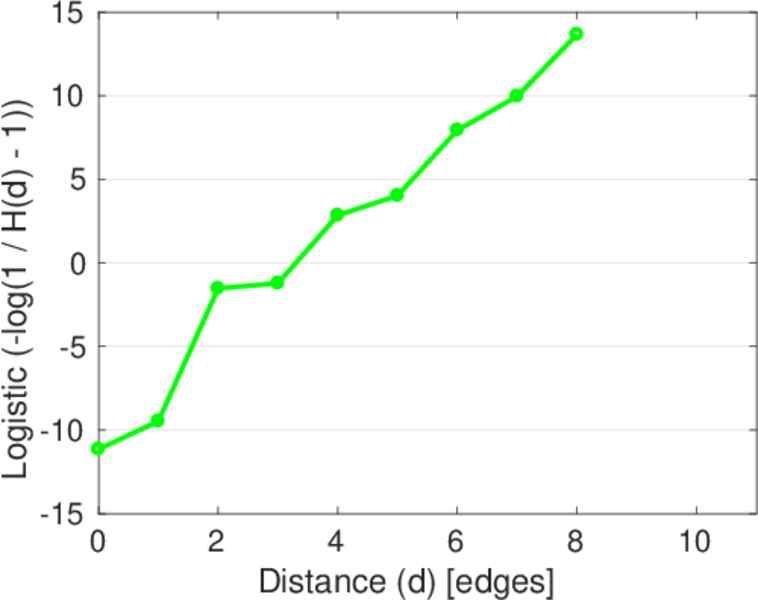
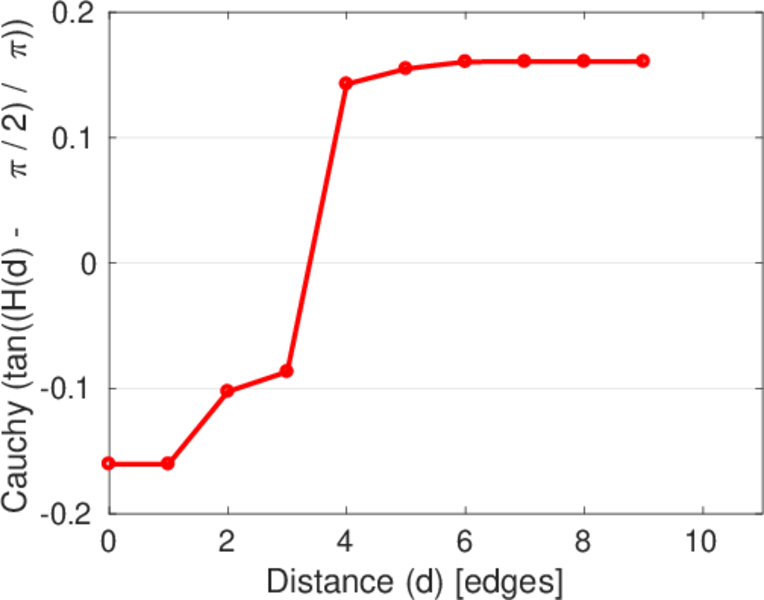
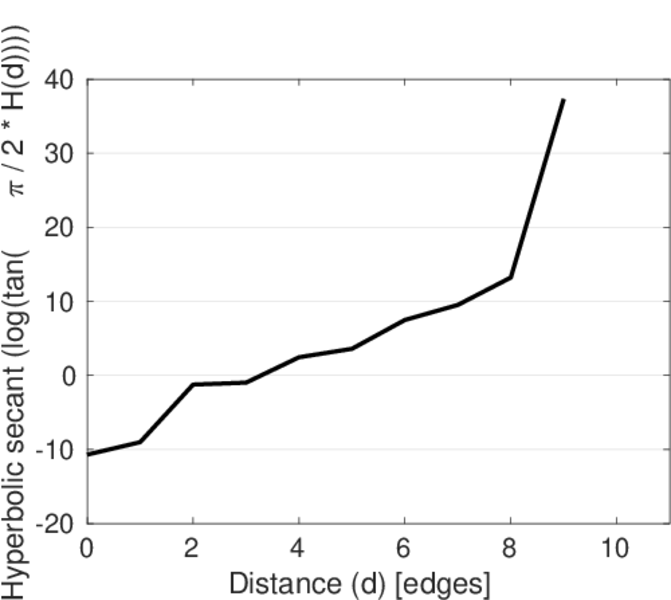
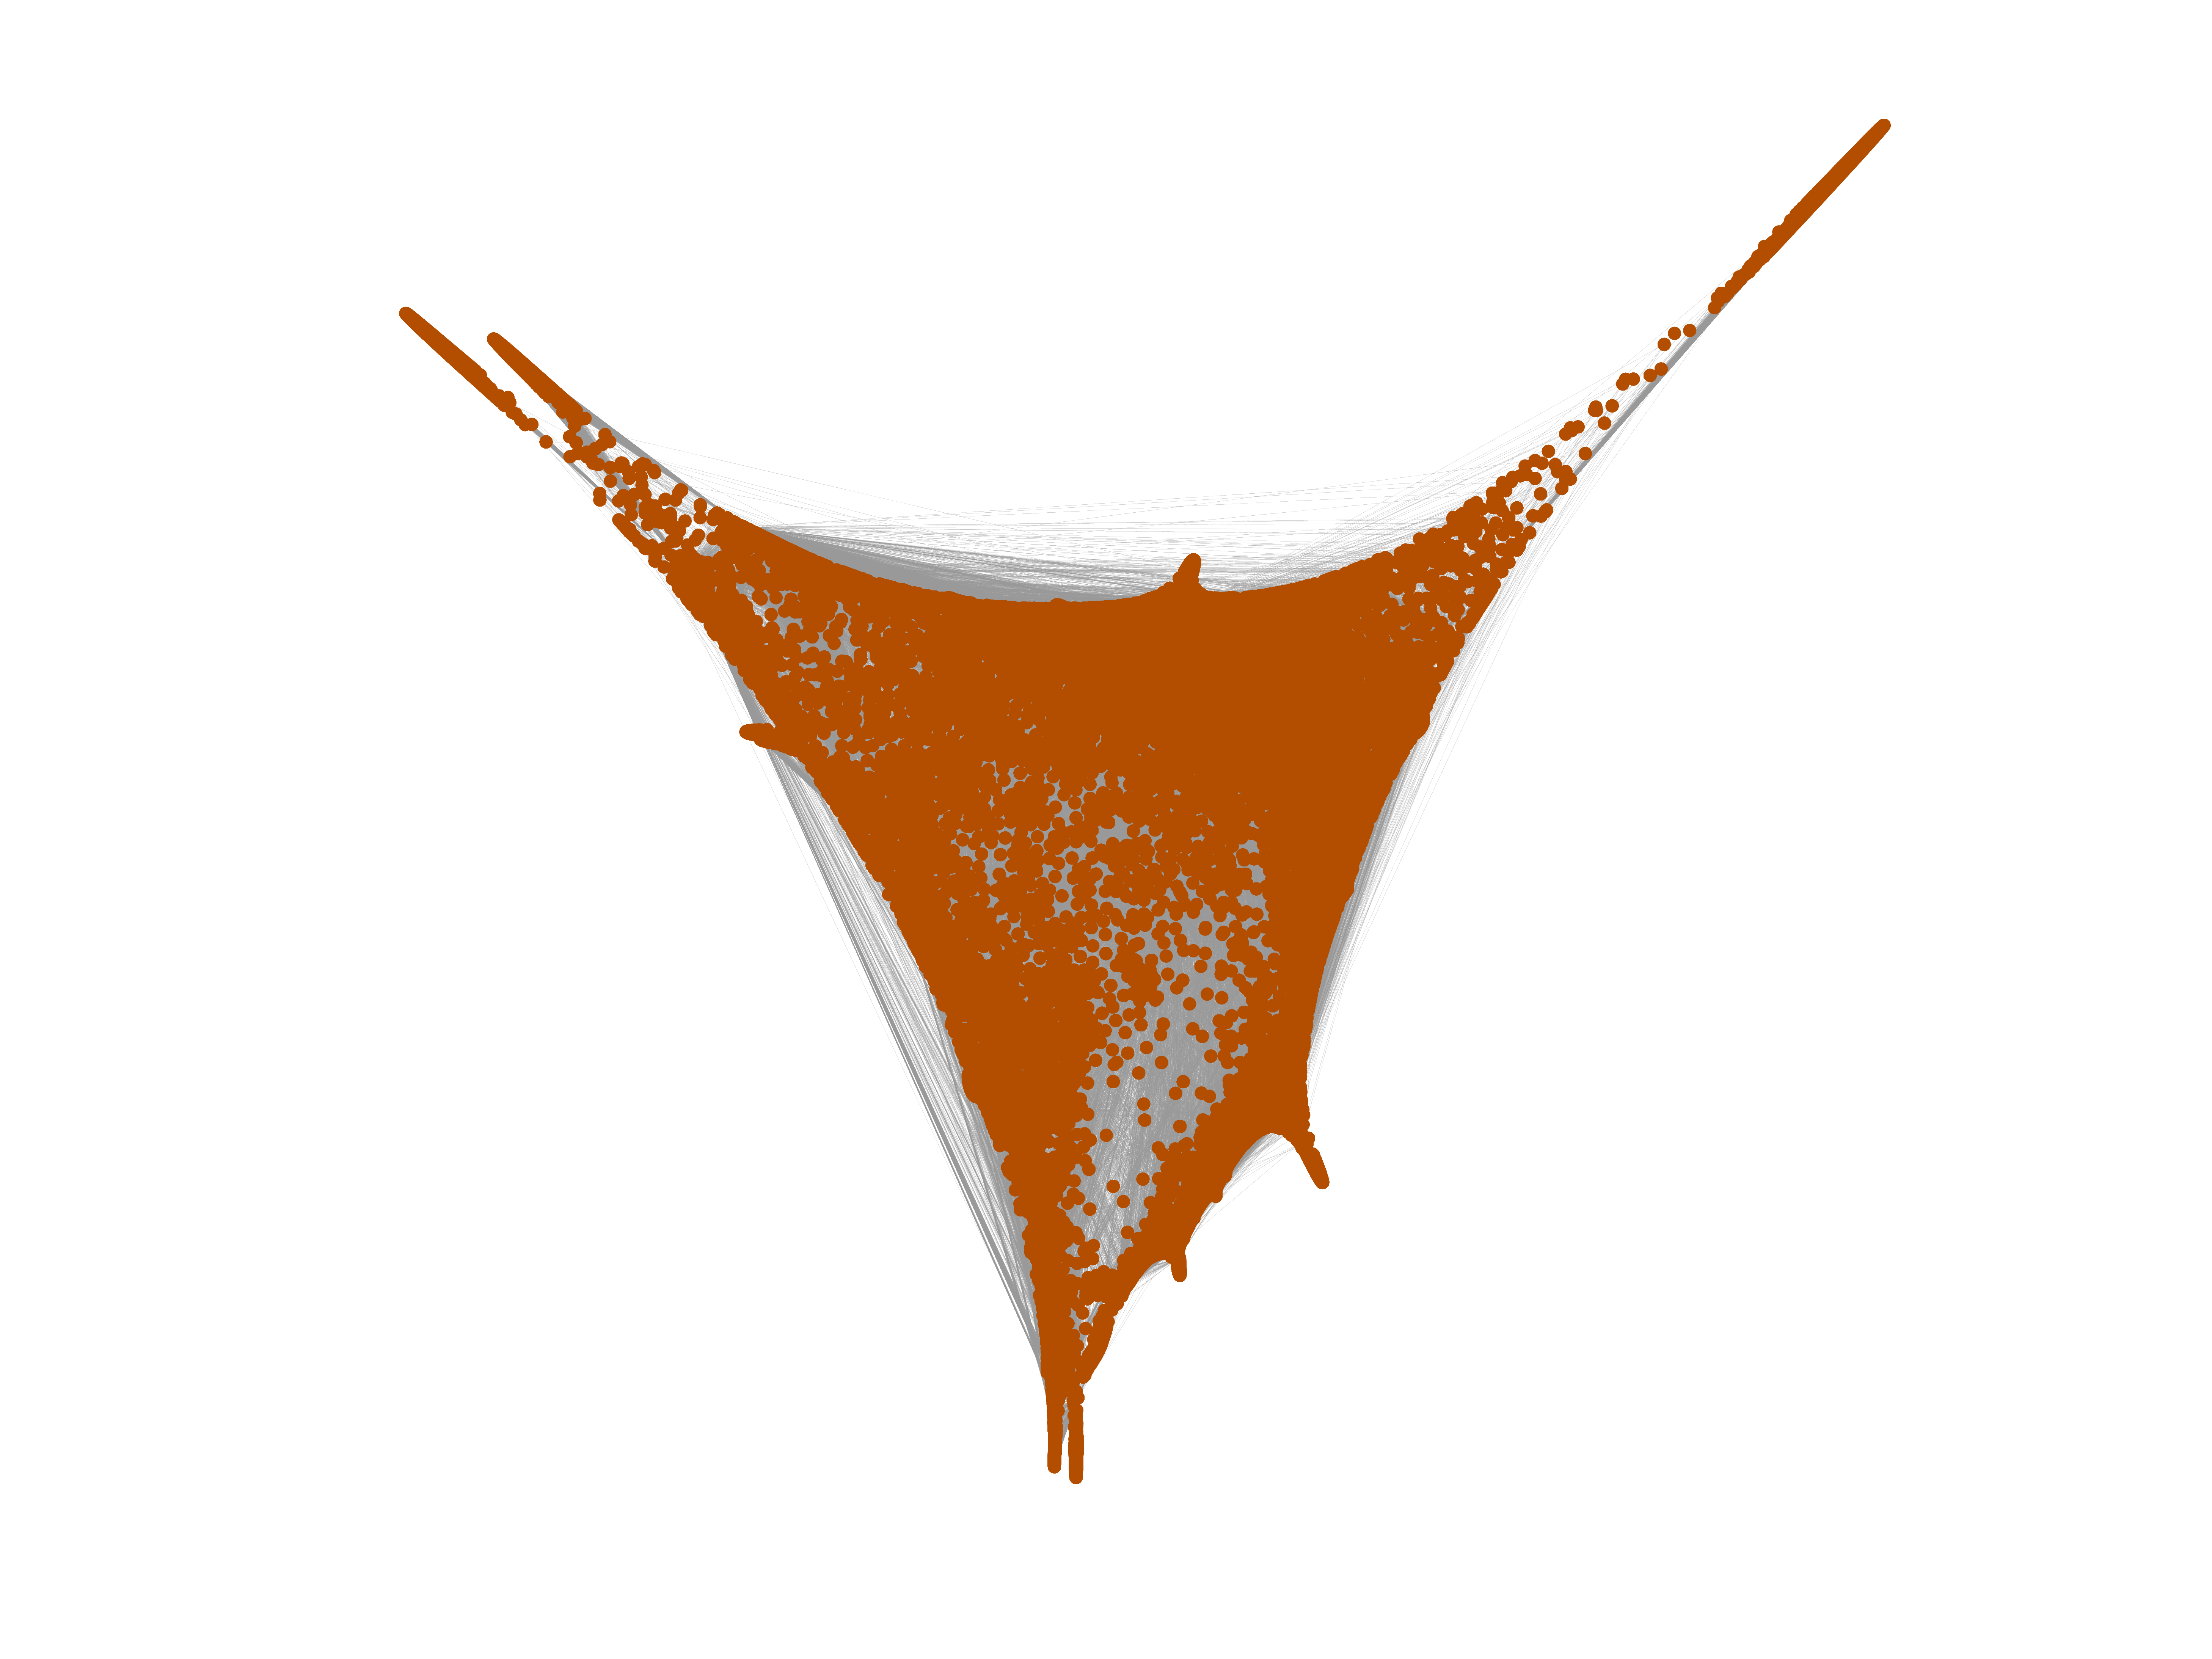
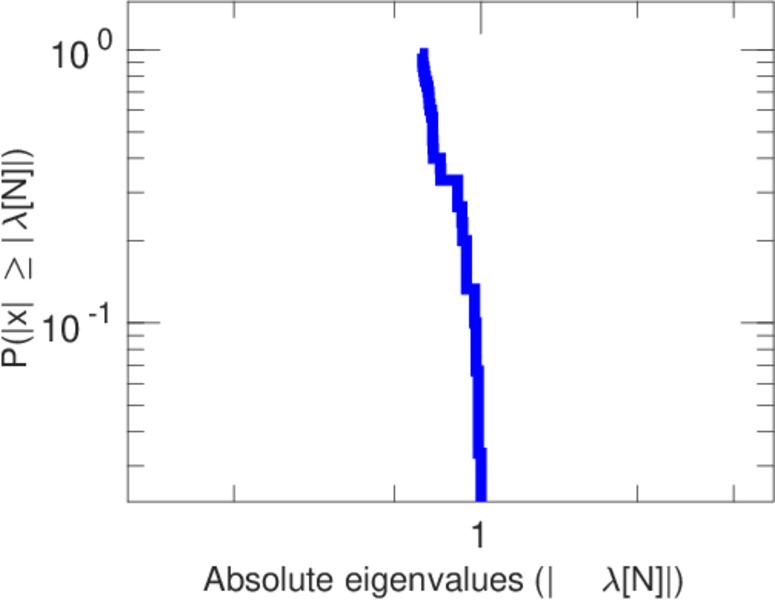
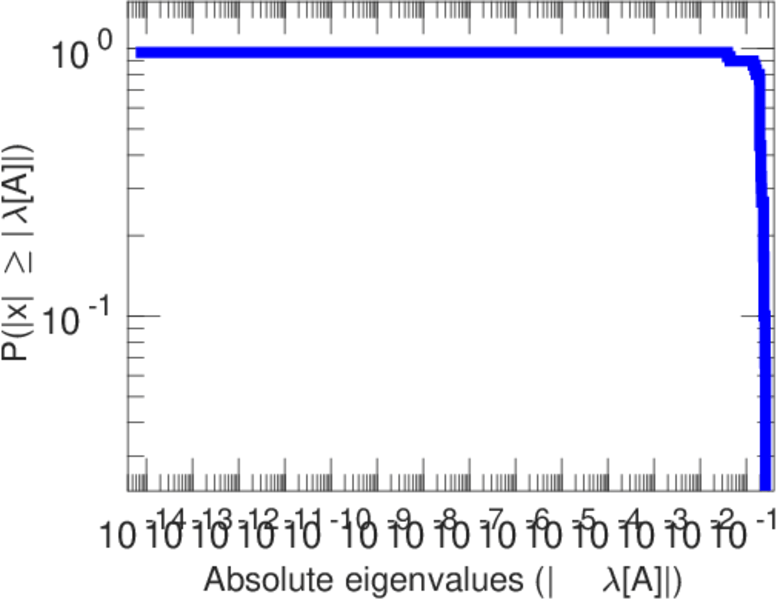
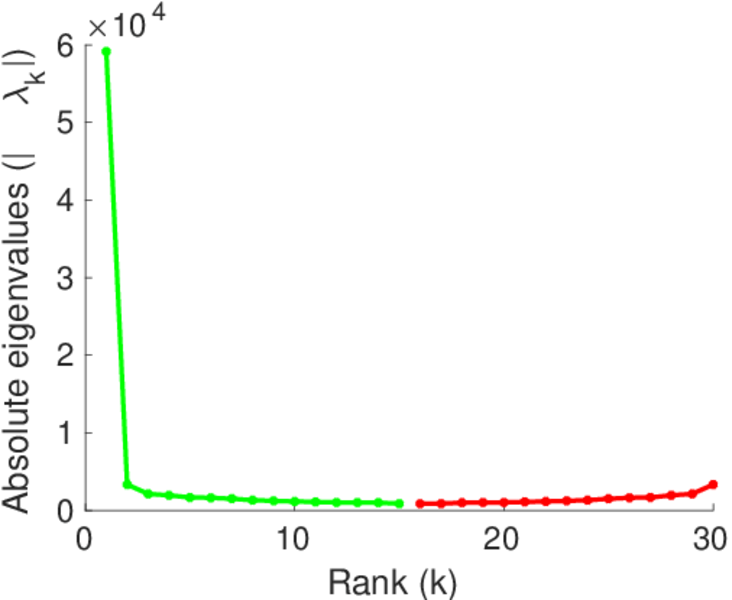
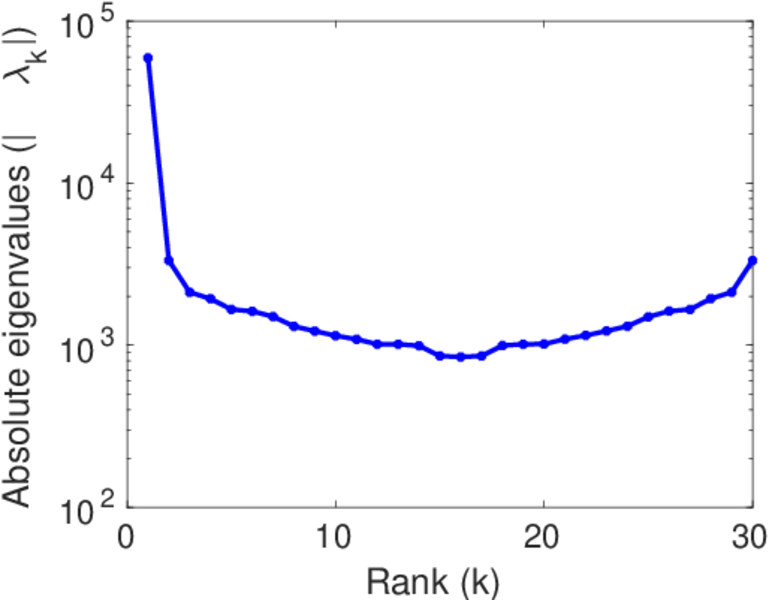
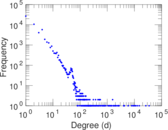
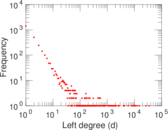
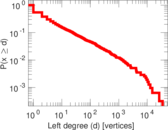
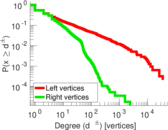
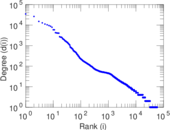
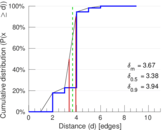
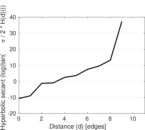
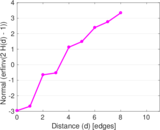
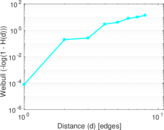
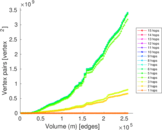
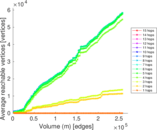
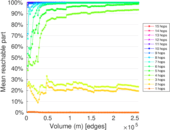
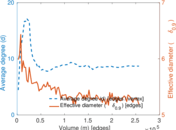
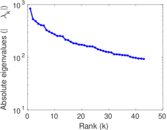
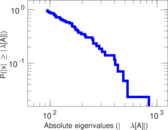
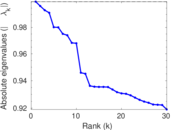
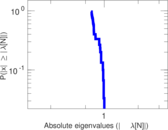
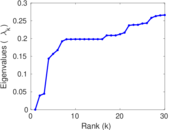
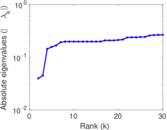
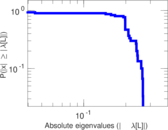
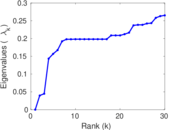
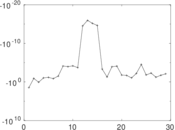
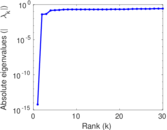
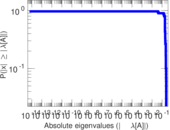
Plots


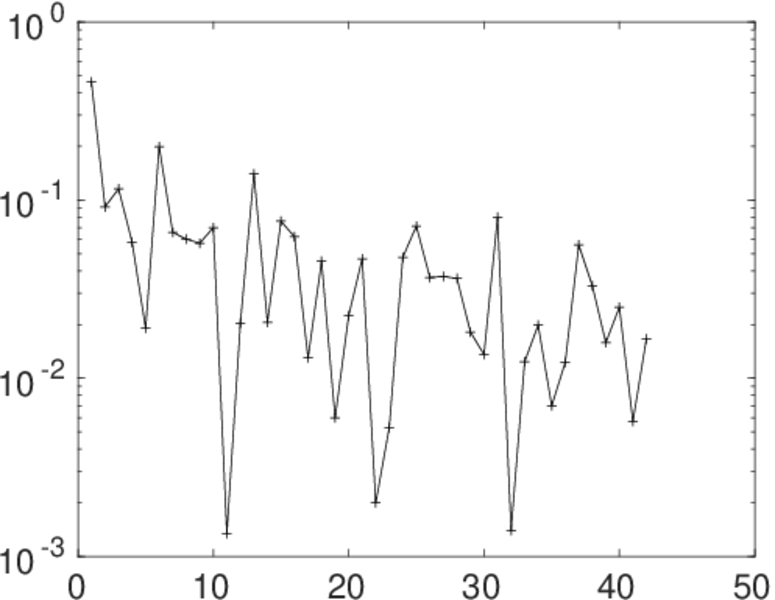
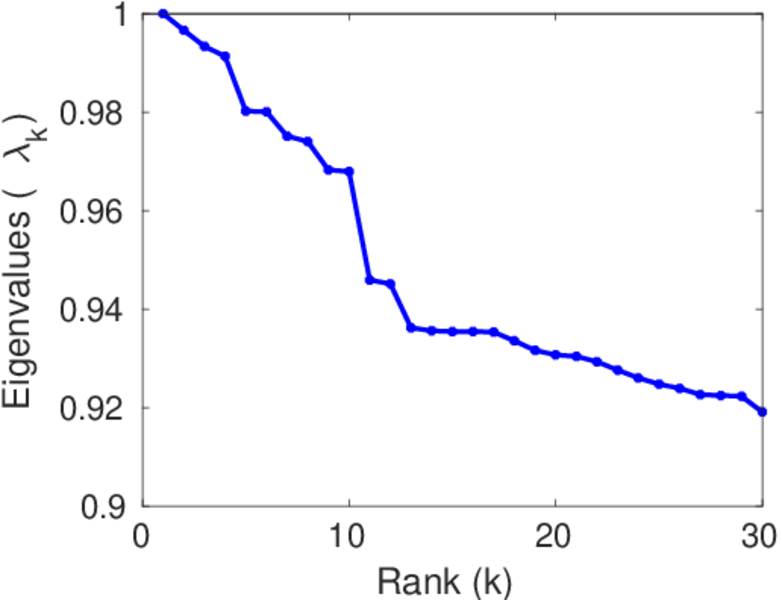
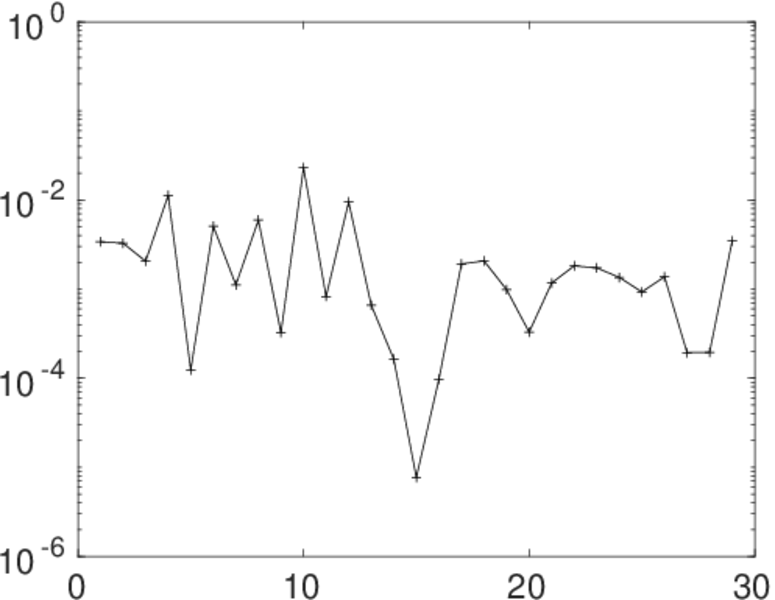
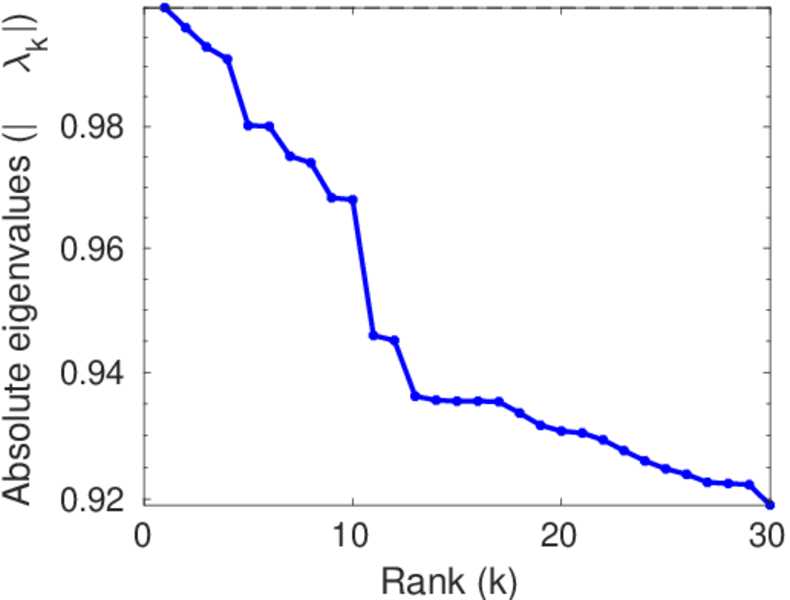
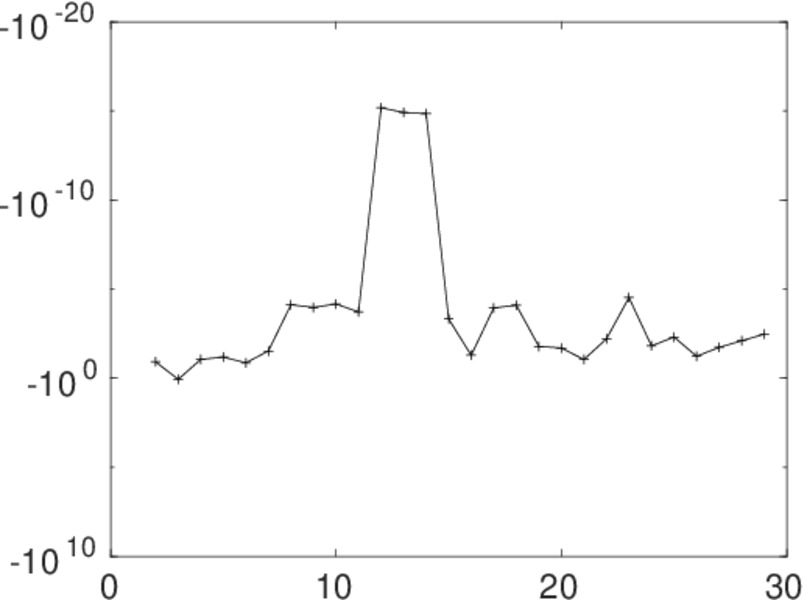
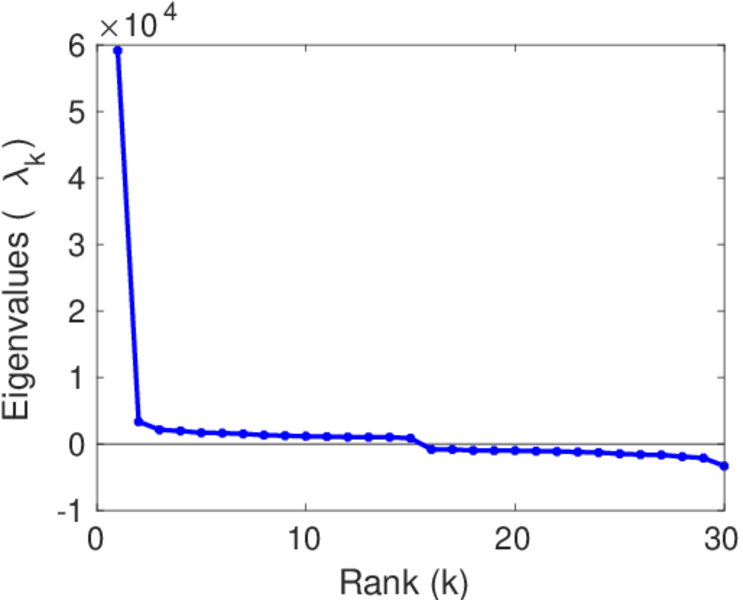
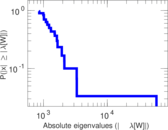
Matrix decompositions plots


Downloads
References
|
[1]
|
Jérôme Kunegis.
KONECT – The Koblenz Network Collection.
In Proc. Int. Conf. on World Wide Web Companion, pages
1343–1350, 2013.
[ http ]
|
|
[2]
|
Wikimedia Foundation.
Wikimedia downloads.
http://dumps.wikimedia.org/, January 2010.
|
 KONECT ‣ Networks ‣
Buy Me a Coffee
KONECT ‣ Networks ‣
Buy Me a Coffee