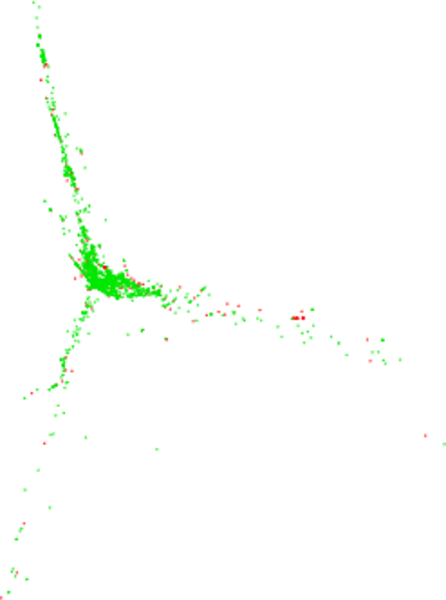
Wikiquote edits (or)
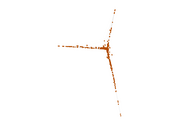
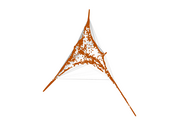
This is the bipartite edit network of the Odia Wikisource. It contains users
and pages from the Odia Wikisource, connected by edit events. Each edge
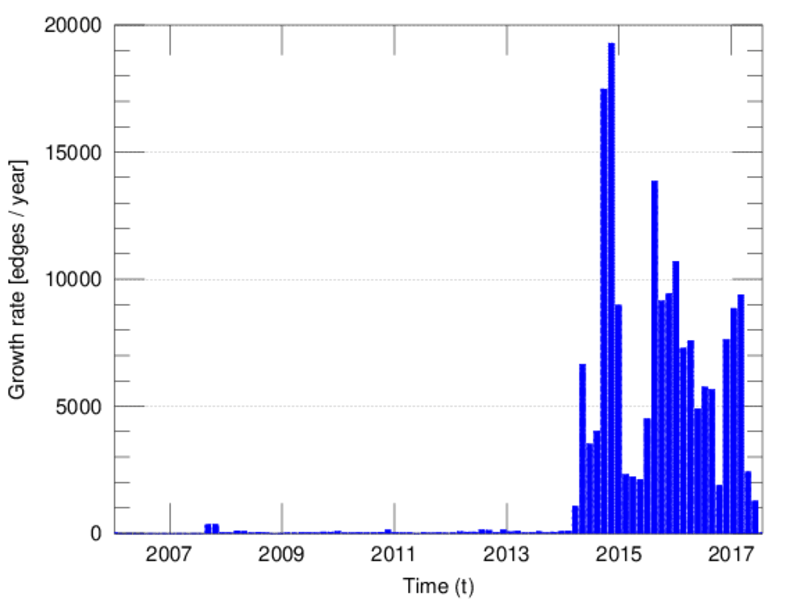
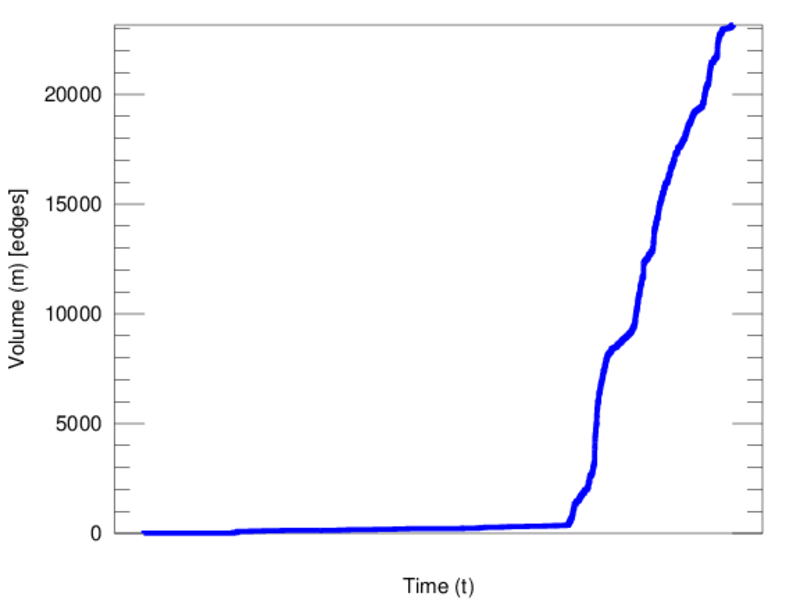
represents an edit. The dataset includes the timestamp of each edit.
Metadata
Statistics
| Size | n = | 9,102
|
| Left size | n1 = | 327
|
| Right size | n2 = | 8,775
|
| Volume | m = | 23,164
|
| Unique edge count | m̿ = | 12,676
|
| Wedge count | s = | 8,519,285
|
| Claw count | z = | 7,600,186,467
|
| Cross count | x = | 6,101,127,936,658
|
| Square count | q = | 389,166
|
| 4-Tour count | T4 = | 37,221,572
|
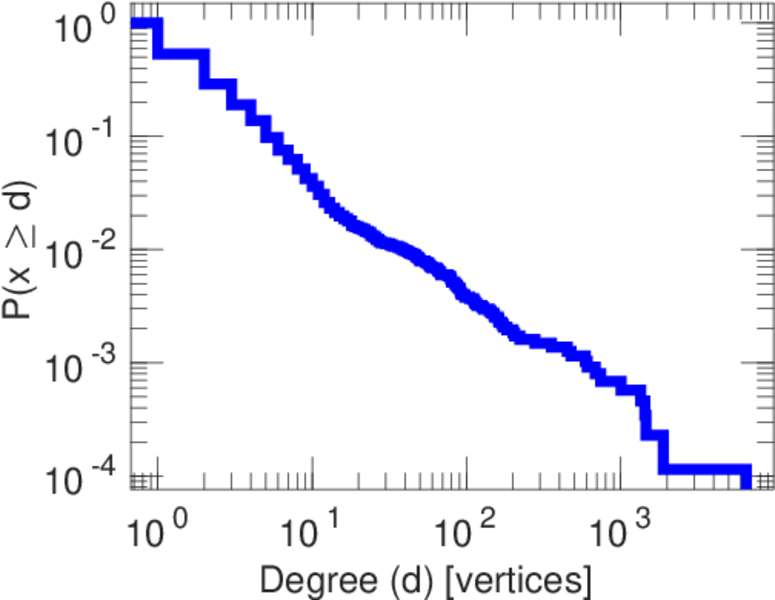
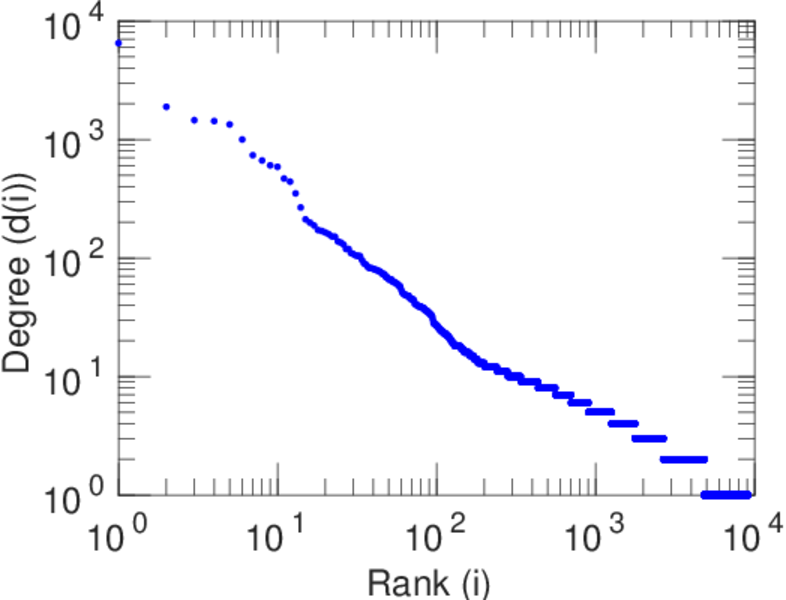
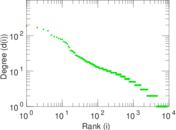
| Maximum degree | dmax = | 6,506
|
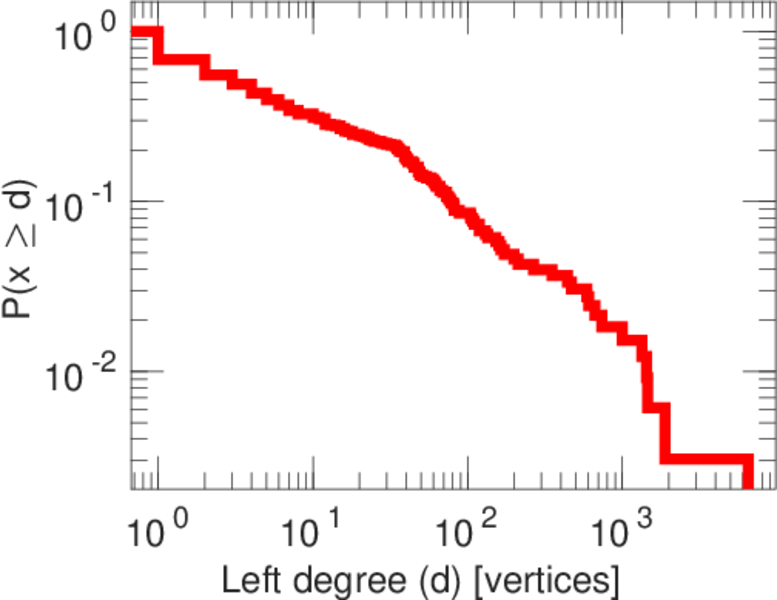
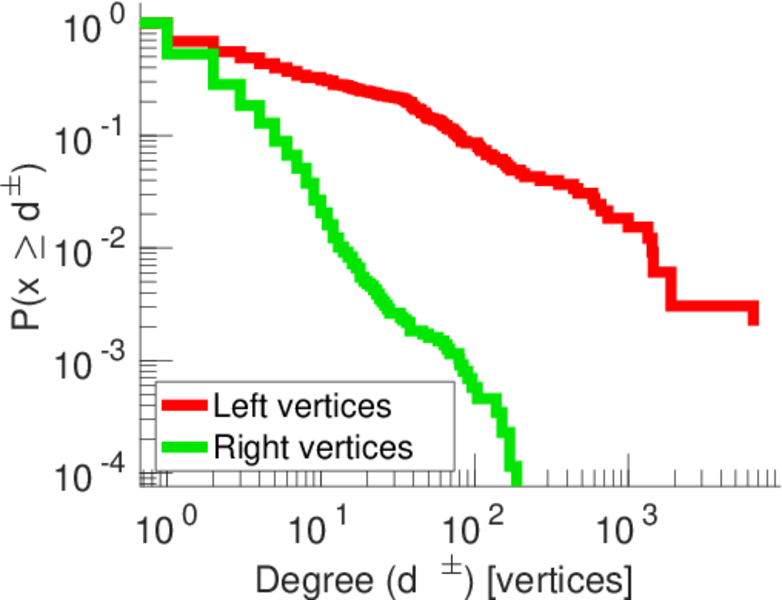
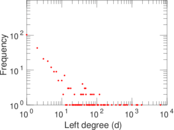
| Maximum left degree | d1max = | 6,506
|
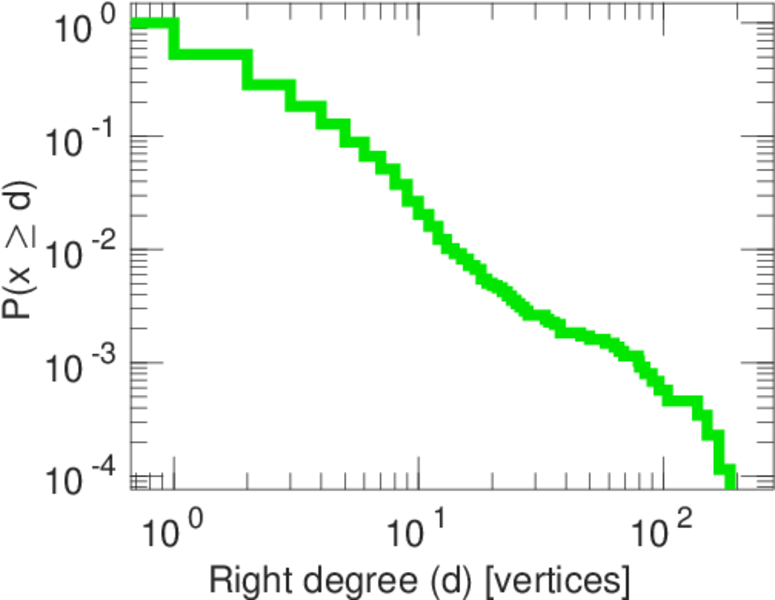
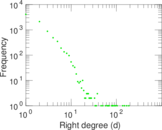
| Maximum right degree | d2max = | 188
|
| Average degree | d = | 5.089 87
|
| Average left degree | d1 = | 70.837 9
|
| Average right degree | d2 = | 2.639 77
|
| Fill | p = | 0.004 417 61
|
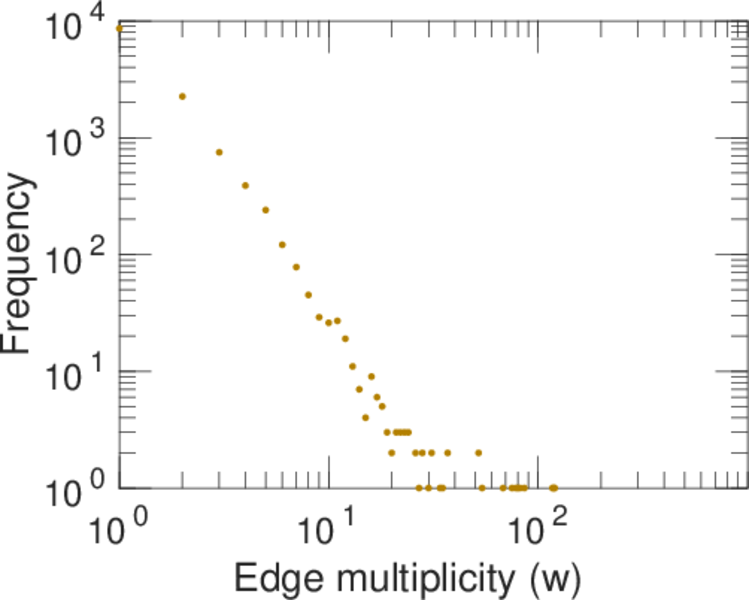
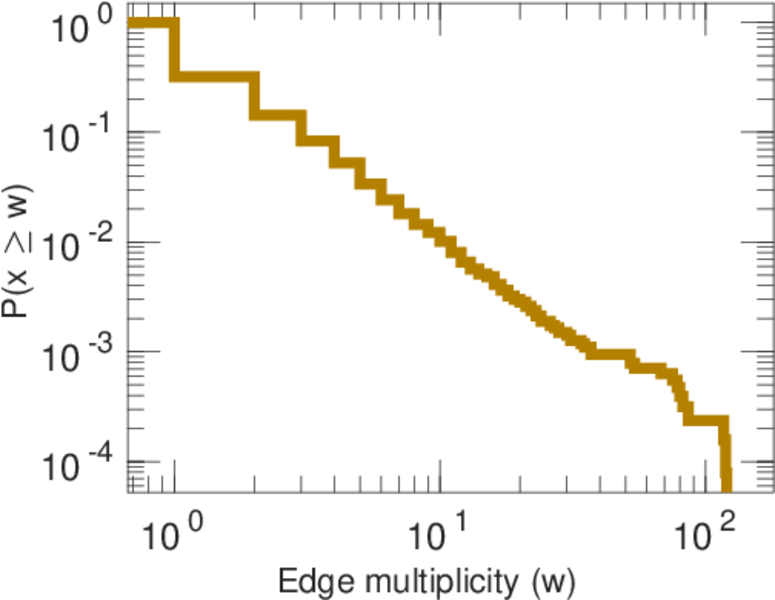
| Average edge multiplicity | m̃ = | 1.827 39
|
| Size of LCC | N = | 8,960
|
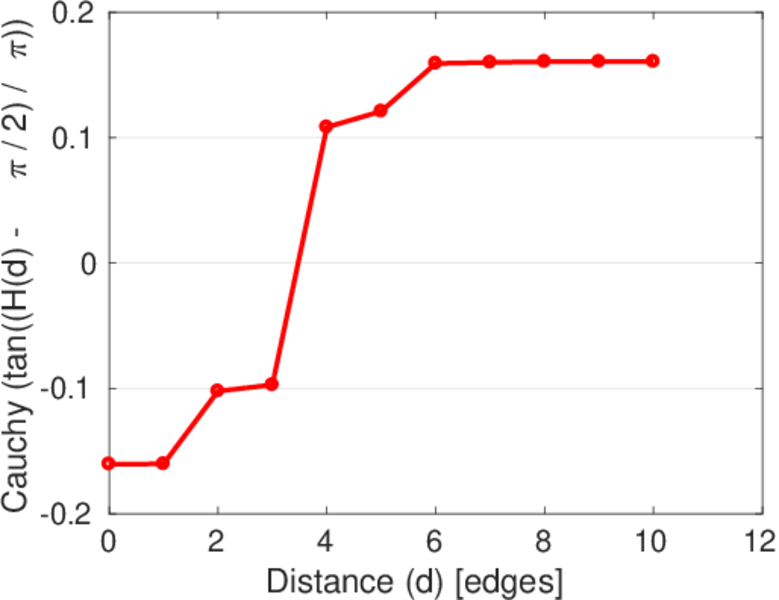
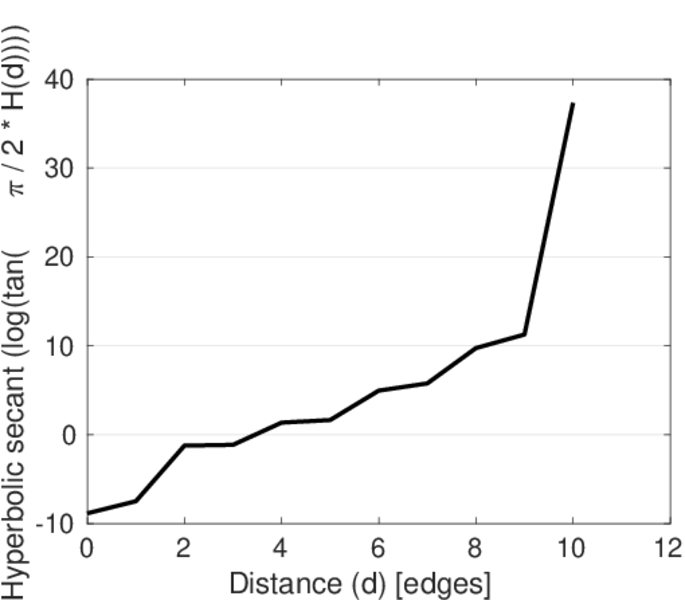
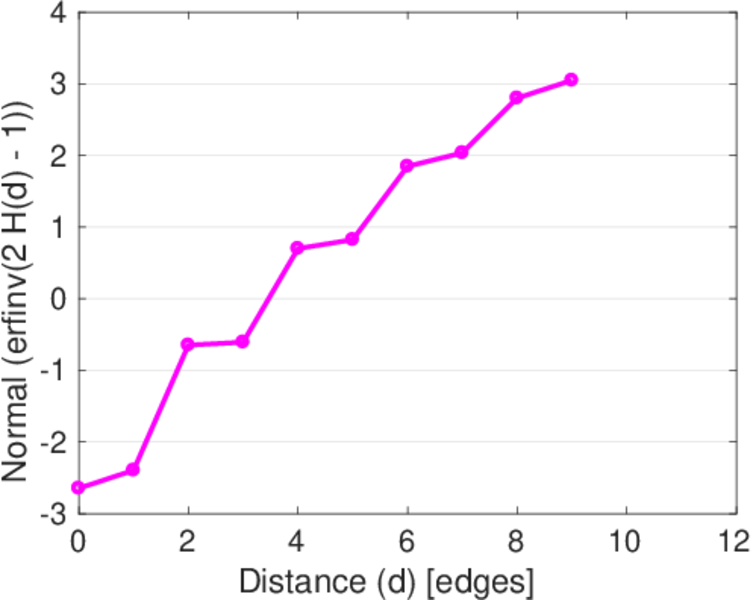
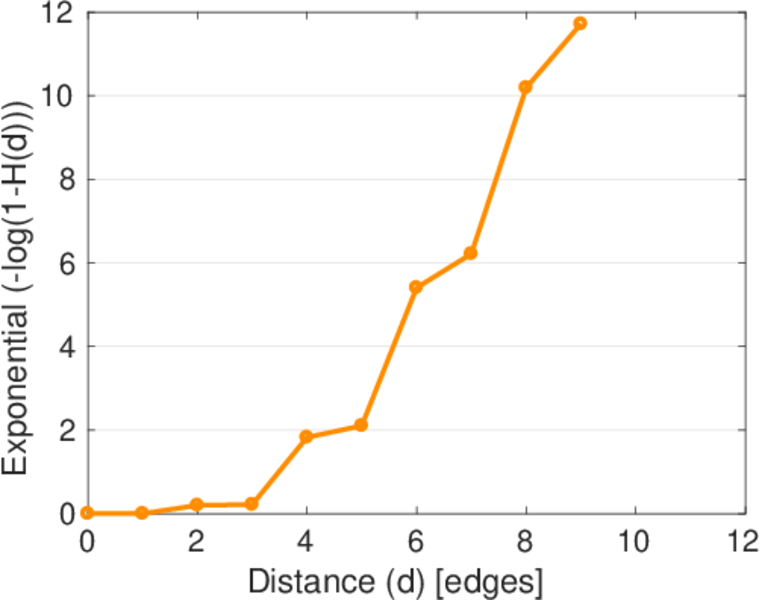
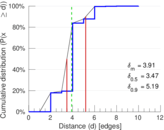
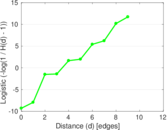
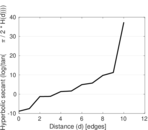
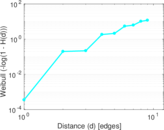
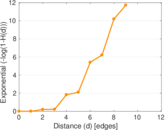
| Diameter | δ = | 10
|
| 50-Percentile effective diameter | δ0.5 = | 3.473 56
|
| 90-Percentile effective diameter | δ0.9 = | 5.188 02
|
| Median distance | δM = | 4
|
| Mean distance | δm = | 3.914 52
|
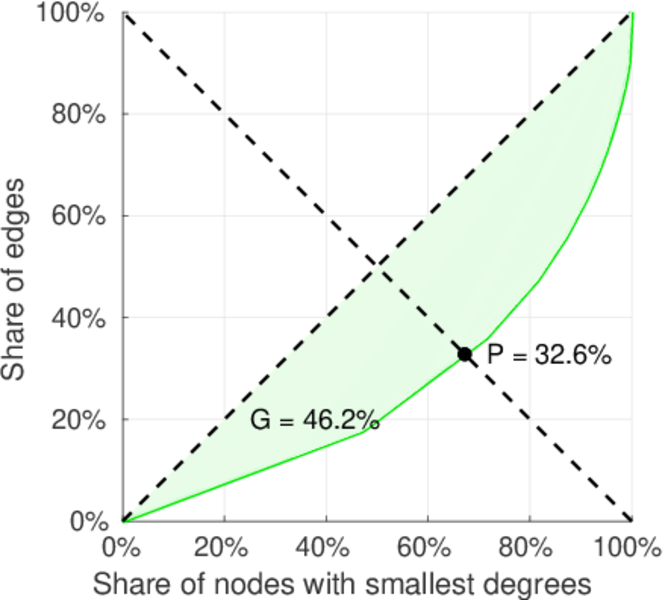
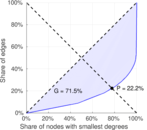
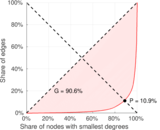
| Gini coefficient | G = | 0.725 899
|
| Balanced inequality ratio | P = | 0.218 162
|
| Left balanced inequality ratio | P1 = | 0.108 962
|
| Right balanced inequality ratio | P2 = | 0.326 455
|
| Relative edge distribution entropy | Her = | 0.740 523
|
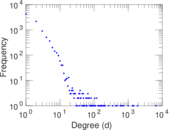
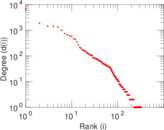
| Power law exponent | γ = | 4.275 61
|
| Tail power law exponent | γt = | 3.331 00
|
| Tail power law exponent with p | γ3 = | 3.331 00
|
| p-value | p = | 0.000 00
|
| Left tail power law exponent with p | γ3,1 = | 1.571 00
|
| Left p-value | p1 = | 0.665 000
|
| Right tail power law exponent with p | γ3,2 = | 4.051 00
|
| Right p-value | p2 = | 0.000 00
|
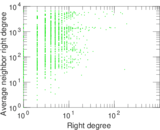
| Degree assortativity | ρ = | −0.114 276
|
| Degree assortativity p-value | pρ = | 4.101 25 × 10−38
|
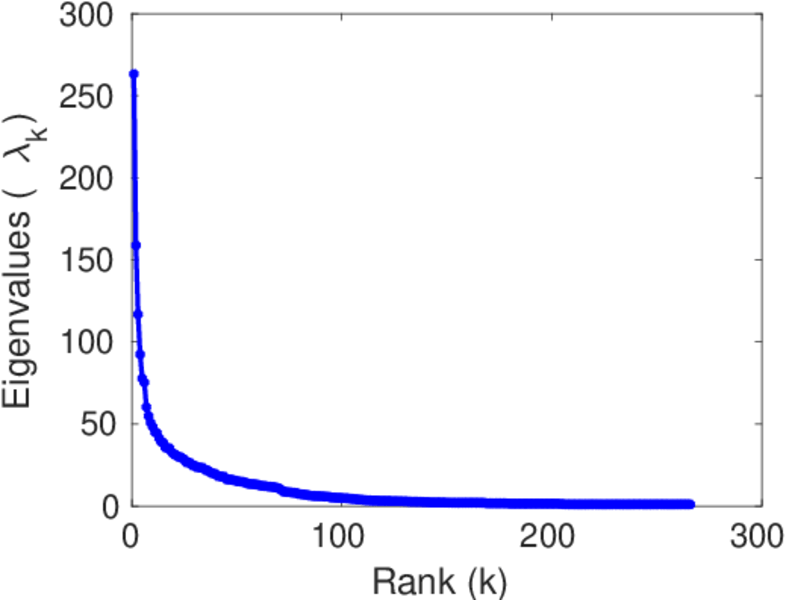
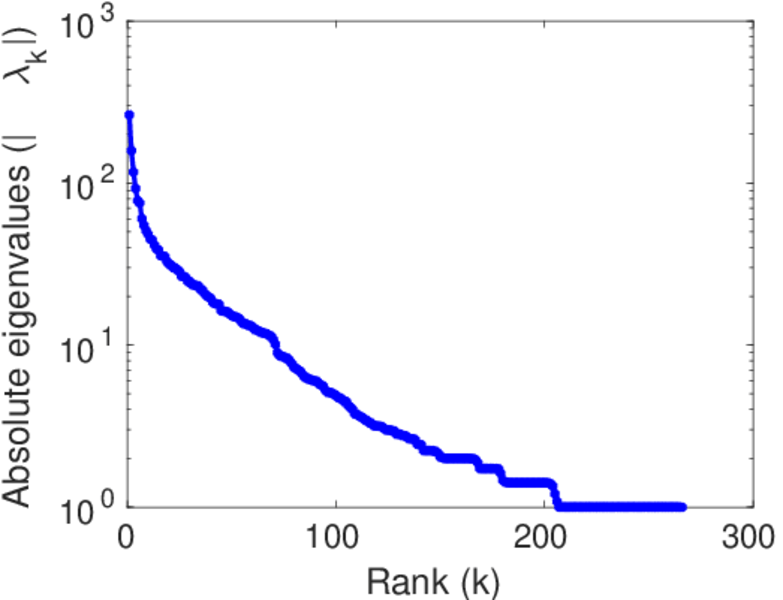
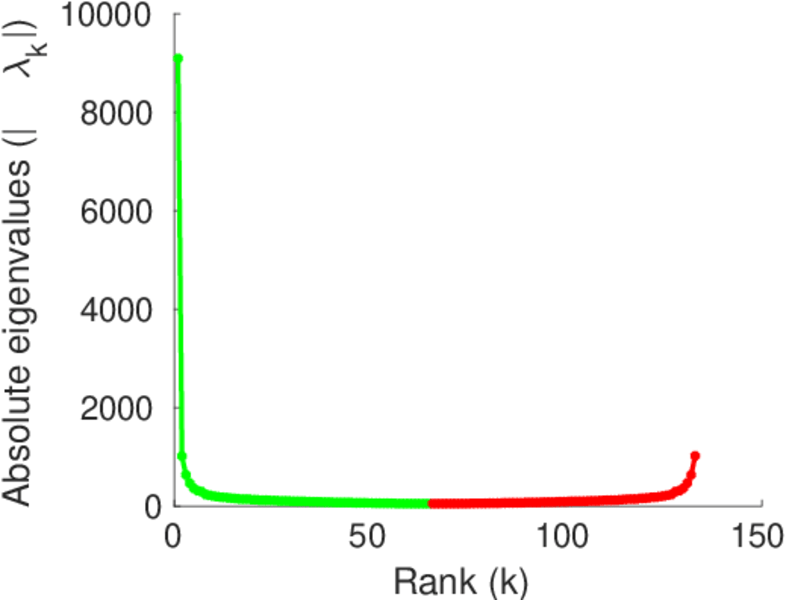
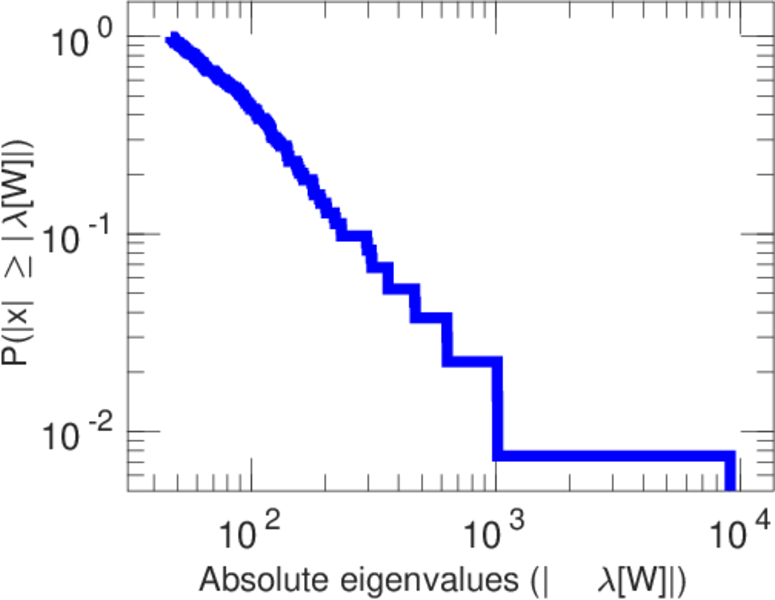
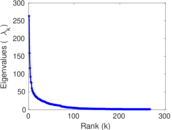
| Spectral norm | α = | 263.205
|
| Algebraic connectivity | a = | 0.062 606 5
|
| Spectral separation | |λ1[A] / λ2[A]| = | 1.657 57
|
| Controllability | C = | 8,470
|
| Relative controllability | Cr = | 0.936 947
|
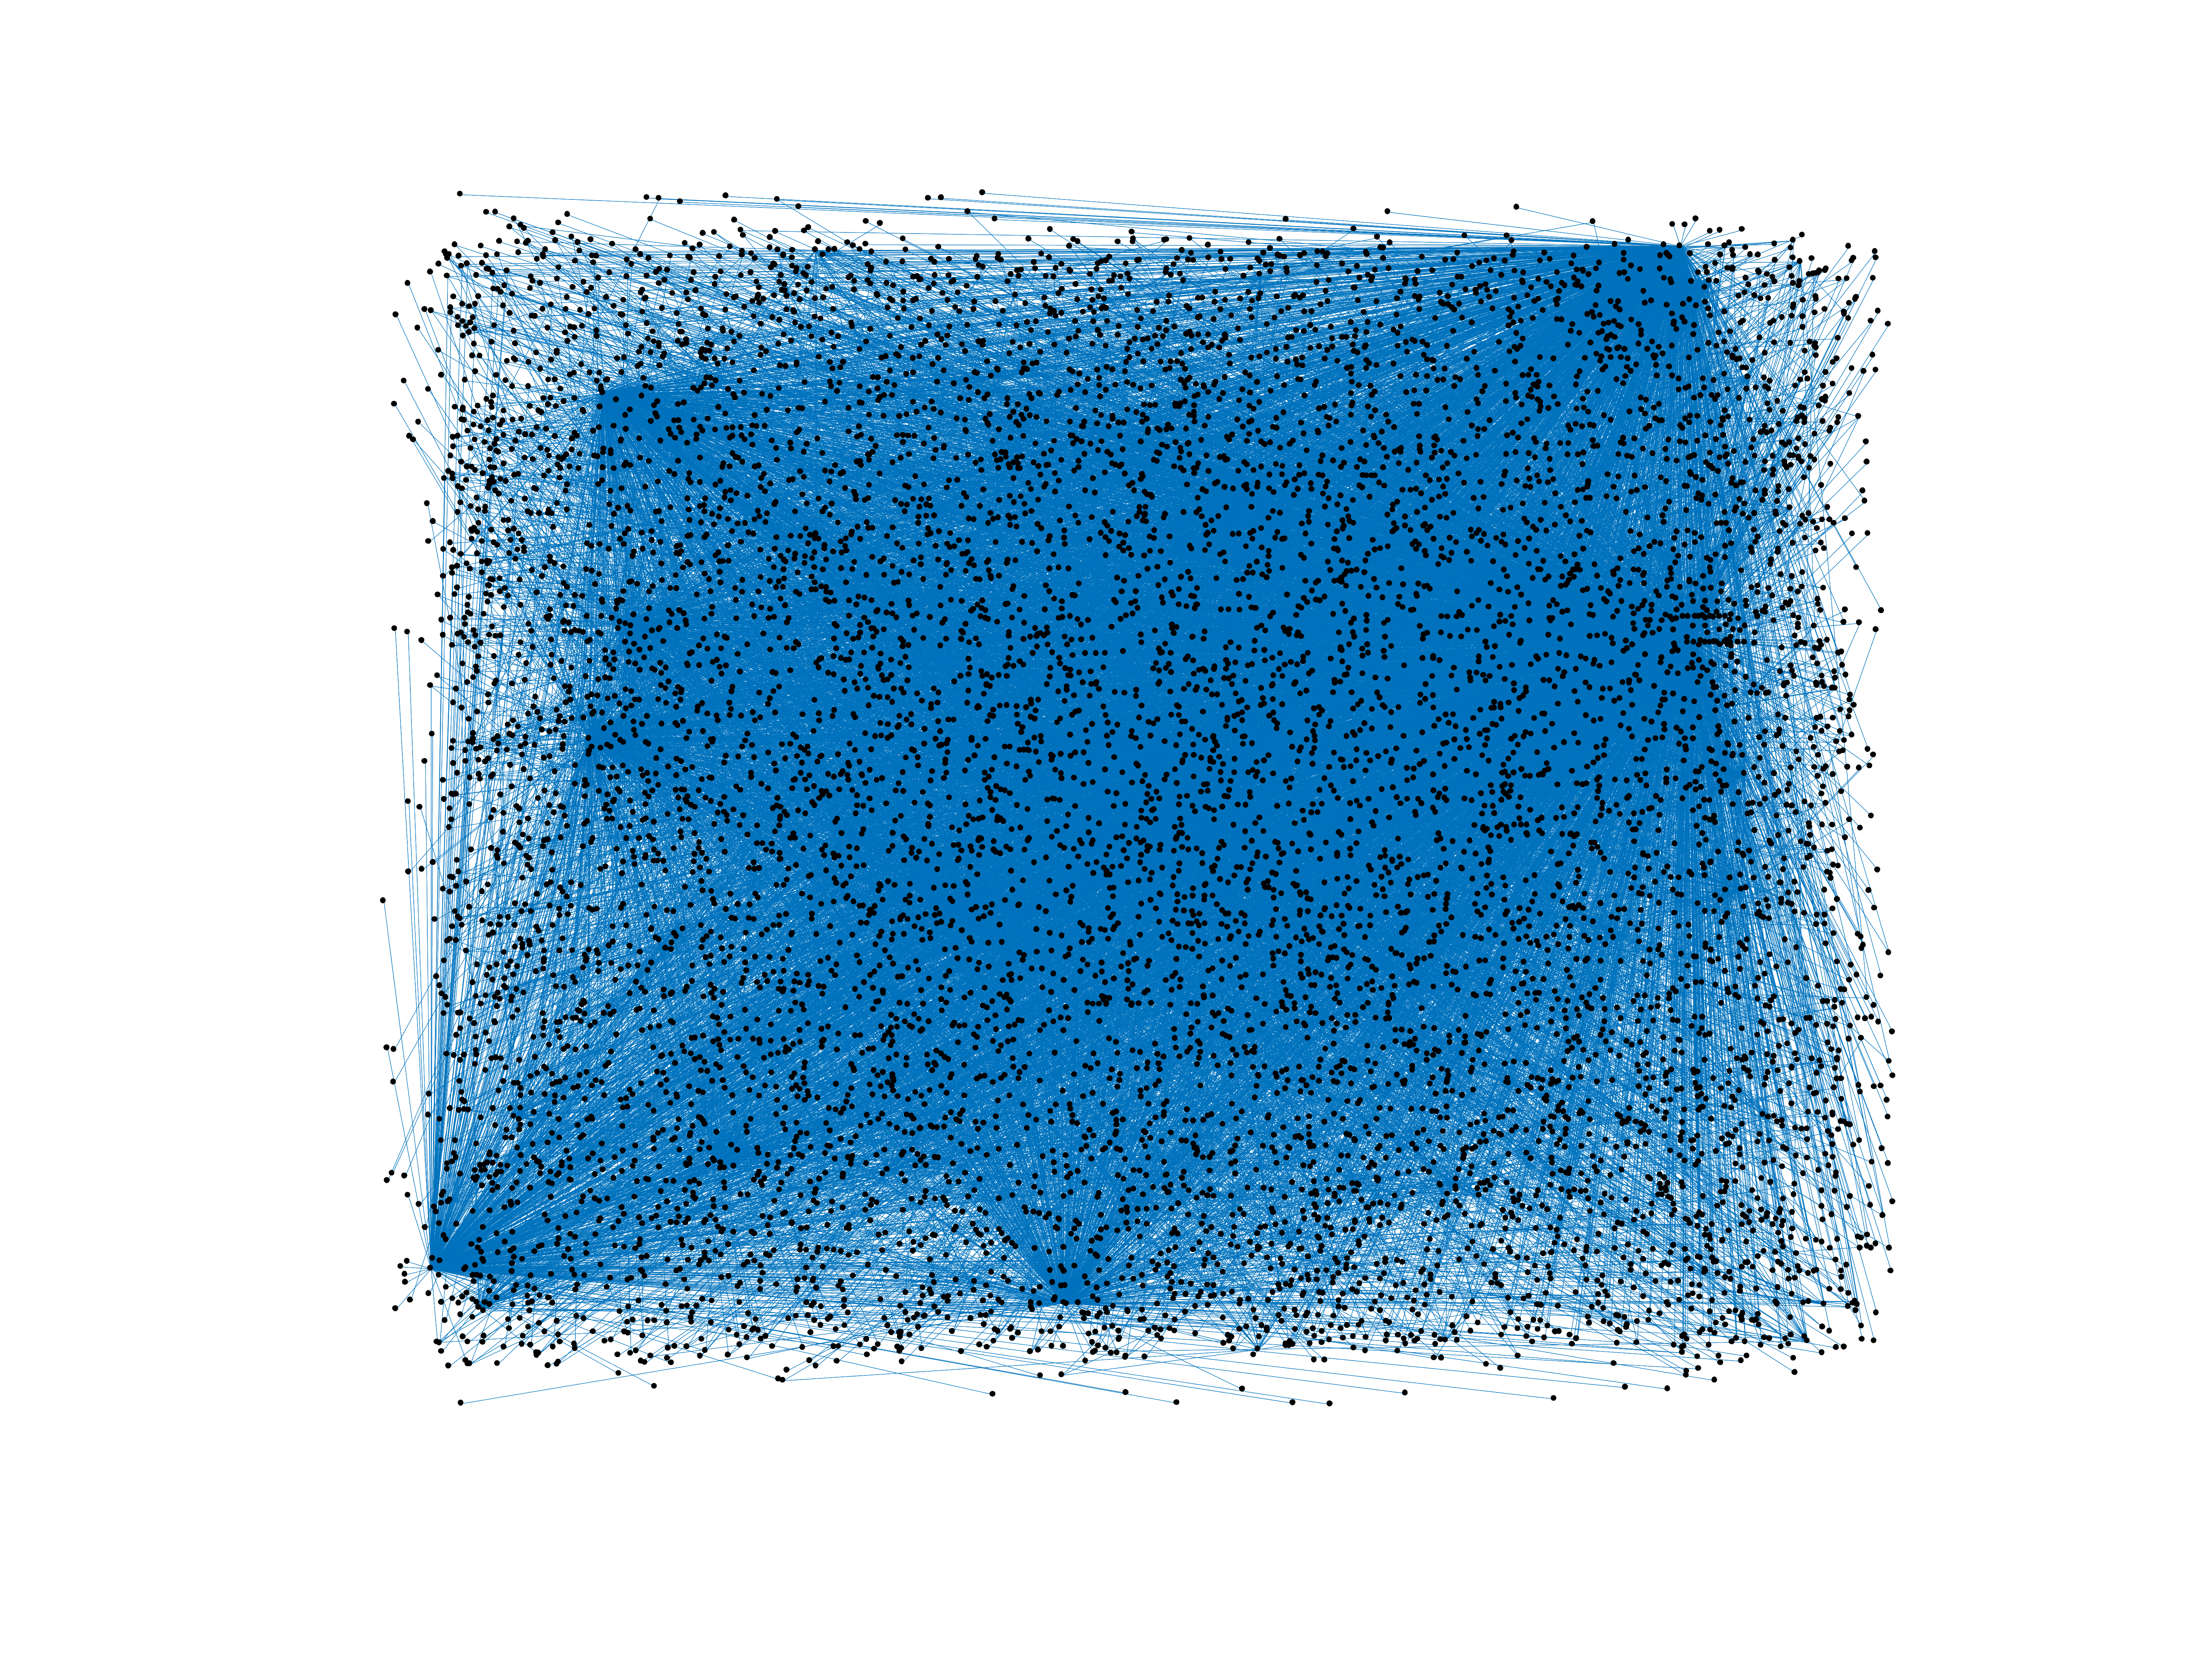
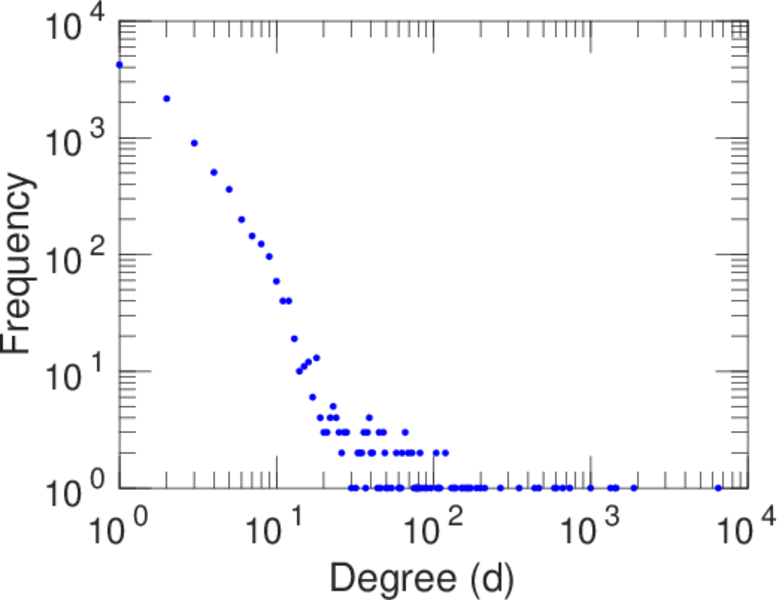
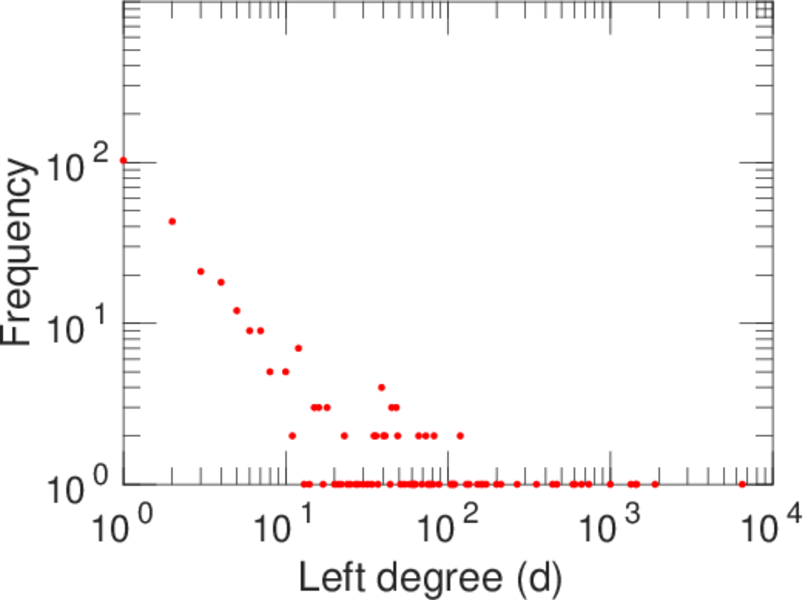
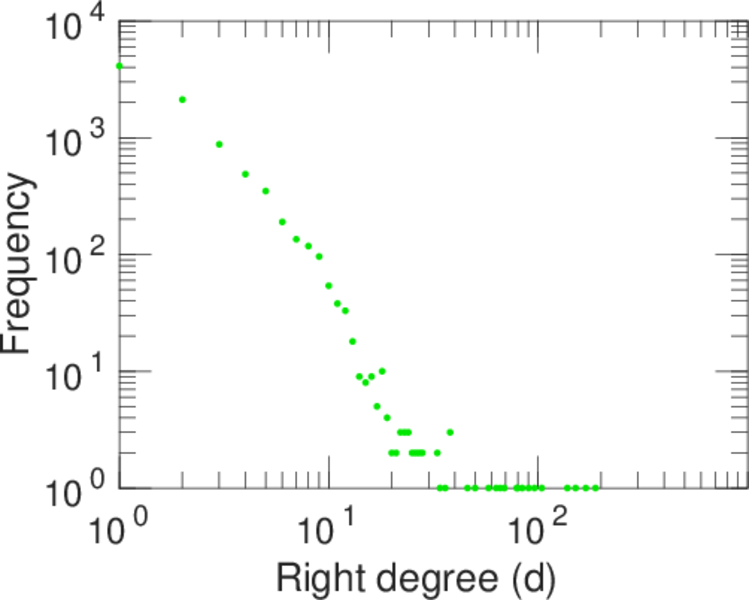
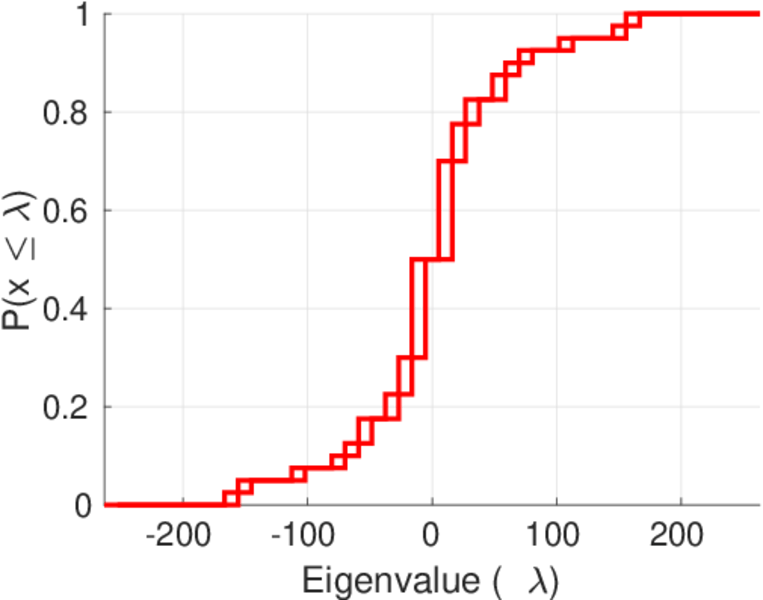
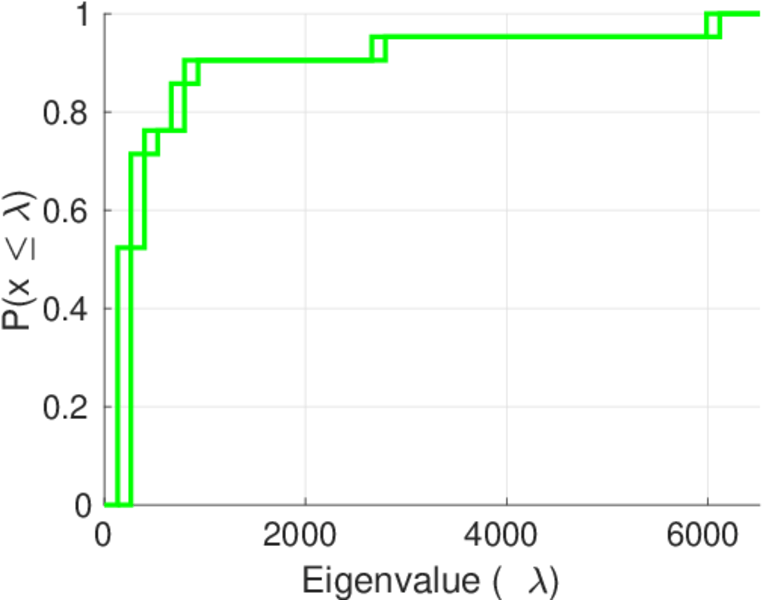
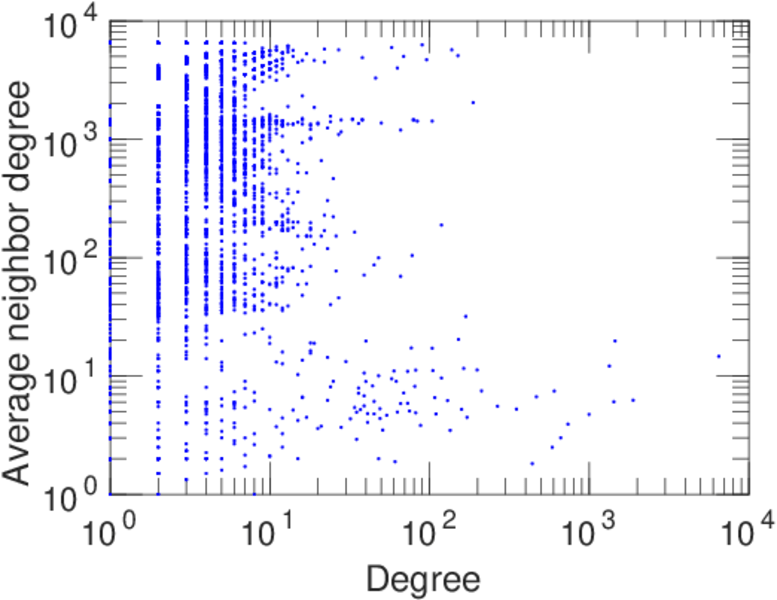
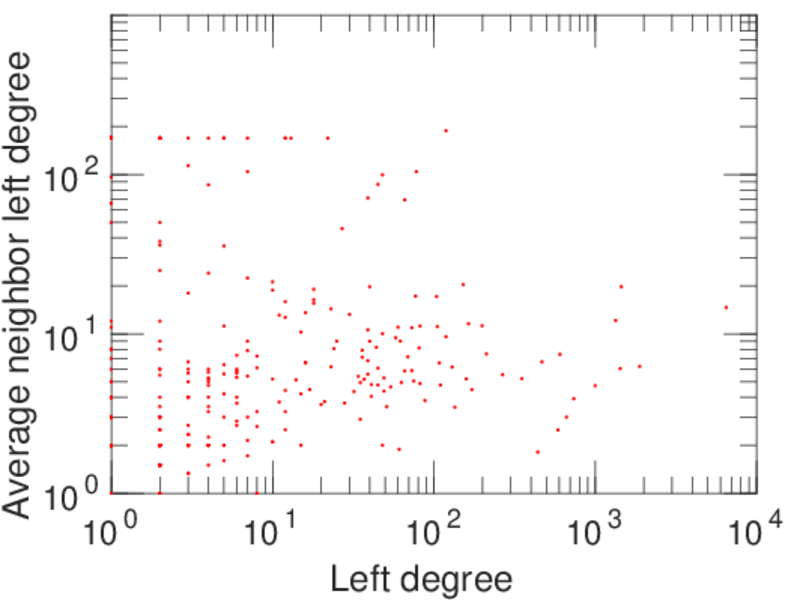
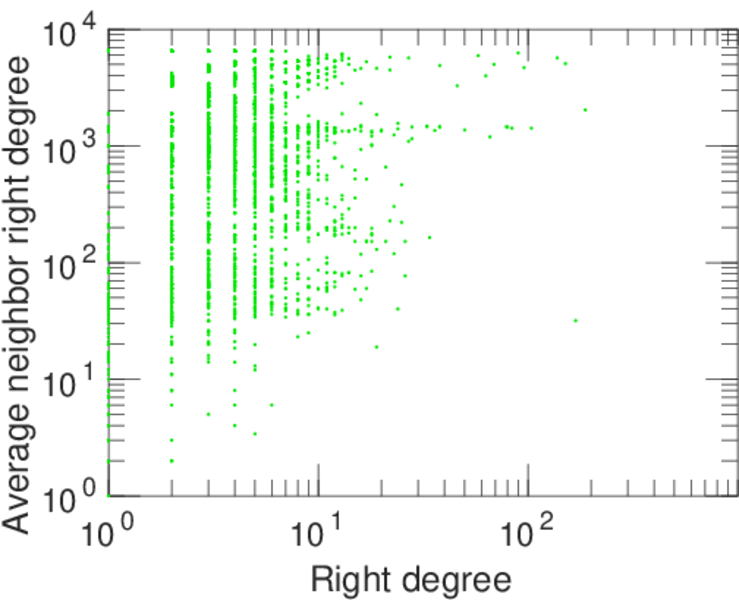
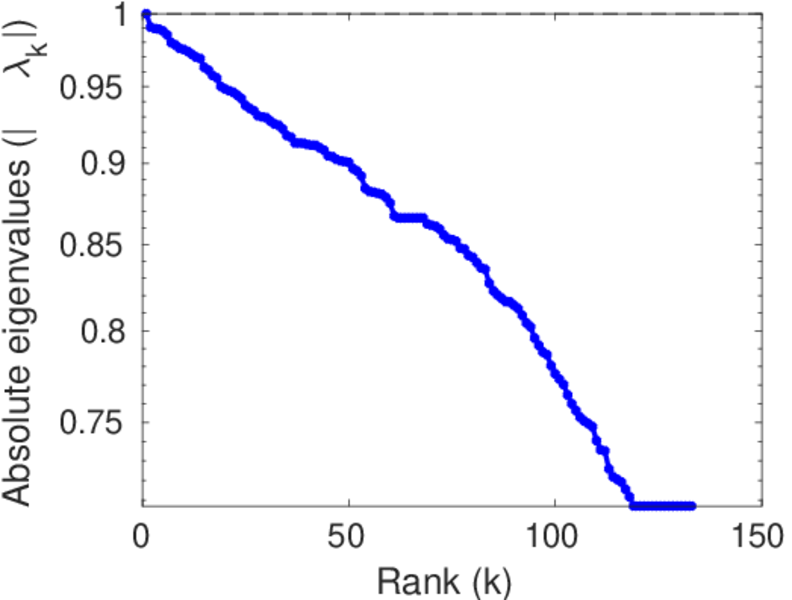
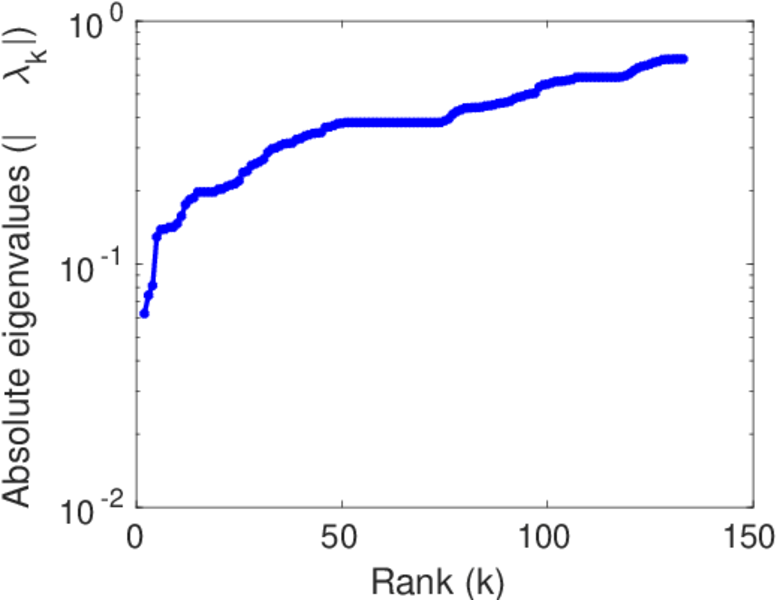
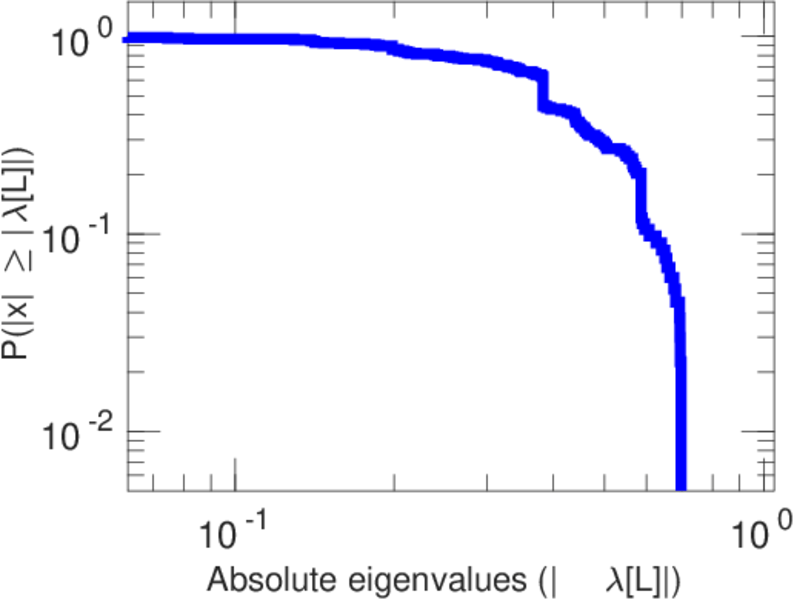
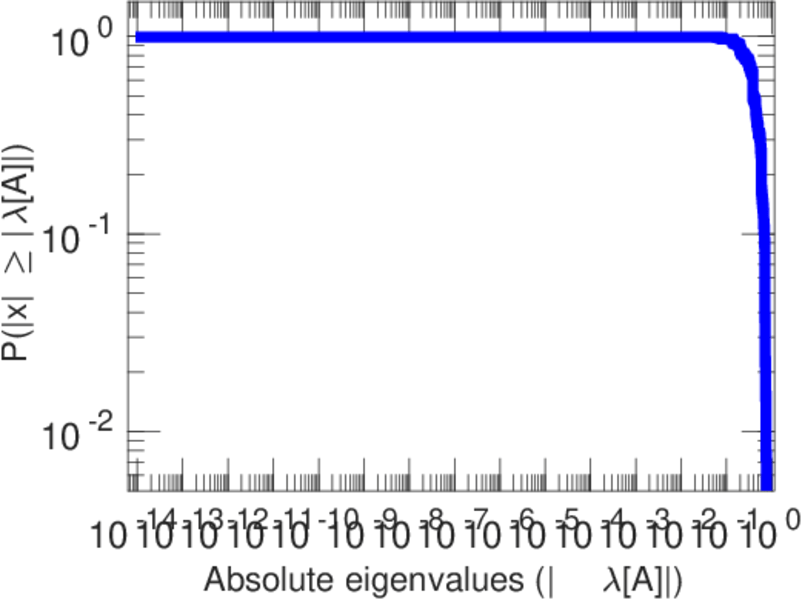
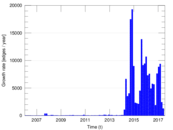
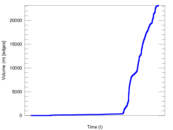
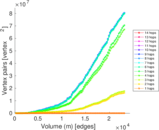
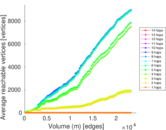
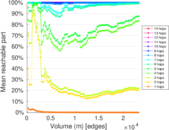
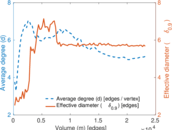
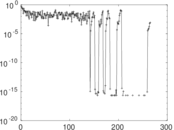
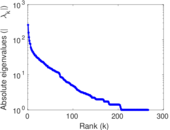
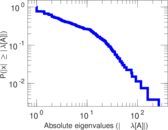
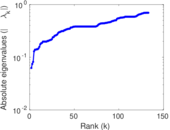
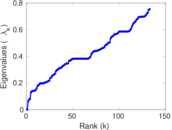
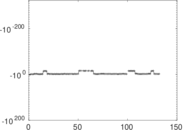
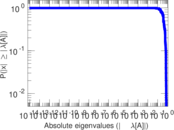
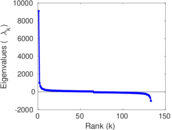
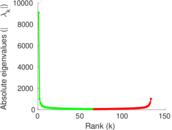
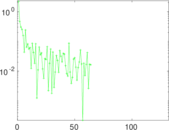
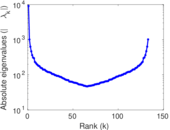
Plots


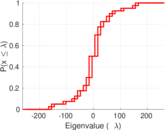
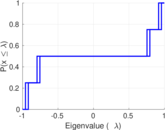
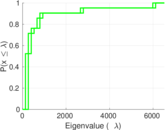


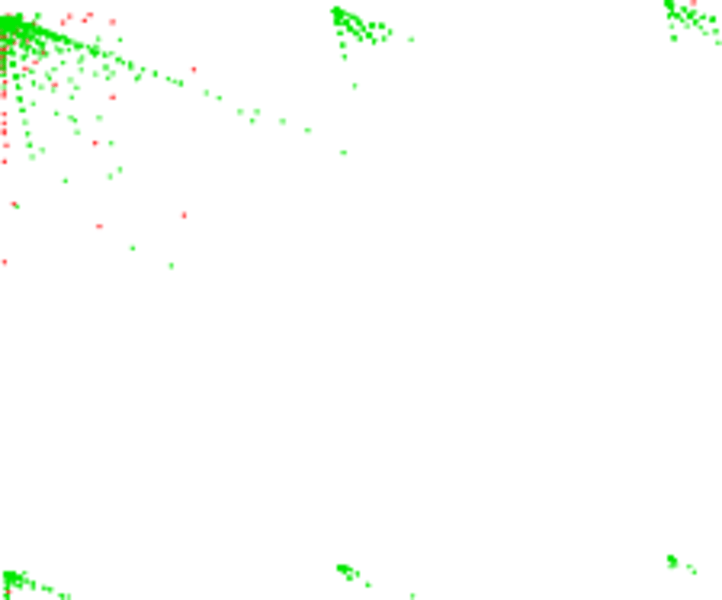
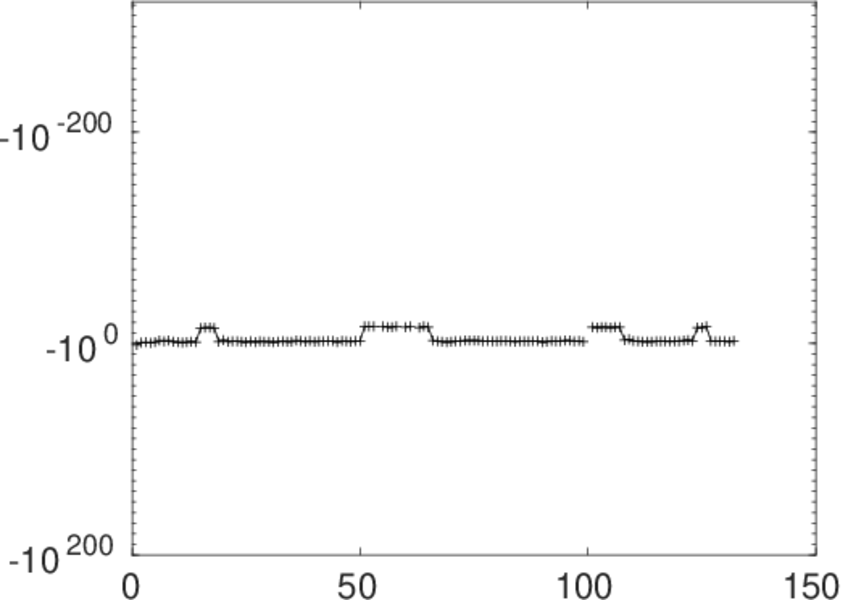
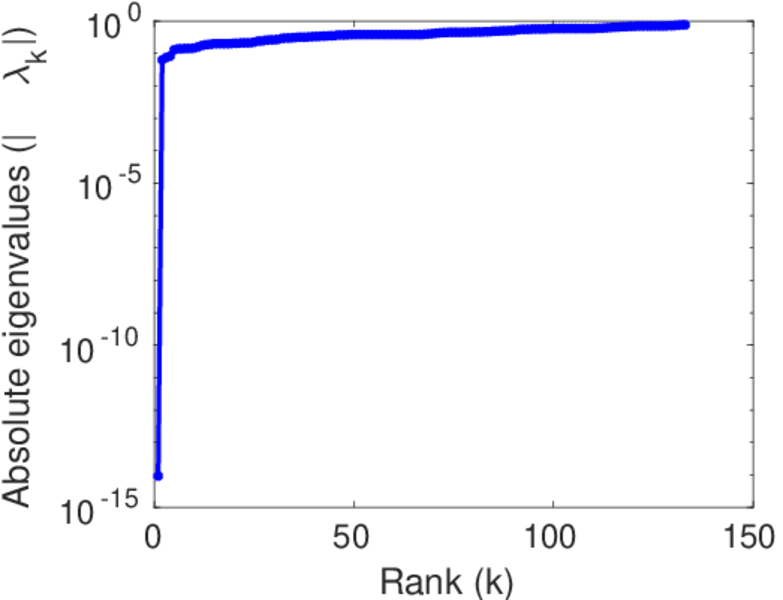
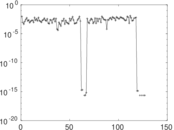
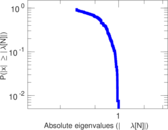
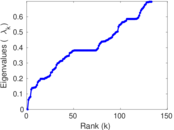
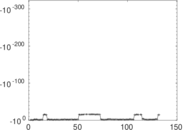
Matrix decompositions plots


Downloads
References
|
[1]
|
Jérôme Kunegis.
KONECT – The Koblenz Network Collection.
In Proc. Int. Conf. on World Wide Web Companion, pages
1343–1350, 2013.
[ http ]
|
|
[2]
|
Wikimedia Foundation.
Wikimedia downloads.
http://dumps.wikimedia.org/, January 2010.
|
 KONECT ‣ Networks ‣
Buy Me a Coffee
KONECT ‣ Networks ‣
Buy Me a Coffee