Wiktionary edits (or)
This is the bipartite edit network of the Odia Wiktionary. It contains users
and pages from the Odia Wiktionary, connected by edit events. Each edge
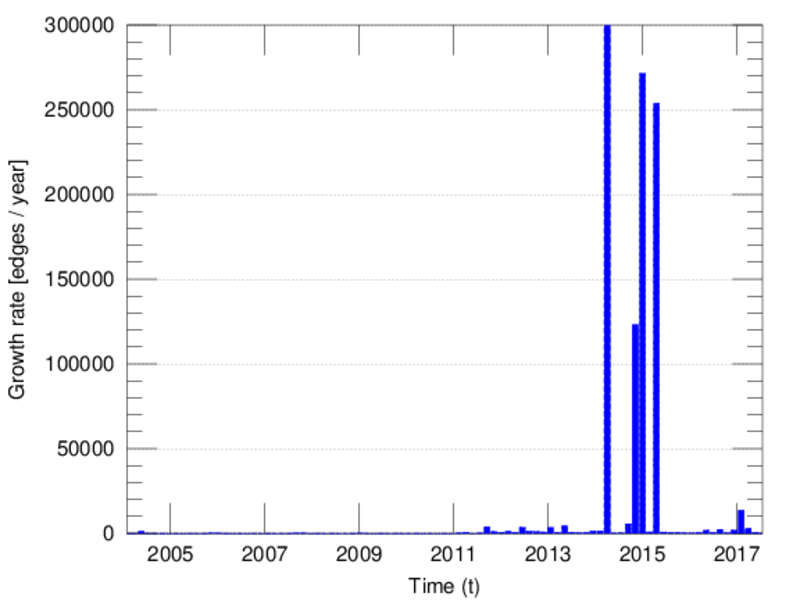
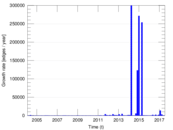
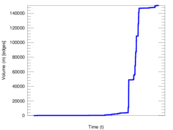
represents an edit. The dataset includes the timestamp of each edit.
Metadata
Statistics
| Size | n = | 109,998
|
| Left size | n1 = | 195
|
| Right size | n2 = | 109,803
|
| Volume | m = | 150,883
|
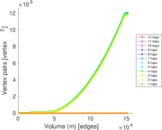
| Unique edge count | m̿ = | 112,604
|
| Wedge count | s = | 5,851,720,898
|
| Claw count | z = | 210,962,776,983,847
|
| Cross count | x = | 5,705,007,624,278,489,088
|
| Square count | q = | 379,978
|
| 4-Tour count | T4 = | 23,410,148,936
|
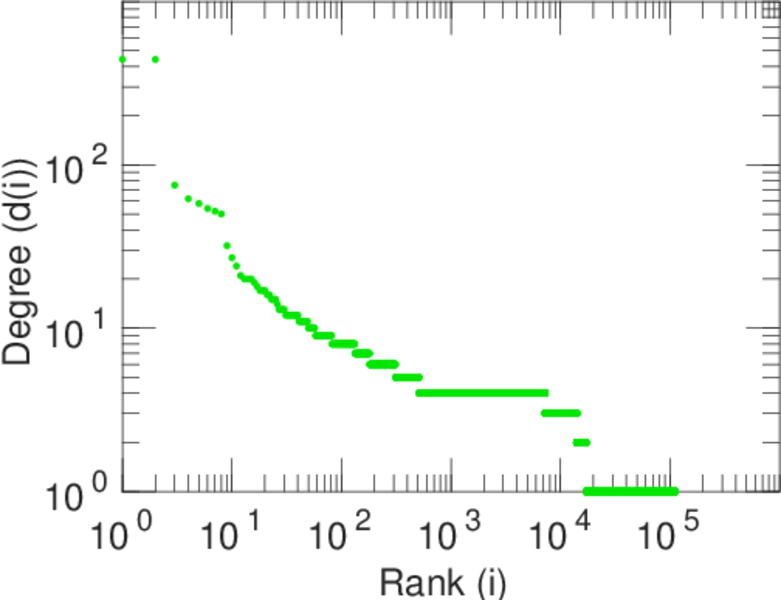
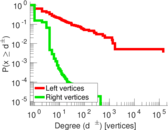
| Maximum degree | dmax = | 143,106
|
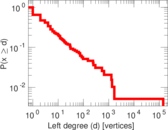
| Maximum left degree | d1max = | 143,106
|
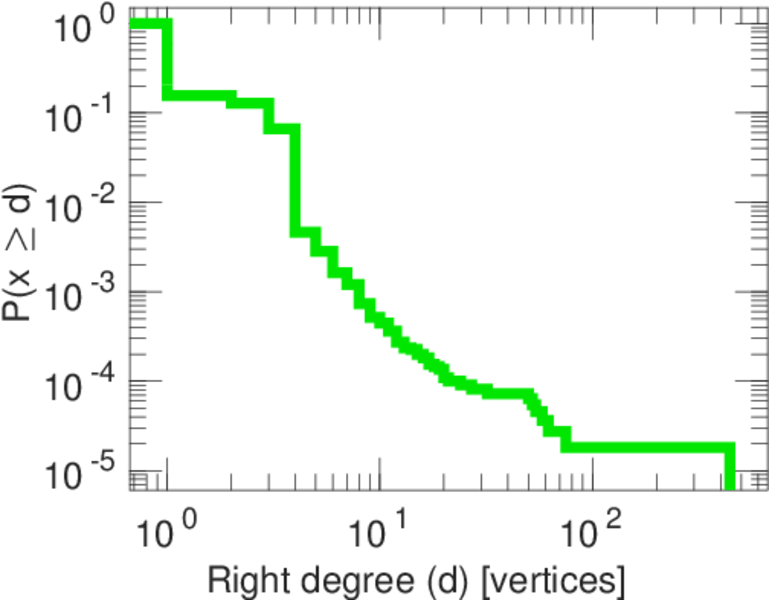
| Maximum right degree | d2max = | 443
|
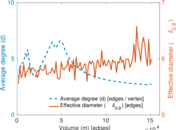
| Average degree | d = | 2.743 38
|
| Average left degree | d1 = | 773.759
|
| Average right degree | d2 = | 1.374 12
|
| Fill | p = | 0.005 259 02
|
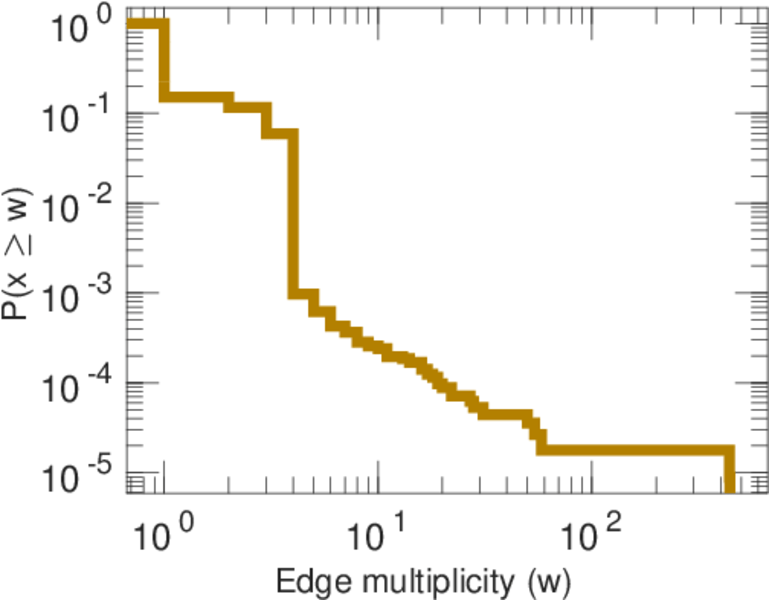
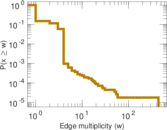
| Average edge multiplicity | m̃ = | 1.339 94
|
| Size of LCC | N = | 109,731
|
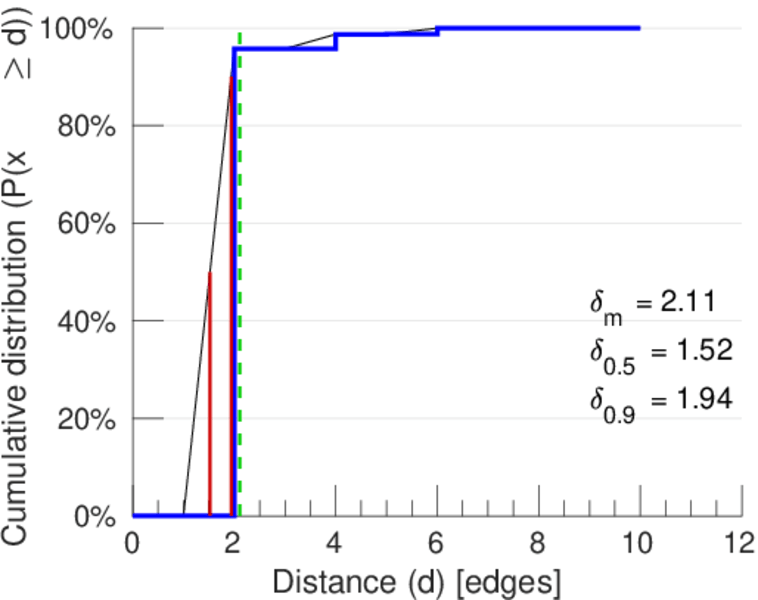
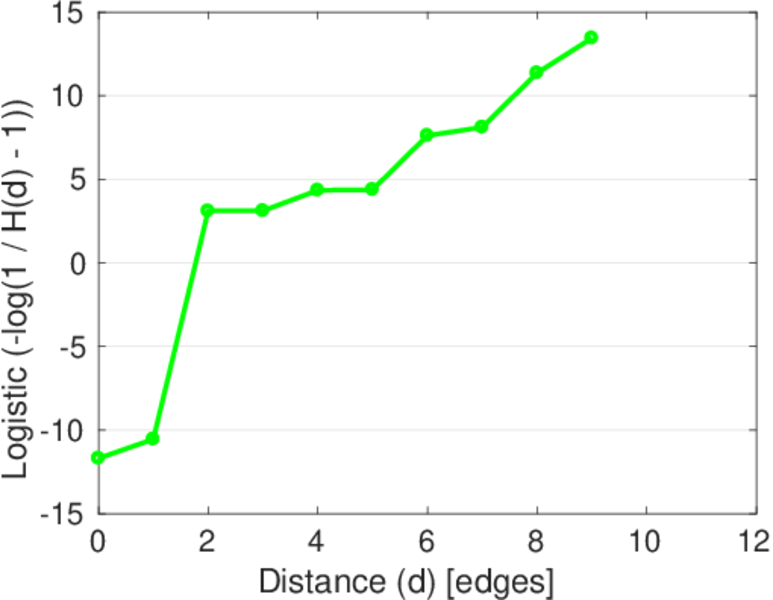
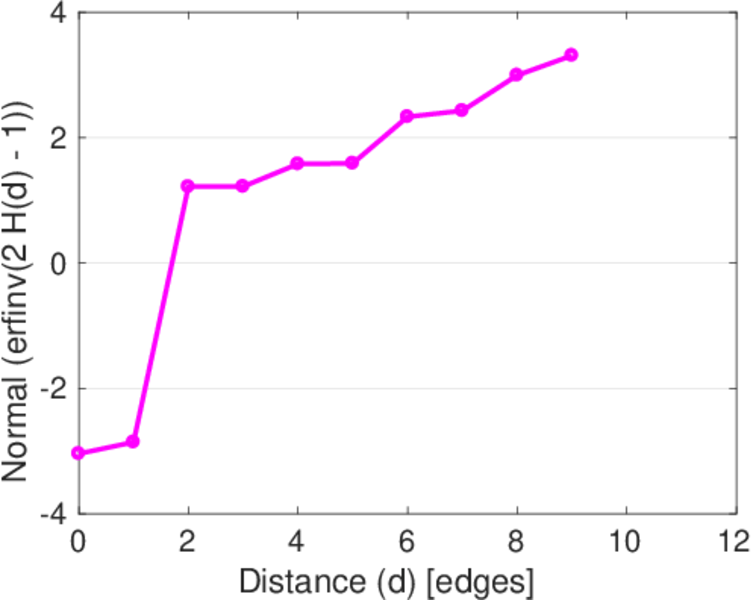
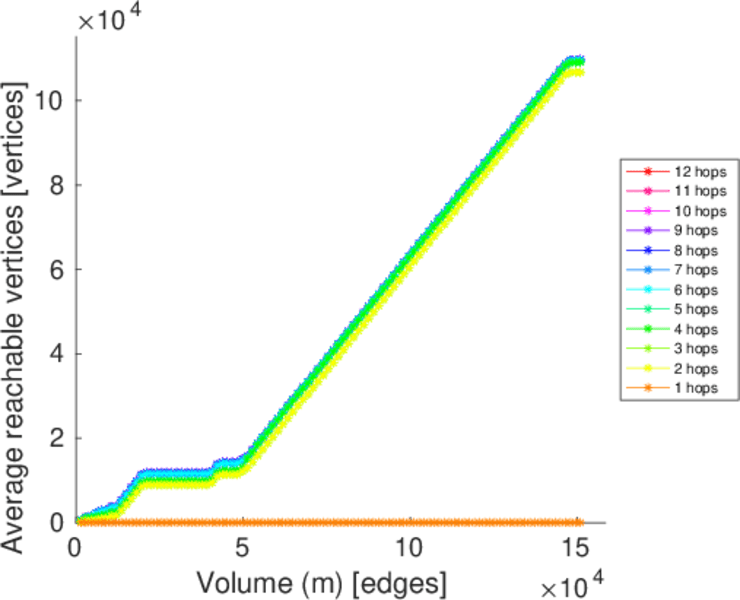
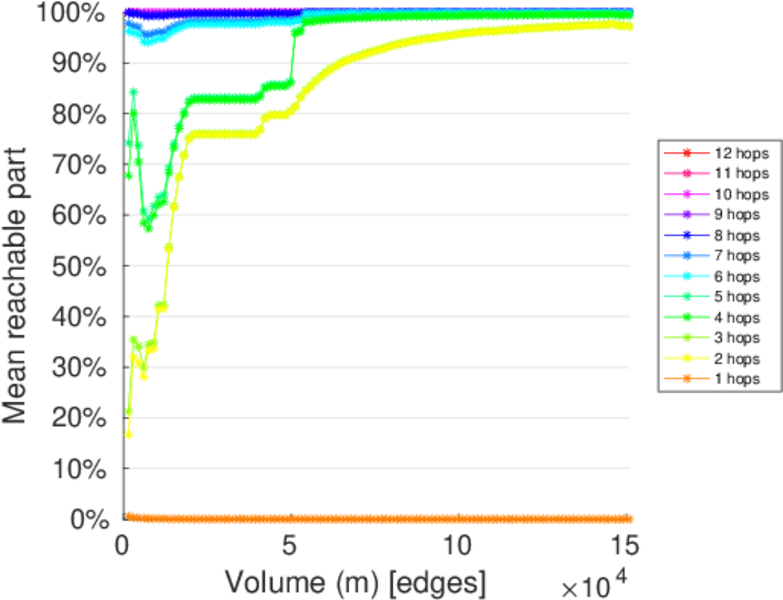
| Diameter | δ = | 11
|
| 50-Percentile effective diameter | δ0.5 = | 1.522 43
|
| 90-Percentile effective diameter | δ0.9 = | 1.940 39
|
| Median distance | δM = | 2
|
| Mean distance | δm = | 2.111 51
|
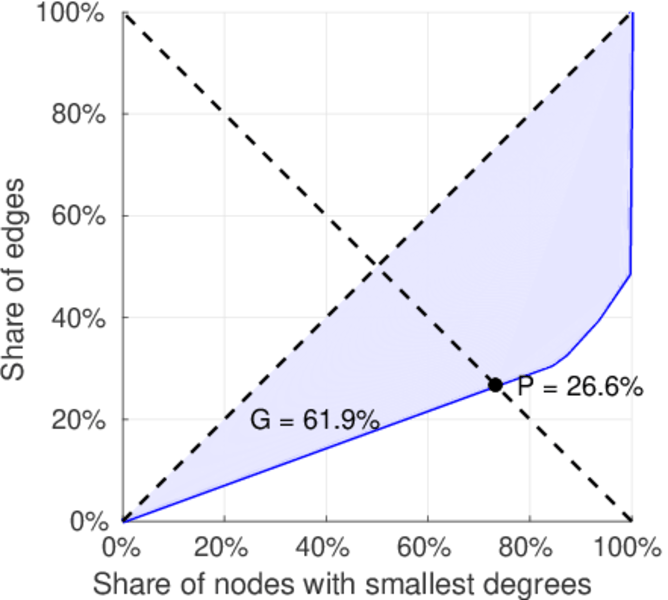
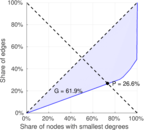
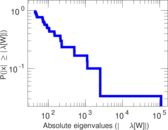
| Gini coefficient | G = | 0.619 370
|
| Balanced inequality ratio | P = | 0.265 610
|
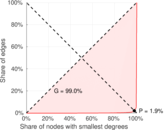
| Left balanced inequality ratio | P1 = | 0.018 690 0
|
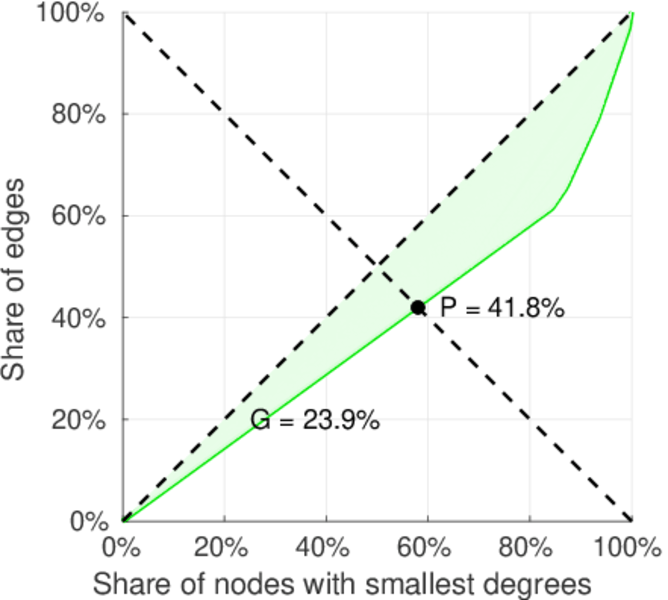
| Right balanced inequality ratio | P2 = | 0.418 424
|
| Relative edge distribution entropy | Her = | 0.571 218
|
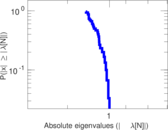
| Power law exponent | γ = | 63.737 1
|
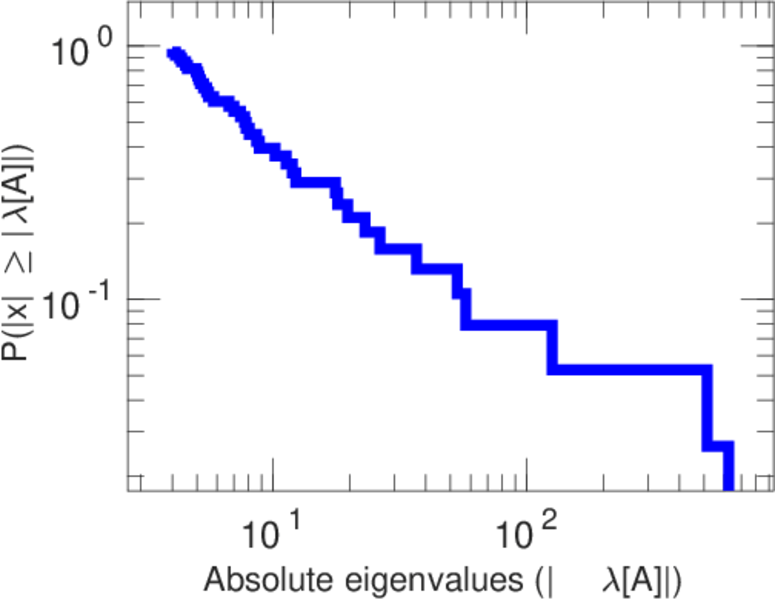
| Tail power law exponent | γt = | 5.701 00
|
| Tail power law exponent with p | γ3 = | 5.701 00
|
| p-value | p = | 0.000 00
|
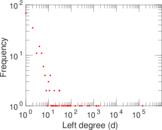
| Left tail power law exponent with p | γ3,1 = | 1.611 00
|
| Left p-value | p1 = | 0.730 000
|
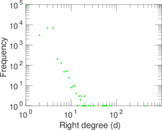
| Right tail power law exponent with p | γ3,2 = | 5.871 00
|
| Right p-value | p2 = | 0.000 00
|
| Degree assortativity | ρ = | −0.610 846
|
| Degree assortativity p-value | pρ = | 0.000 00
|
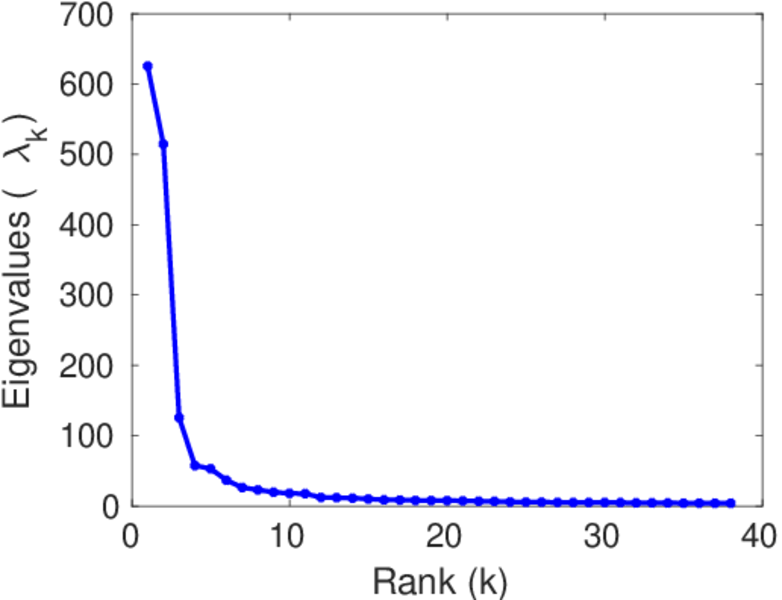
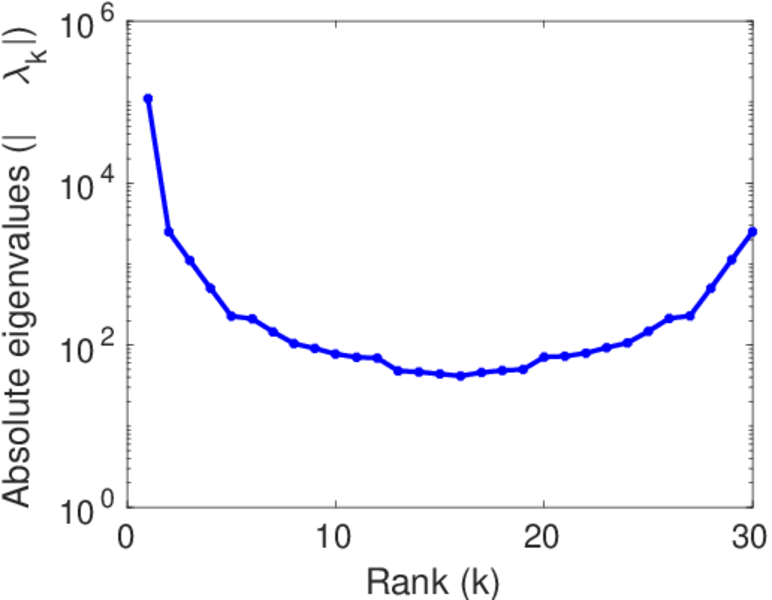
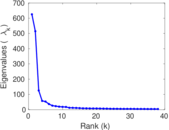
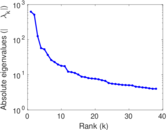
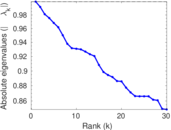
| Spectral norm | α = | 625.407
|
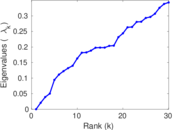
| Algebraic connectivity | a = | 0.020 666 0
|
| Spectral separation | |λ1[A] / λ2[A]| = | 1.215 53
|
| Controllability | C = | 109,611
|
| Relative controllability | Cr = | 0.996 527
|
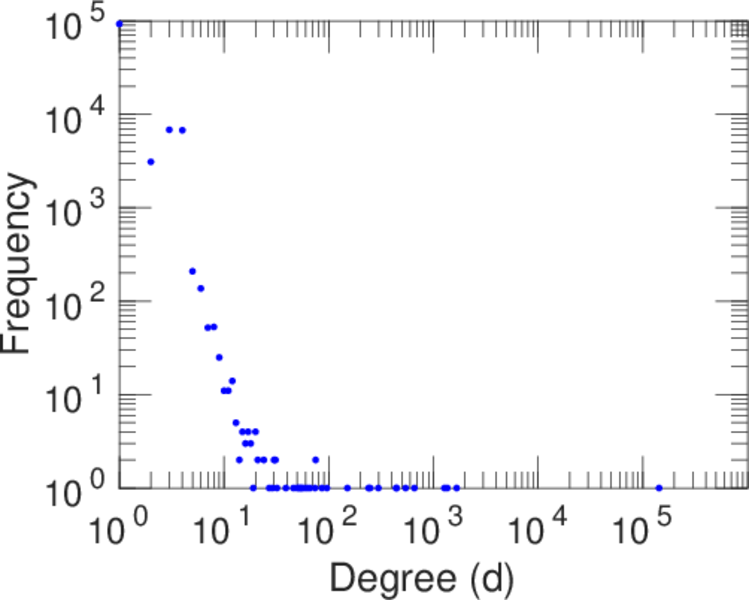
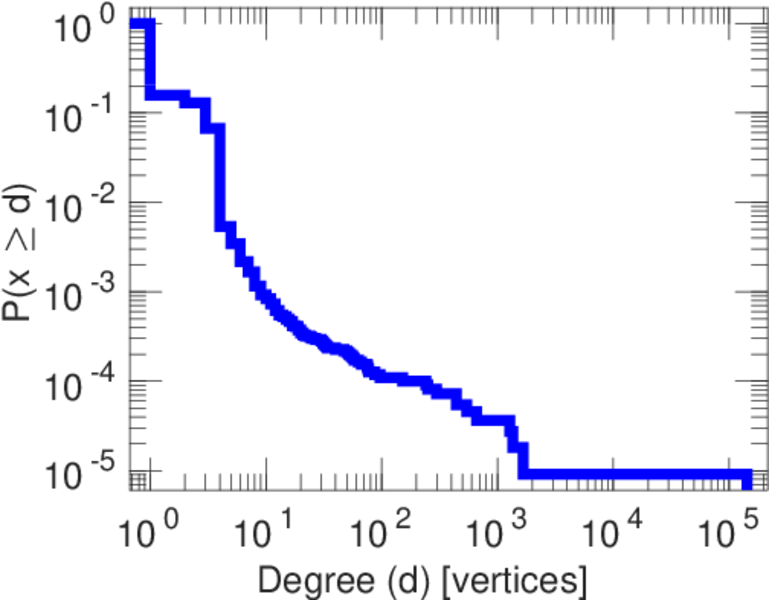
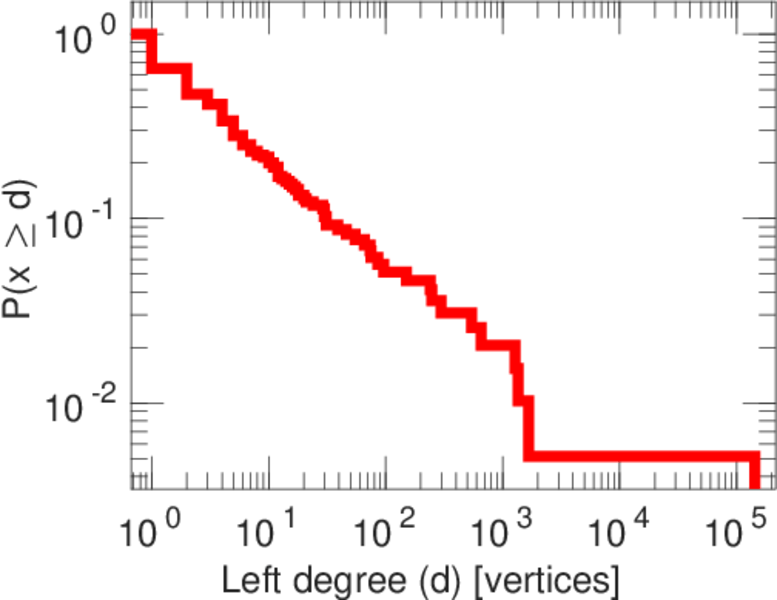
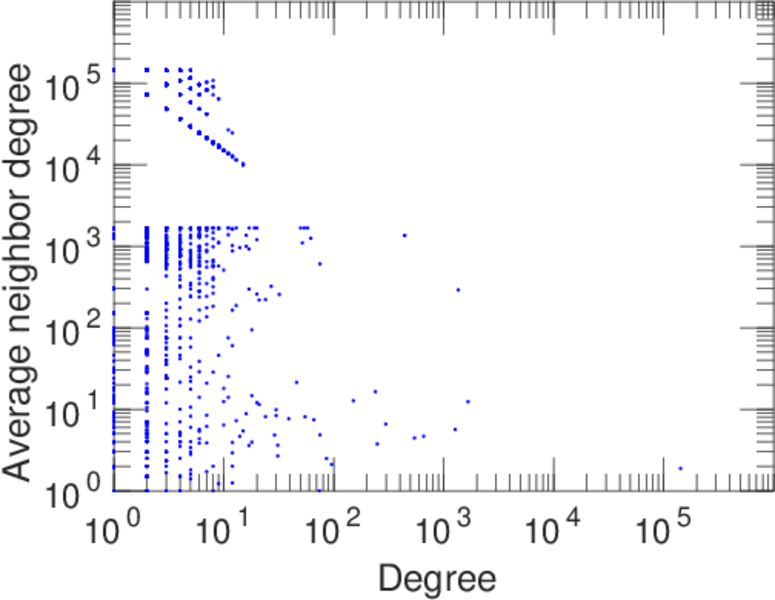
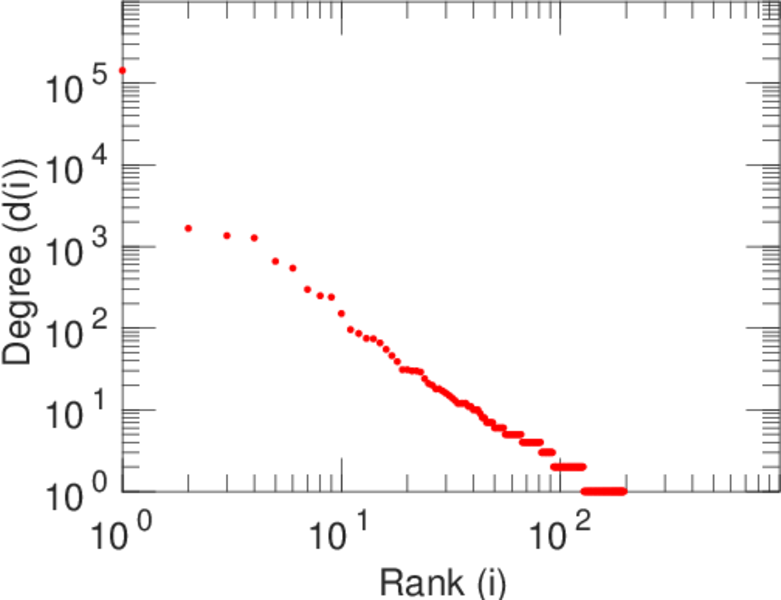
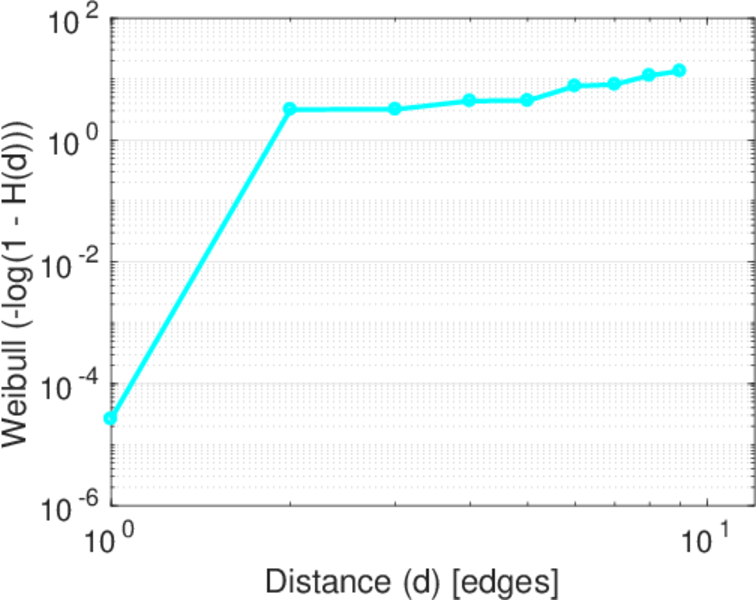
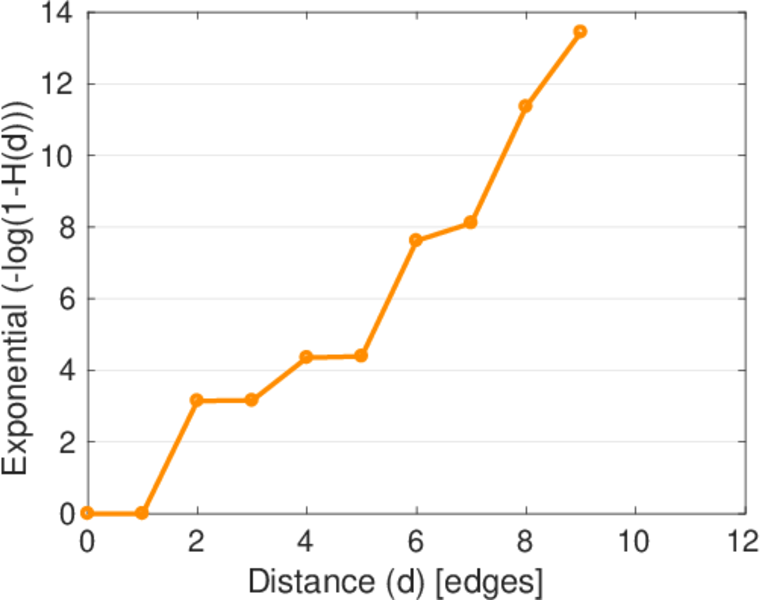
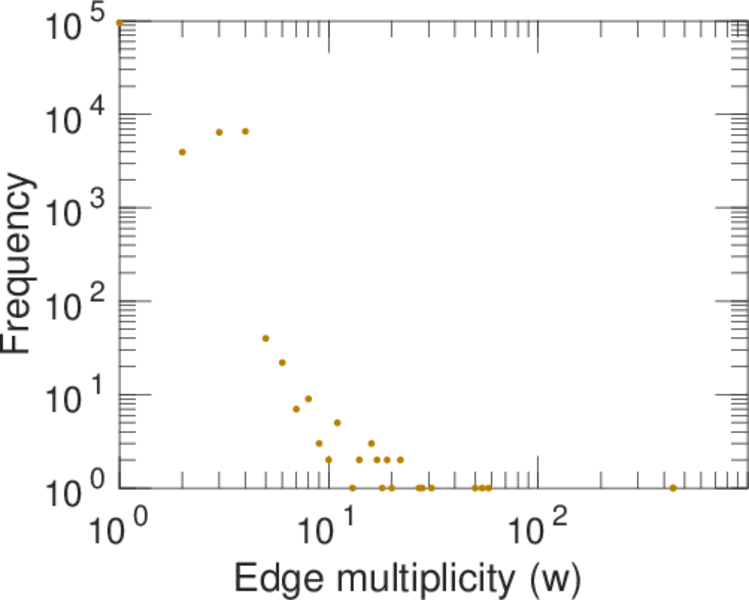
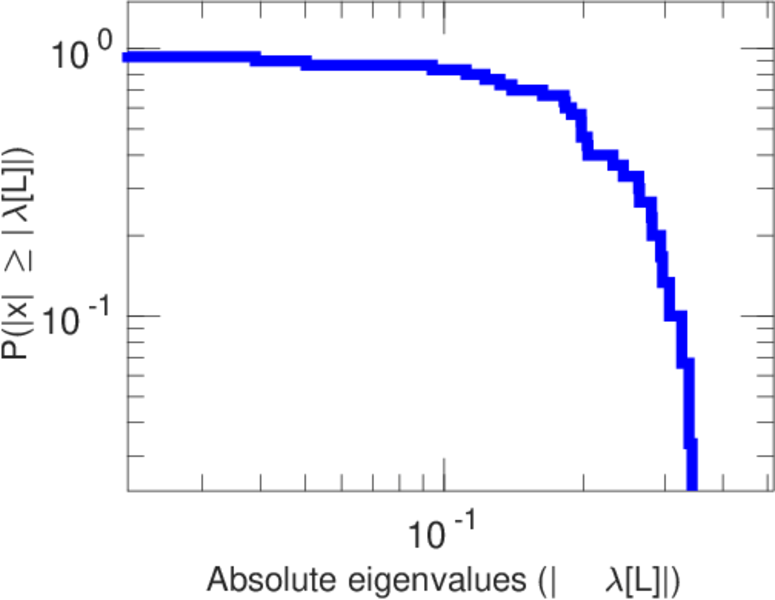
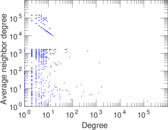
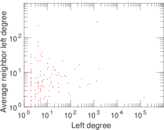
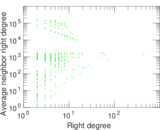
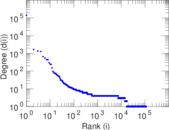
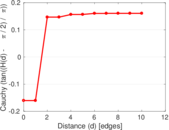
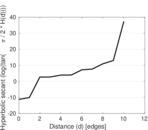
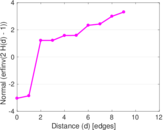
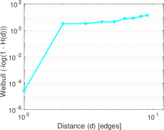
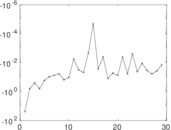
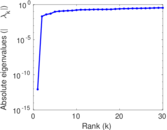
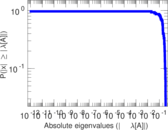
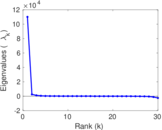
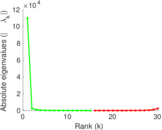
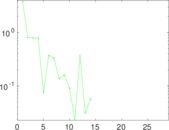
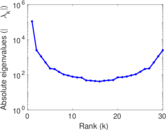
Plots


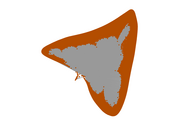

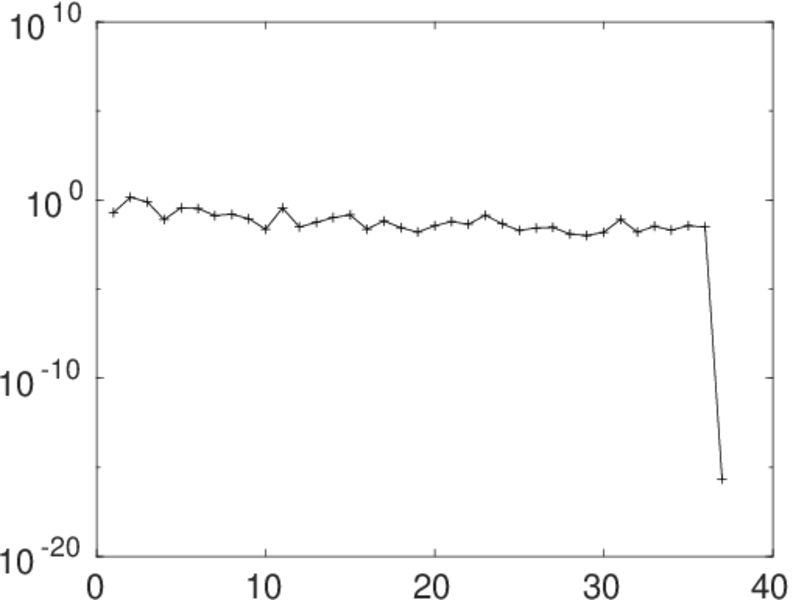
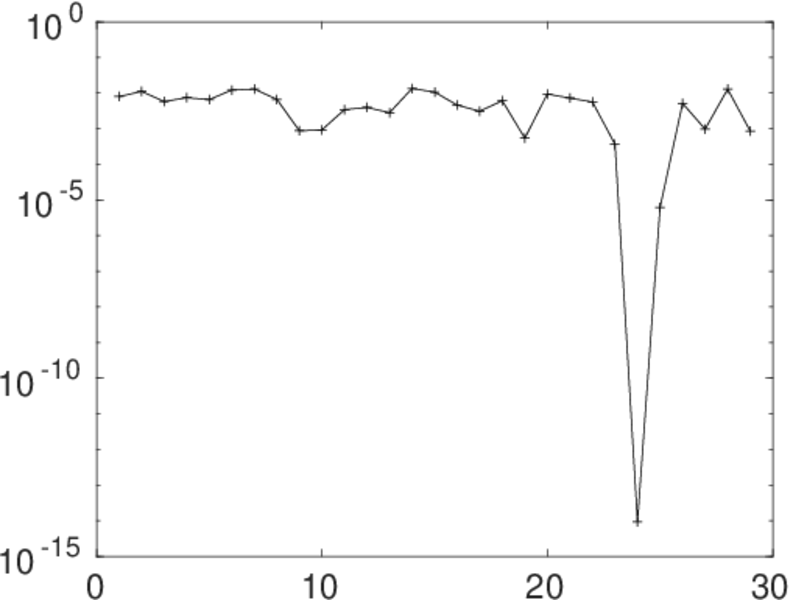
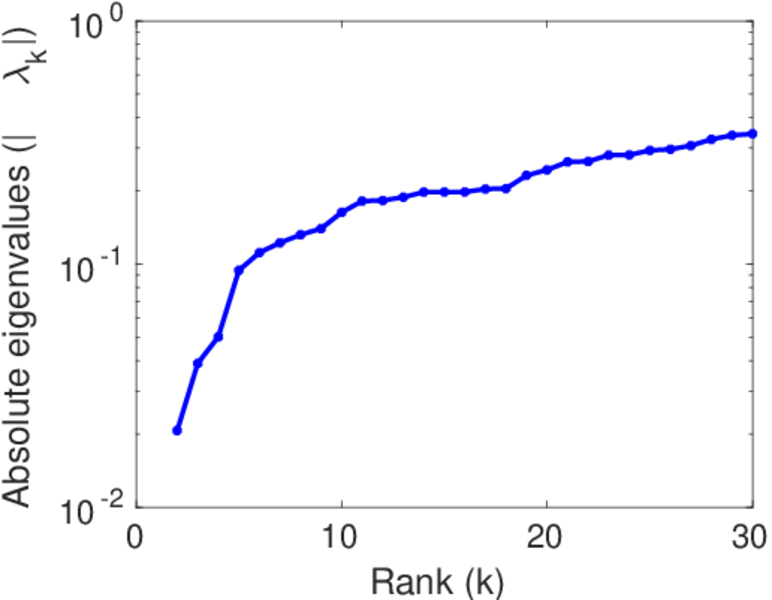
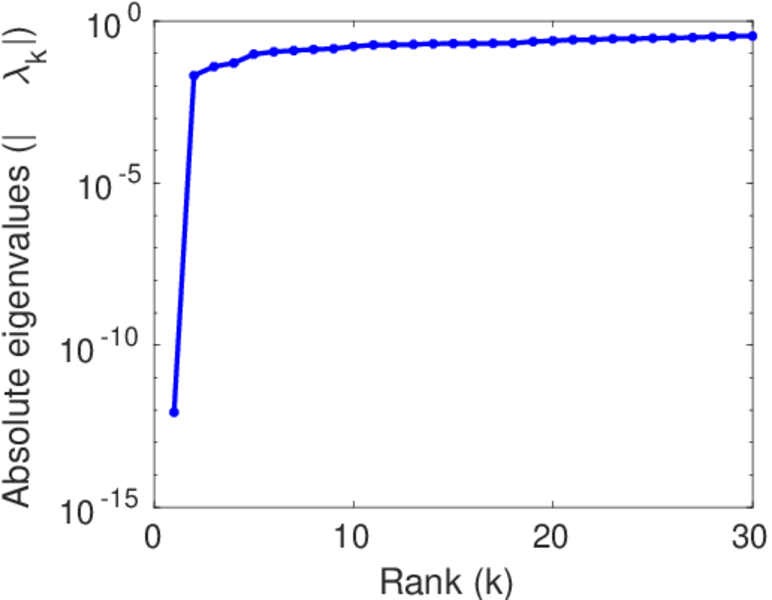
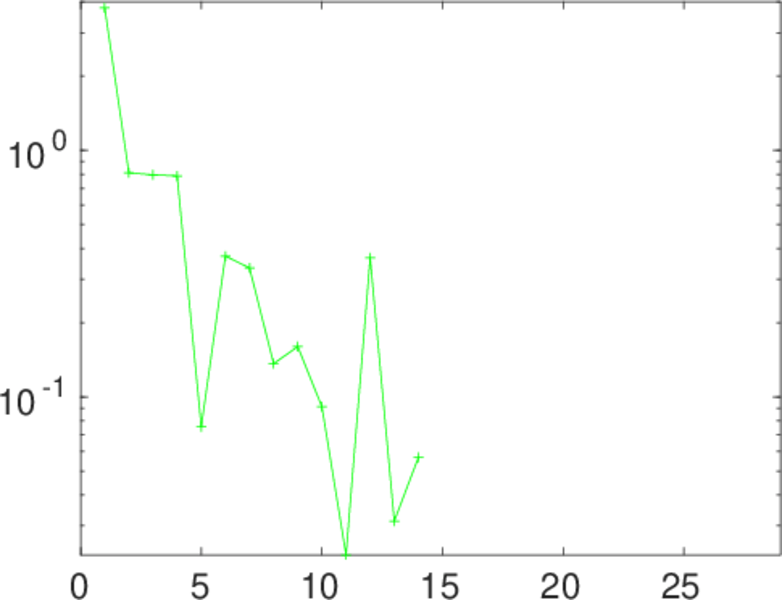
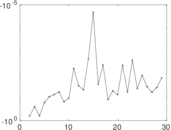
Matrix decompositions plots


Downloads
References
|
[1]
|
Jérôme Kunegis.
KONECT – The Koblenz Network Collection.
In Proc. Int. Conf. on World Wide Web Companion, pages
1343–1350, 2013.
[ http ]
|
|
[2]
|
Wikimedia Foundation.
Wikimedia downloads.
http://dumps.wikimedia.org/, January 2010.
|
 KONECT ‣ Networks ‣
Buy Me a Coffee
KONECT ‣ Networks ‣
Buy Me a Coffee