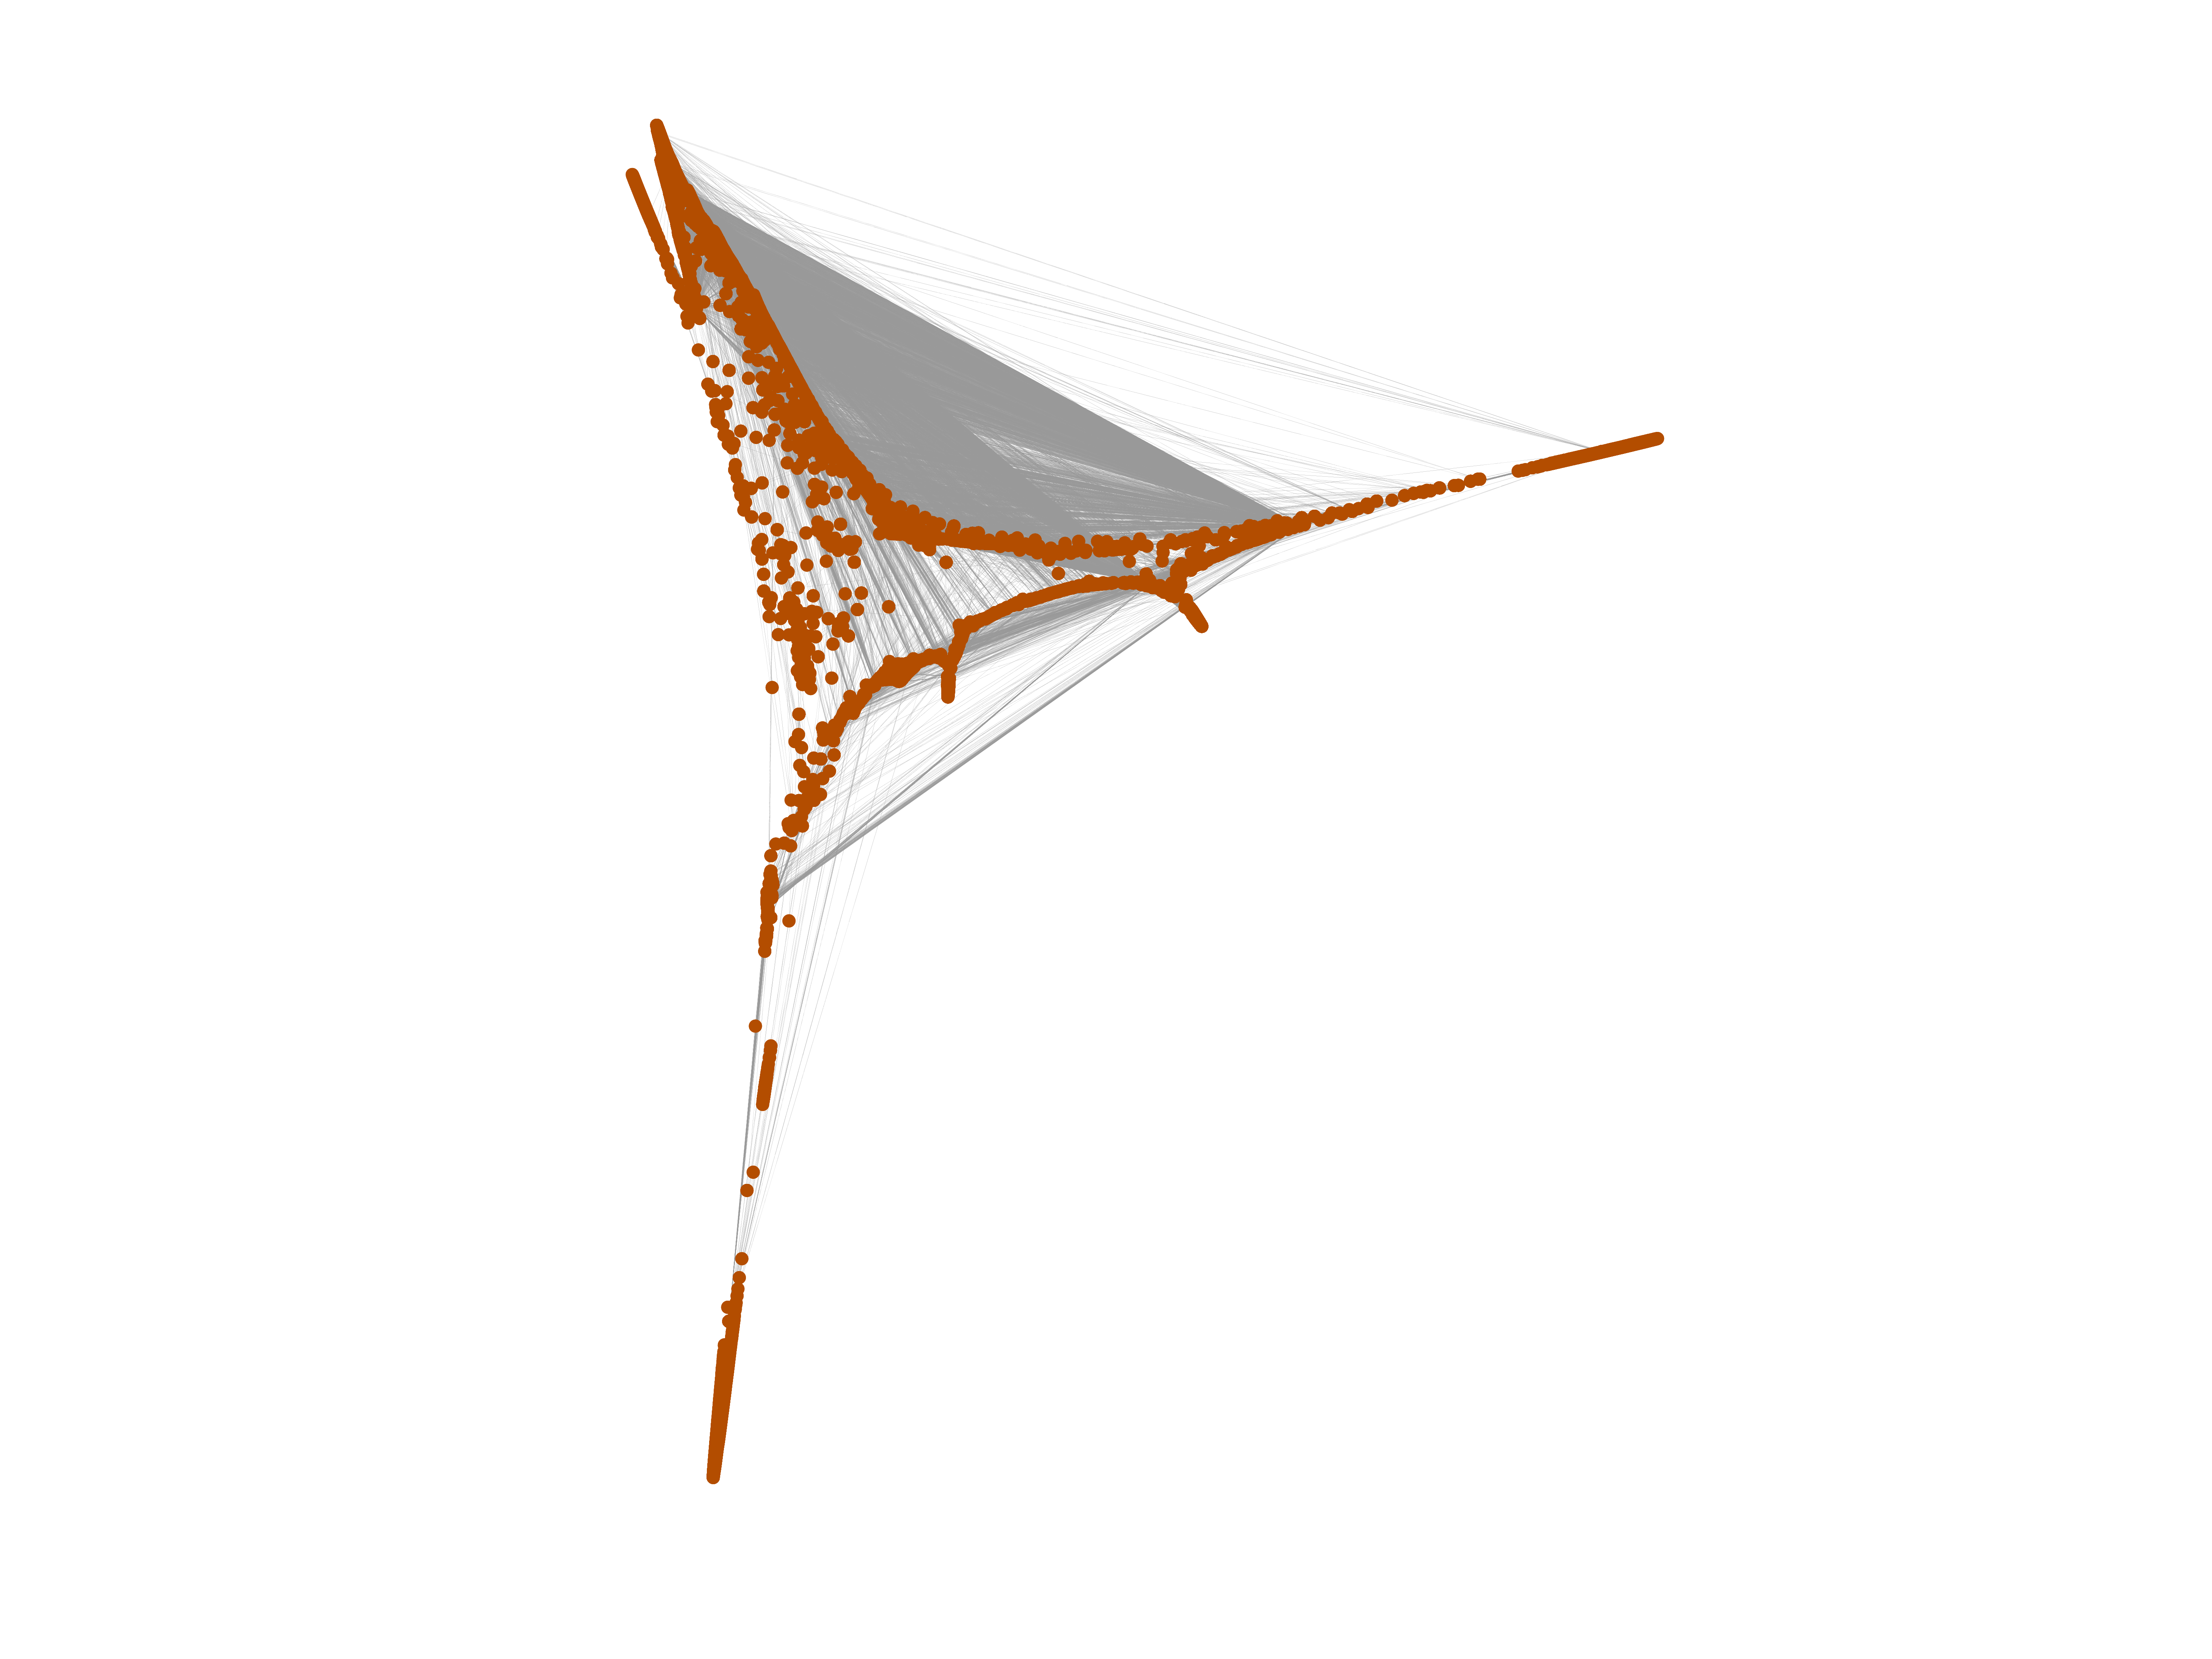
Wikipedia edits (os)
This is the bipartite edit network of the Ossetic Wikipedia. It contains users
and pages from the Ossetic Wikipedia, connected by edit events. Each edge
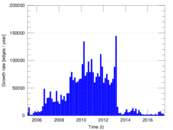
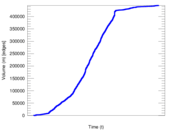
represents an edit. The dataset includes the timestamp of each edit.
Metadata
Statistics
| Size | n = | 41,947
|
| Left size | n1 = | 1,706
|
| Right size | n2 = | 40,241
|
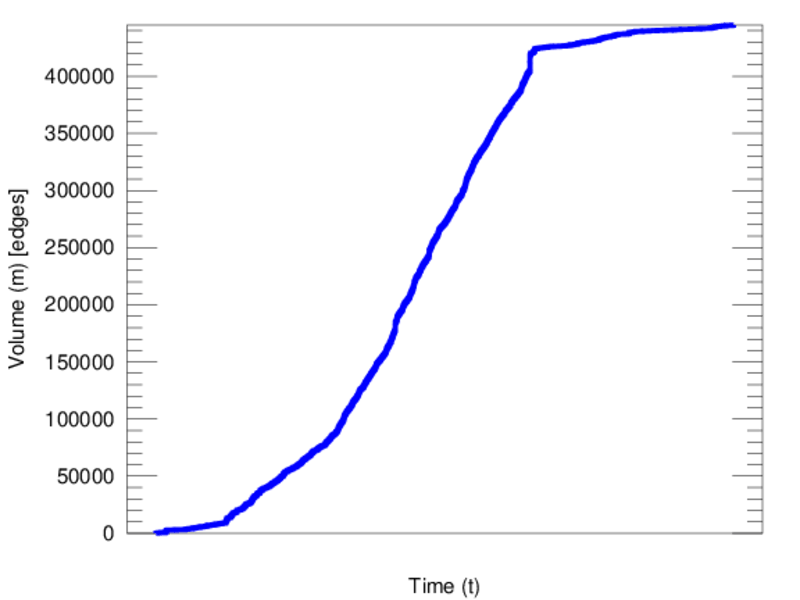
| Volume | m = | 444,794
|
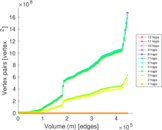
| Unique edge count | m̿ = | 208,537
|
| Wedge count | s = | 576,712,709
|
| Claw count | z = | 1,822,859,877,499
|
| Cross count | x = | 5,635,859,198,855,300
|
| Square count | q = | 1,127,999,786
|
| 4-Tour count | T4 = | 11,331,578,646
|
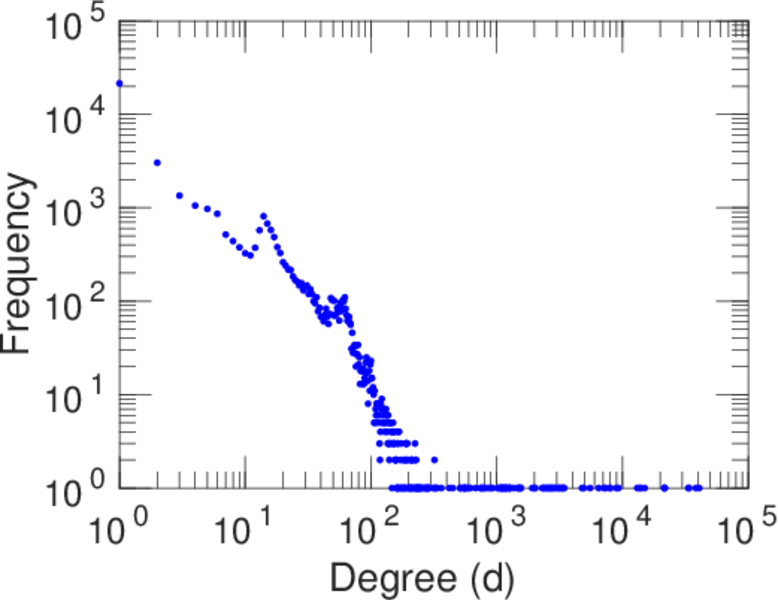
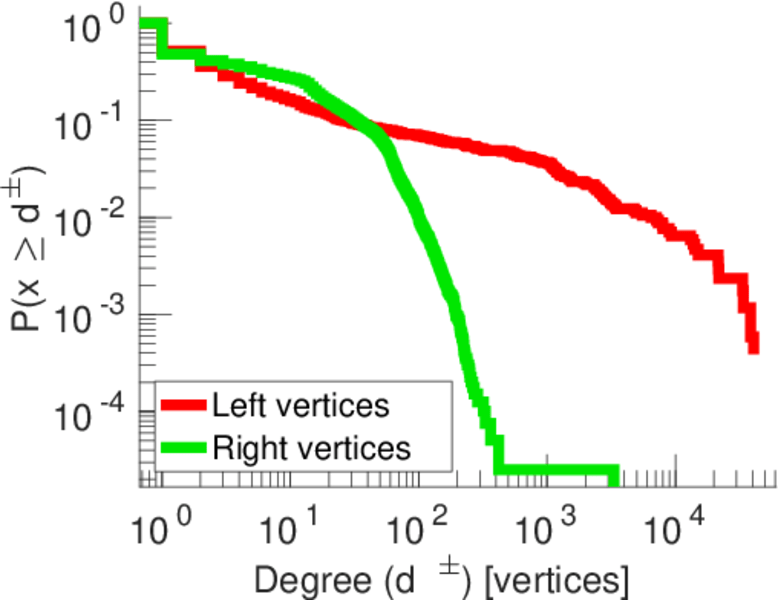
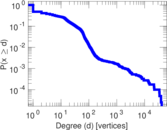
| Maximum degree | dmax = | 40,866
|
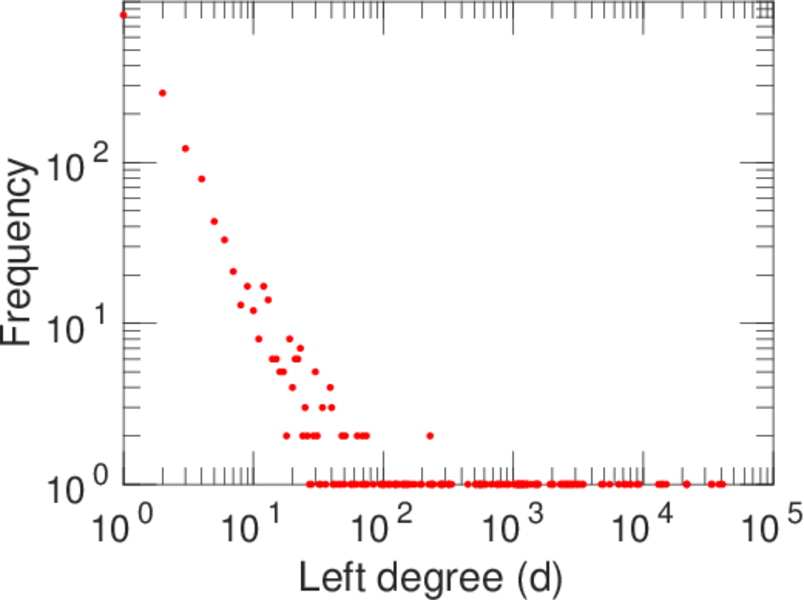
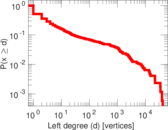
| Maximum left degree | d1max = | 40,866
|
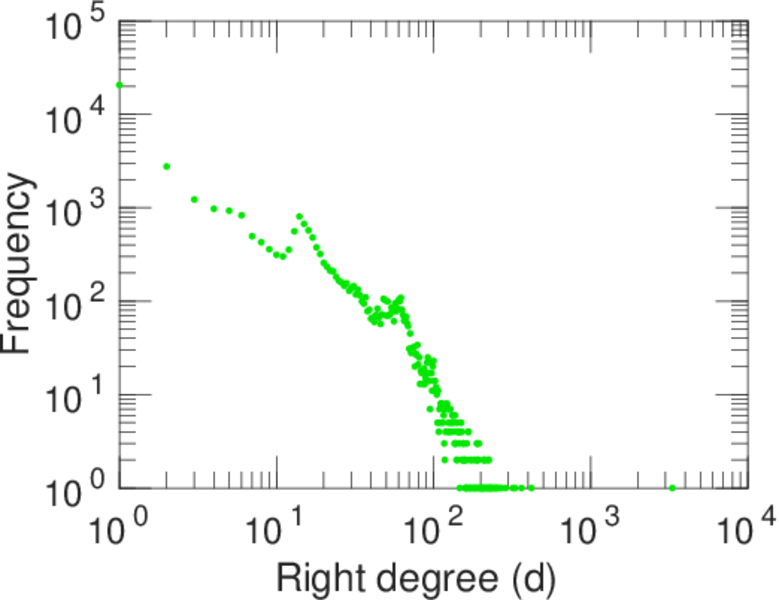
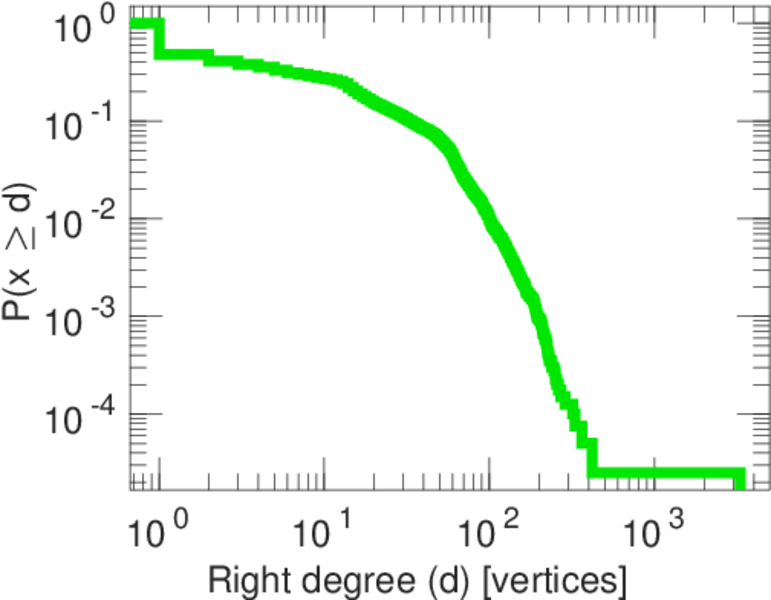
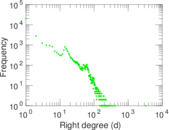
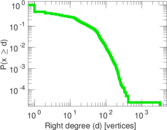
| Maximum right degree | d2max = | 3,317
|
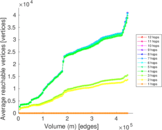
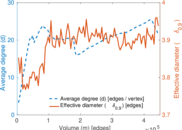
| Average degree | d = | 21.207 4
|
| Average left degree | d1 = | 260.723
|
| Average right degree | d2 = | 11.053 3
|
| Fill | p = | 0.003 037 63
|
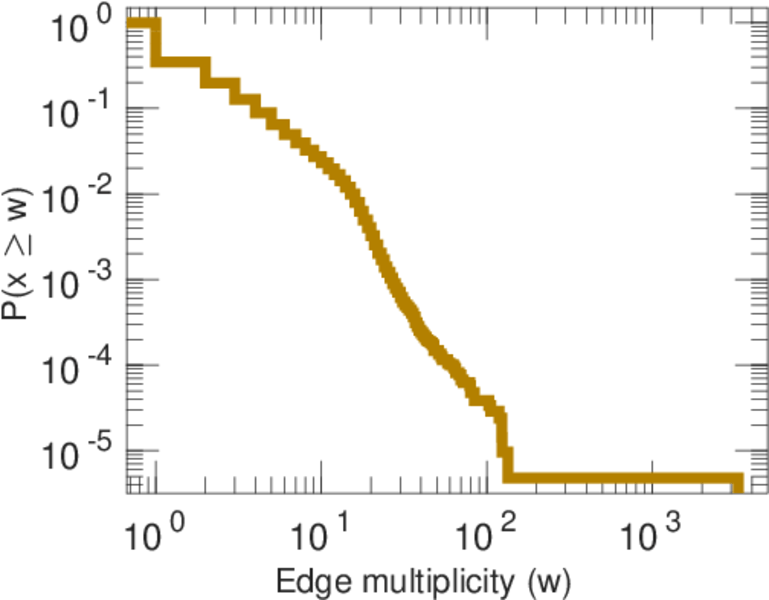
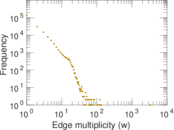
| Average edge multiplicity | m̃ = | 2.132 93
|
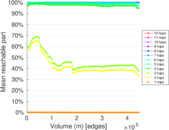
| Size of LCC | N = | 40,917
|
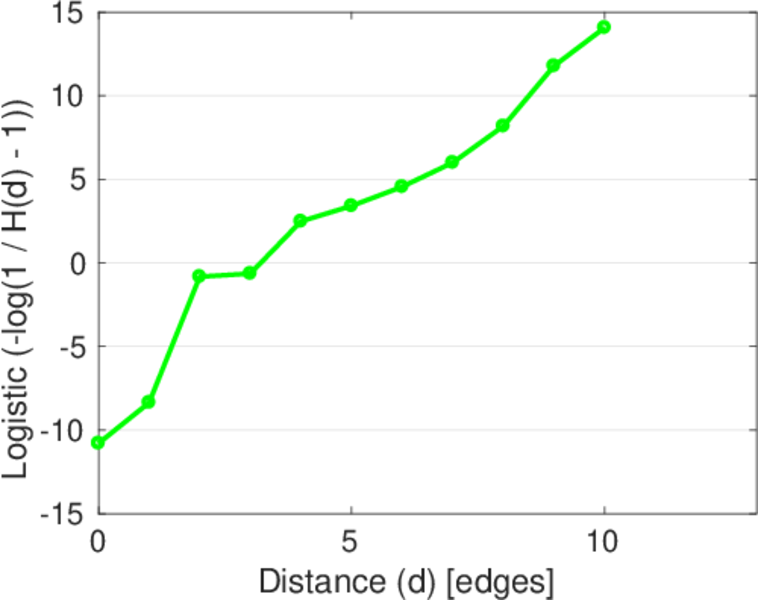
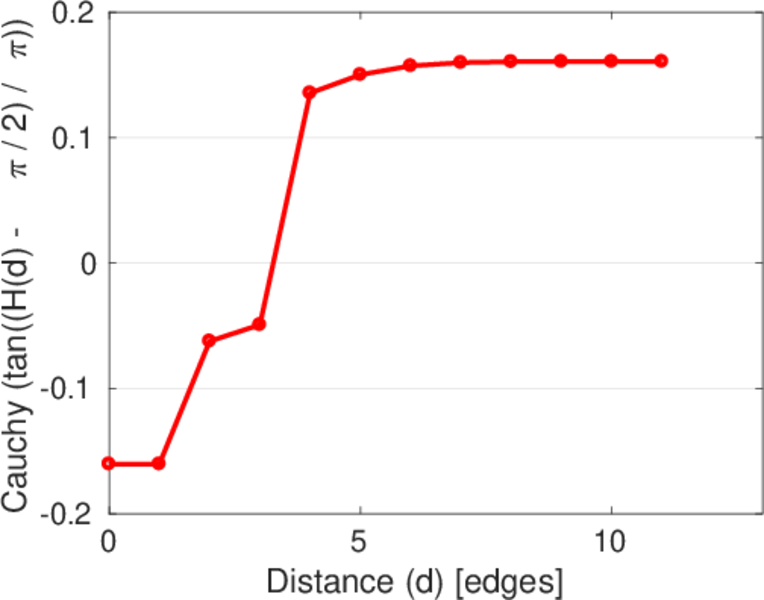
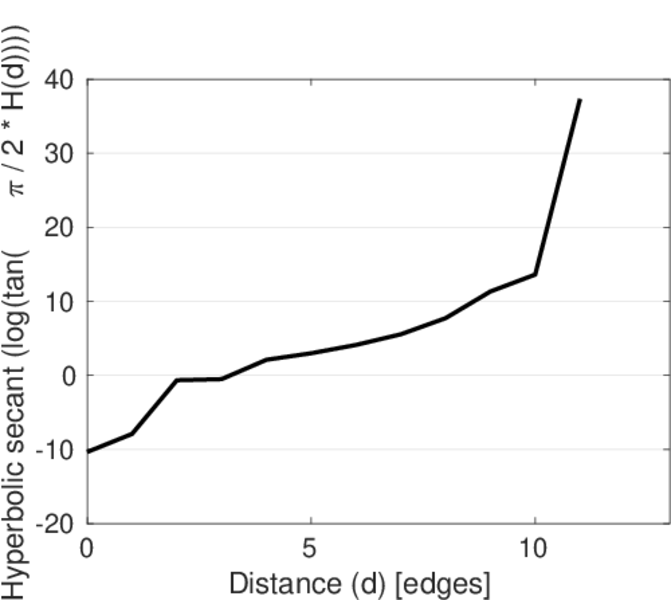
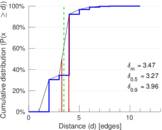
| Diameter | δ = | 12
|
| 50-Percentile effective diameter | δ0.5 = | 3.268 32
|
| 90-Percentile effective diameter | δ0.9 = | 3.960 28
|
| Median distance | δM = | 4
|
| Mean distance | δm = | 3.473 15
|
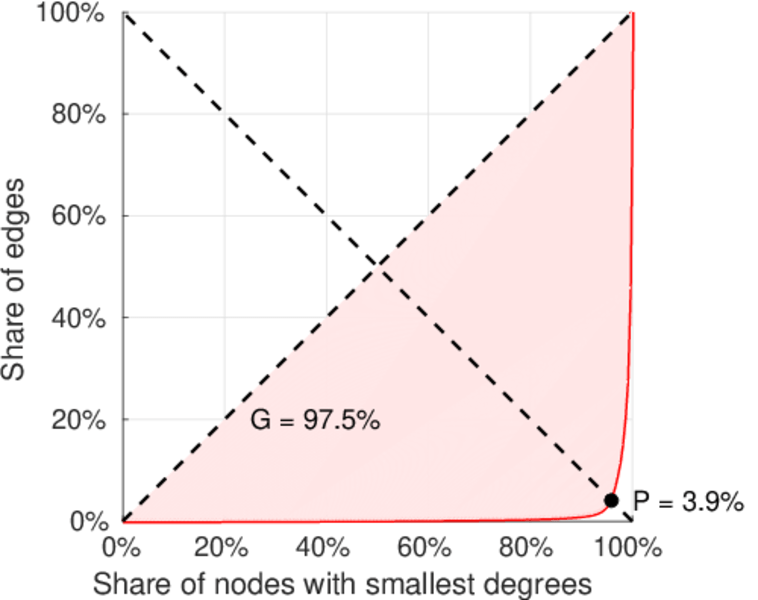
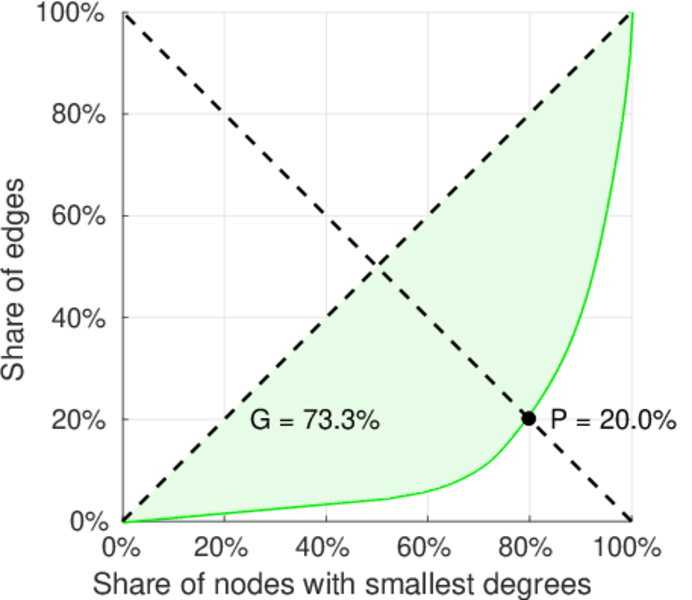
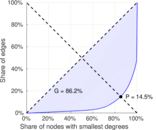
| Gini coefficient | G = | 0.864 274
|
| Balanced inequality ratio | P = | 0.148 635
|
| Left balanced inequality ratio | P1 = | 0.039 135 0
|
| Right balanced inequality ratio | P2 = | 0.200 156
|
| Relative edge distribution entropy | Her = | 0.725 728
|
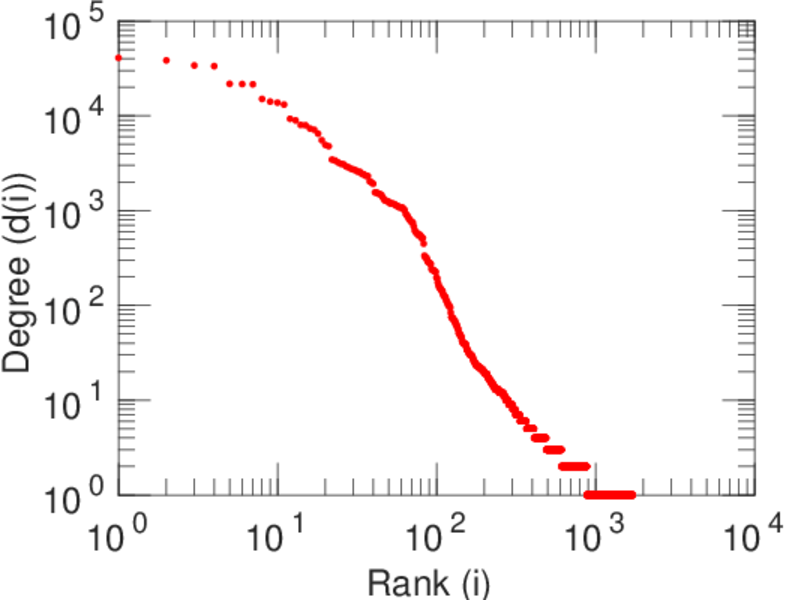
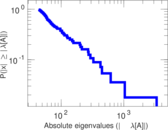
| Power law exponent | γ = | 2.135 83
|
| Tail power law exponent | γt = | 3.091 00
|
| Tail power law exponent with p | γ3 = | 3.091 00
|
| p-value | p = | 0.000 00
|
| Left tail power law exponent with p | γ3,1 = | 1.441 00
|
| Left p-value | p1 = | 0.000 00
|
| Right tail power law exponent with p | γ3,2 = | 7.541 00
|
| Right p-value | p2 = | 0.126 000
|
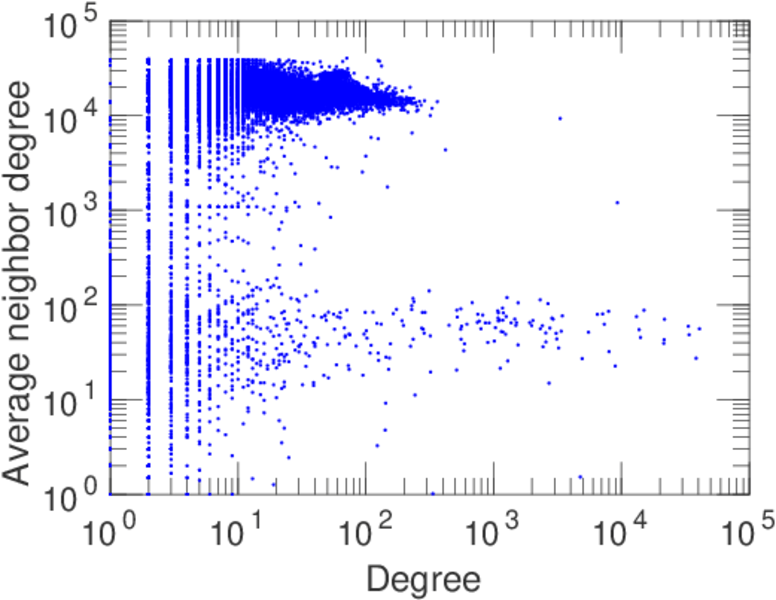
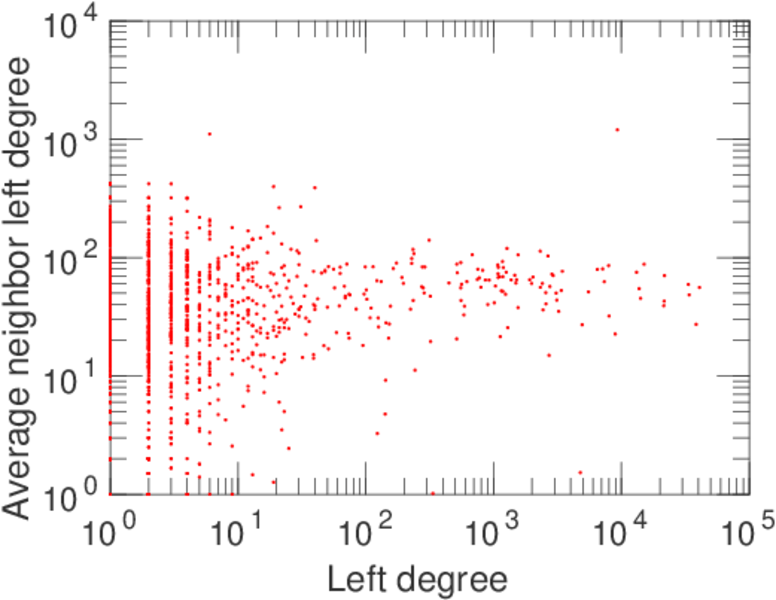
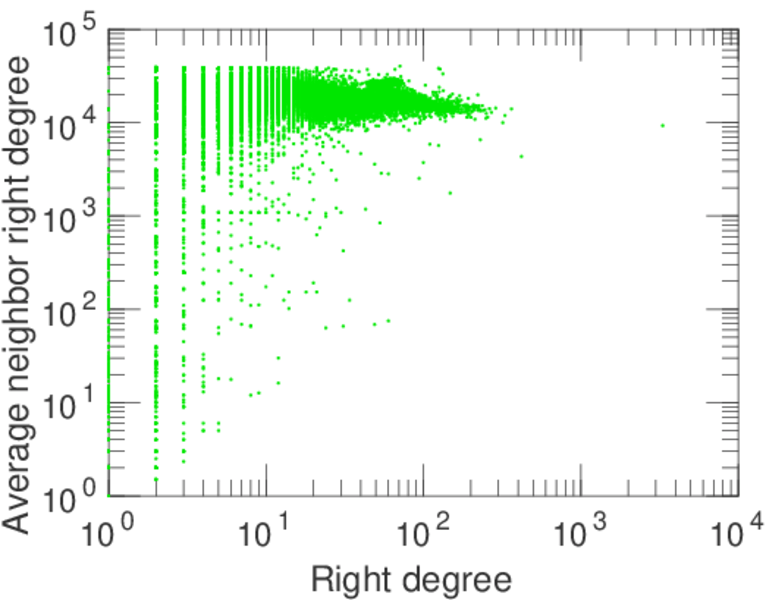
| Degree assortativity | ρ = | −0.351 416
|
| Degree assortativity p-value | pρ = | 0.000 00
|
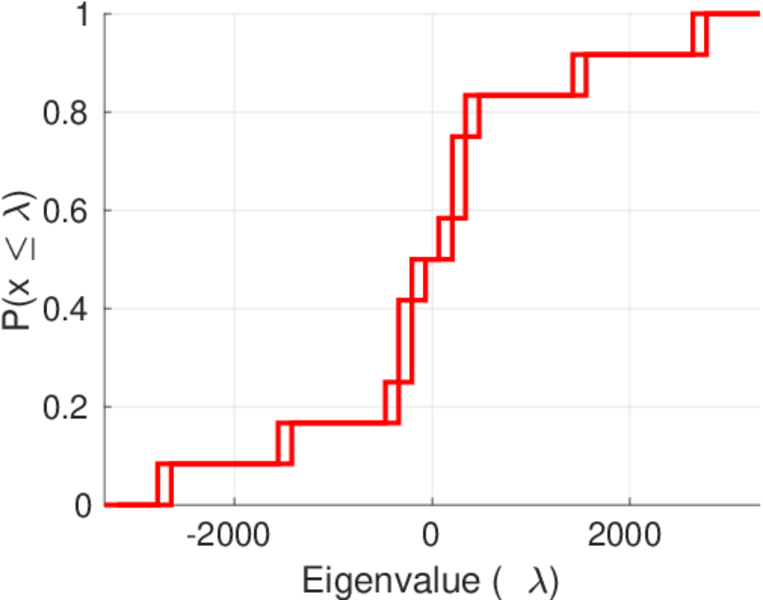
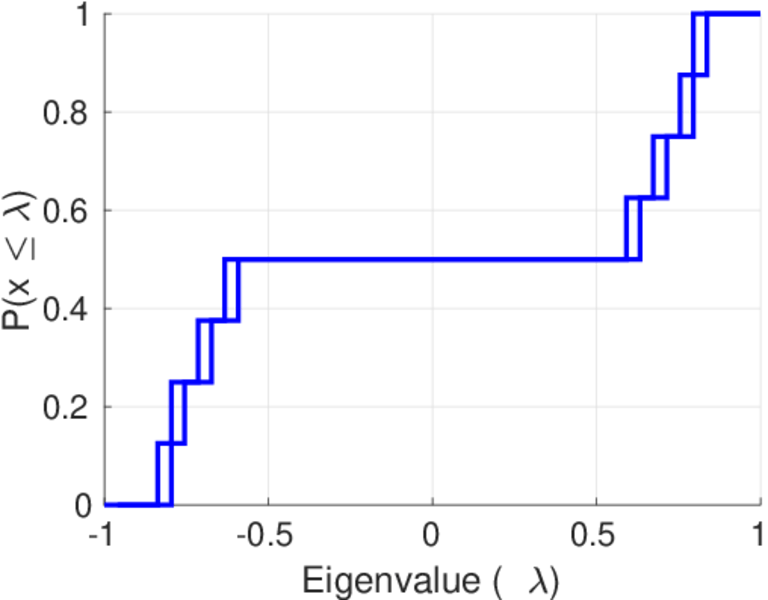
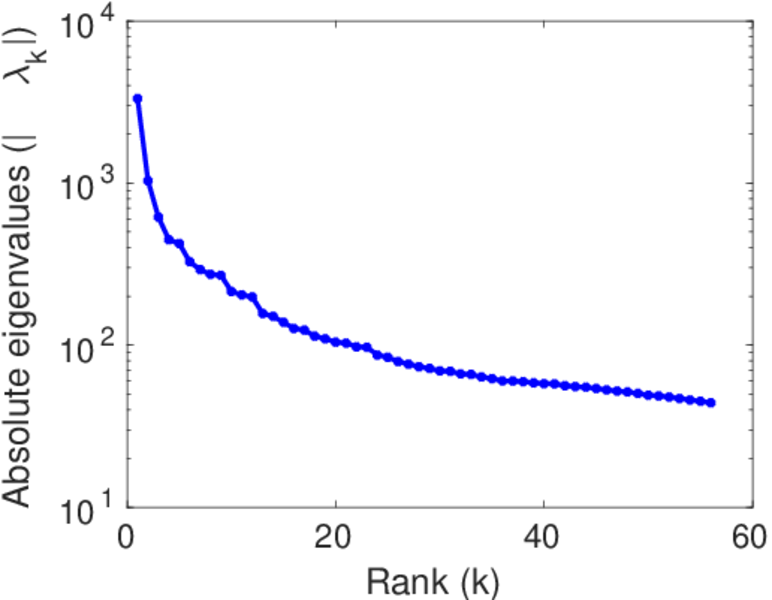
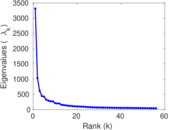
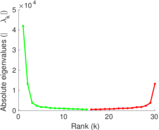
| Spectral norm | α = | 3,316.18
|
| Algebraic connectivity | a = | 0.001 393 69
|
| Spectral separation | |λ1[A] / λ2[A]| = | 3.208 05
|
| Controllability | C = | 38,237
|
| Relative controllability | Cr = | 0.923 465
|
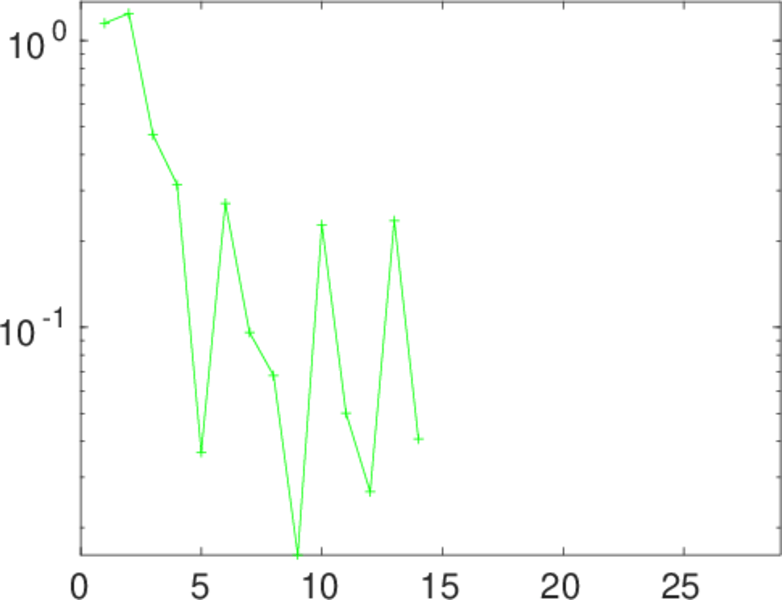
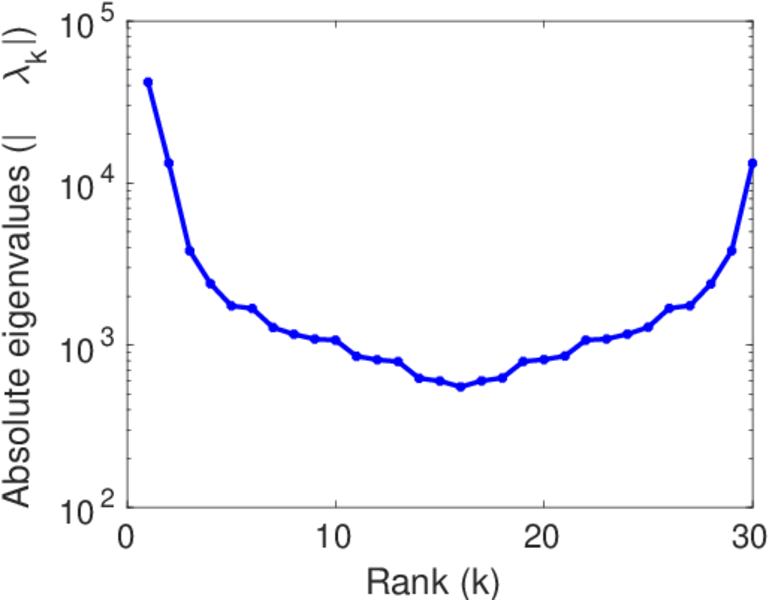
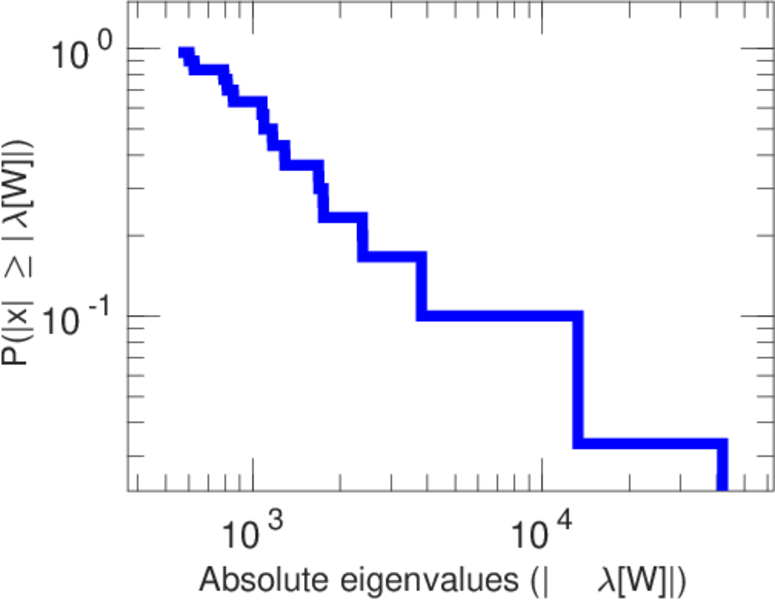
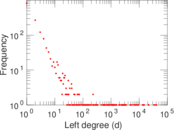
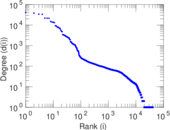
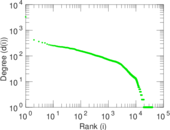
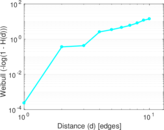
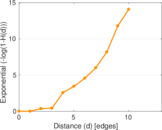
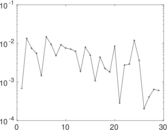
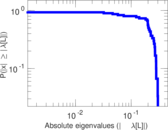
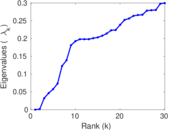
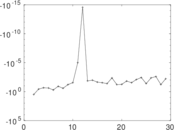
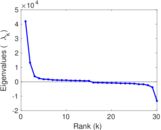
Plots


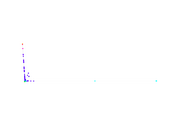


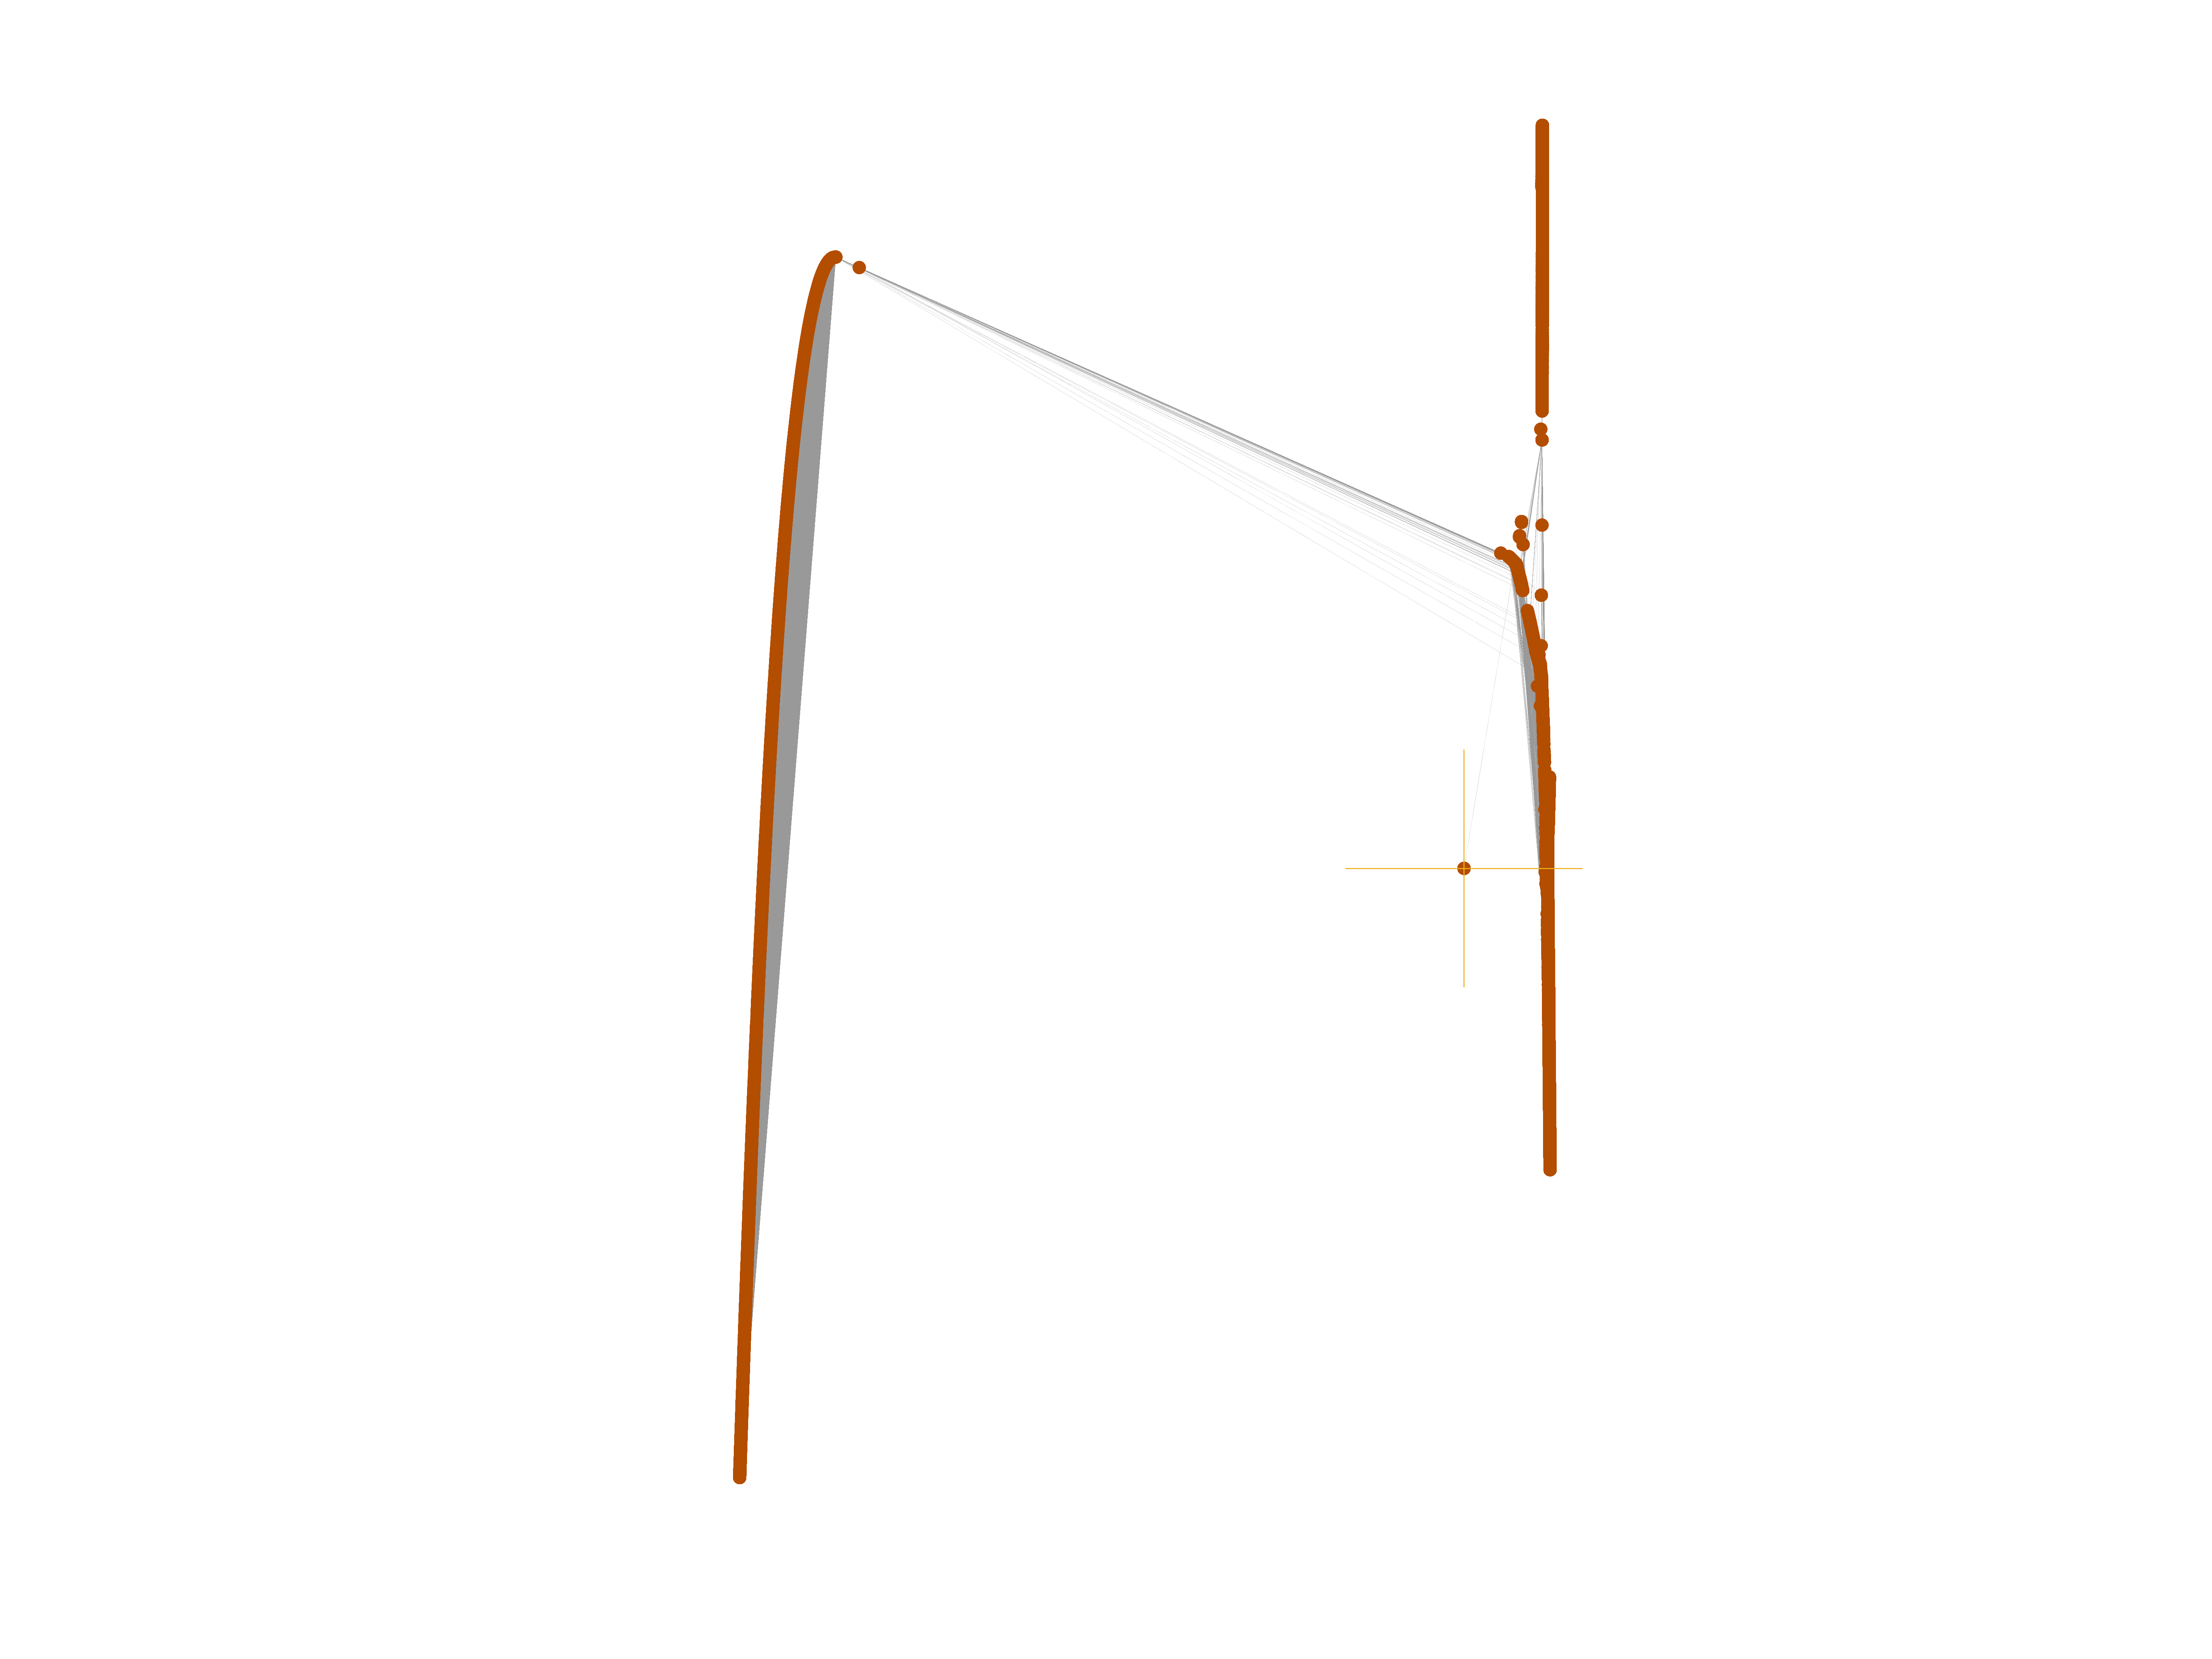
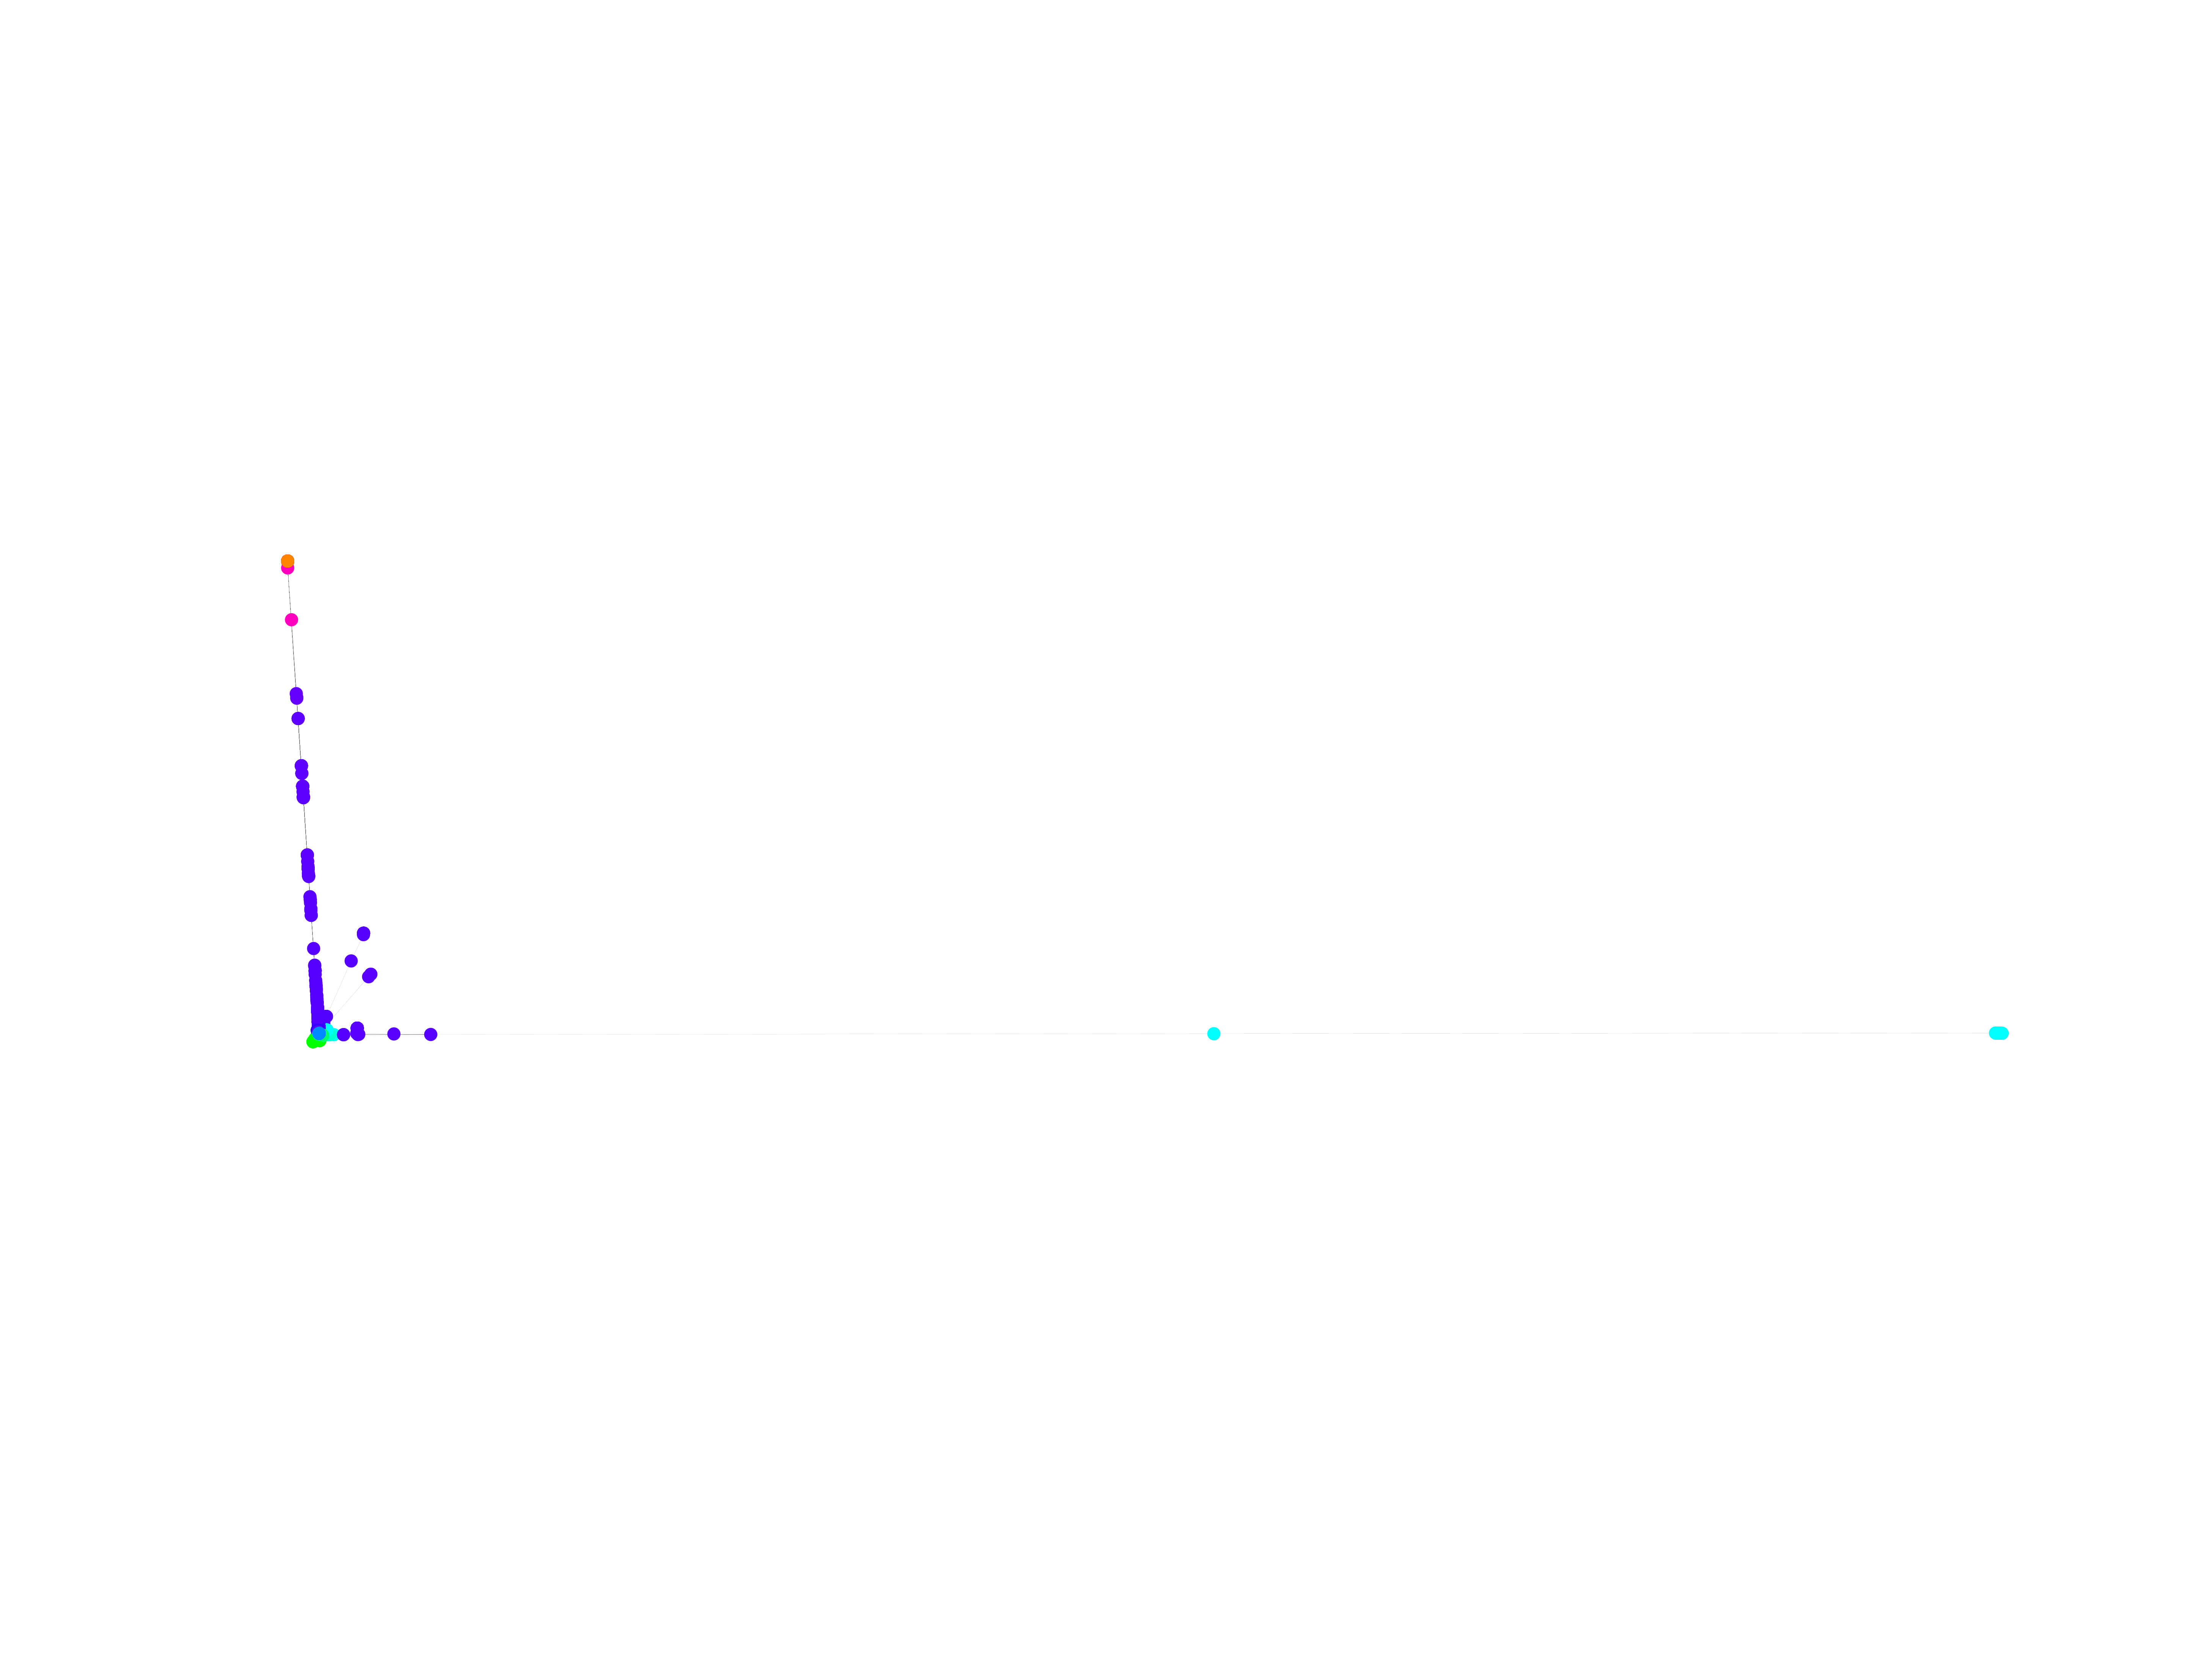
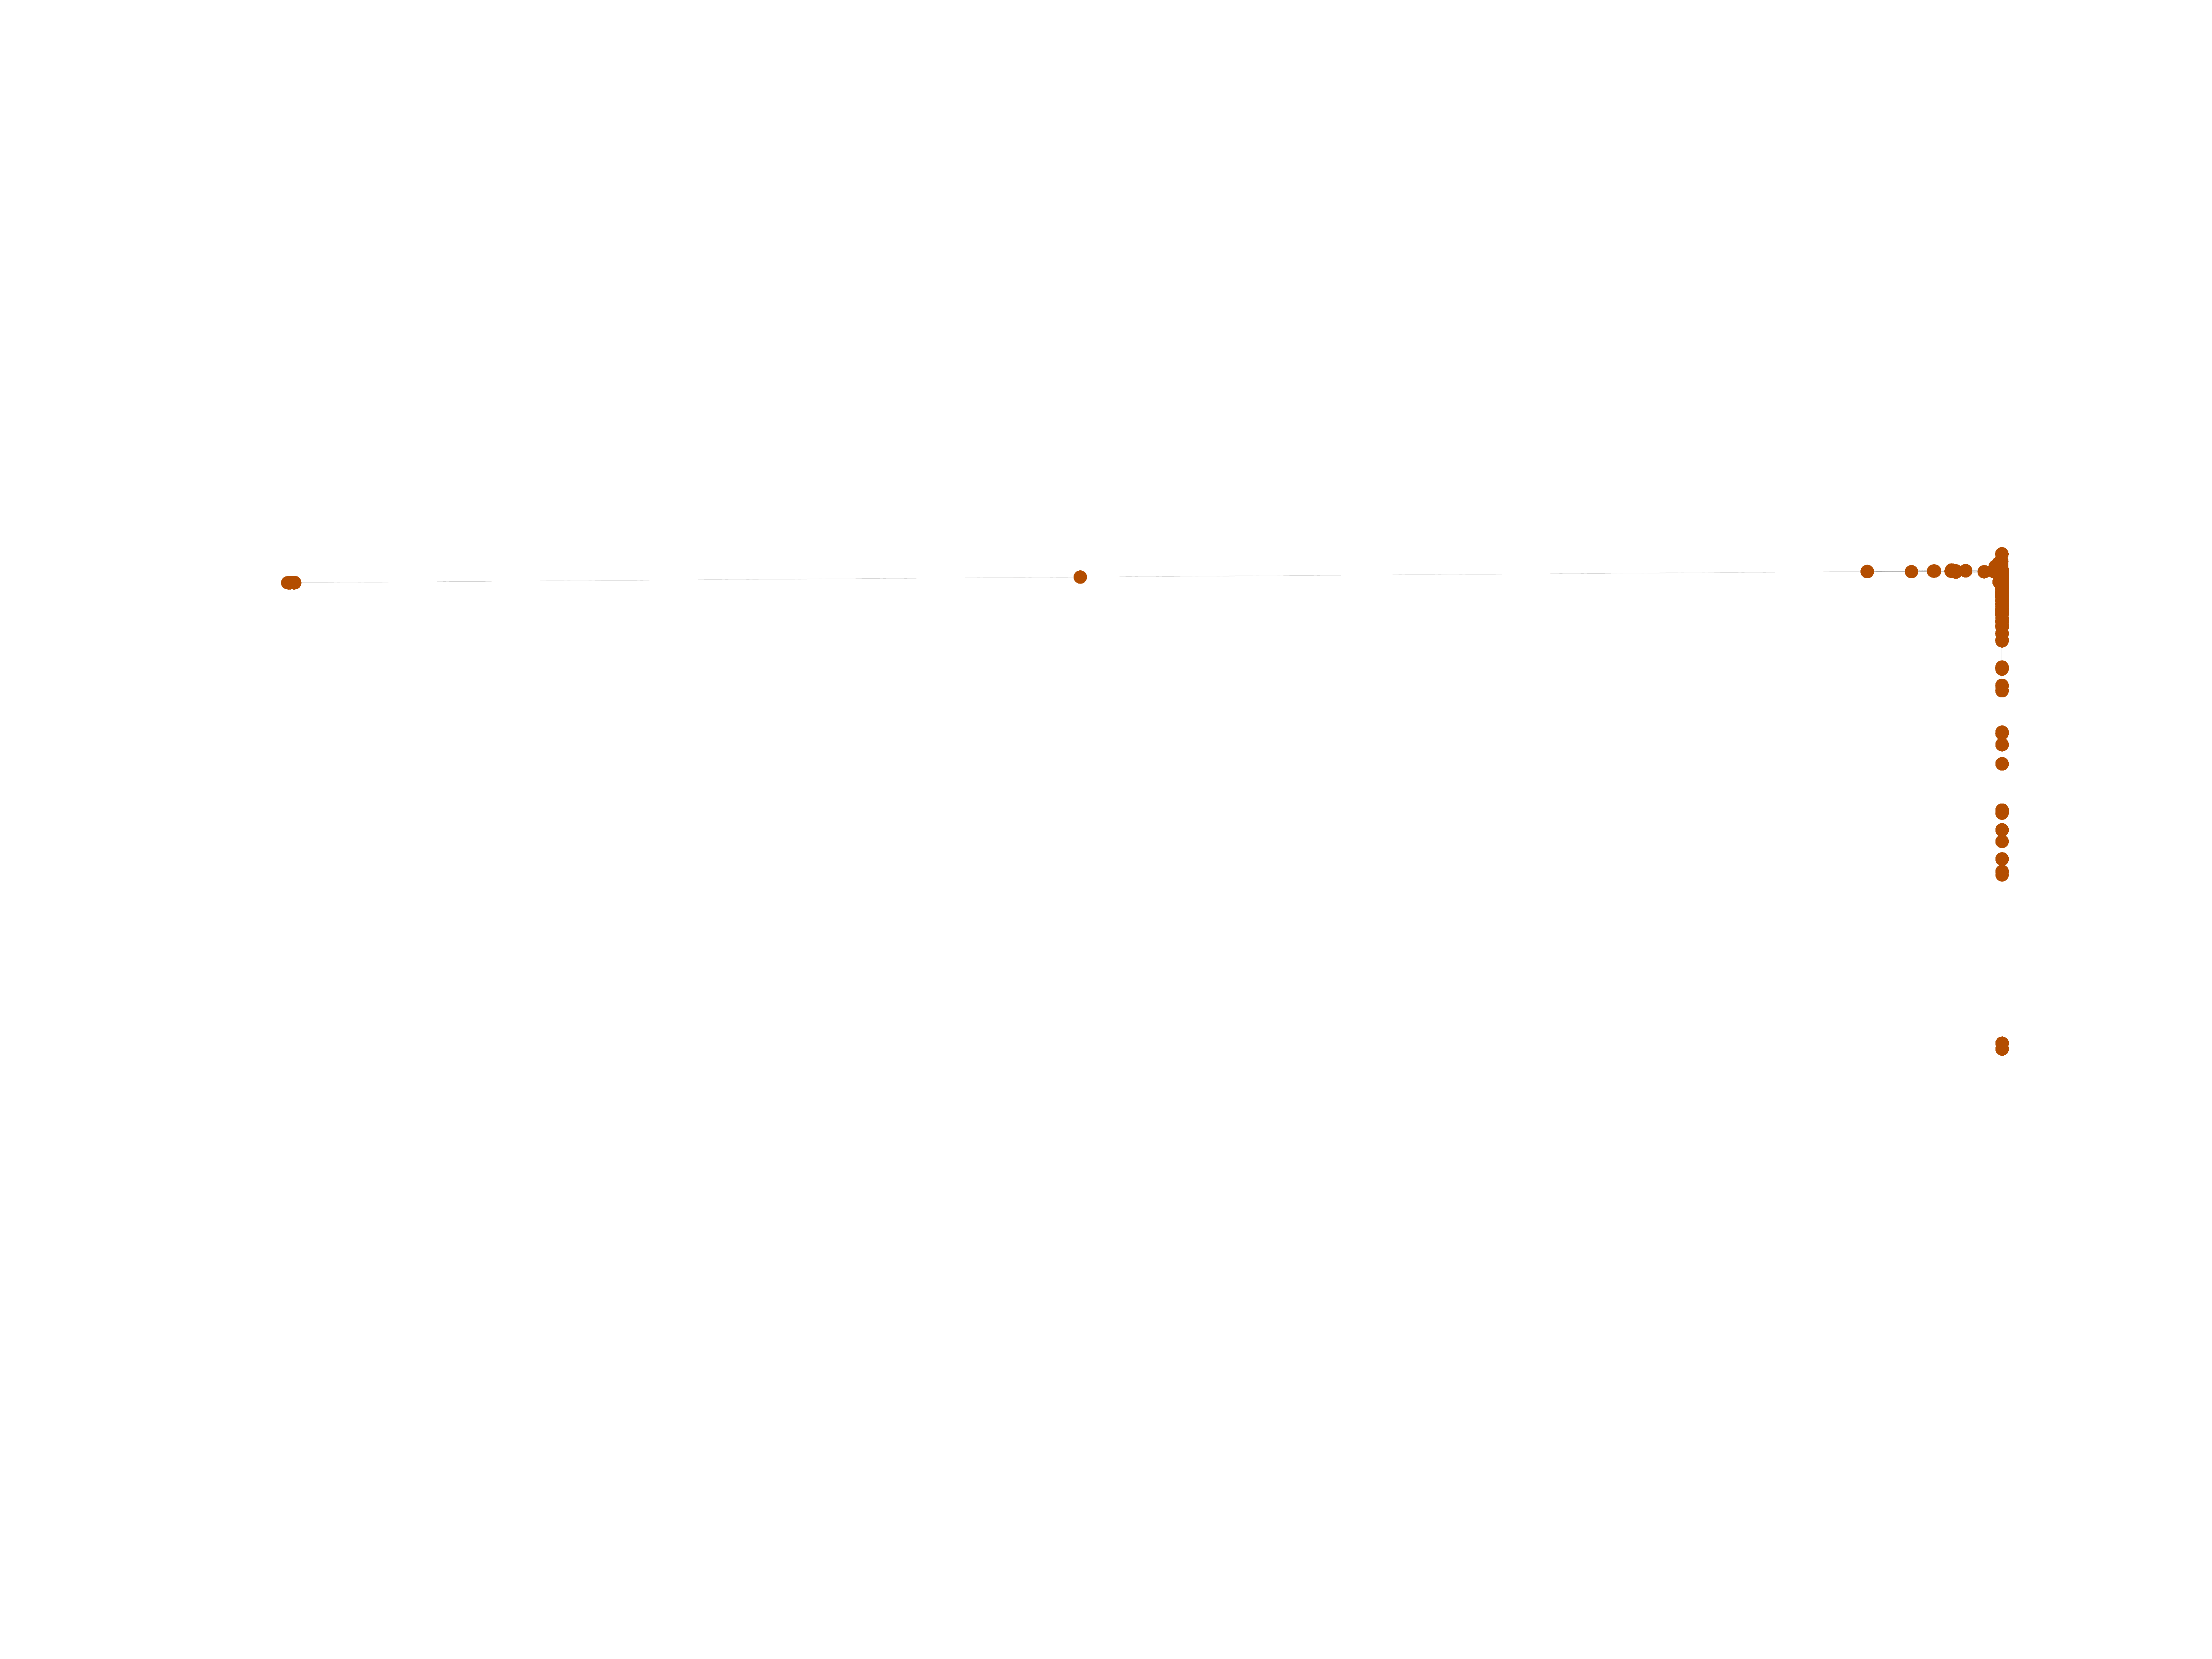
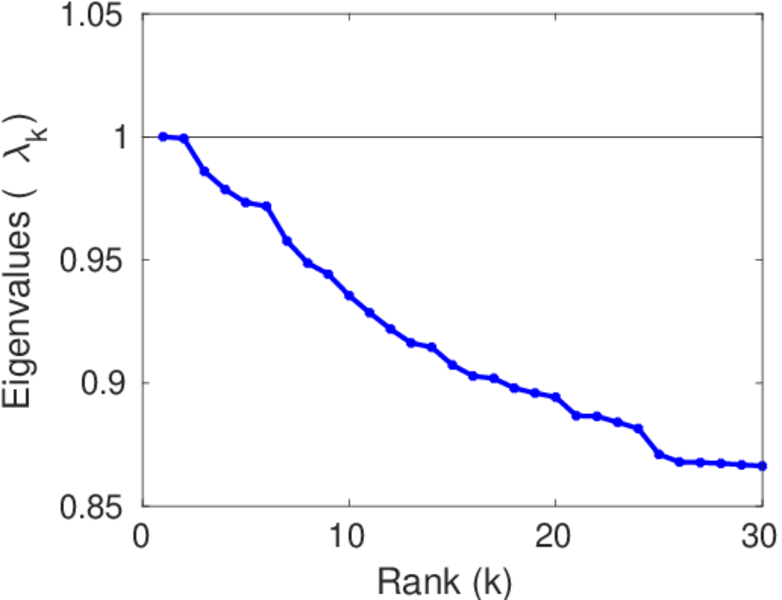
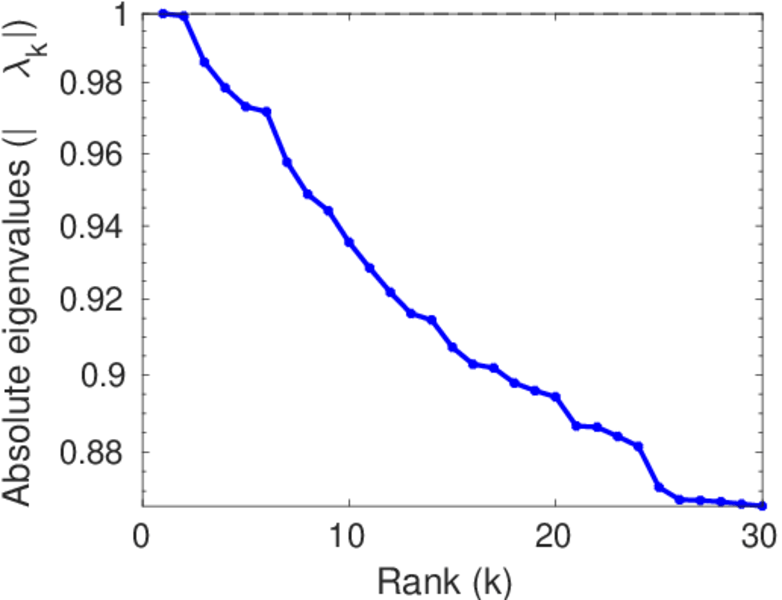
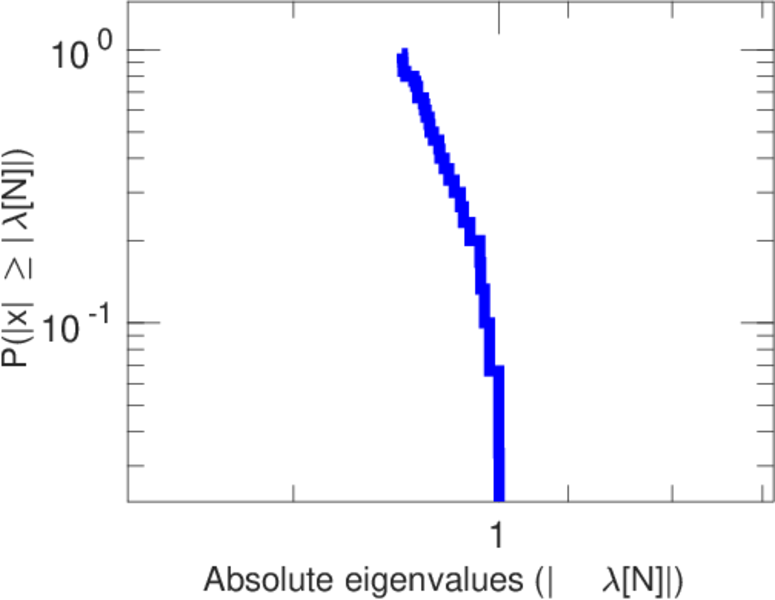
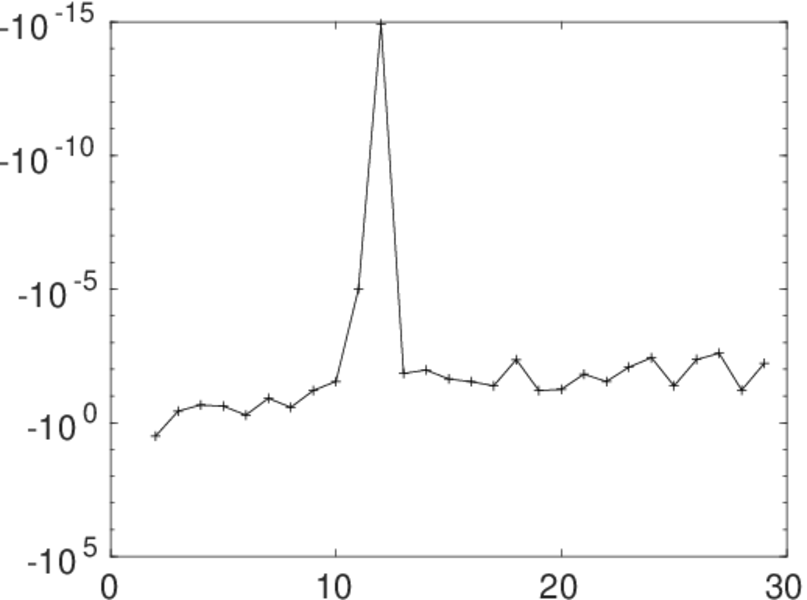
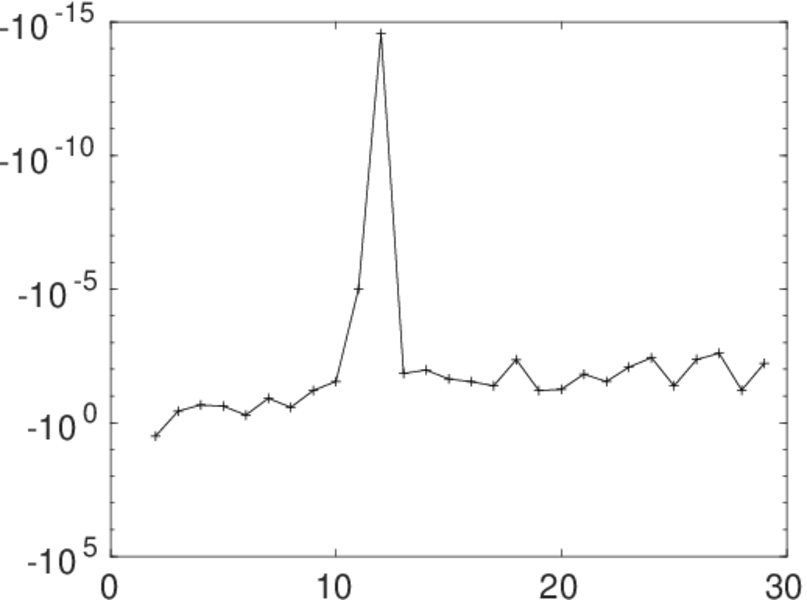
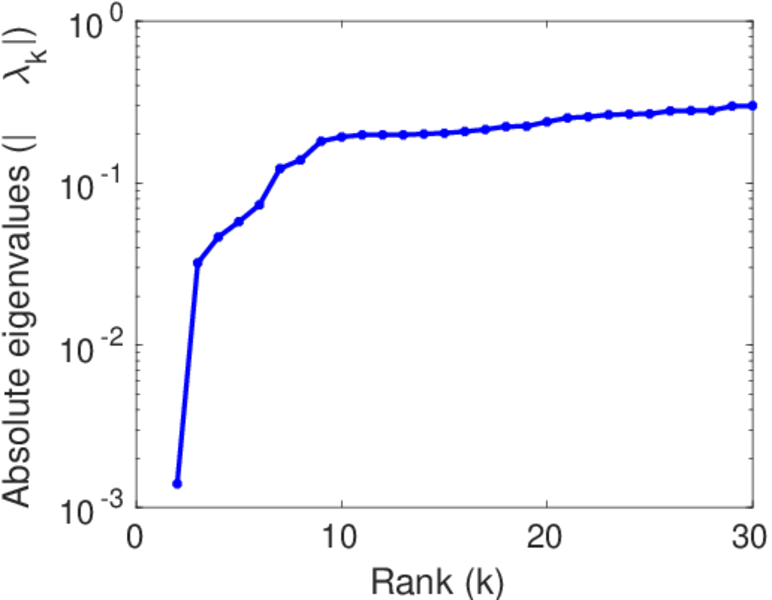
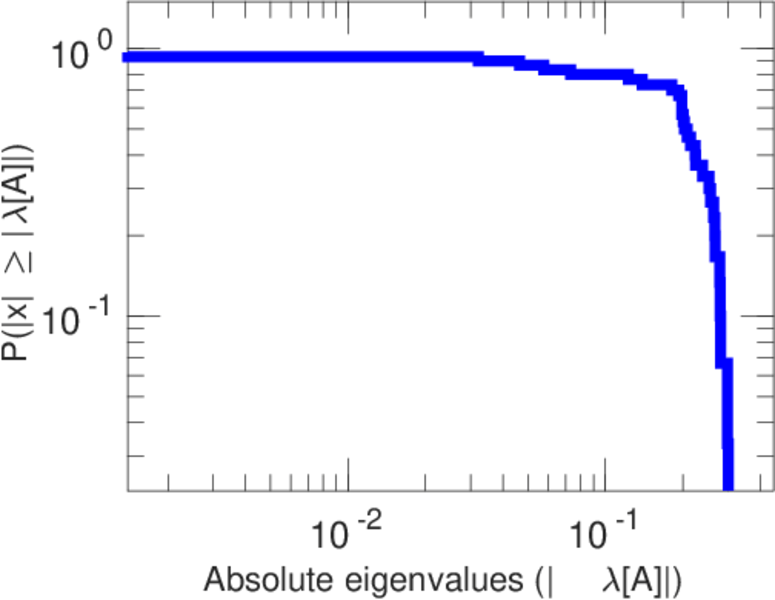
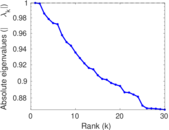
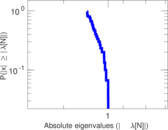
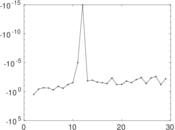
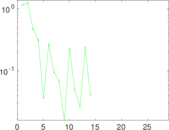
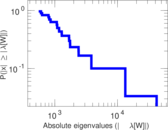
Matrix decompositions plots


Downloads
References
|
[1]
|
Jérôme Kunegis.
KONECT – The Koblenz Network Collection.
In Proc. Int. Conf. on World Wide Web Companion, pages
1343–1350, 2013.
[ http ]
|
|
[2]
|
Wikimedia Foundation.
Wikimedia downloads.
http://dumps.wikimedia.org/, January 2010.
|
 KONECT ‣ Networks ‣
Buy Me a Coffee
KONECT ‣ Networks ‣
Buy Me a Coffee