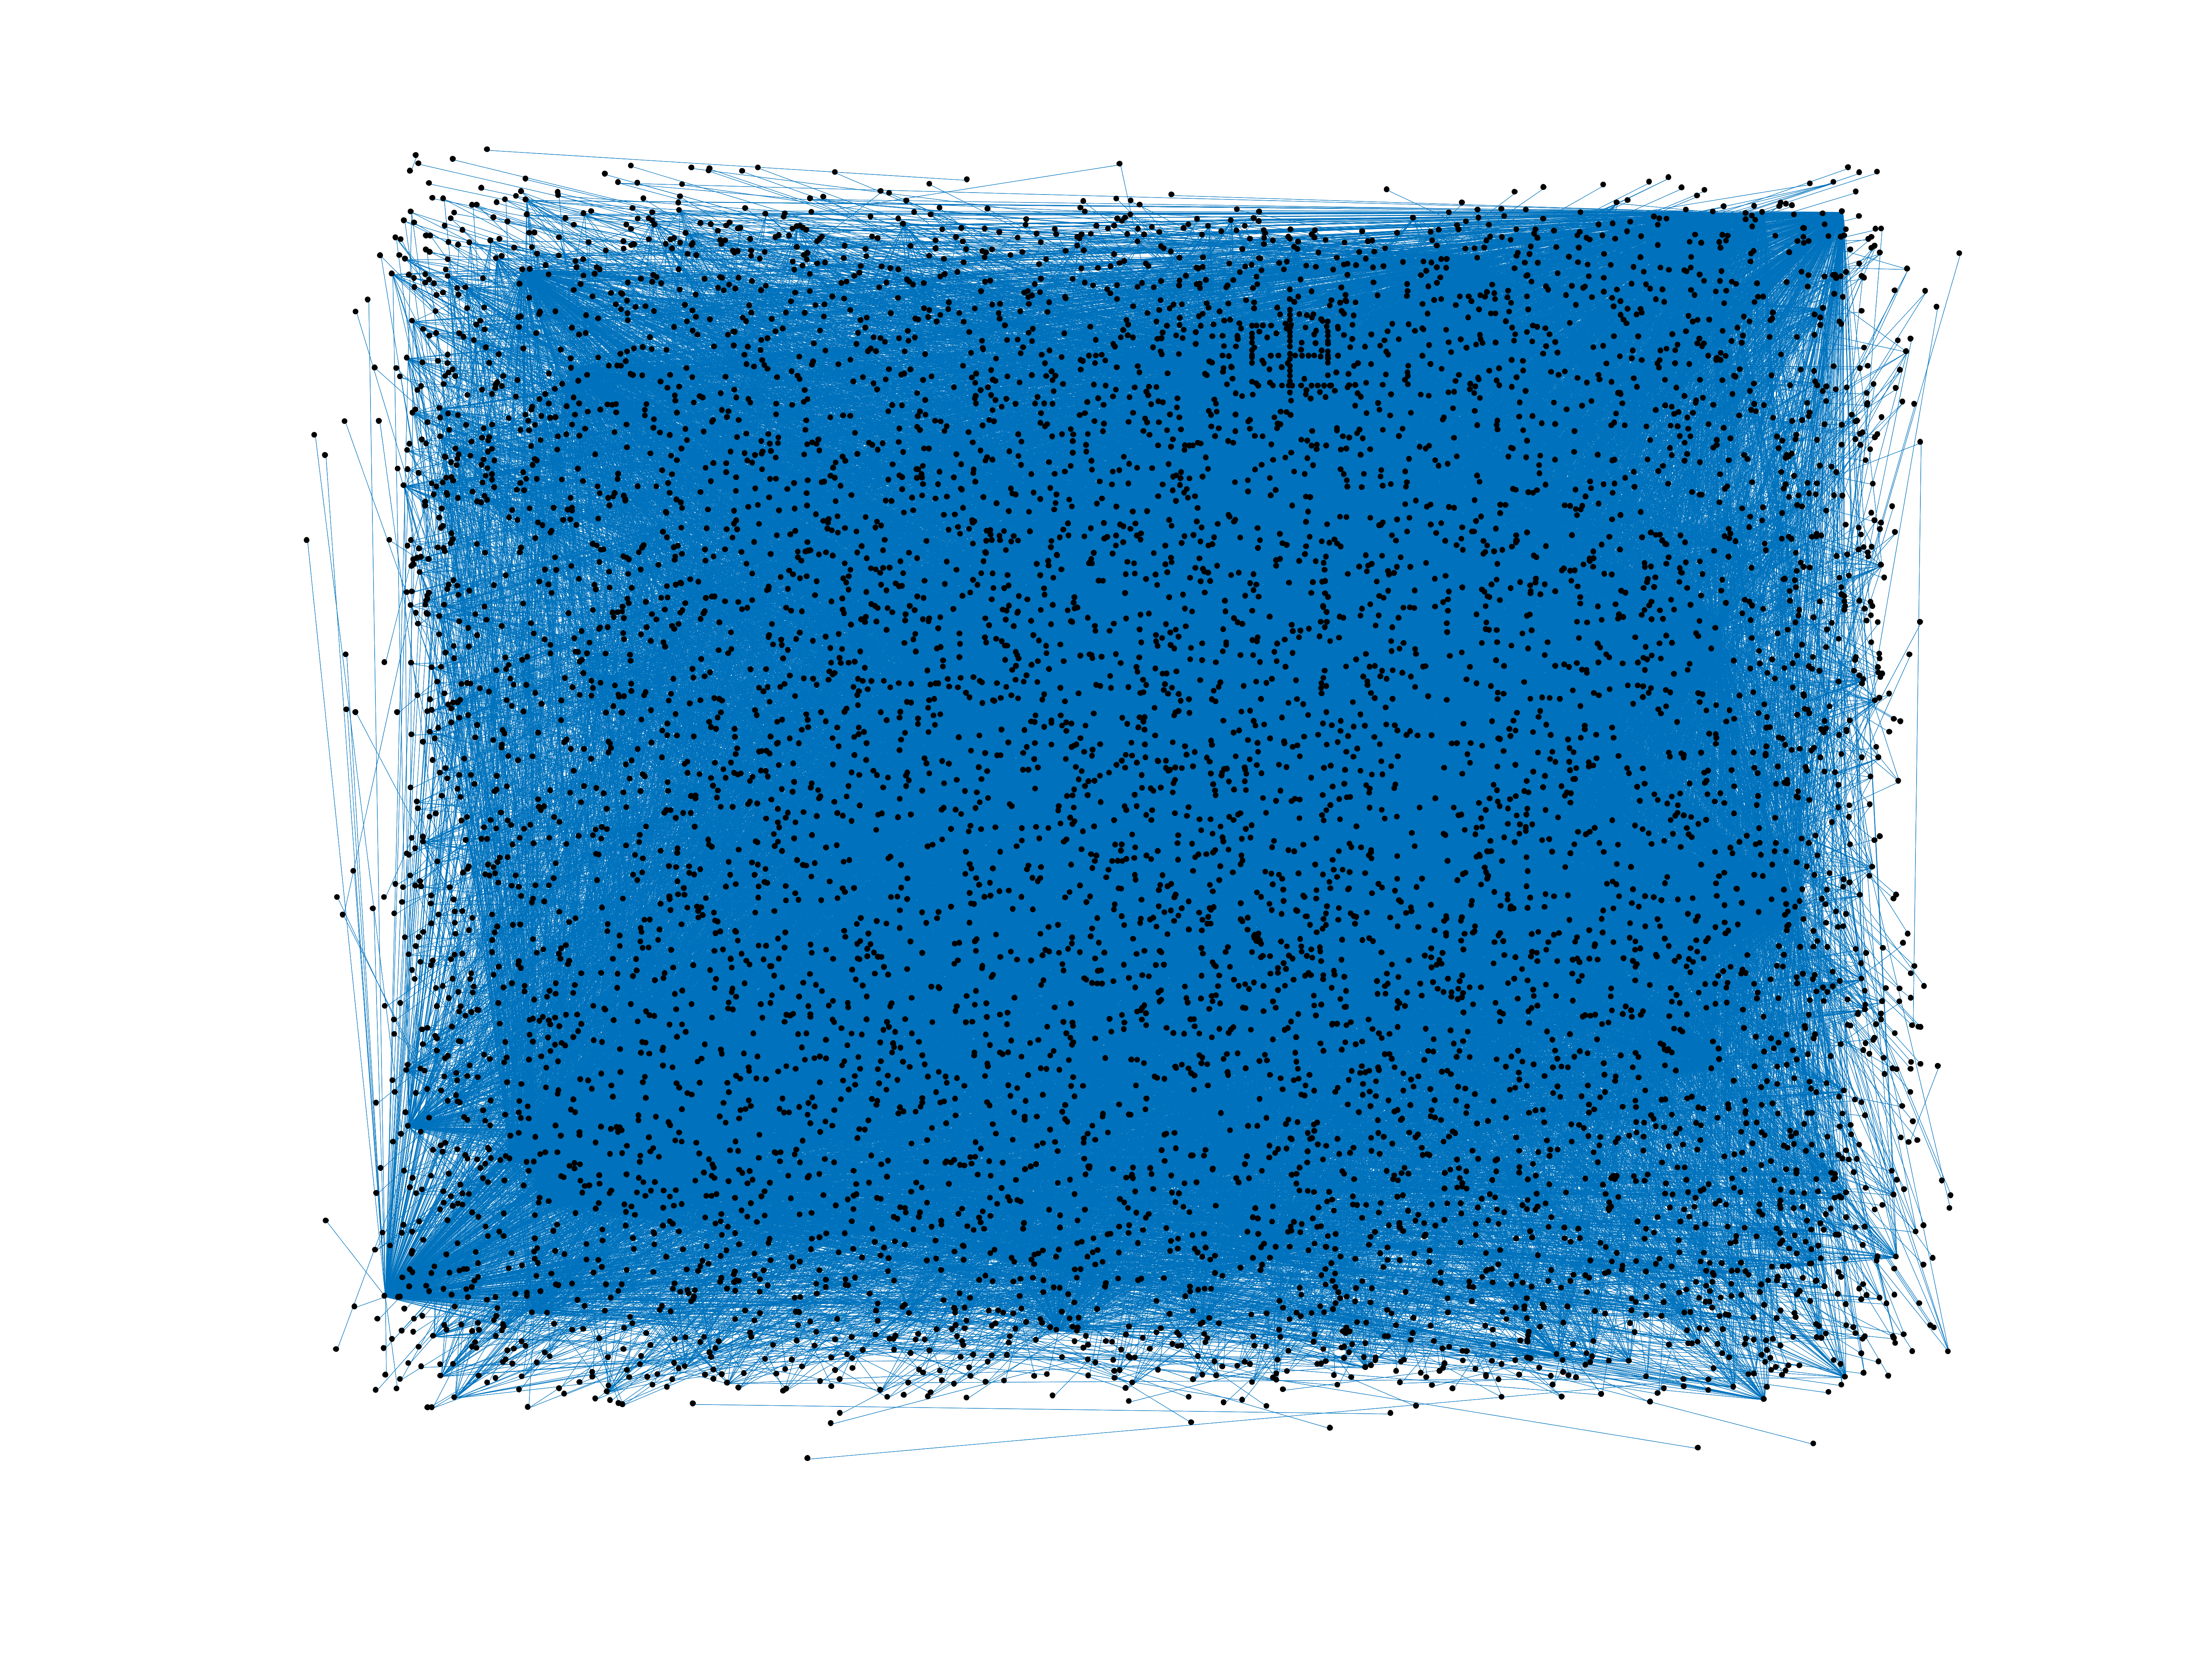
Wikipedia edits (pag)
This is the bipartite edit network of the Pangasinan Wikipedia. It contains
users and pages from the Pangasinan Wikipedia, connected by edit events. Each
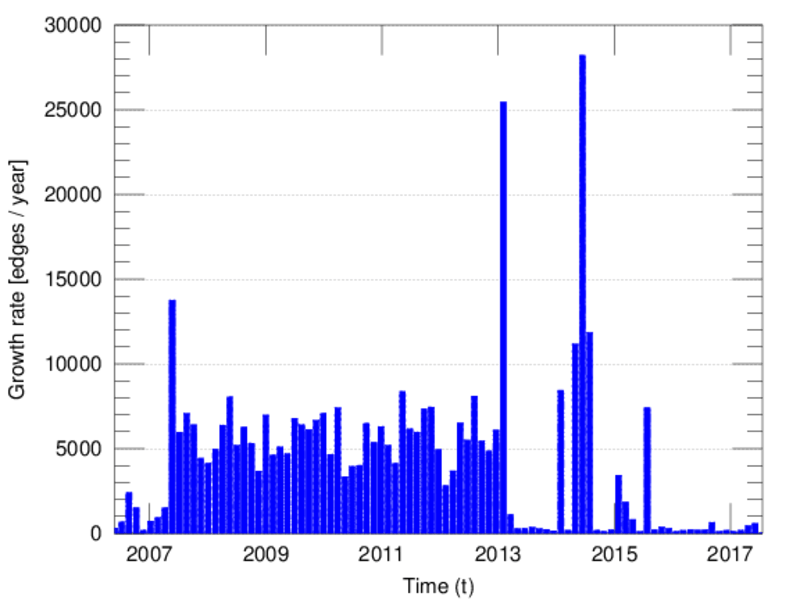
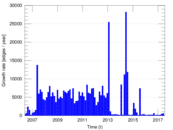
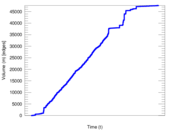
edge represents an edit. The dataset includes the timestamp of each edit.
Metadata
Statistics
| Size | n = | 7,853
|
| Left size | n1 = | 624
|
| Right size | n2 = | 7,229
|
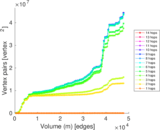
| Volume | m = | 47,678
|
| Unique edge count | m̿ = | 23,593
|
| Wedge count | s = | 10,395,906
|
| Claw count | z = | 5,896,190,430
|
| Cross count | x = | 3,283,183,710,901
|
| Square count | q = | 14,180,520
|
| 4-Tour count | T4 = | 155,096,034
|
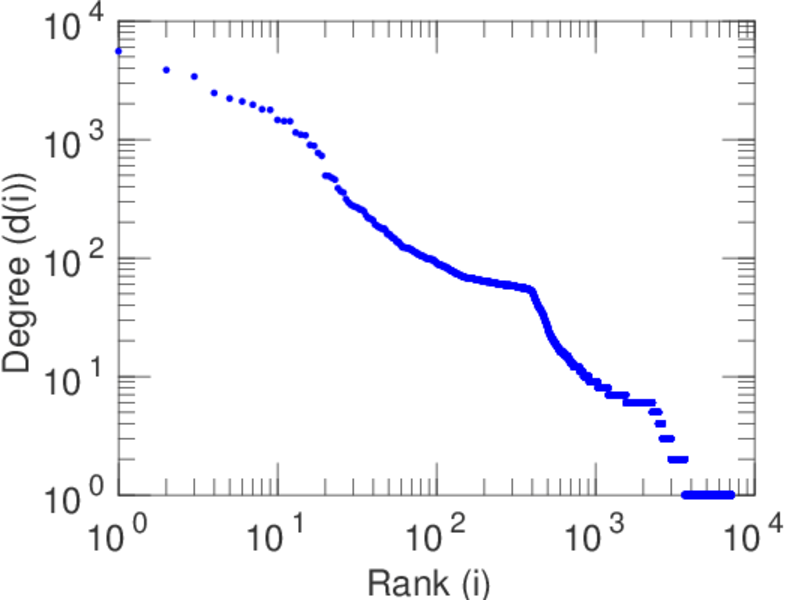
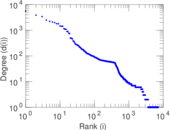
| Maximum degree | dmax = | 5,558
|
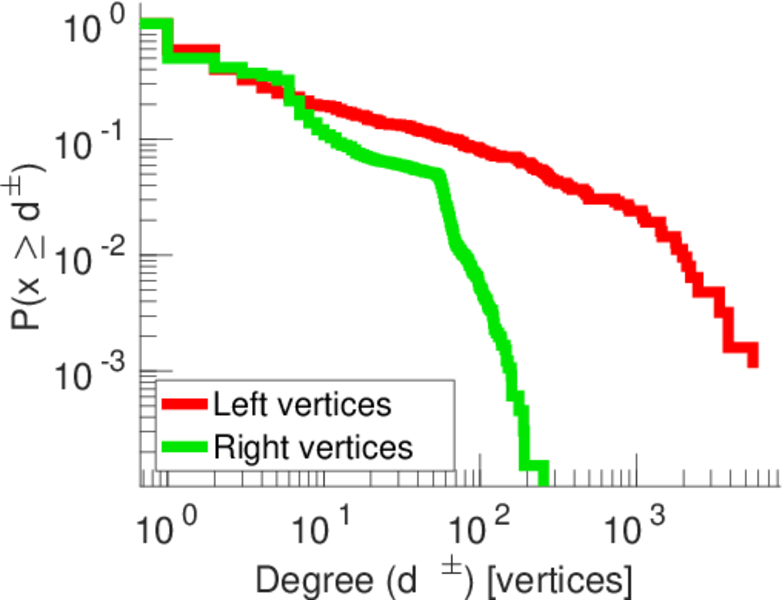
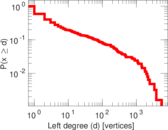
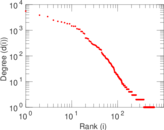
| Maximum left degree | d1max = | 5,558
|
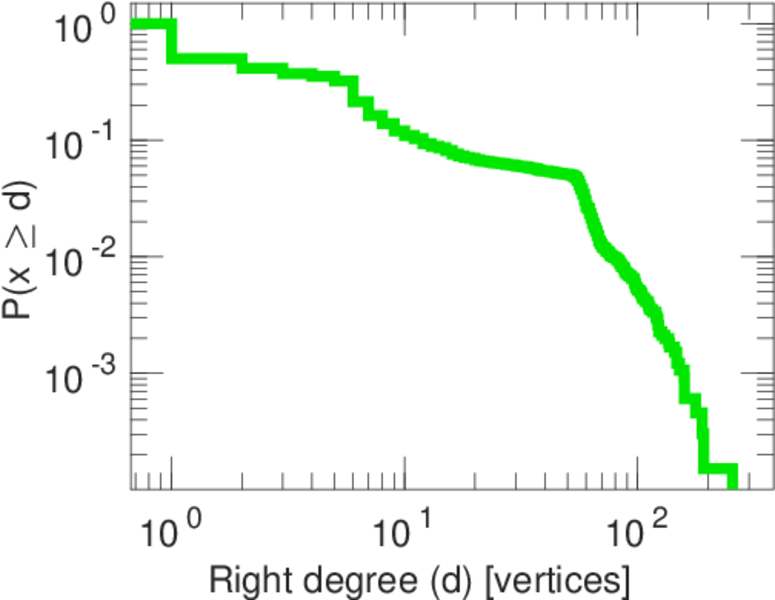
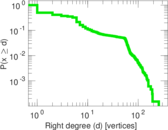
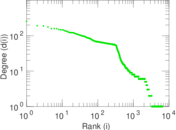
| Maximum right degree | d2max = | 255
|
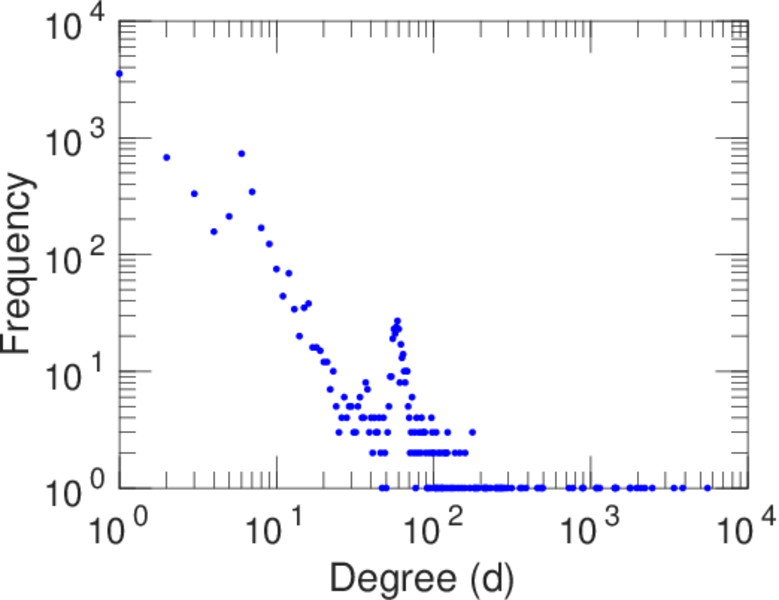
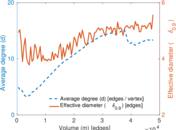
| Average degree | d = | 12.142 6
|
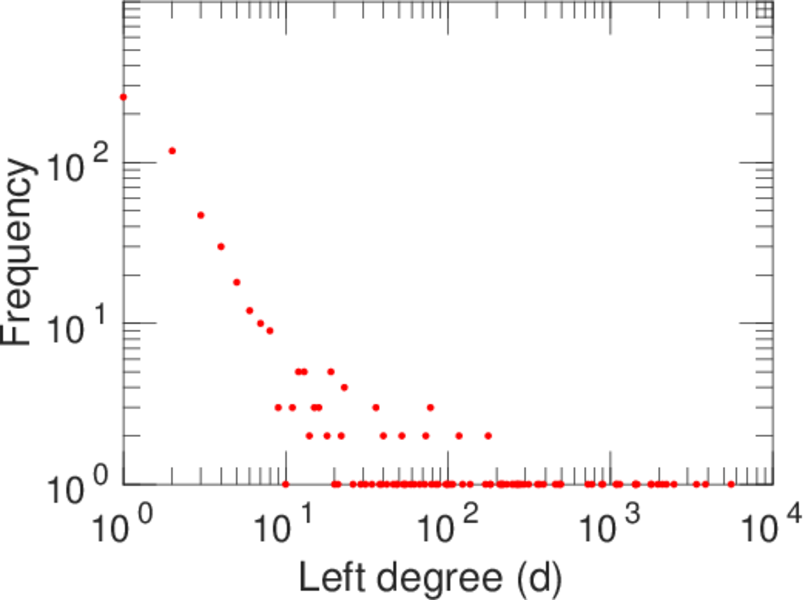
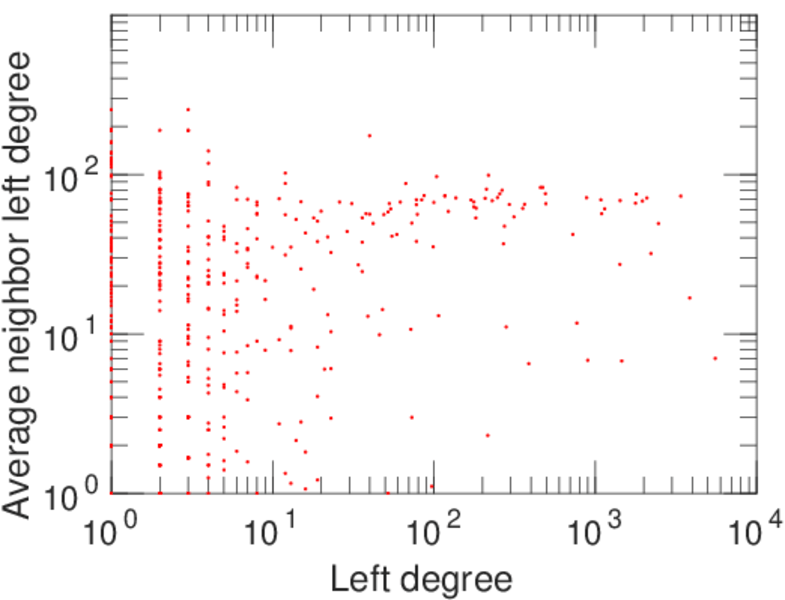
| Average left degree | d1 = | 76.407 1
|
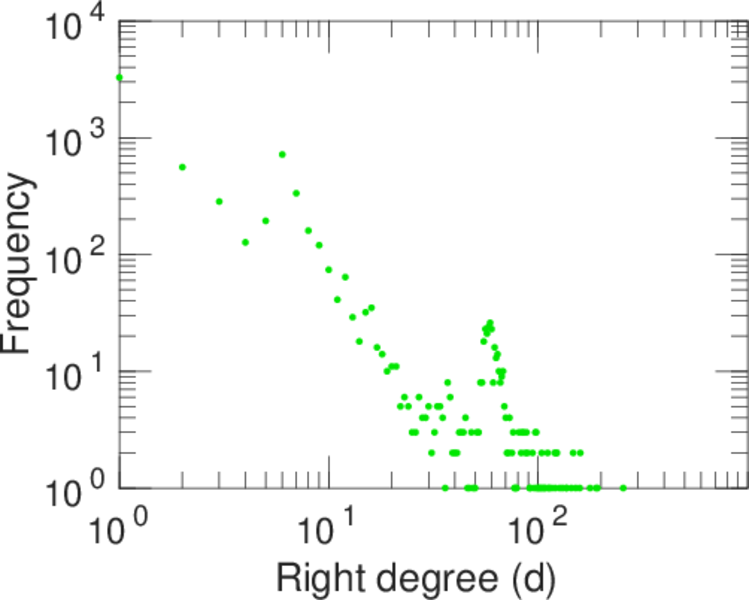
| Average right degree | d2 = | 6.595 38
|
| Fill | p = | 0.005 230 22
|
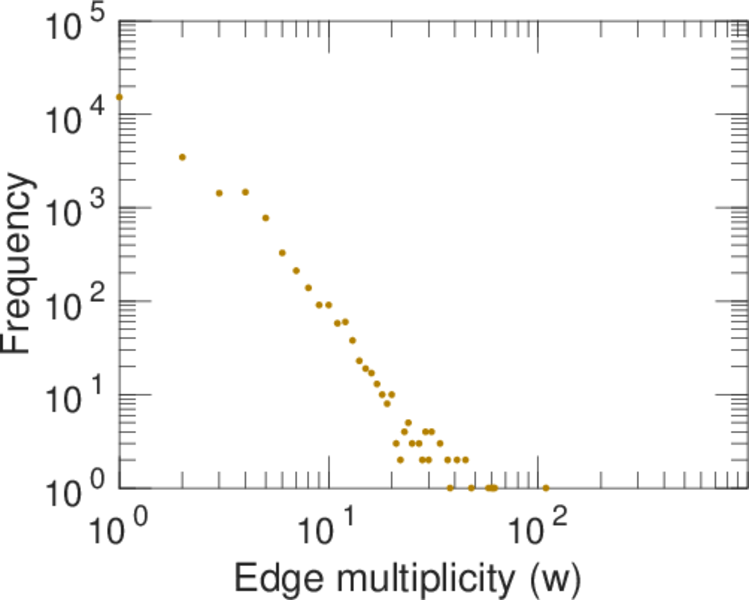
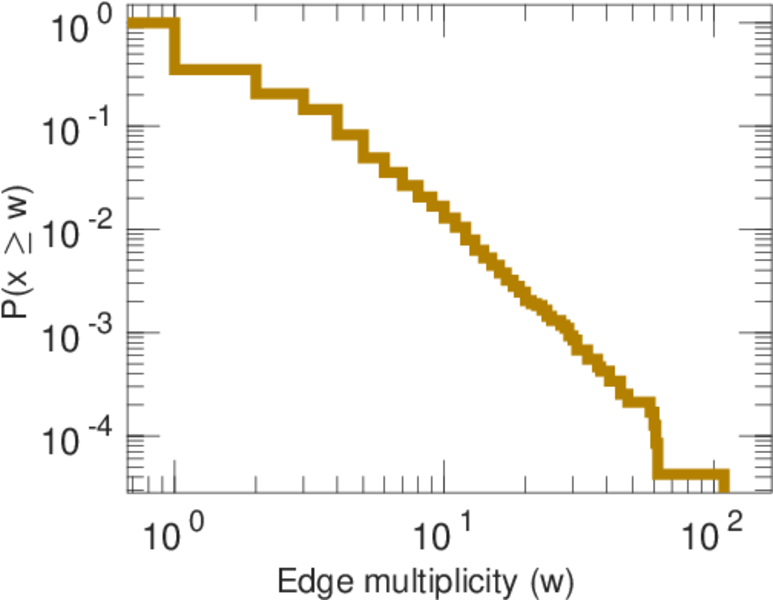
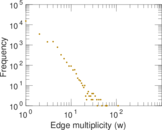
| Average edge multiplicity | m̃ = | 2.020 85
|
| Size of LCC | N = | 6,657
|
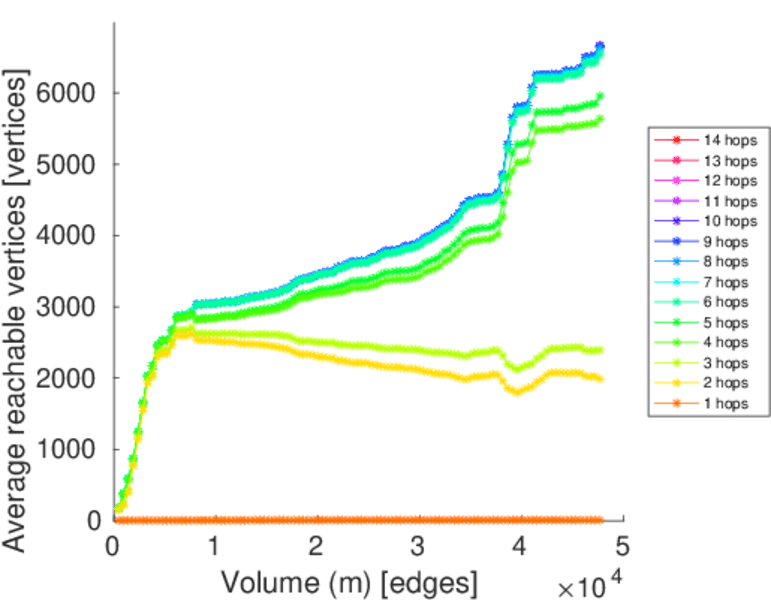
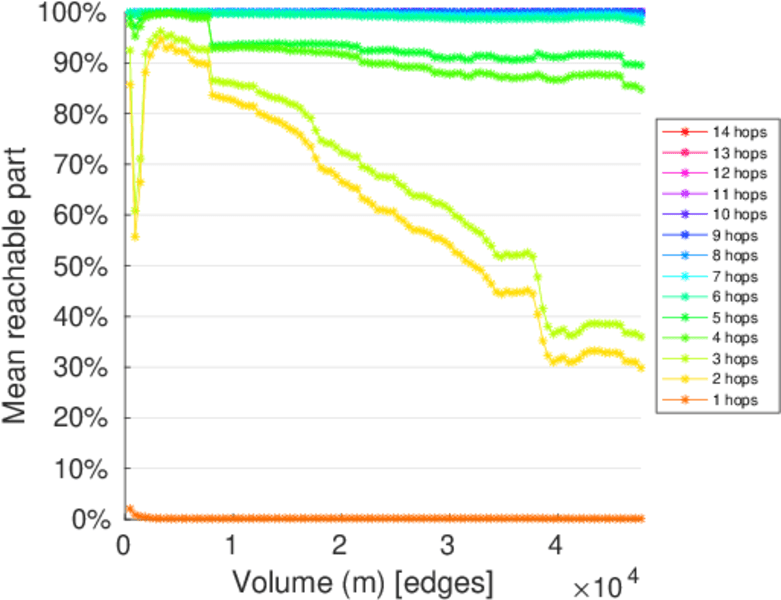
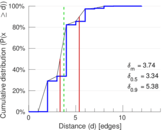
| Diameter | δ = | 14
|
| 50-Percentile effective diameter | δ0.5 = | 3.336 62
|
| 90-Percentile effective diameter | δ0.9 = | 5.379 14
|
| Median distance | δM = | 4
|
| Mean distance | δm = | 3.742 02
|
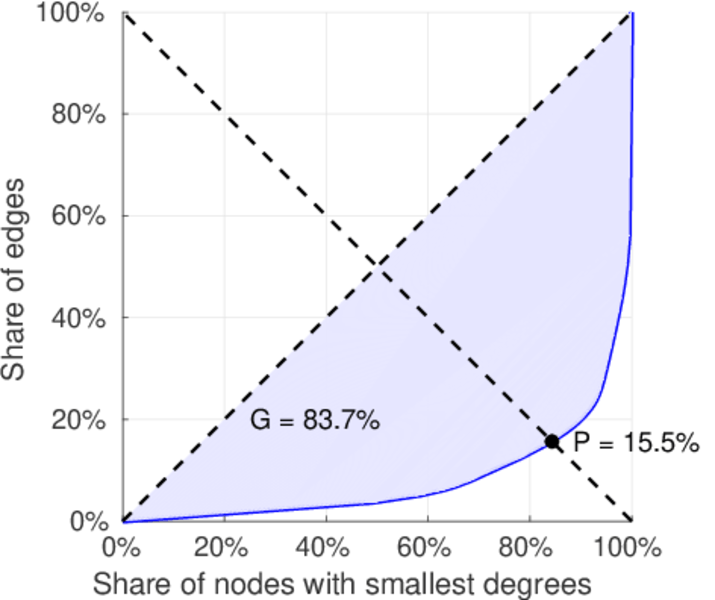
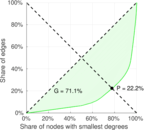
| Gini coefficient | G = | 0.840 594
|
| Balanced inequality ratio | P = | 0.152 701
|
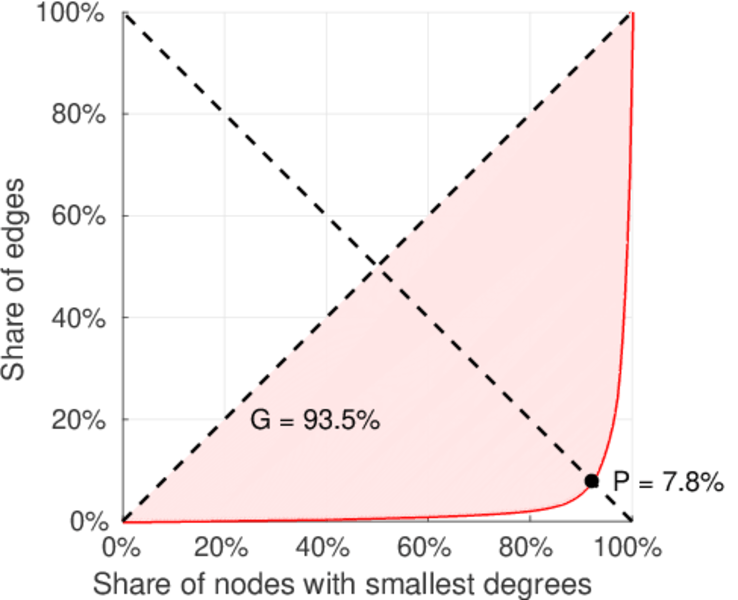
| Left balanced inequality ratio | P1 = | 0.077 645 9
|
| Right balanced inequality ratio | P2 = | 0.222 241
|
| Relative edge distribution entropy | Her = | 0.758 112
|
| Power law exponent | γ = | 2.443 46
|
| Tail power law exponent | γt = | 1.881 00
|
| Tail power law exponent with p | γ3 = | 1.881 00
|
| p-value | p = | 0.000 00
|
| Left tail power law exponent with p | γ3,1 = | 1.641 00
|
| Left p-value | p1 = | 0.000 00
|
| Right tail power law exponent with p | γ3,2 = | 8.911 00
|
| Right p-value | p2 = | 0.189 000
|
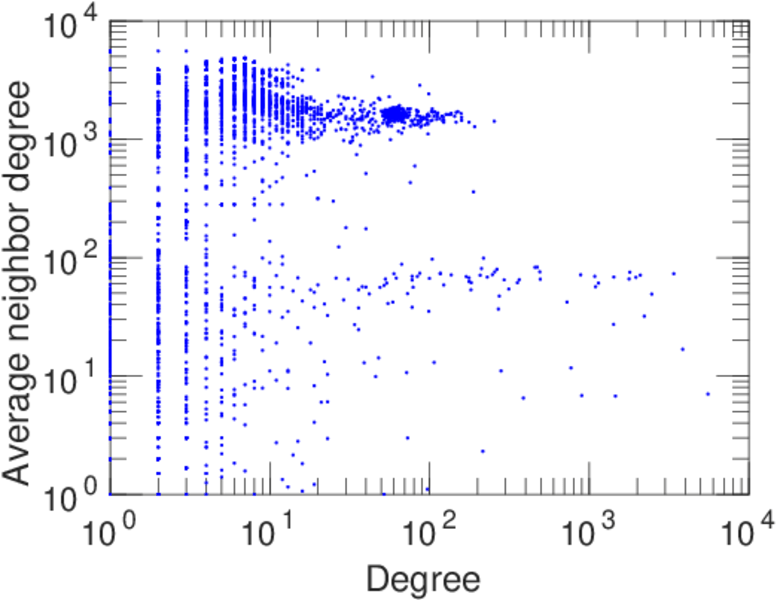
| Degree assortativity | ρ = | −0.450 330
|
| Degree assortativity p-value | pρ = | 0.000 00
|
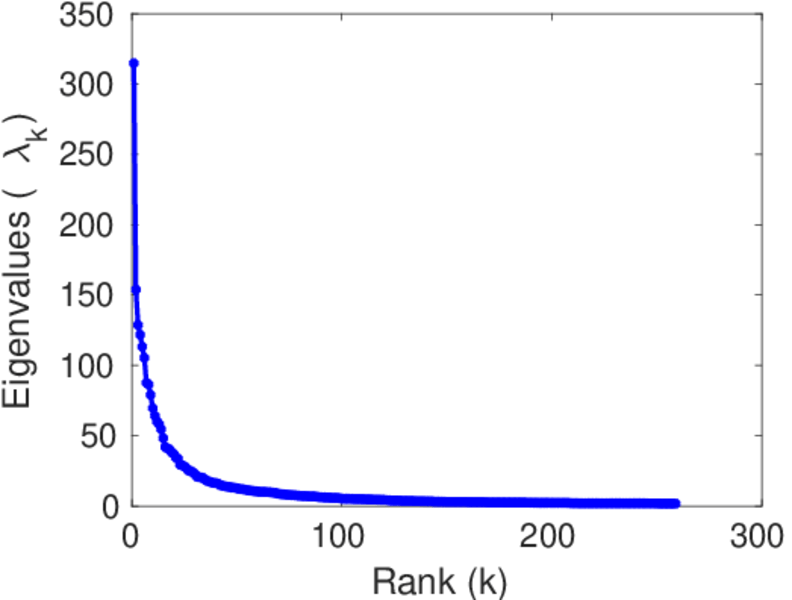
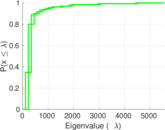
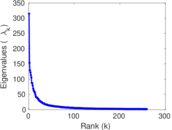
| Spectral norm | α = | 314.745
|
| Algebraic connectivity | a = | 0.013 230 9
|
| Spectral separation | |λ1[A] / λ2[A]| = | 2.045 92
|
| Controllability | C = | 6,019
|
| Relative controllability | Cr = | 0.837 251
|
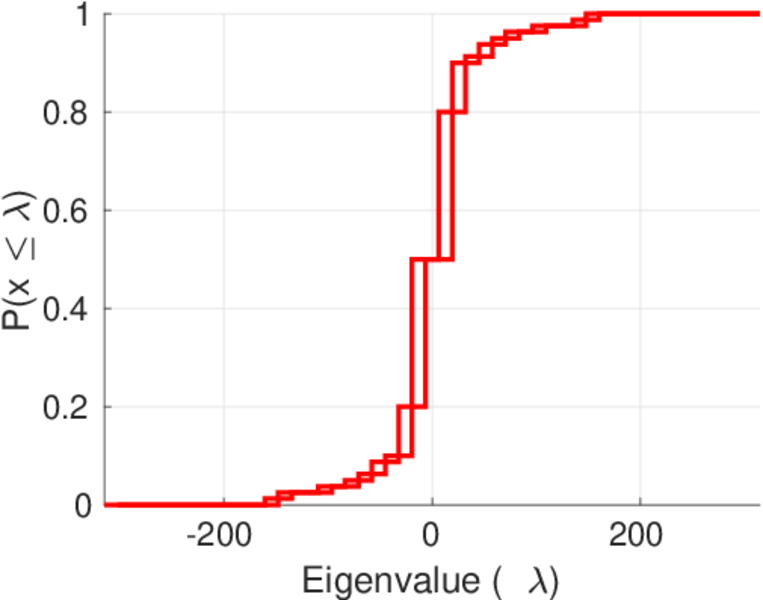
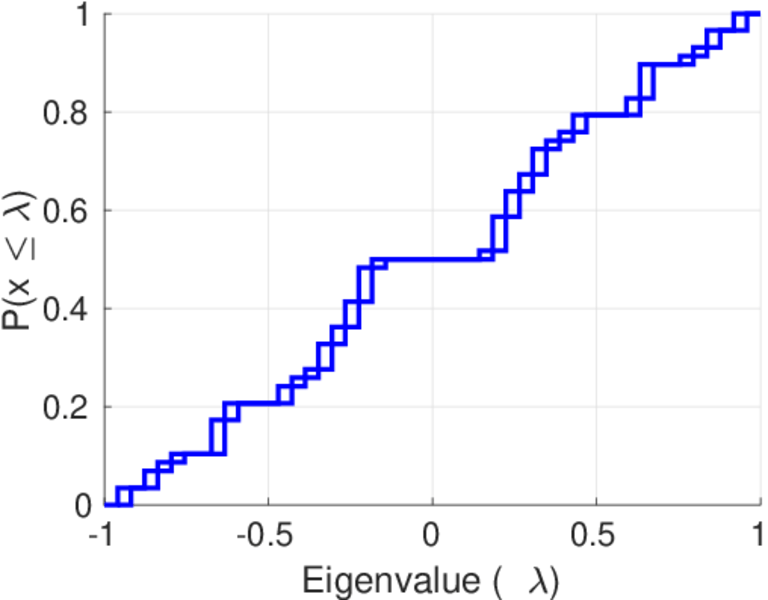
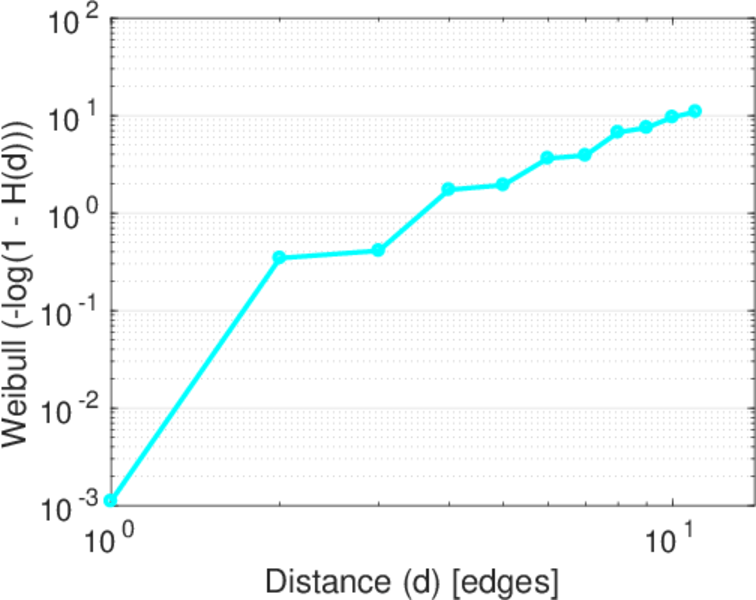
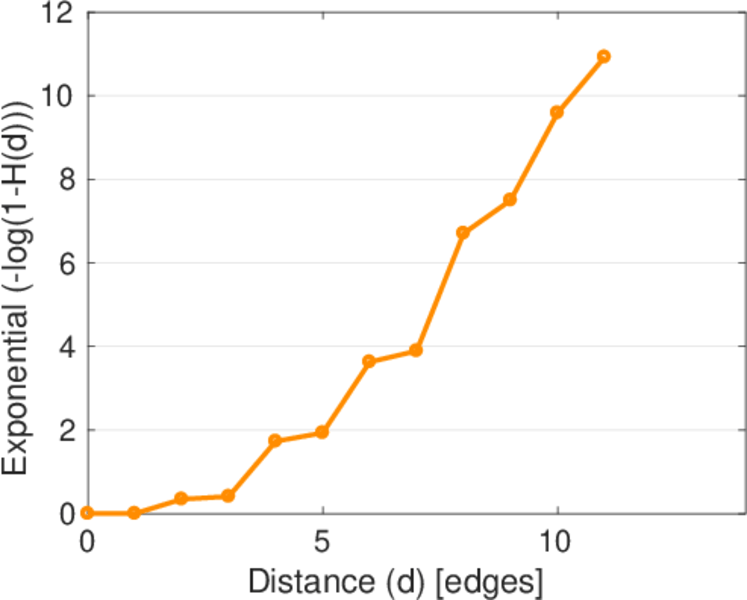
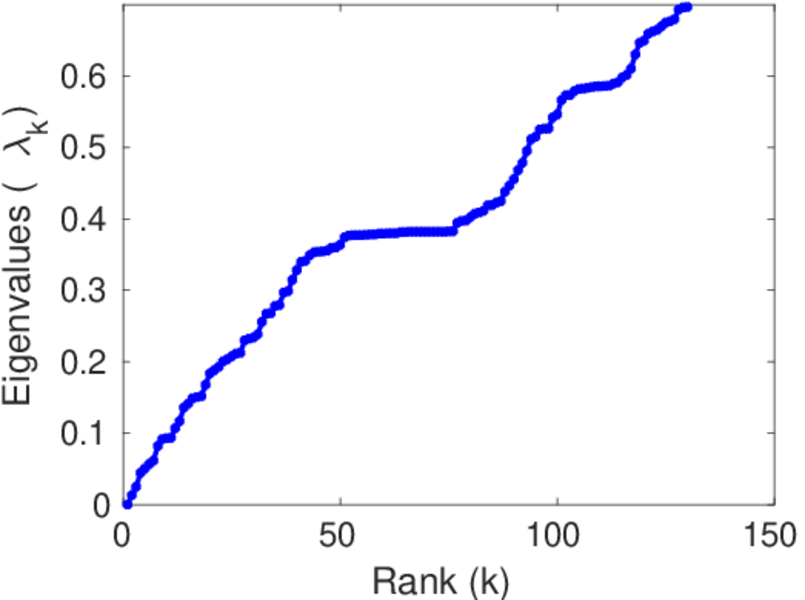
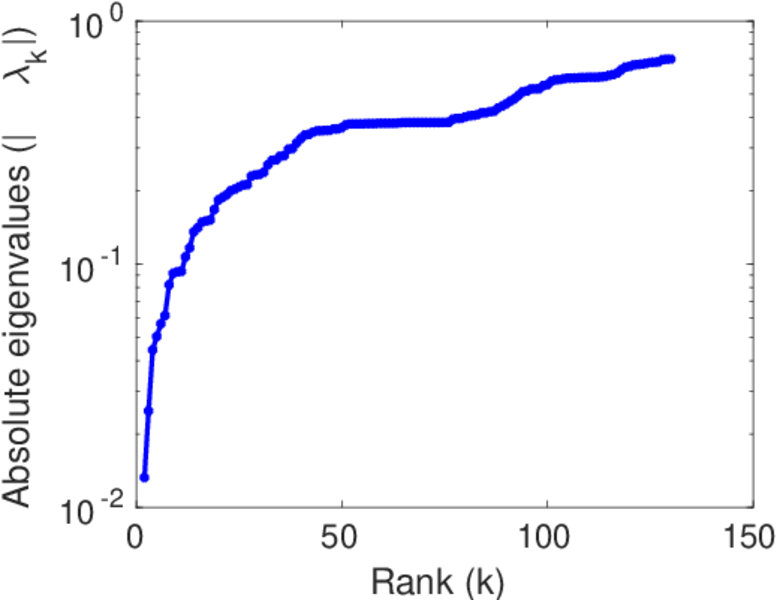
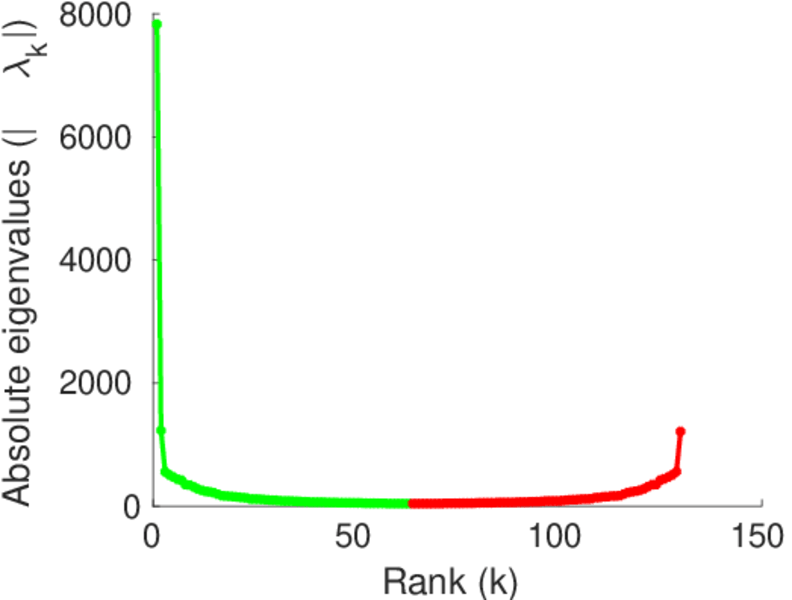
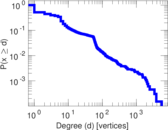
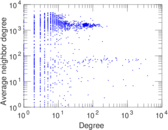
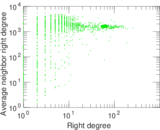
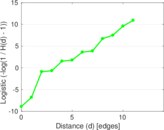
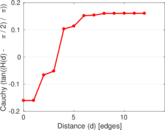
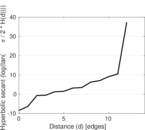
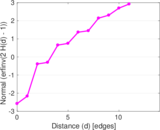
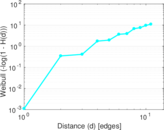
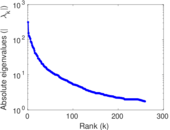
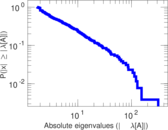
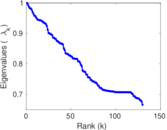
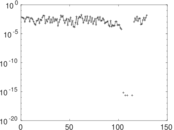
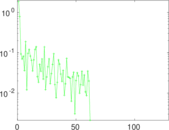
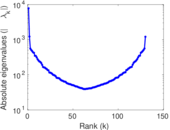
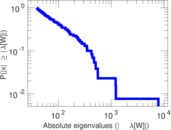
Plots


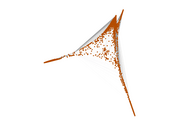


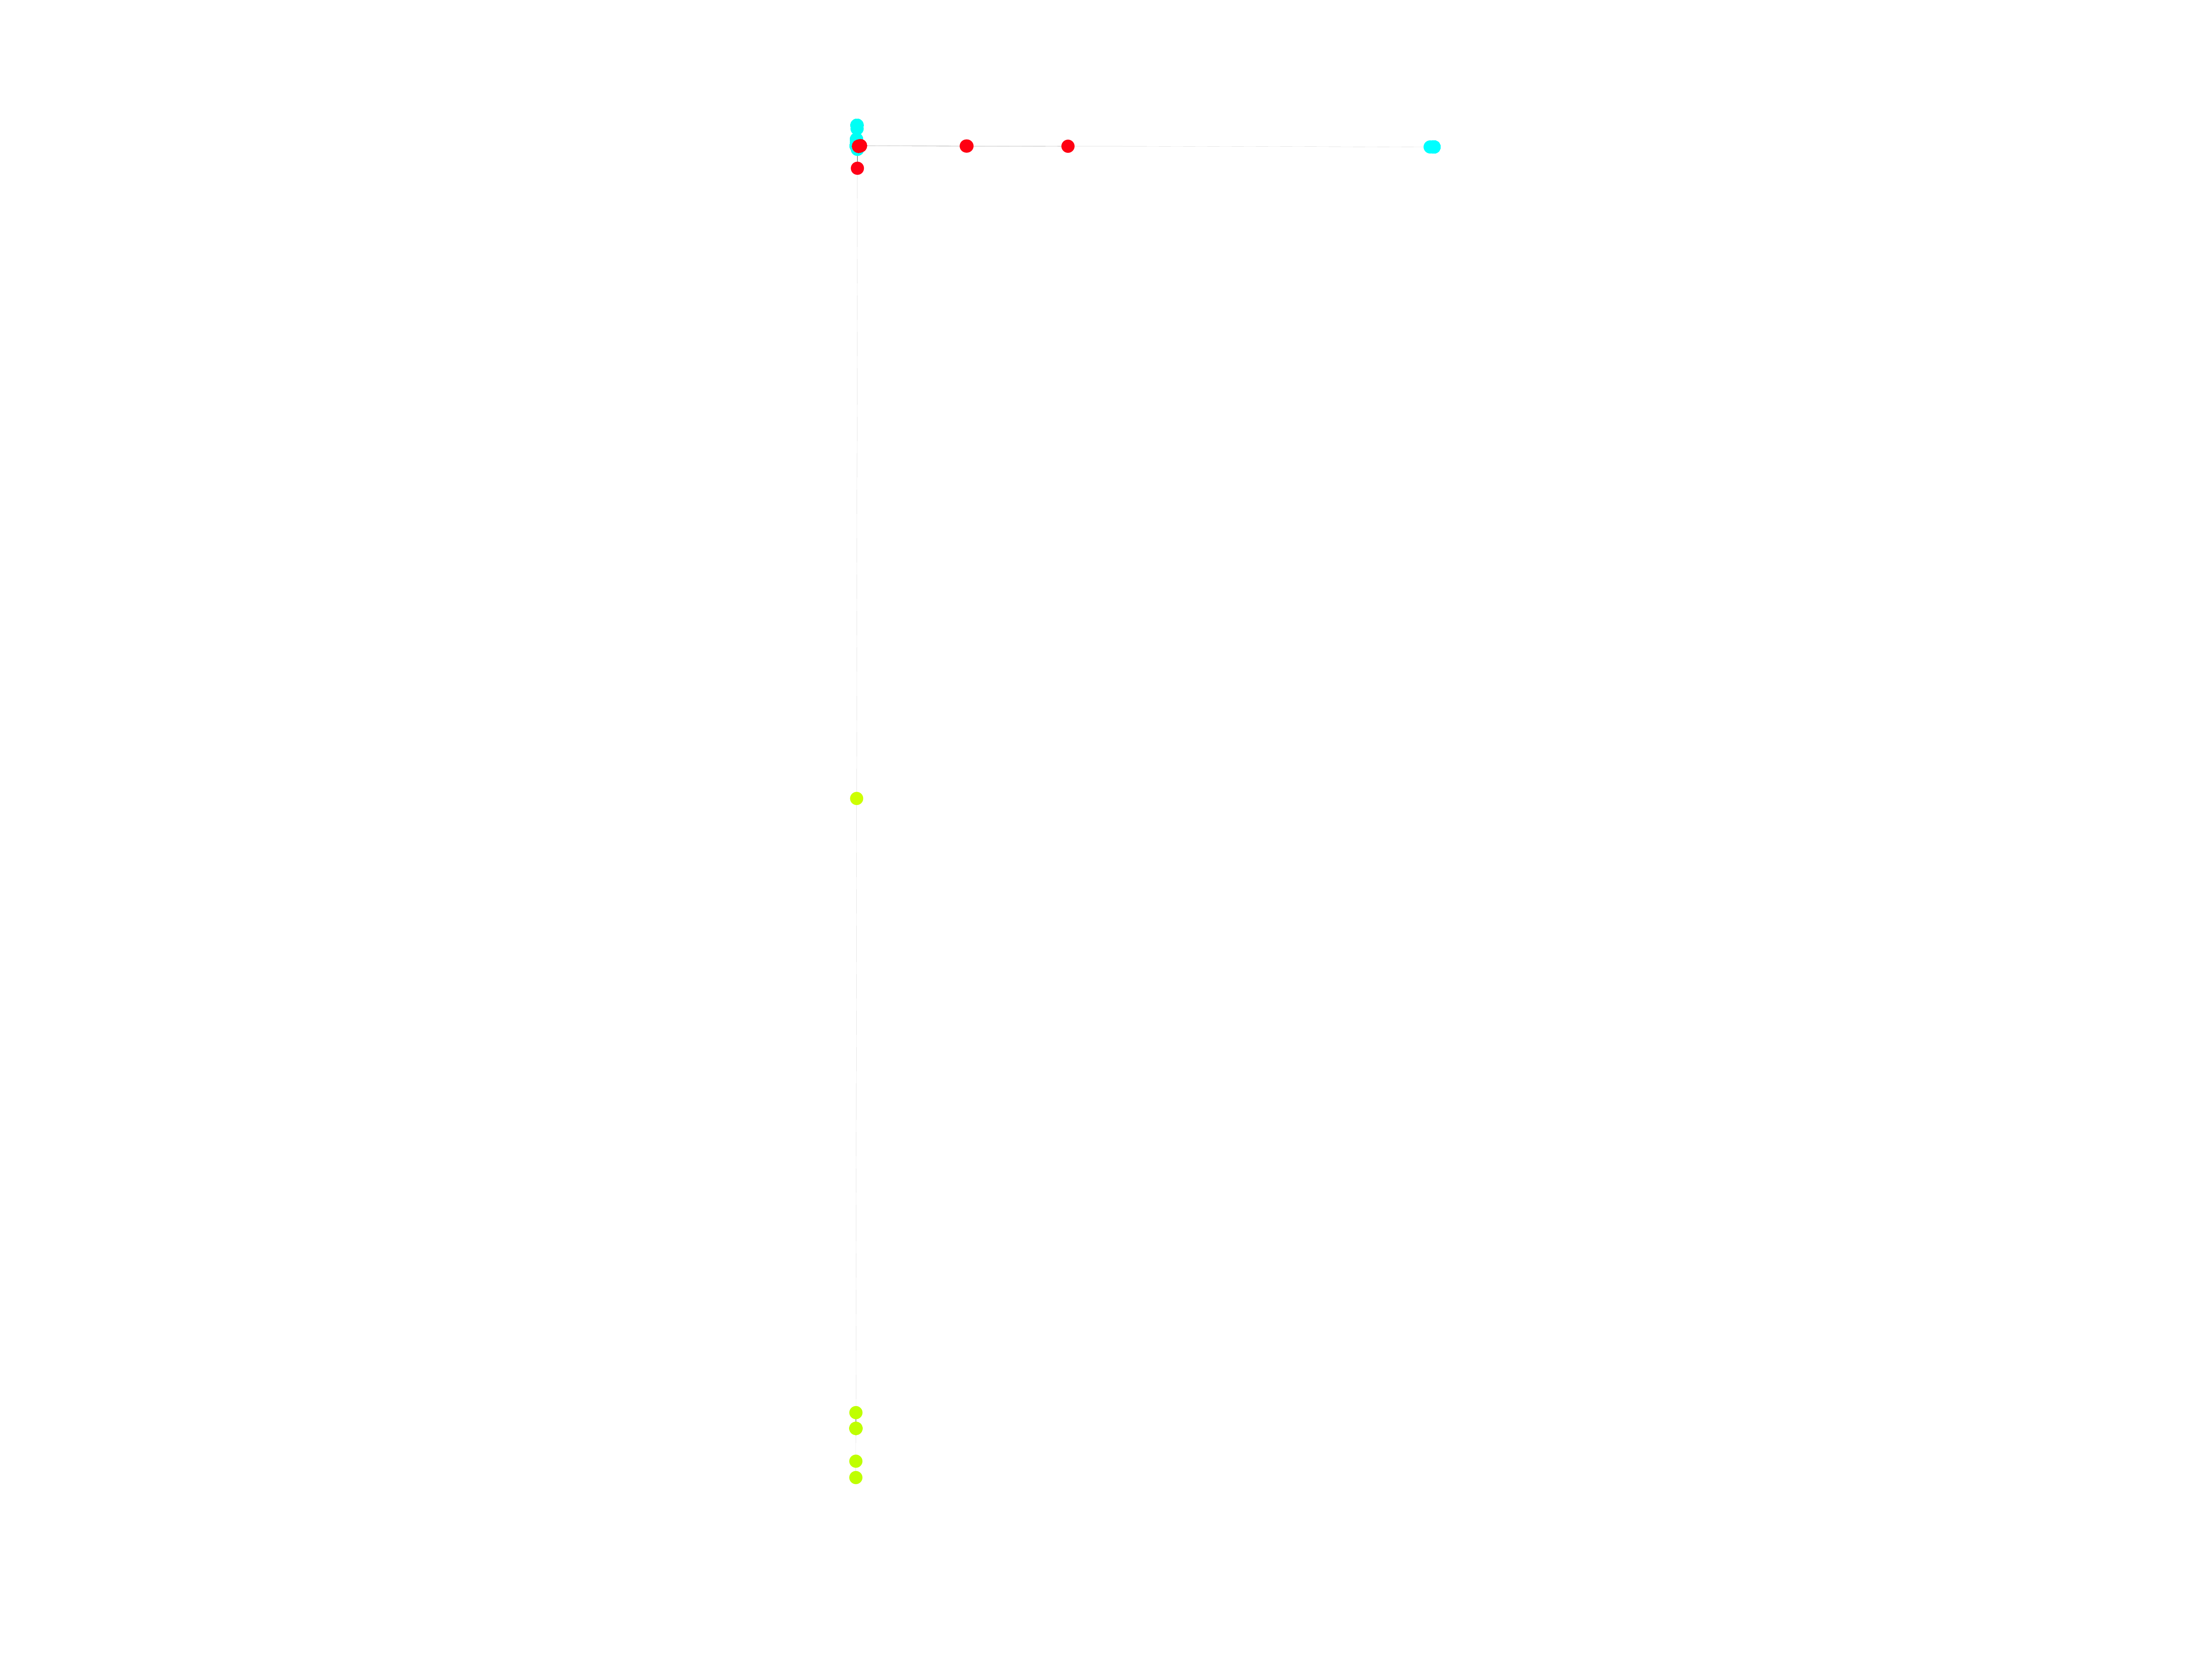
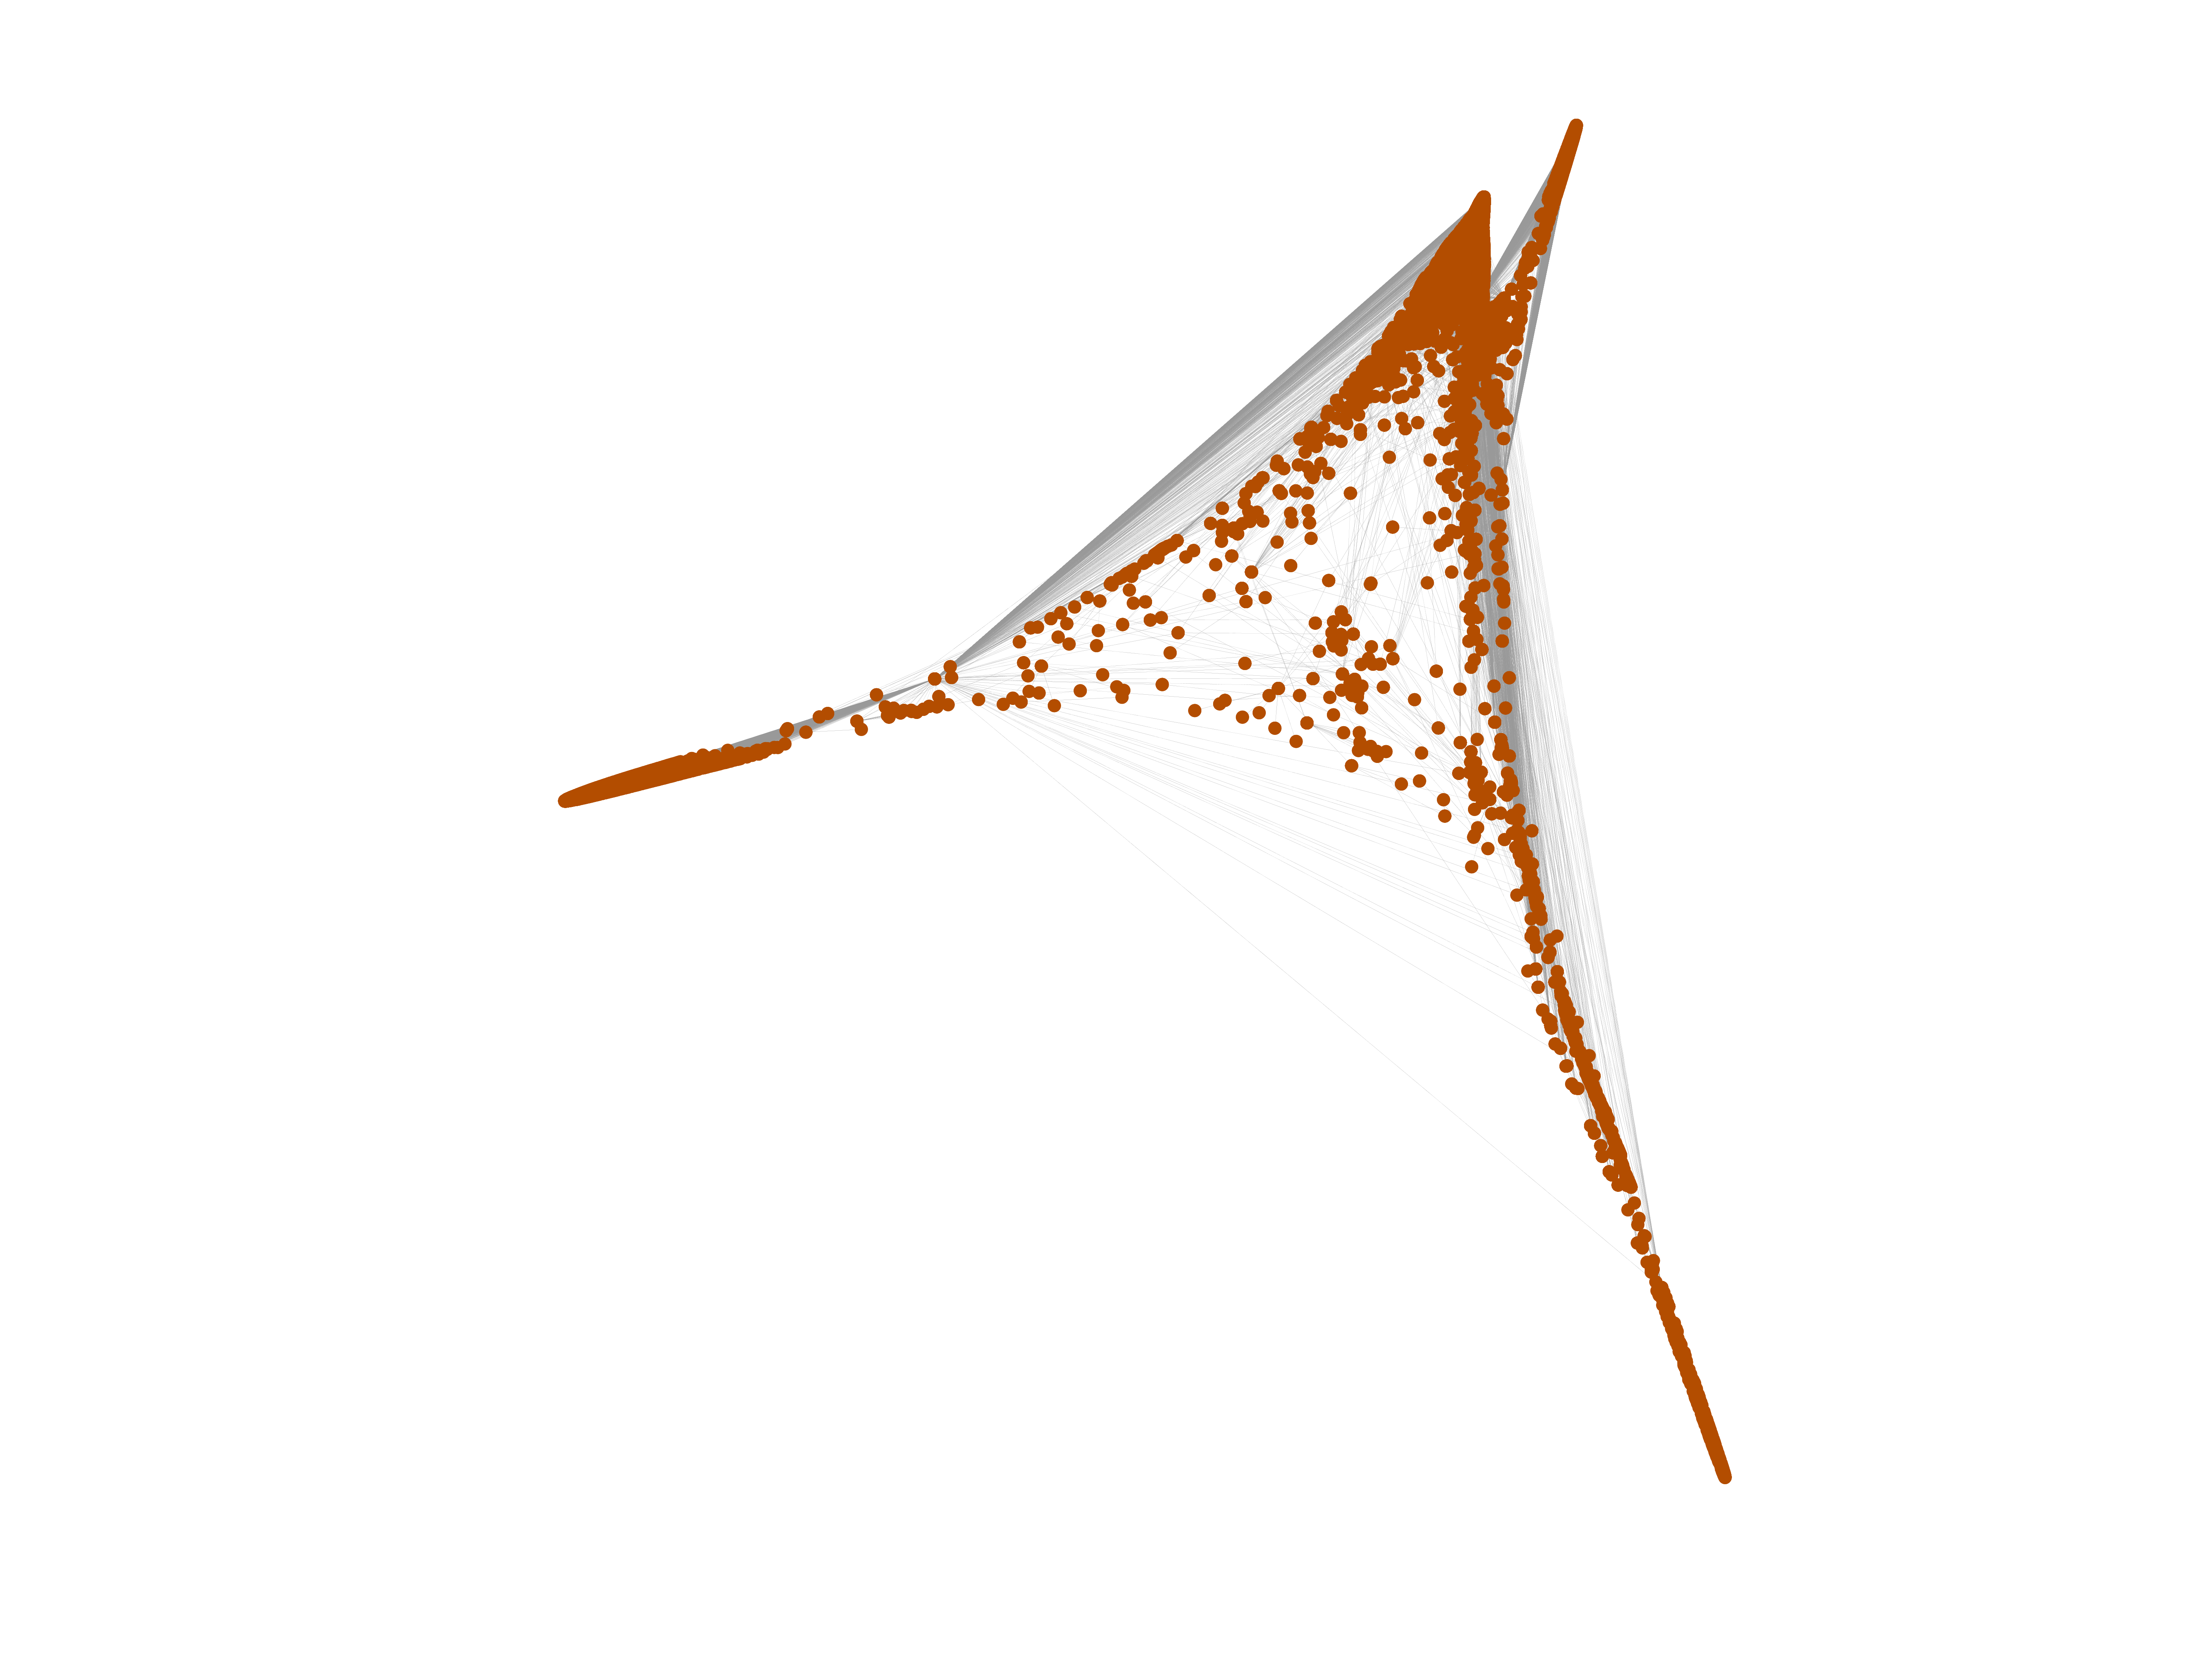
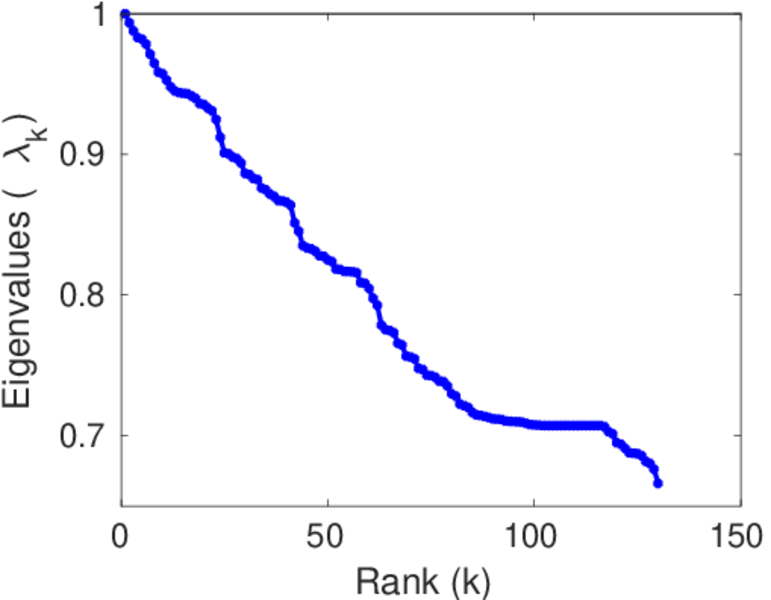
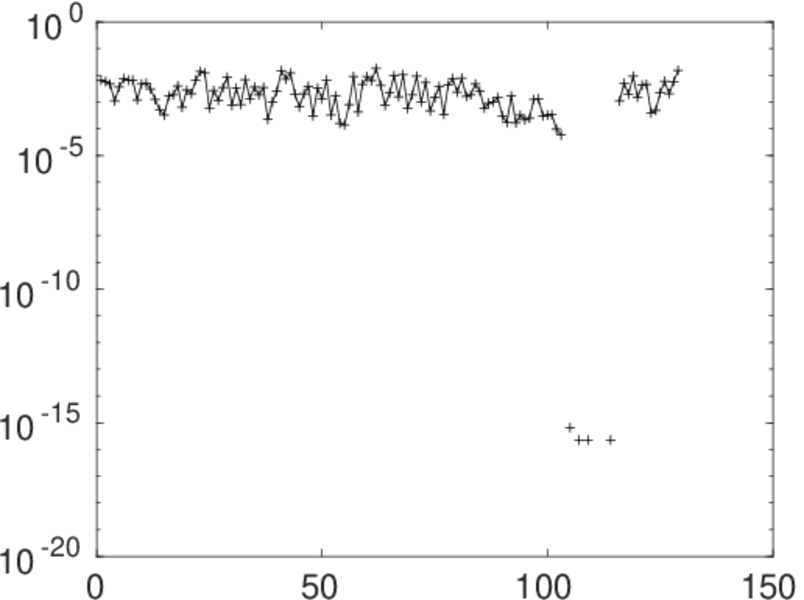
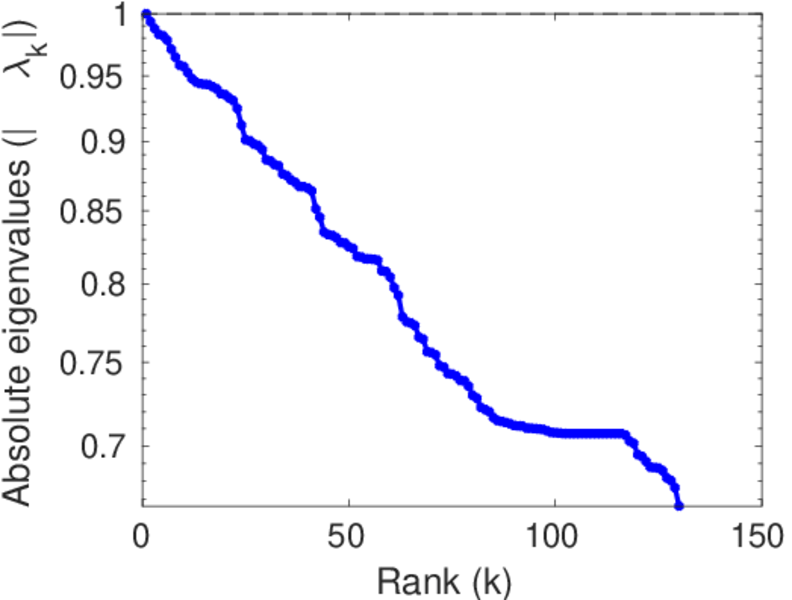
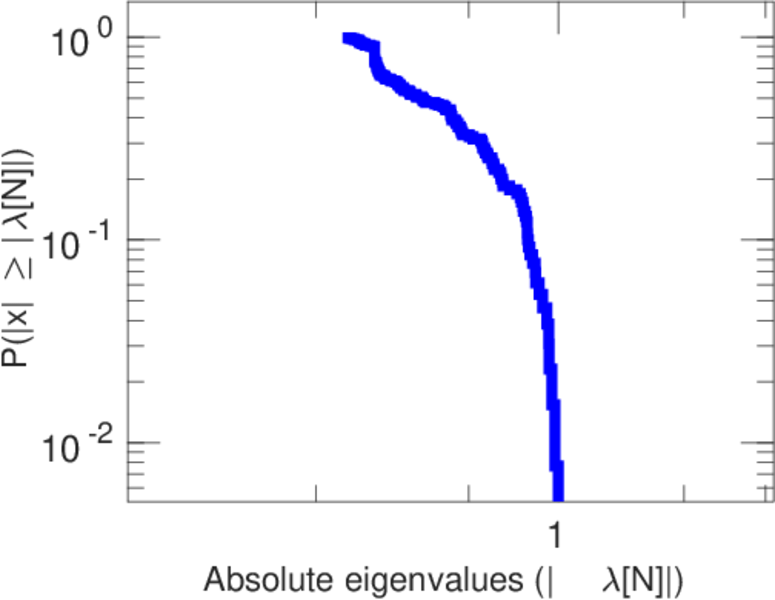
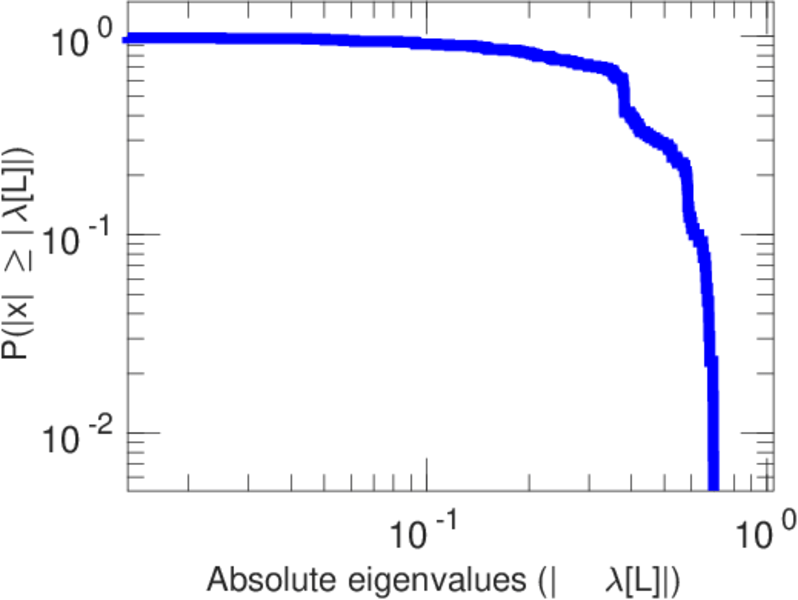
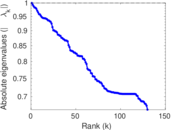
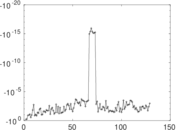
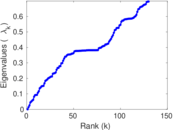
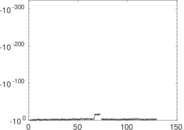
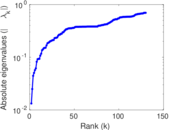
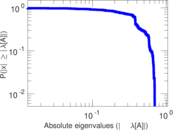
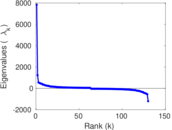
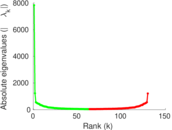
Matrix decompositions plots


Downloads
References
|
[1]
|
Jérôme Kunegis.
KONECT – The Koblenz Network Collection.
In Proc. Int. Conf. on World Wide Web Companion, pages
1343–1350, 2013.
[ http ]
|
|
[2]
|
Wikimedia Foundation.
Wikimedia downloads.
http://dumps.wikimedia.org/, January 2010.
|
 KONECT ‣ Networks ‣
Buy Me a Coffee
KONECT ‣ Networks ‣
Buy Me a Coffee