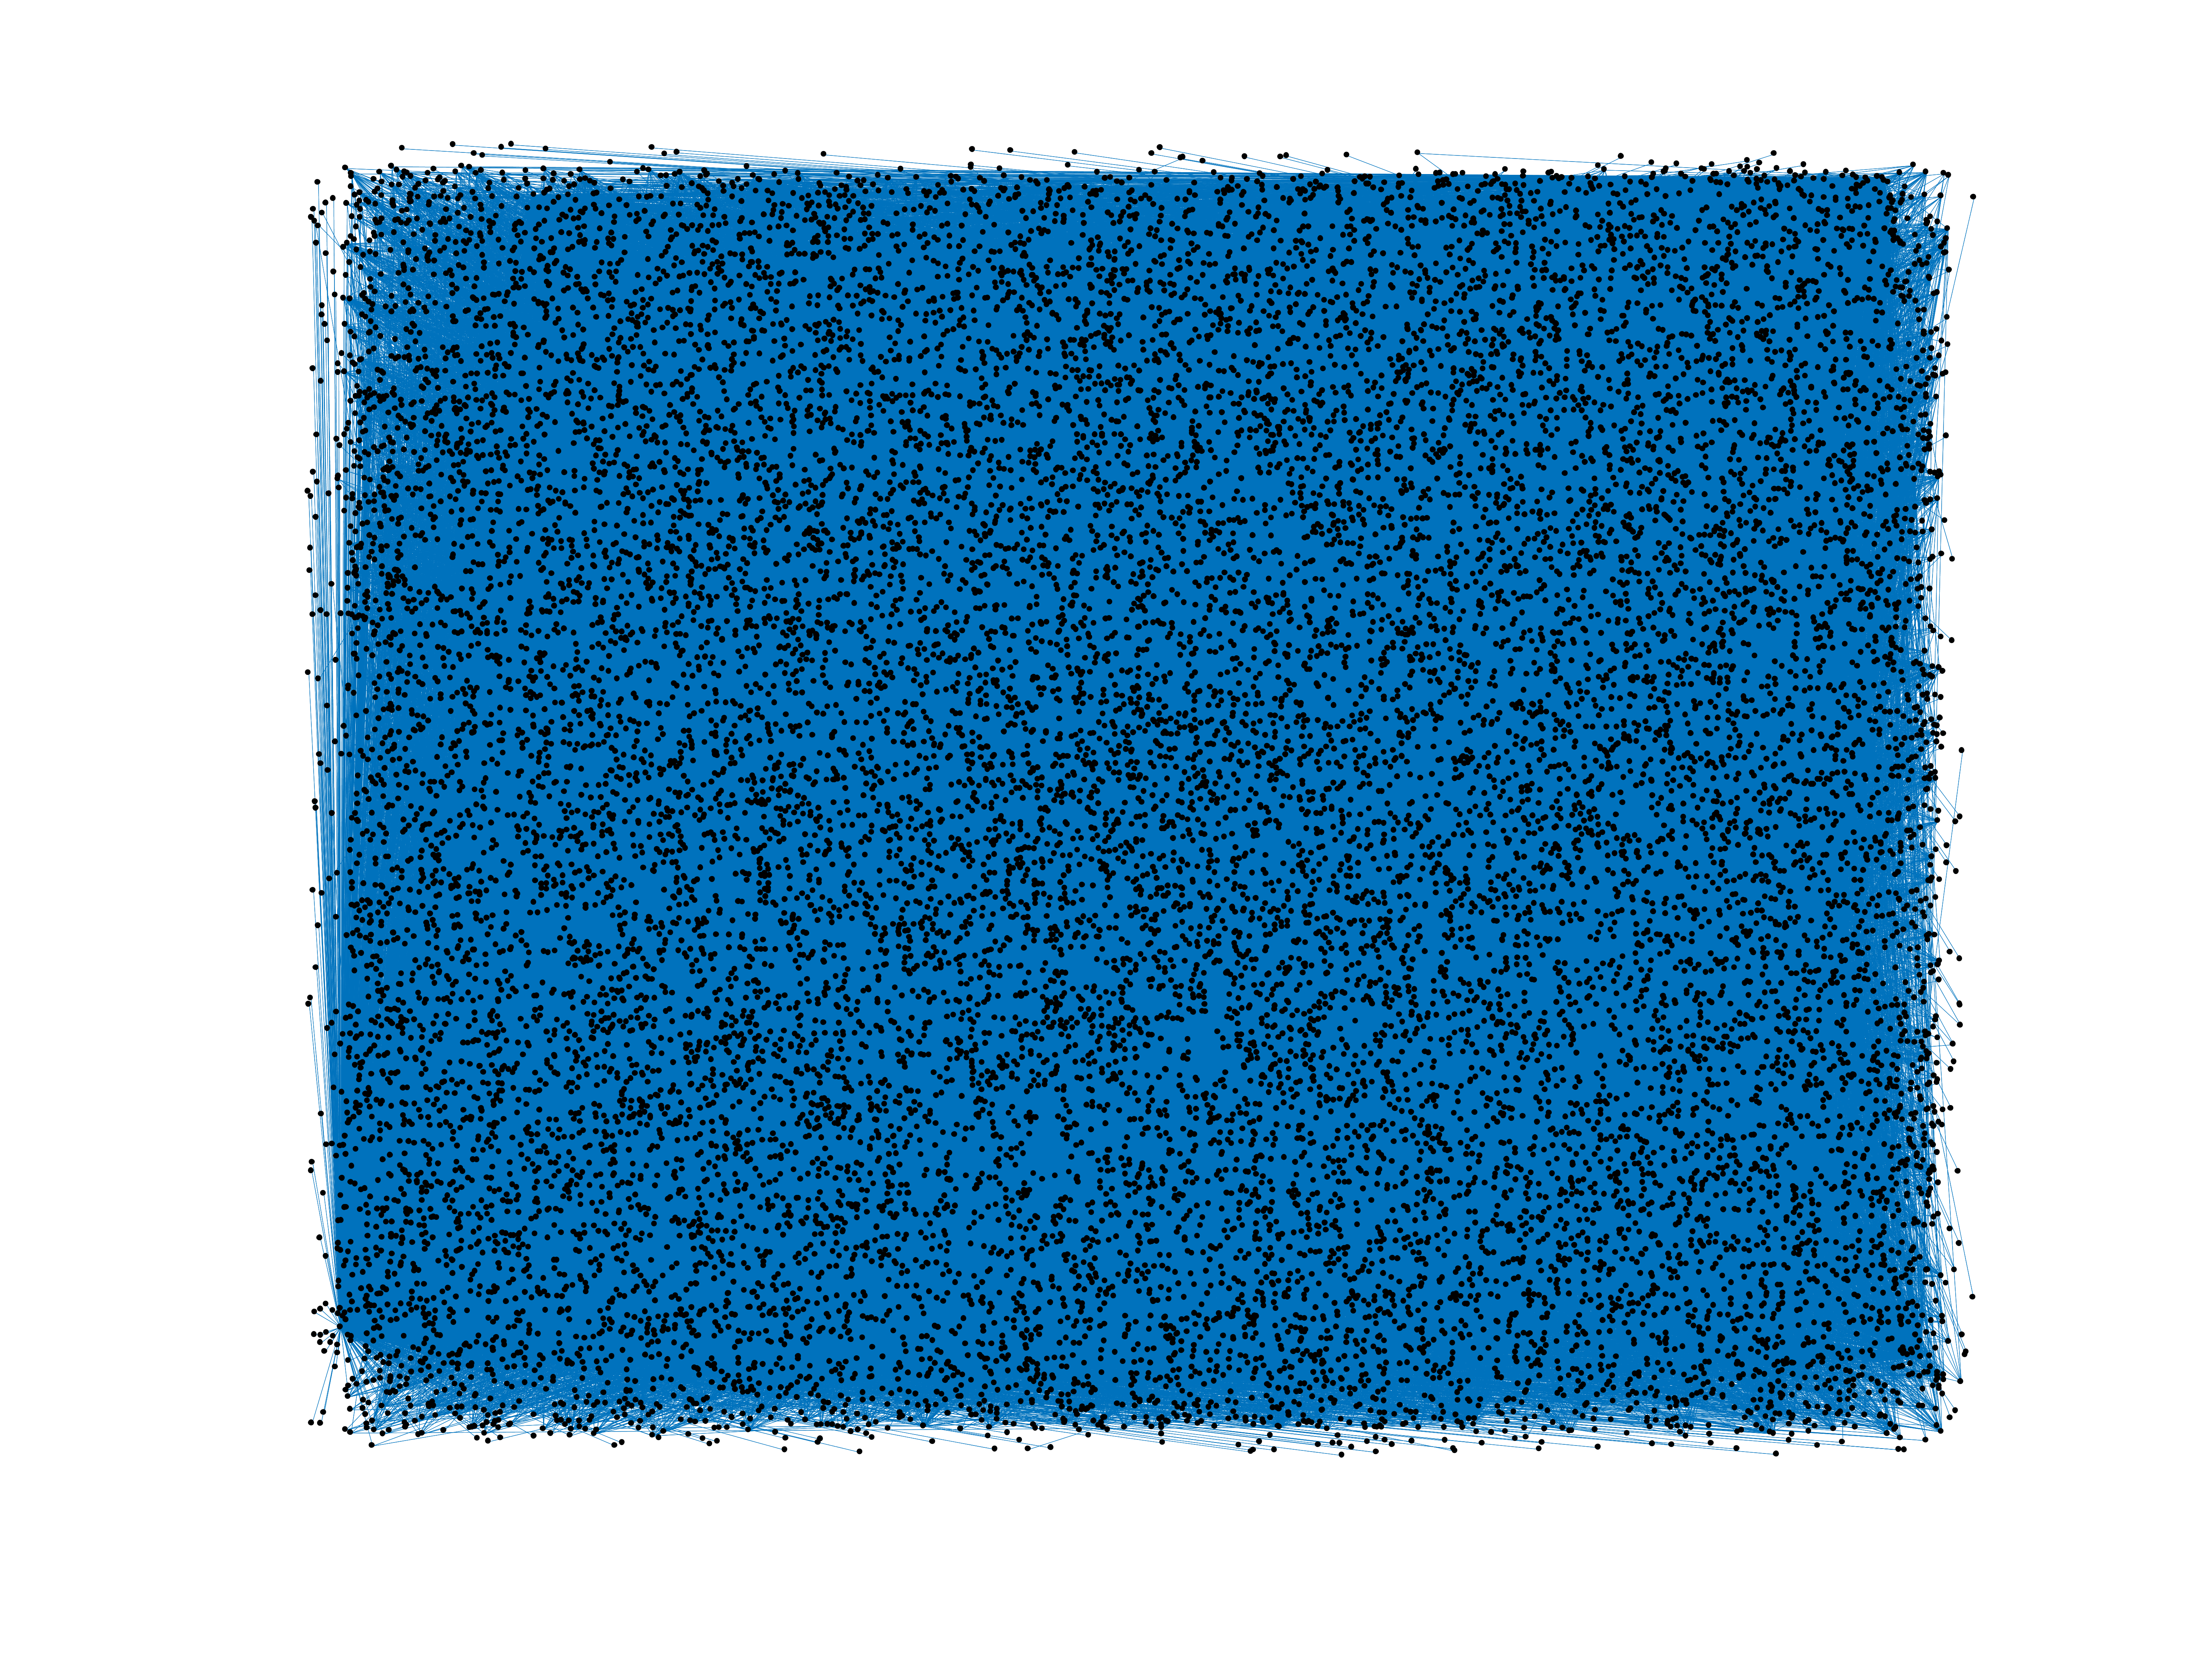
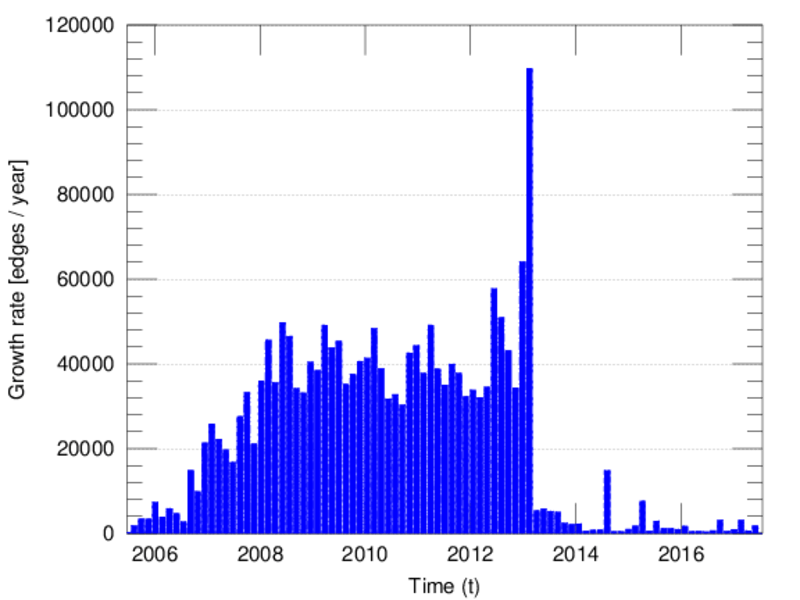
Wikipedia edits (pam)
This is the bipartite edit network of the Pampanga Wikipedia. It contains users
and pages from the Pampanga Wikipedia, connected by edit events. Each edge
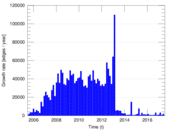
represents an edit. The dataset includes the timestamp of each edit.
Metadata
Statistics
| Size | n = | 19,529
|
| Left size | n1 = | 1,313
|
| Right size | n2 = | 18,216
|
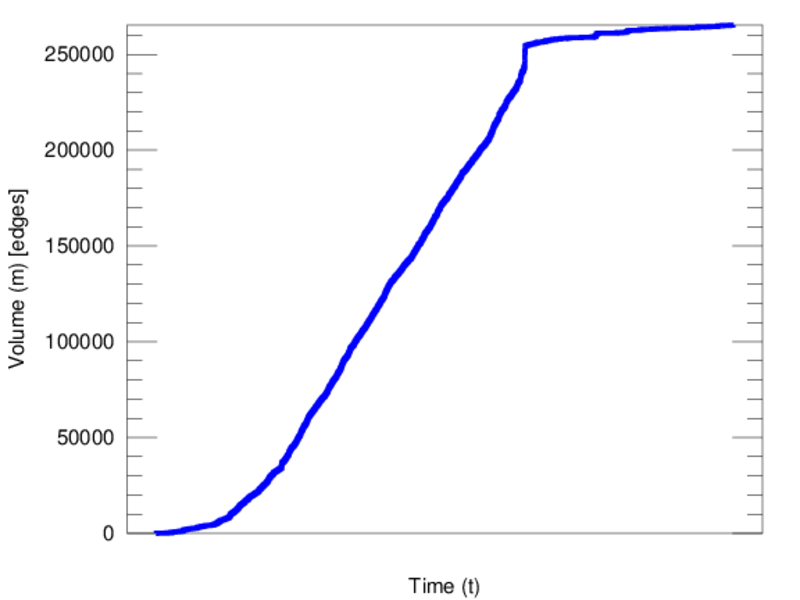
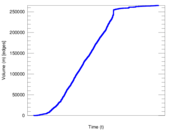
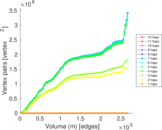
| Volume | m = | 265,279
|
| Unique edge count | m̿ = | 130,089
|
| Wedge count | s = | 242,086,465
|
| Claw count | z = | 494,206,888,550
|
| Cross count | x = | 940,526,842,445,638
|
| Square count | q = | 731,384,457
|
| 4-Tour count | T4 = | 6,819,736,422
|
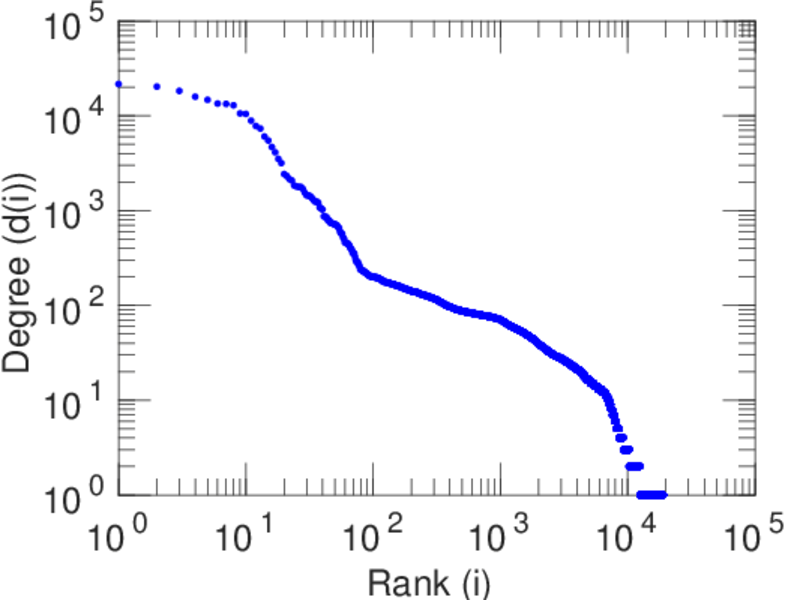
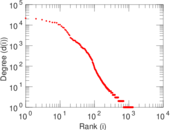
| Maximum degree | dmax = | 21,624
|
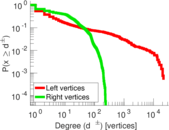
| Maximum left degree | d1max = | 21,624
|
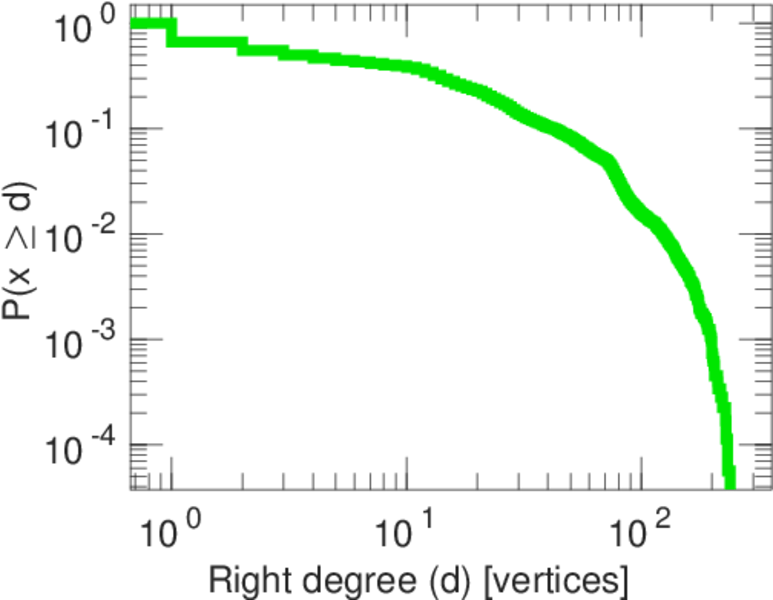
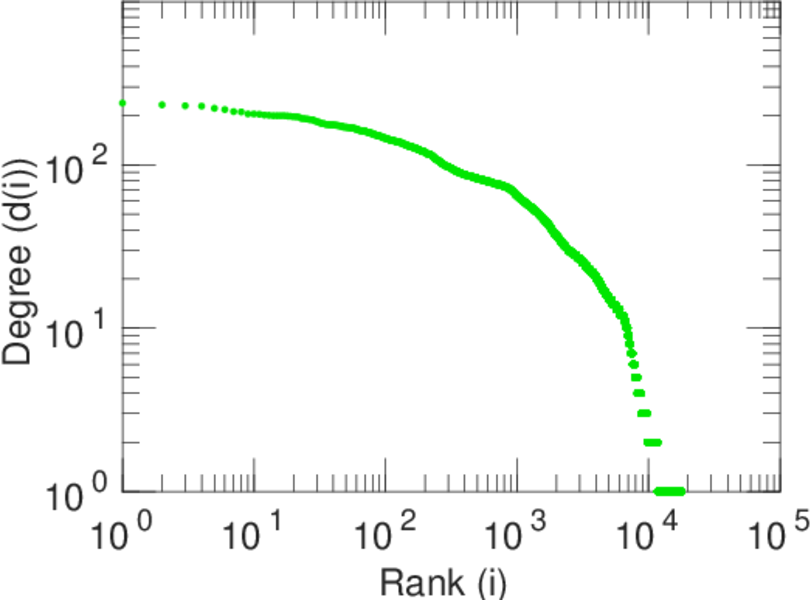
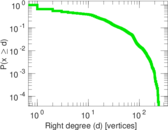
| Maximum right degree | d2max = | 239
|
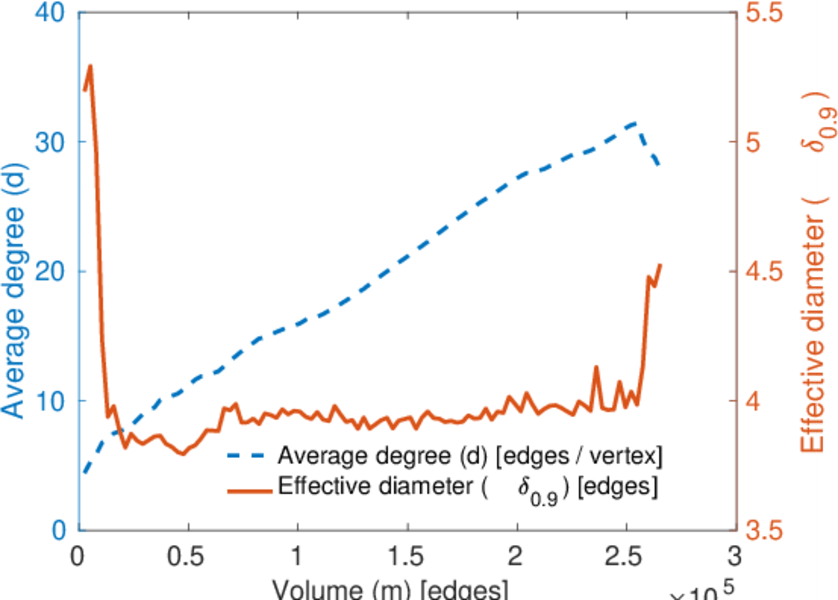
| Average degree | d = | 27.167 7
|
| Average left degree | d1 = | 202.040
|
| Average right degree | d2 = | 14.563 0
|
| Fill | p = | 0.005 439 05
|
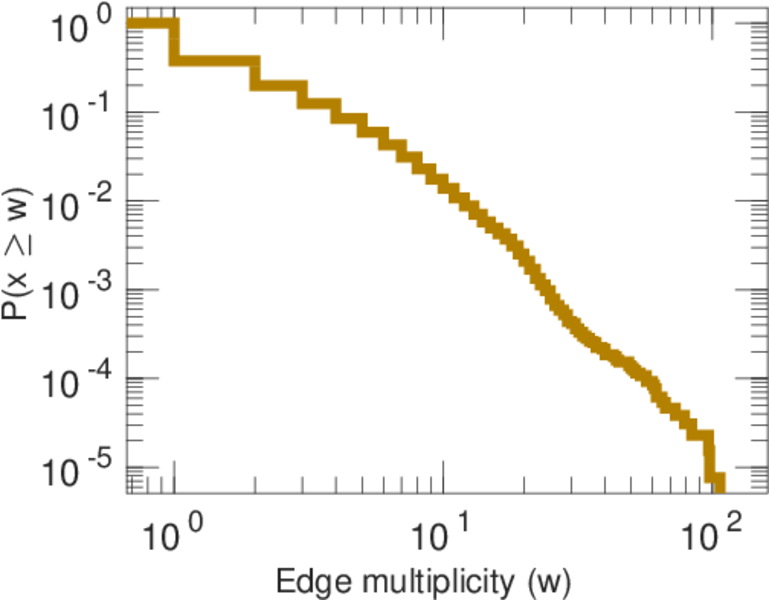
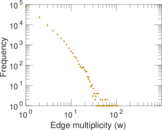
| Average edge multiplicity | m̃ = | 2.039 21
|
| Size of LCC | N = | 18,495
|
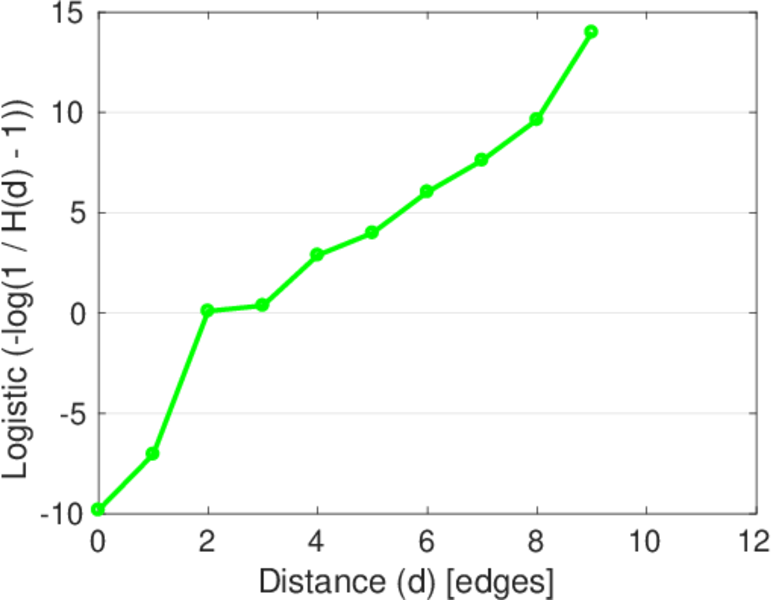
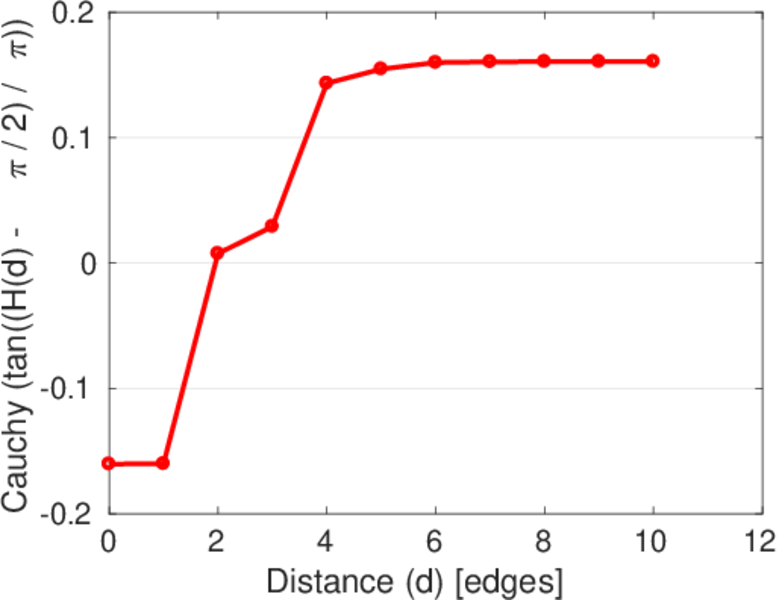
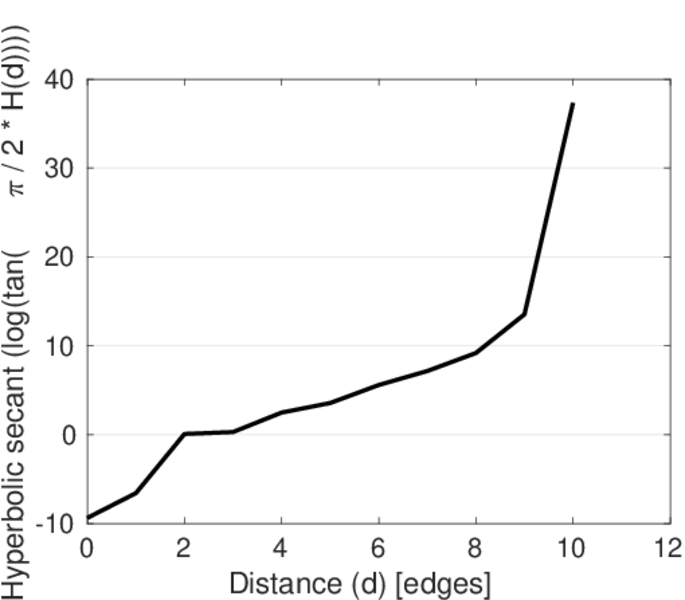
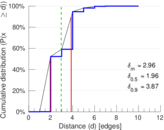
| Diameter | δ = | 12
|
| 50-Percentile effective diameter | δ0.5 = | 1.955 40
|
| 90-Percentile effective diameter | δ0.9 = | 3.868 38
|
| Median distance | δM = | 2
|
| Mean distance | δm = | 2.959 14
|
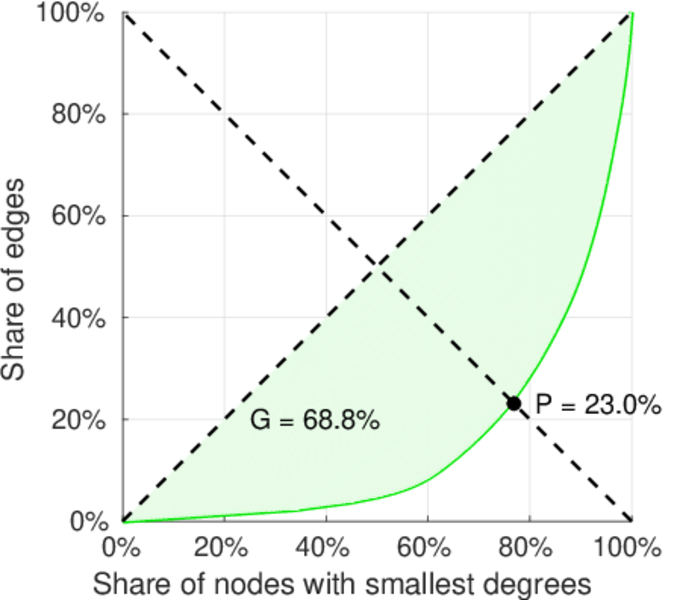
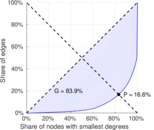
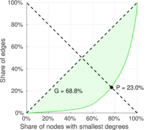
| Gini coefficient | G = | 0.835 674
|
| Balanced inequality ratio | P = | 0.170 240
|
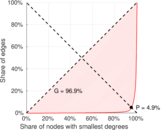
| Left balanced inequality ratio | P1 = | 0.048 812 8
|
| Right balanced inequality ratio | P2 = | 0.229 524
|
| Relative edge distribution entropy | Her = | 0.744 213
|
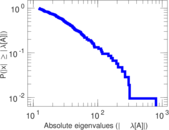
| Power law exponent | γ = | 1.839 64
|
| Tail power law exponent | γt = | 2.671 00
|
| Tail power law exponent with p | γ3 = | 2.671 00
|
| p-value | p = | 0.000 00
|
| Left tail power law exponent with p | γ3,1 = | 1.661 00
|
| Left p-value | p1 = | 0.000 00
|
| Right tail power law exponent with p | γ3,2 = | 7.971 00
|
| Right p-value | p2 = | 0.007 000 00
|
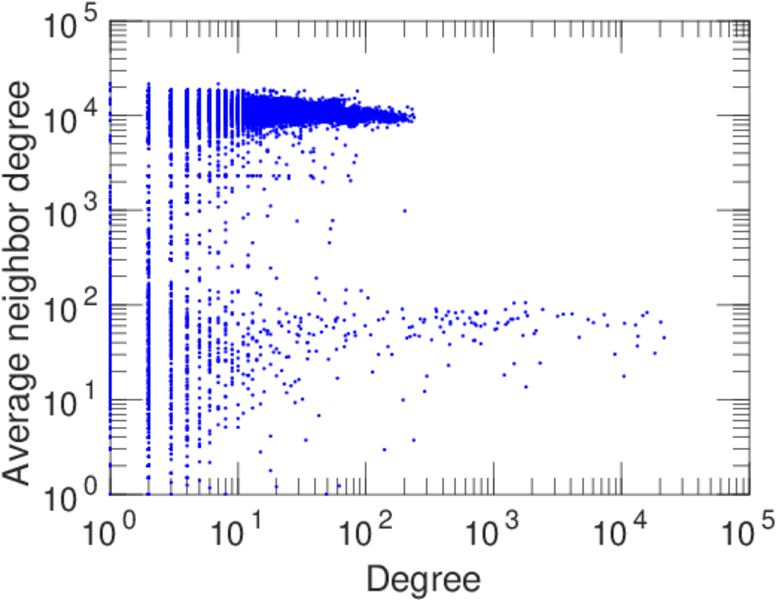
| Degree assortativity | ρ = | −0.309 461
|
| Degree assortativity p-value | pρ = | 0.000 00
|
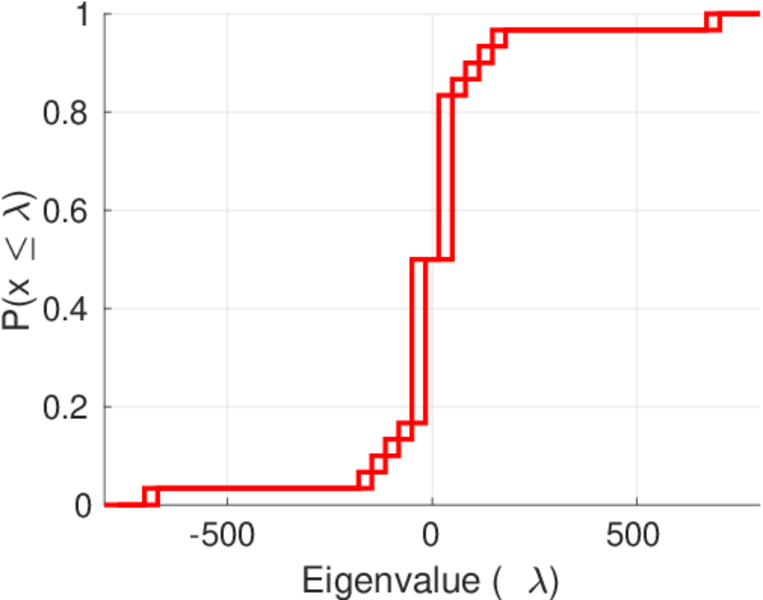
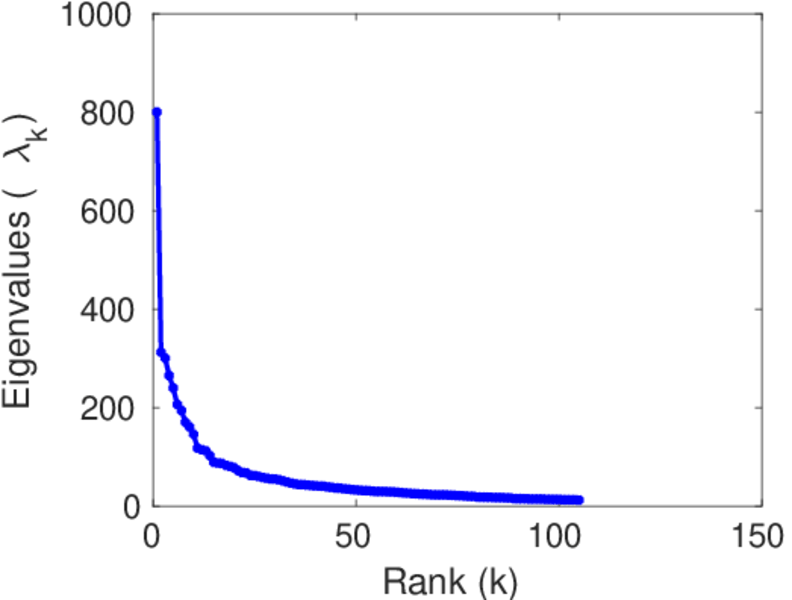
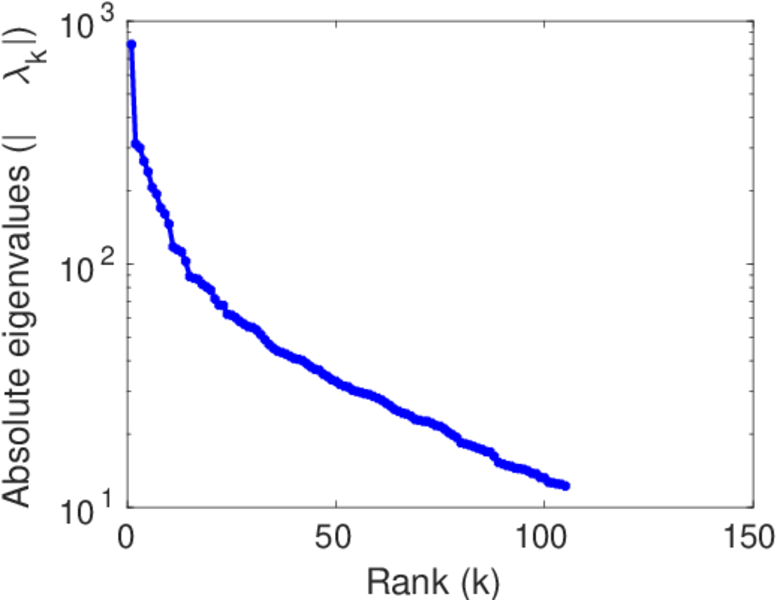
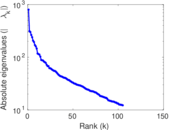
| Spectral norm | α = | 800.174
|
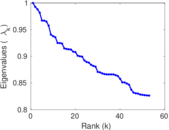
| Algebraic connectivity | a = | 0.014 977 4
|
| Spectral separation | |λ1[A] / λ2[A]| = | 2.561 83
|
| Controllability | C = | 16,600
|
| Relative controllability | Cr = | 0.872 032
|
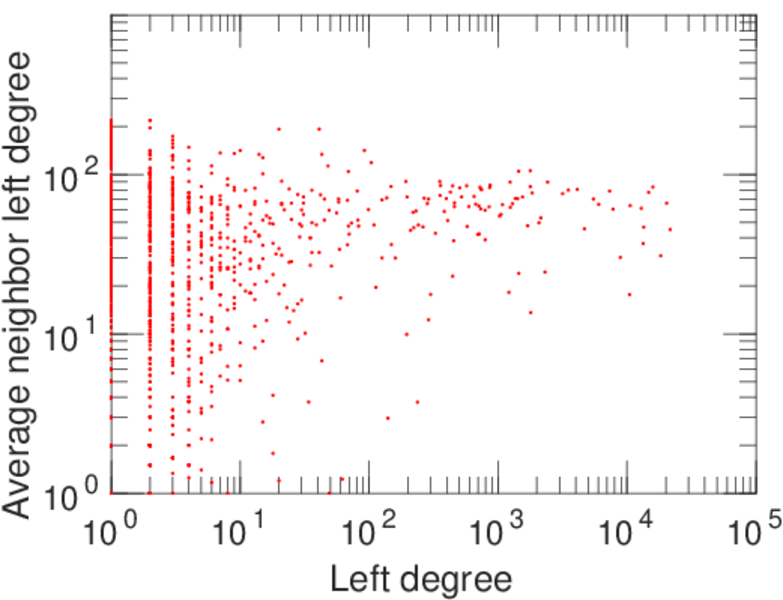
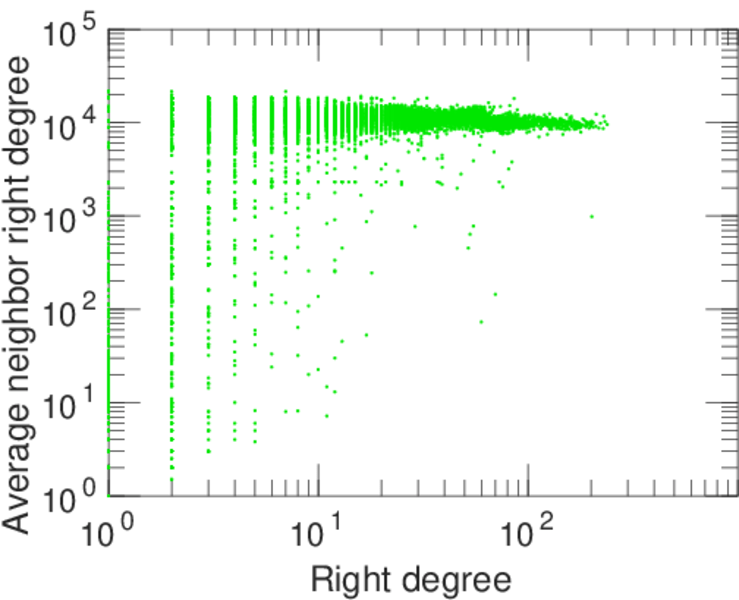
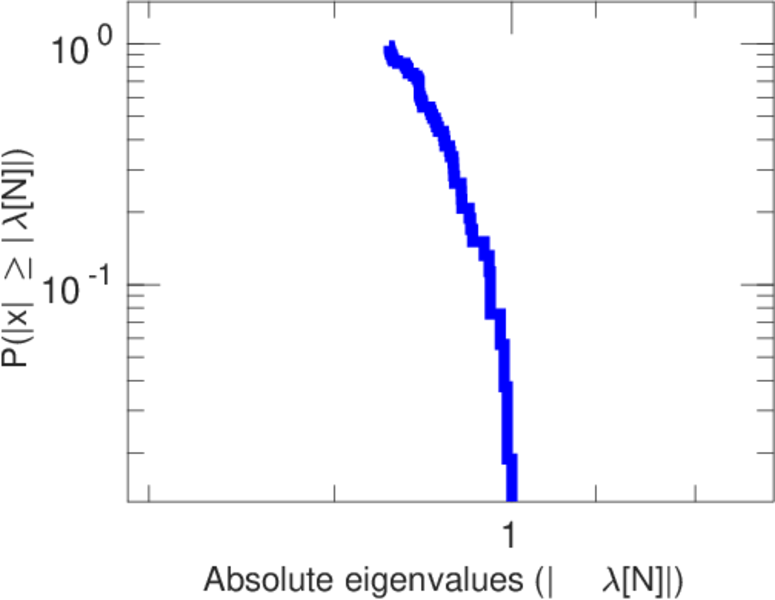
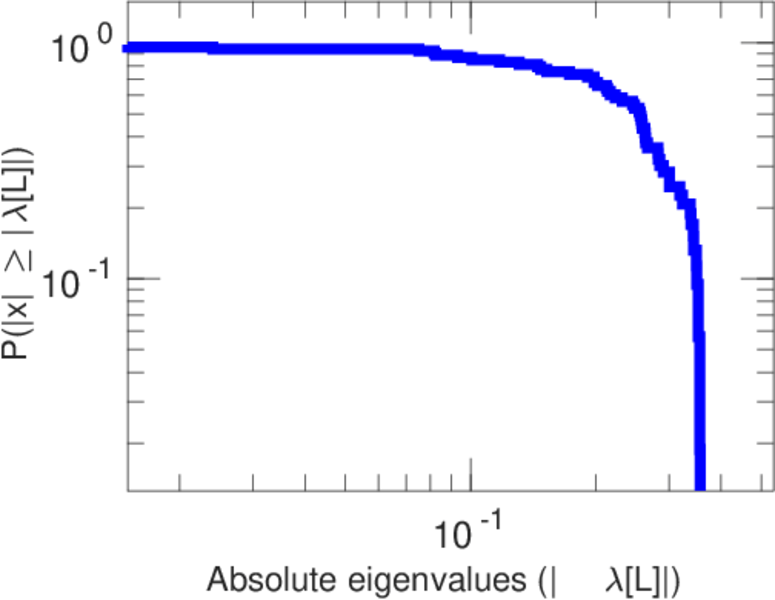
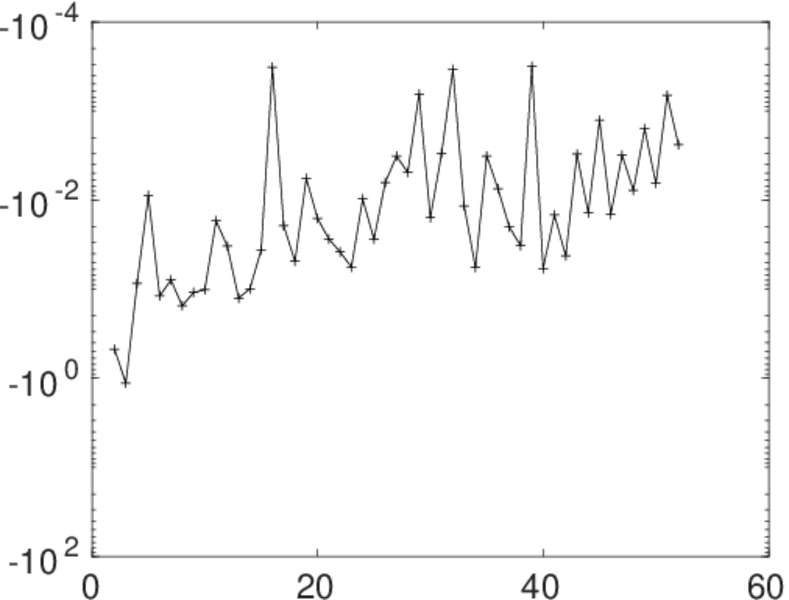
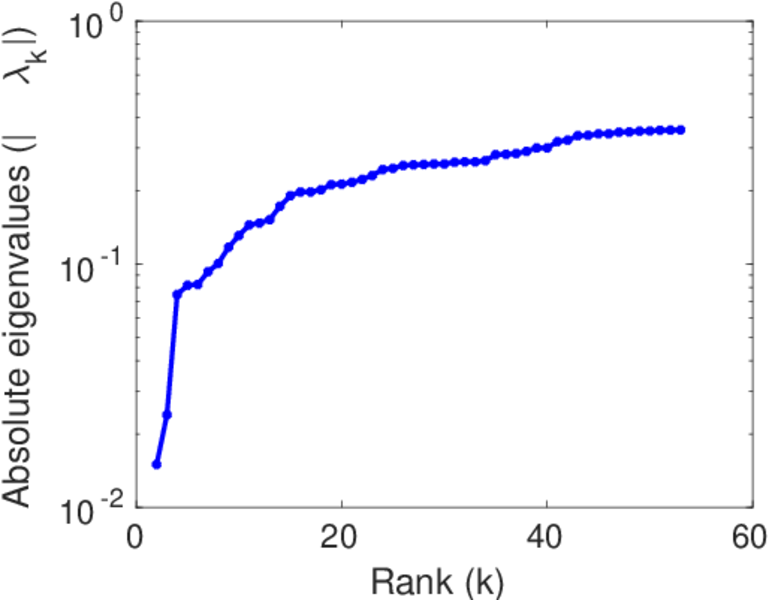
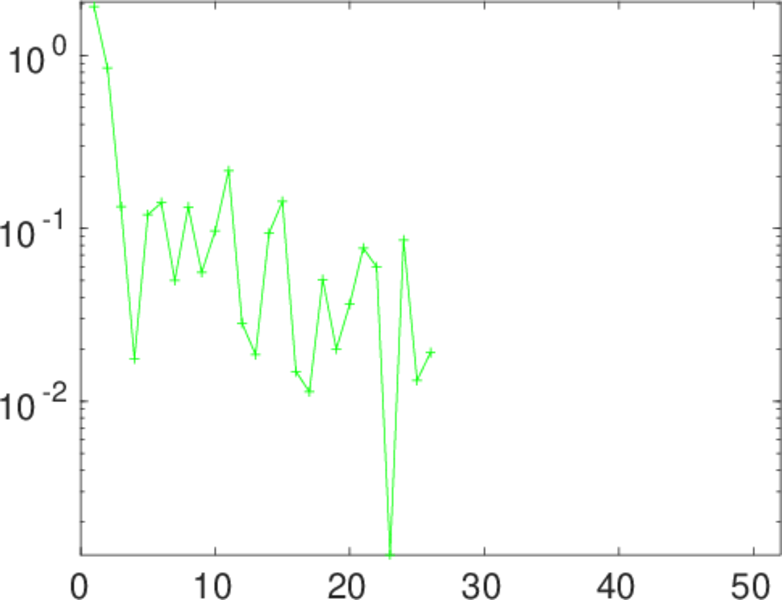
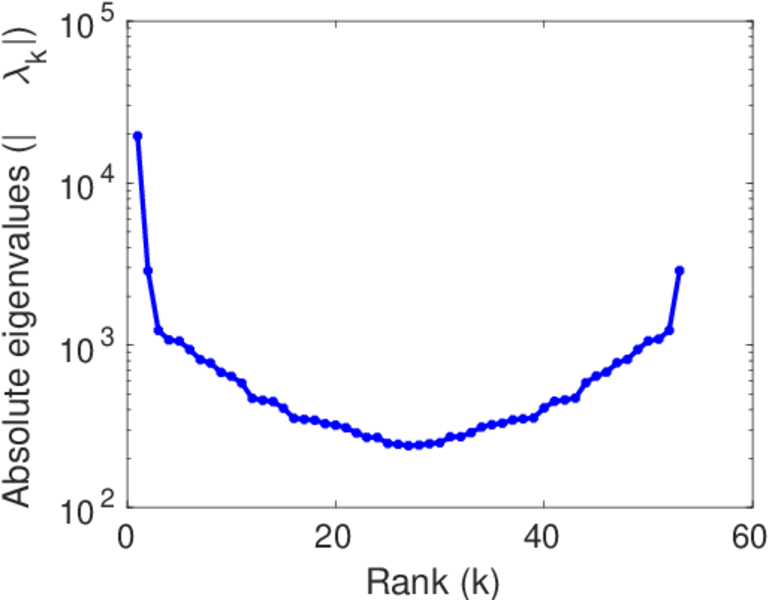
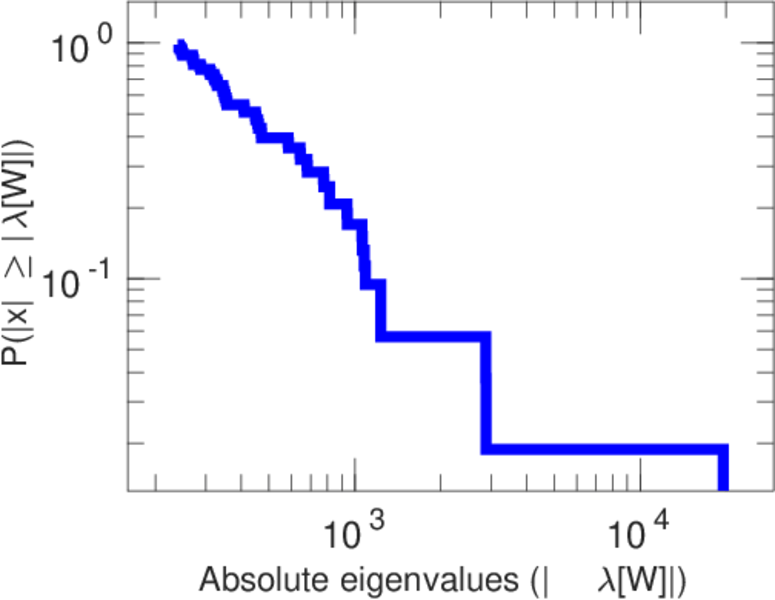
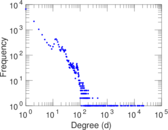
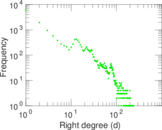
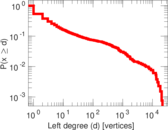
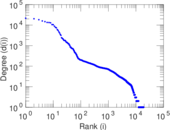
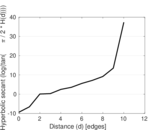
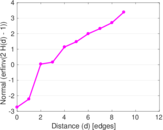
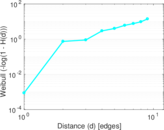
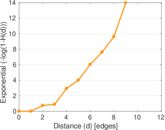
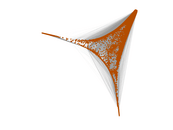
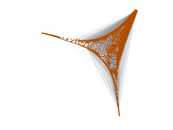
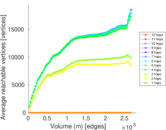
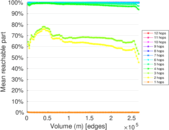
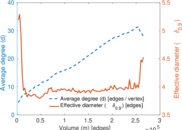
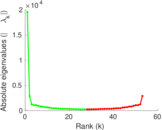
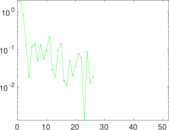
Plots


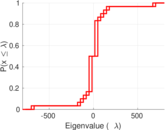
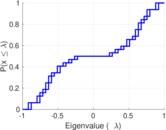
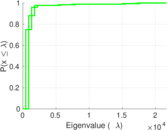
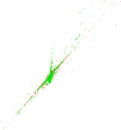


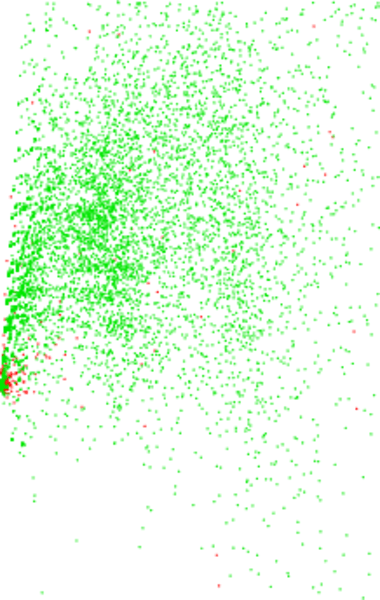
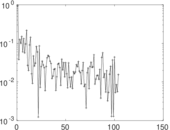
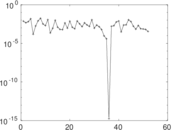
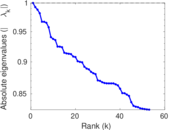
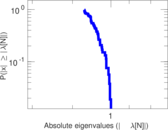
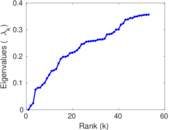
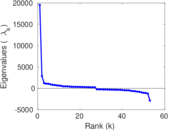
Matrix decompositions plots


Downloads
References
|
[1]
|
Jérôme Kunegis.
KONECT – The Koblenz Network Collection.
In Proc. Int. Conf. on World Wide Web Companion, pages
1343–1350, 2013.
[ http ]
|
|
[2]
|
Wikimedia Foundation.
Wikimedia downloads.
http://dumps.wikimedia.org/, January 2010.
|
 KONECT ‣ Networks ‣
Buy Me a Coffee
KONECT ‣ Networks ‣
Buy Me a Coffee