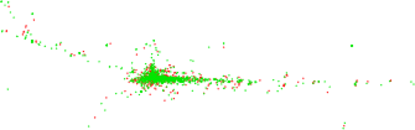
Wikipedia edits (pap)
This is the bipartite edit network of the Papiamento Wikipedia. It contains
users and pages from the Papiamento Wikipedia, connected by edit events. Each
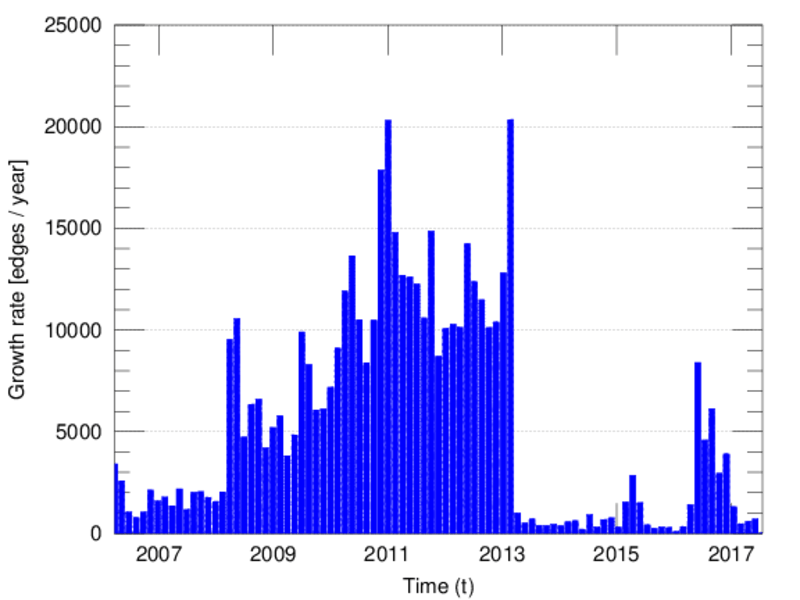
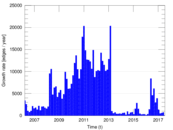
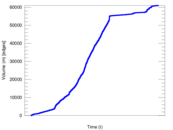
edge represents an edit. The dataset includes the timestamp of each edit.
Metadata
Statistics
| Size | n = | 5,341
|
| Left size | n1 = | 914
|
| Right size | n2 = | 4,427
|
| Volume | m = | 61,014
|
| Unique edge count | m̿ = | 27,033
|
| Wedge count | s = | 6,358,812
|
| Claw count | z = | 1,536,828,934
|
| Cross count | x = | 358,953,428,781
|
| Square count | q = | 21,235,118
|
| 4-Tour count | T4 = | 195,370,514
|
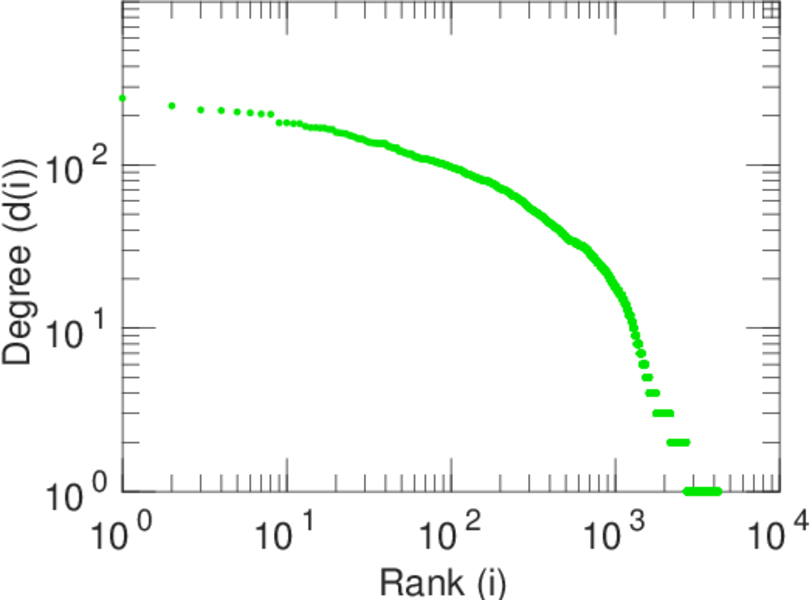
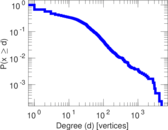
| Maximum degree | dmax = | 4,841
|
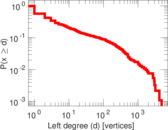
| Maximum left degree | d1max = | 4,841
|
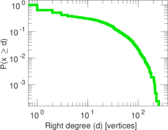
| Maximum right degree | d2max = | 256
|
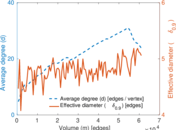
| Average degree | d = | 22.847 4
|
| Average left degree | d1 = | 66.754 9
|
| Average right degree | d2 = | 13.782 2
|
| Fill | p = | 0.006 680 95
|
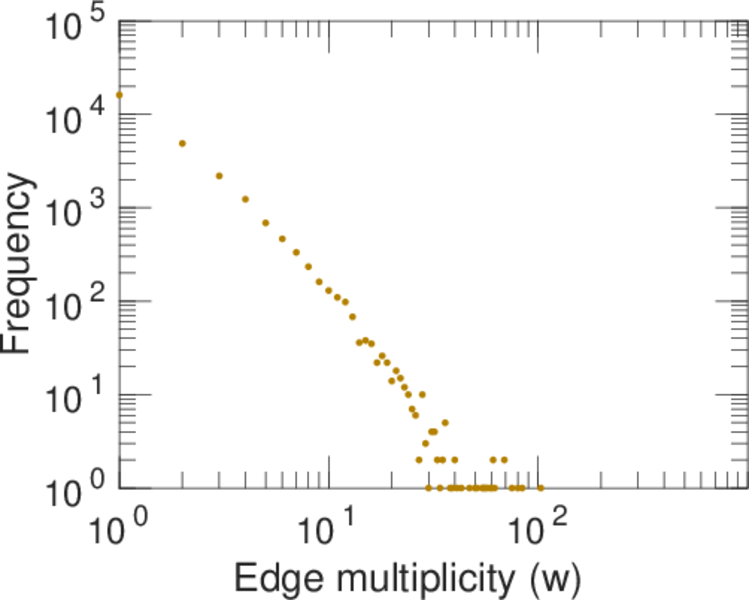
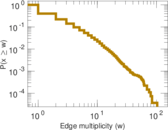
| Average edge multiplicity | m̃ = | 2.257 02
|
| Size of LCC | N = | 4,629
|
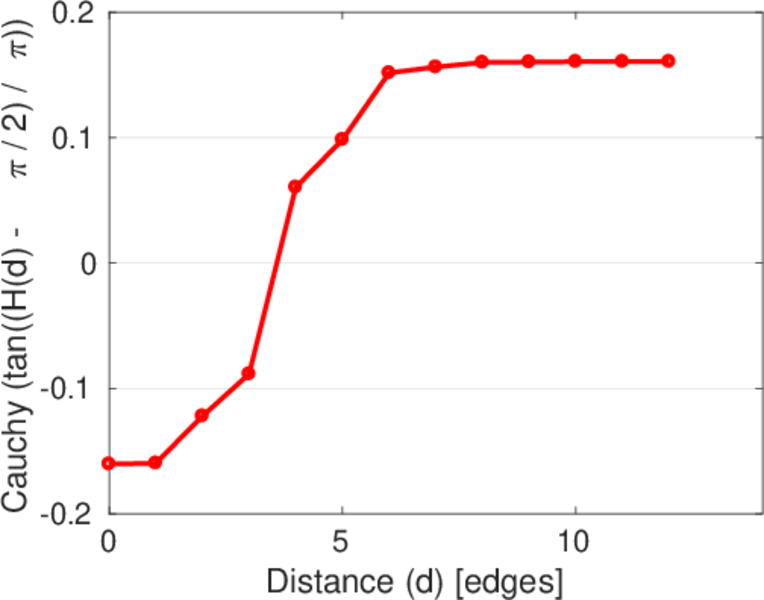
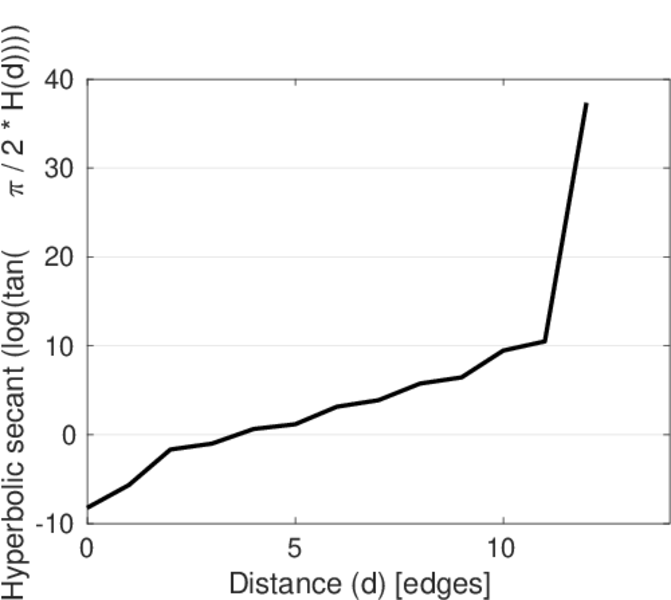
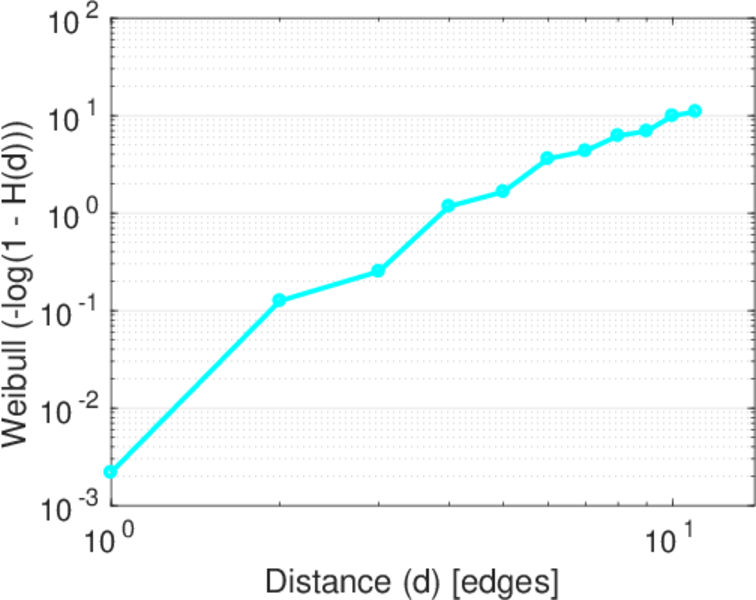
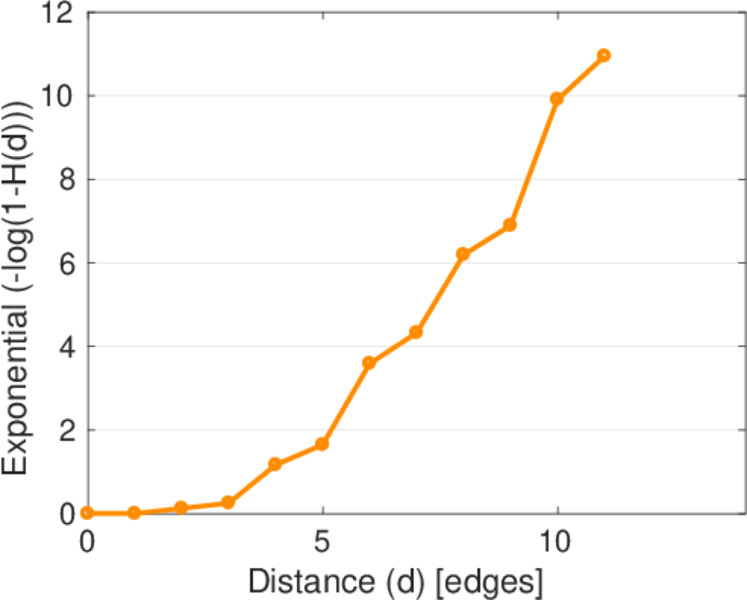
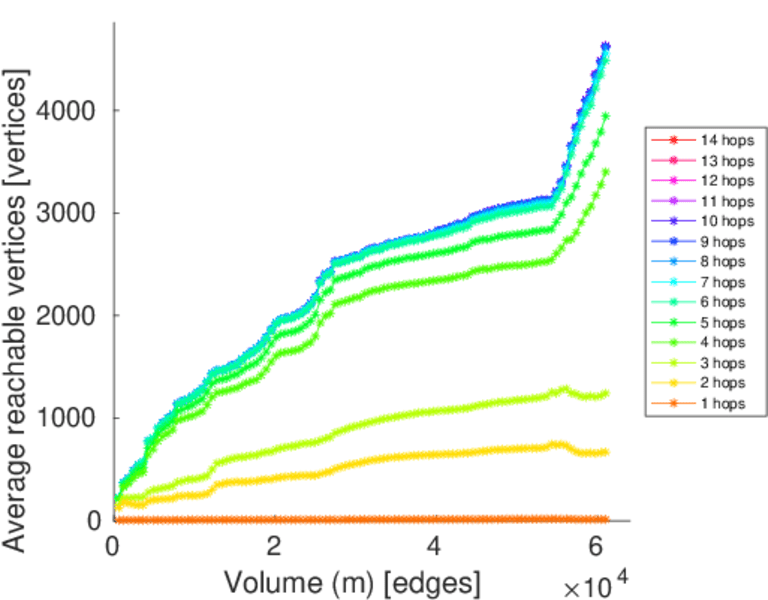
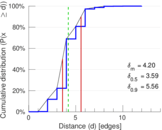
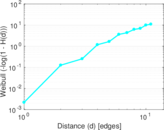
| Diameter | δ = | 14
|
| 50-Percentile effective diameter | δ0.5 = | 3.594 95
|
| 90-Percentile effective diameter | δ0.9 = | 5.560 48
|
| Median distance | δM = | 4
|
| Mean distance | δm = | 4.204 64
|
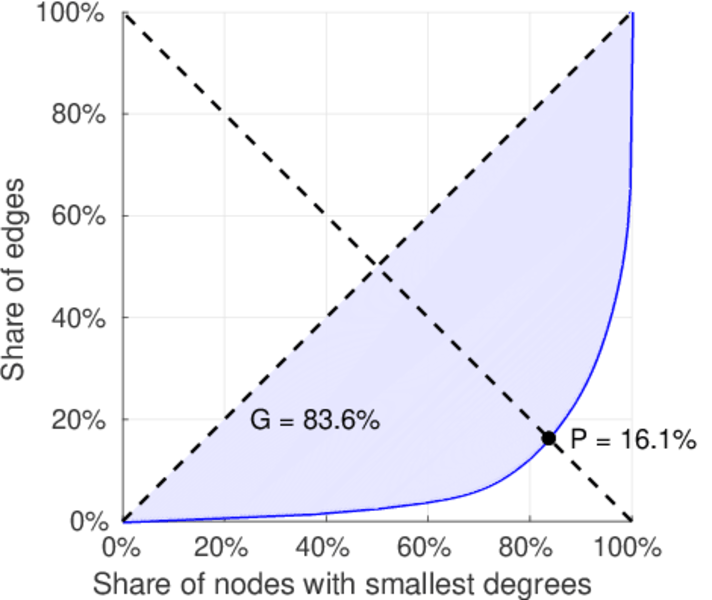
| Gini coefficient | G = | 0.824 473
|
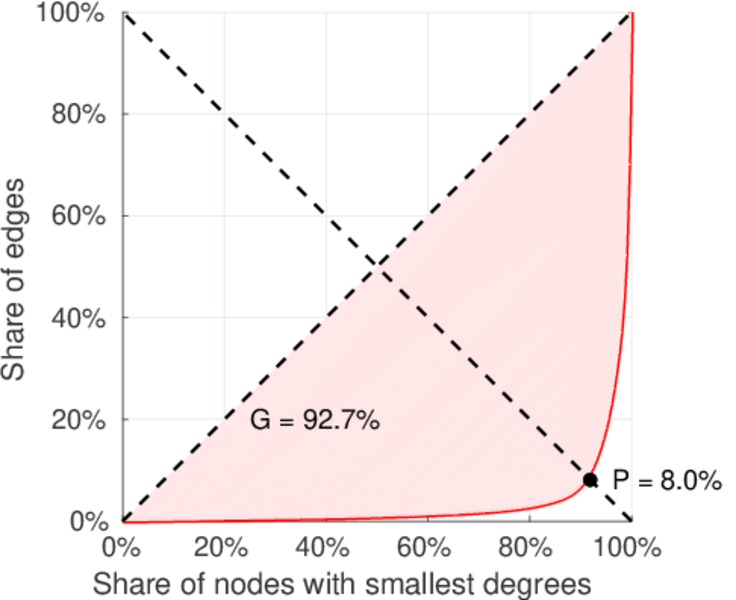
| Balanced inequality ratio | P = | 0.173 165
|
| Left balanced inequality ratio | P1 = | 0.079 735 8
|
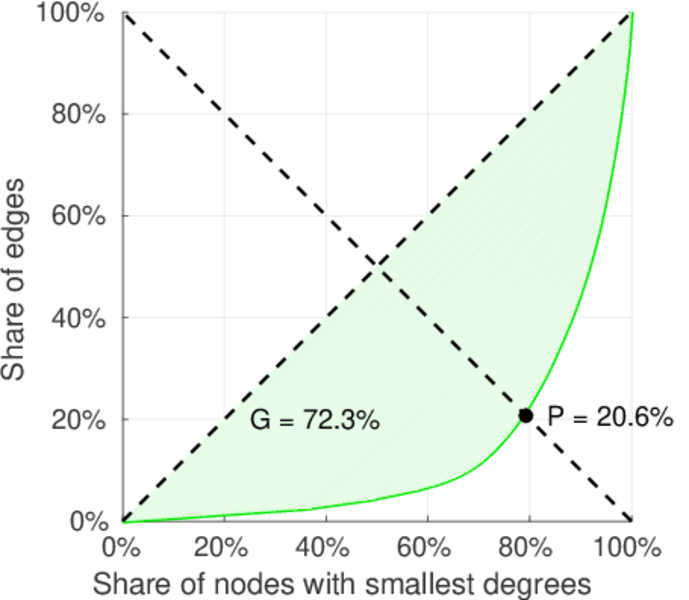
| Right balanced inequality ratio | P2 = | 0.205 789
|
| Relative edge distribution entropy | Her = | 0.798 591
|
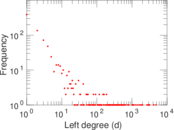
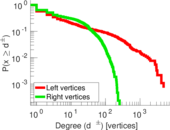
| Power law exponent | γ = | 1.984 77
|
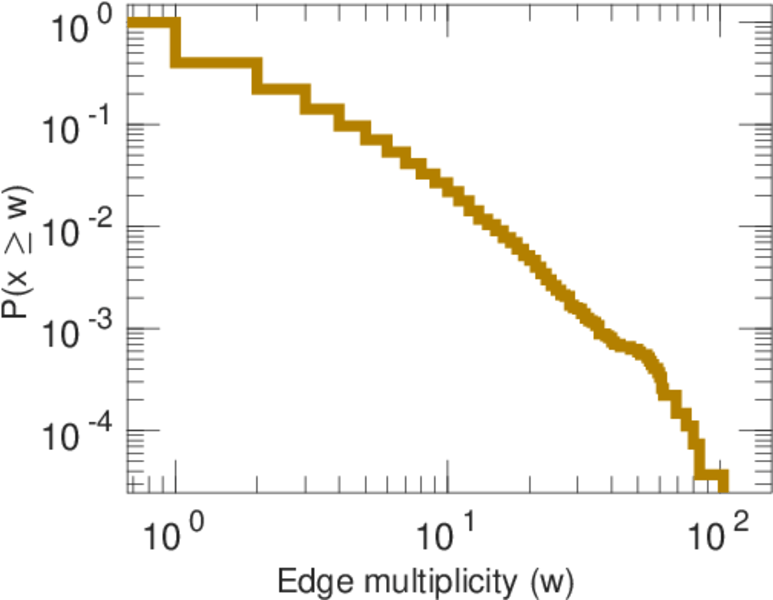
| Tail power law exponent | γt = | 2.391 00
|
| Tail power law exponent with p | γ3 = | 2.391 00
|
| p-value | p = | 0.000 00
|
| Left tail power law exponent with p | γ3,1 = | 1.651 00
|
| Left p-value | p1 = | 0.000 00
|
| Right tail power law exponent with p | γ3,2 = | 5.441 00
|
| Right p-value | p2 = | 0.007 000 00
|
| Degree assortativity | ρ = | −0.009 473 55
|
| Degree assortativity p-value | pρ = | 0.119 333
|
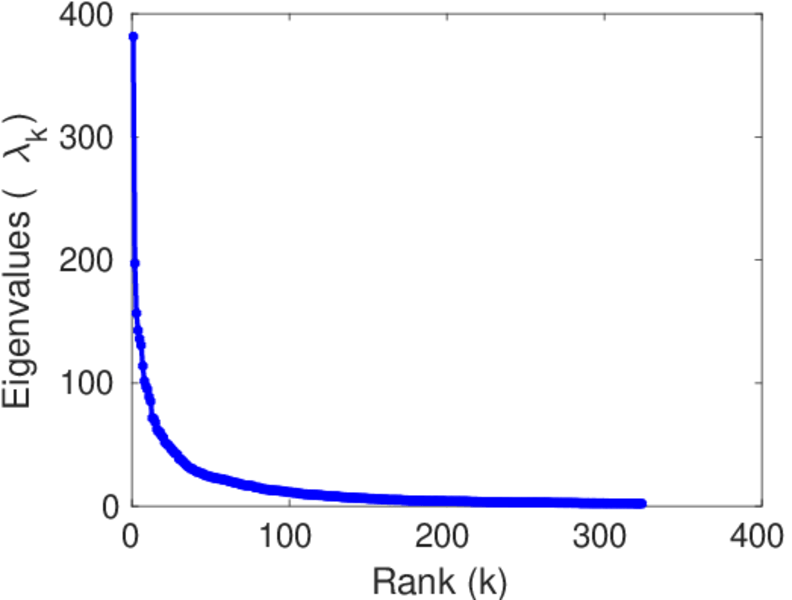
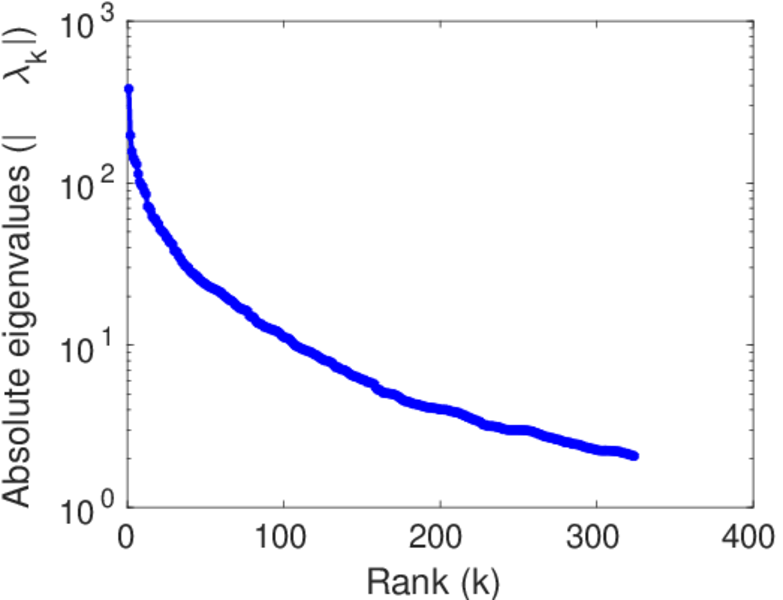
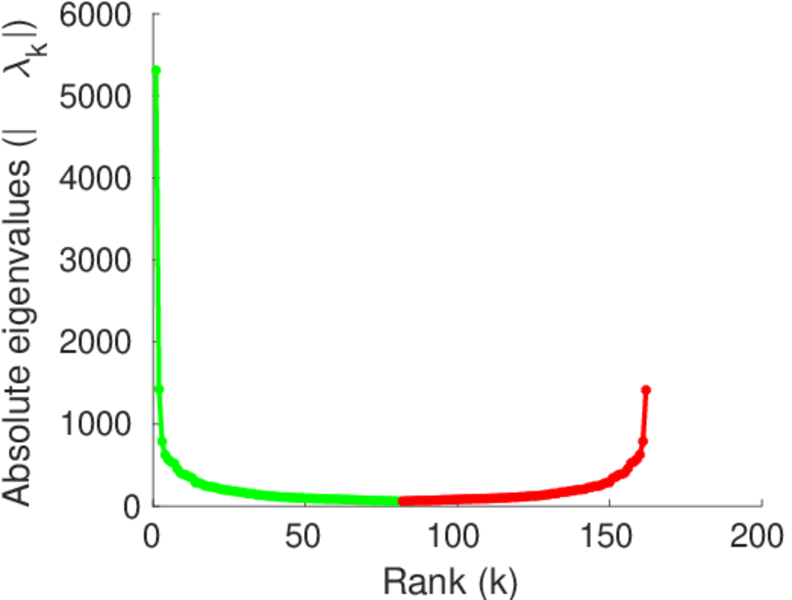
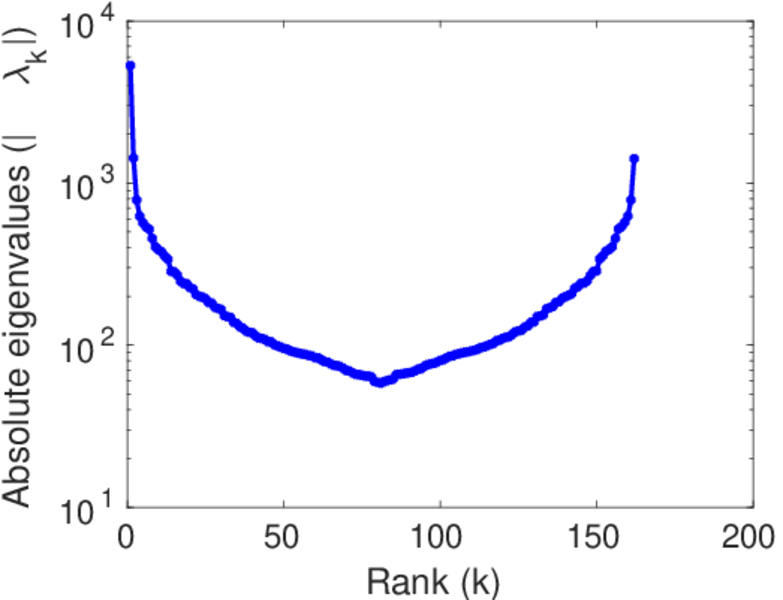
| Spectral norm | α = | 381.362
|
| Algebraic connectivity | a = | 0.026 554 3
|
| Spectral separation | |λ1[A] / λ2[A]| = | 1.935 52
|
| Controllability | C = | 3,457
|
| Relative controllability | Cr = | 0.672 437
|
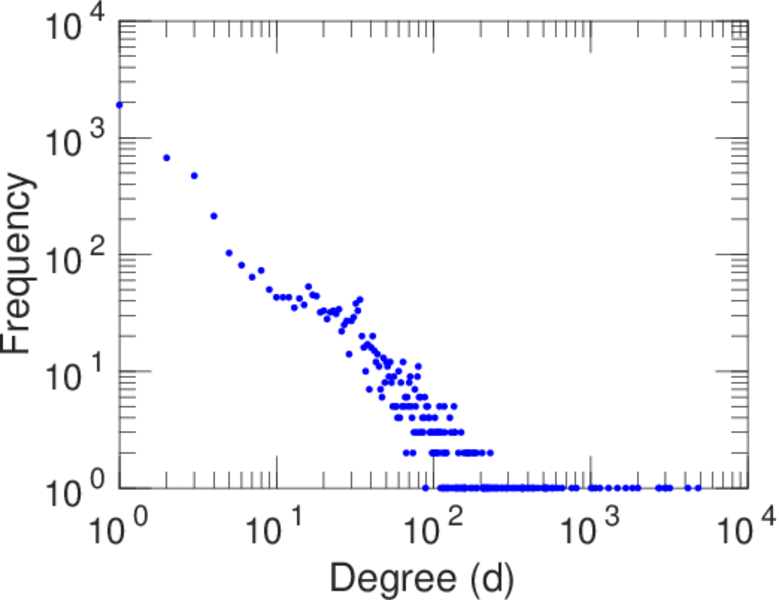
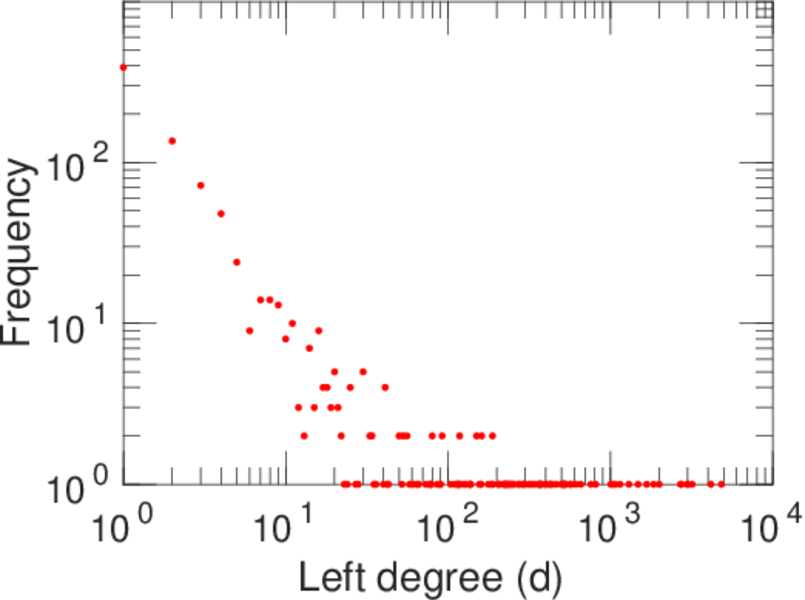
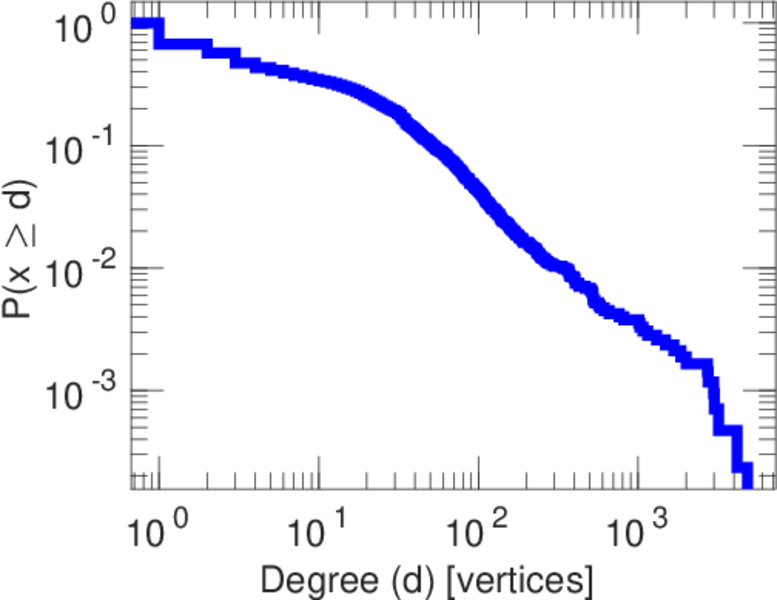
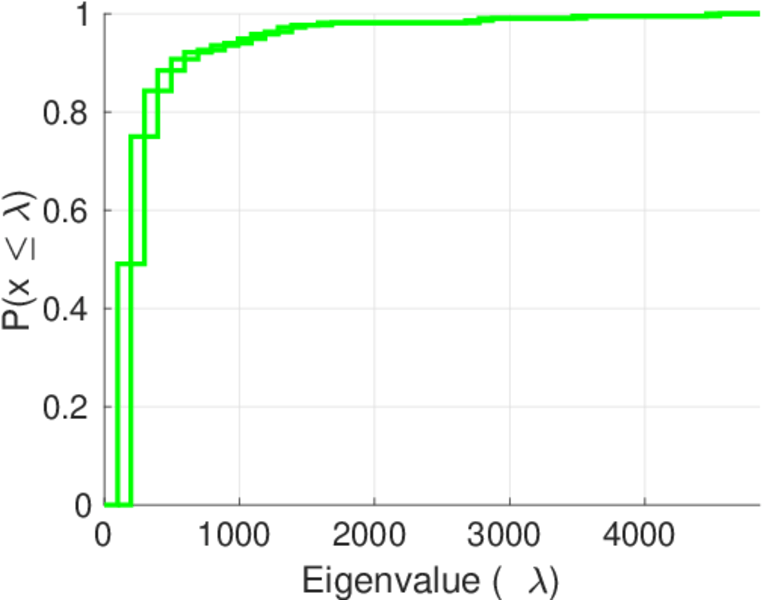
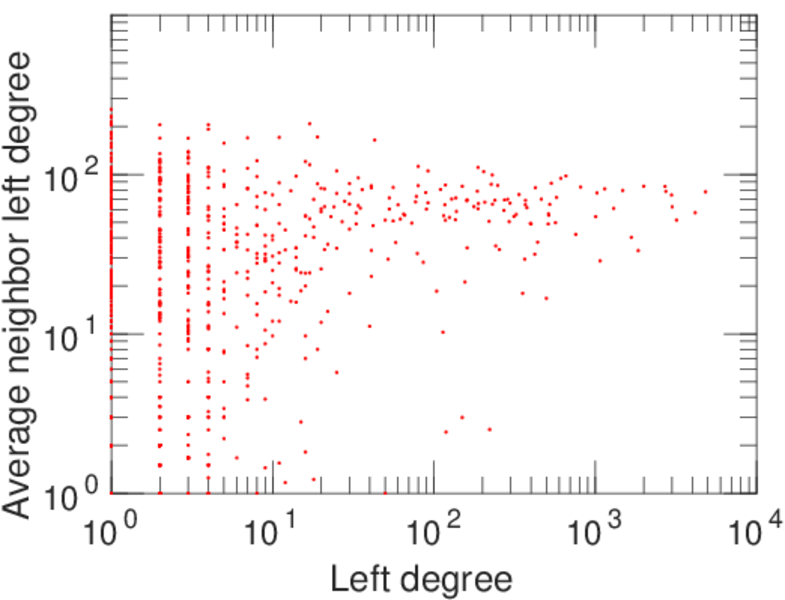
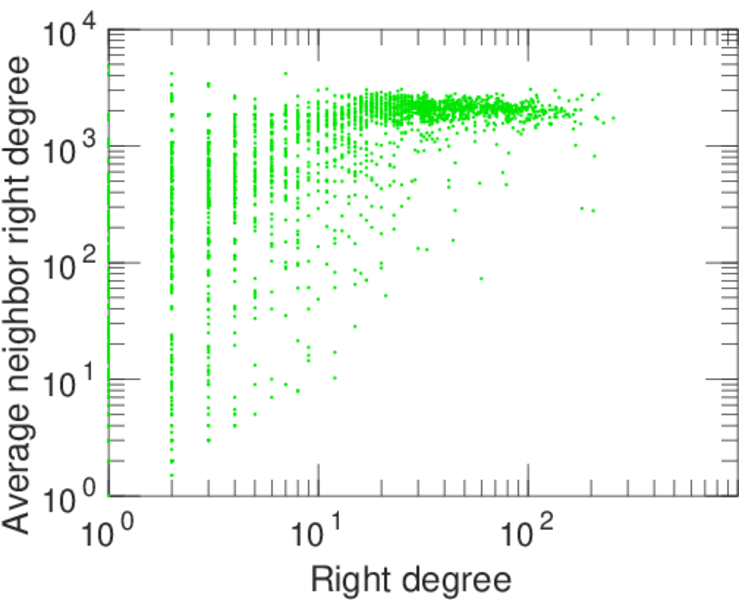
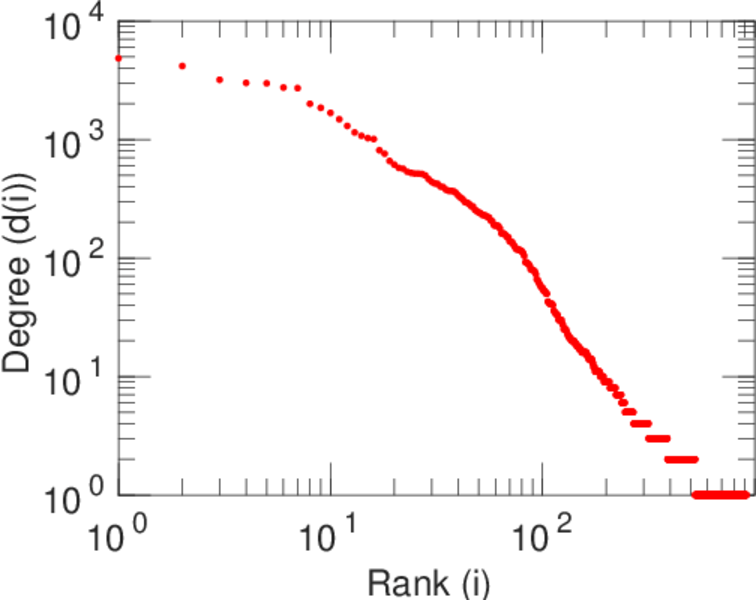
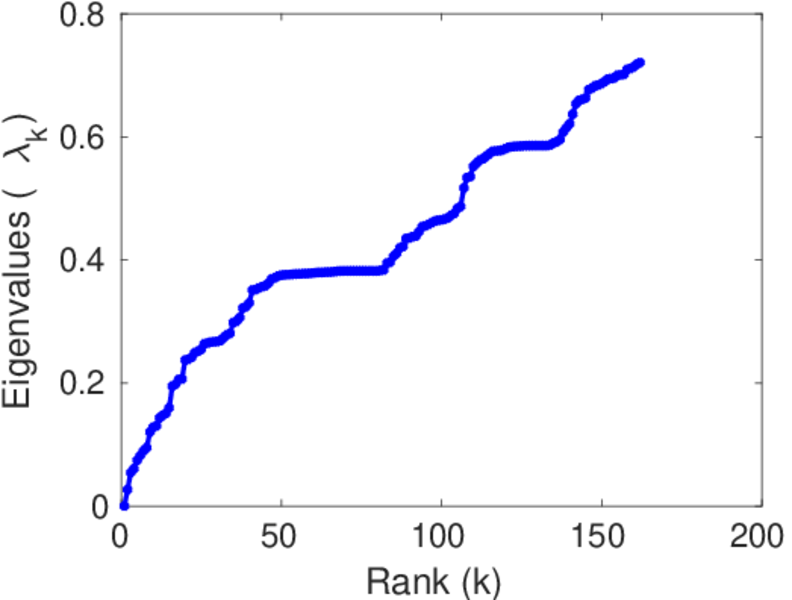
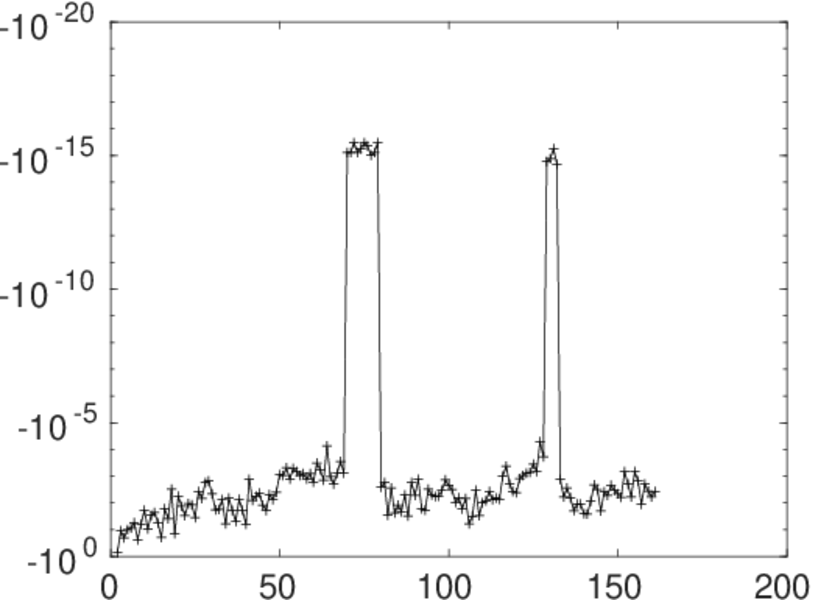
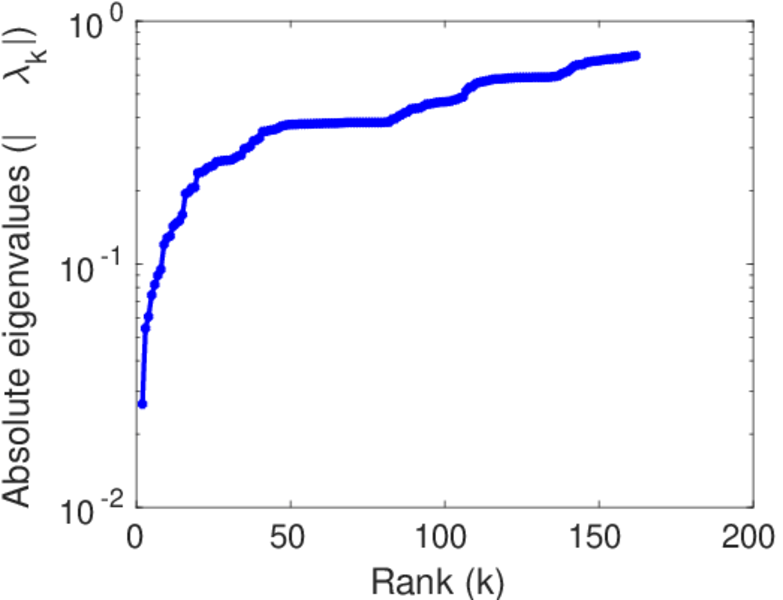
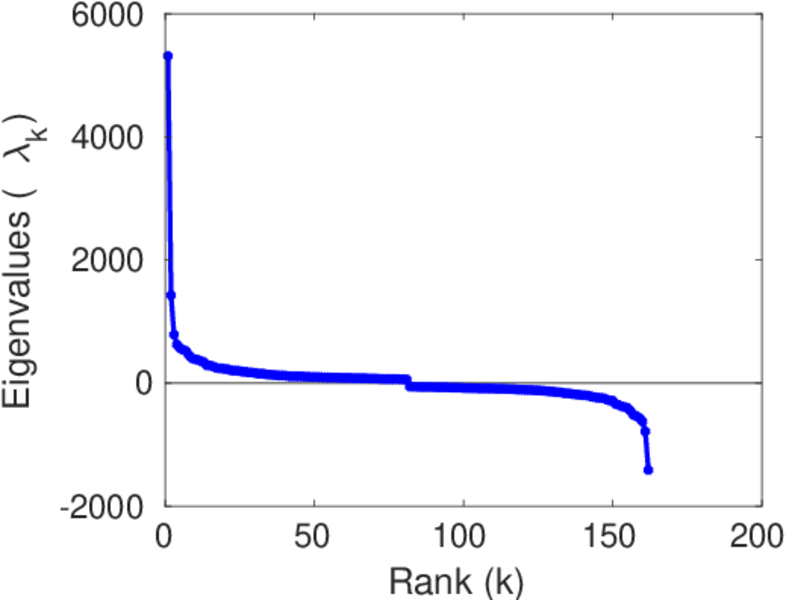
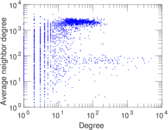
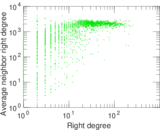
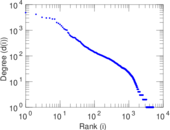
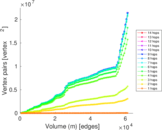
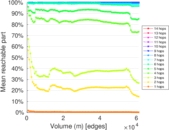
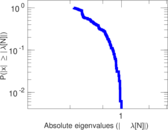
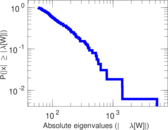
Plots


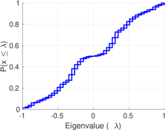

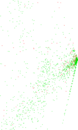
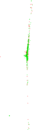


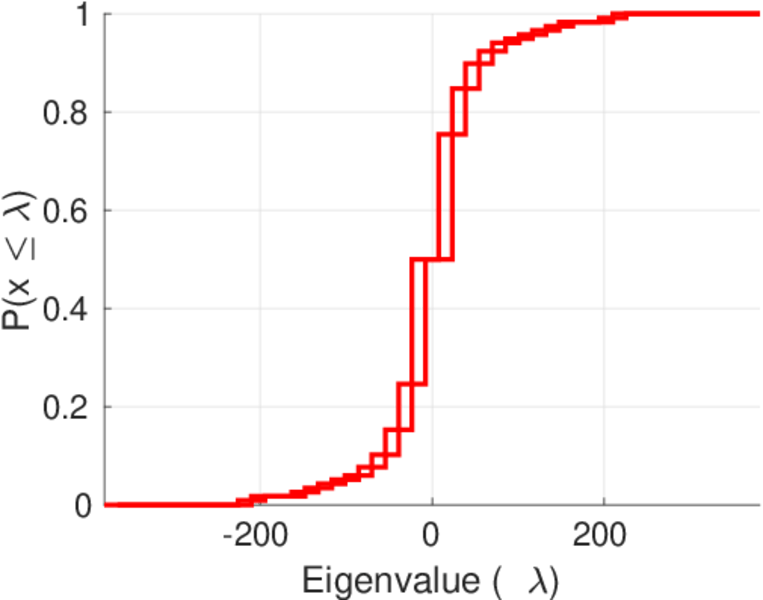
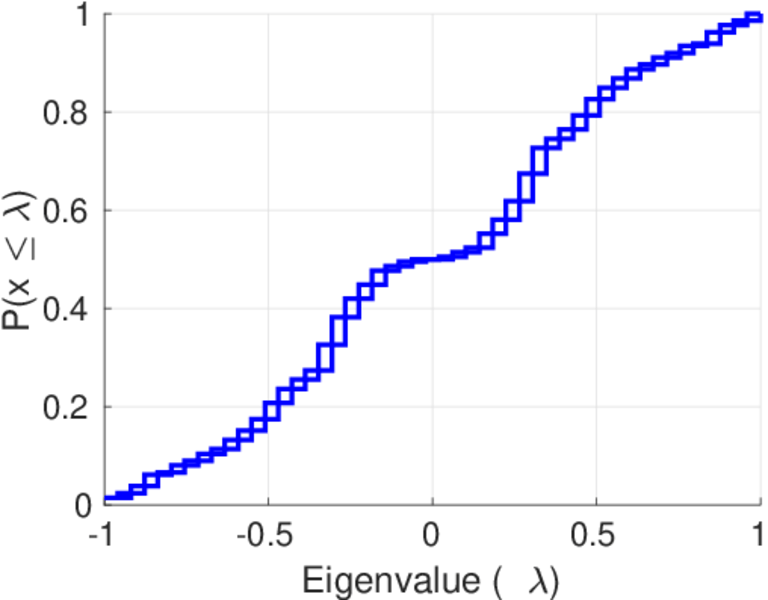
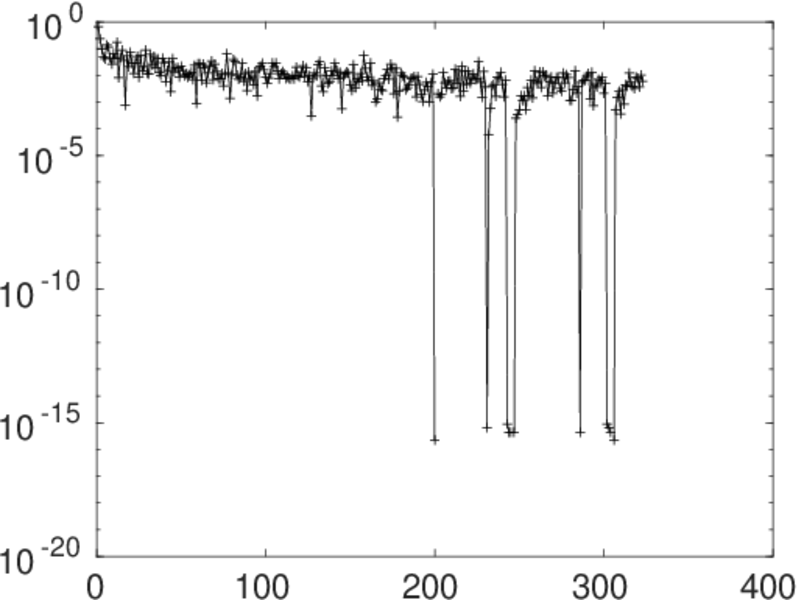
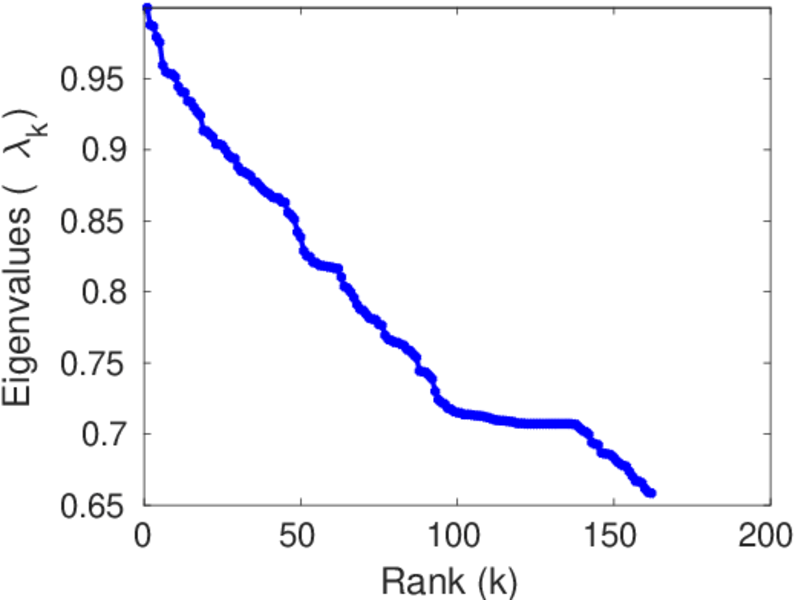
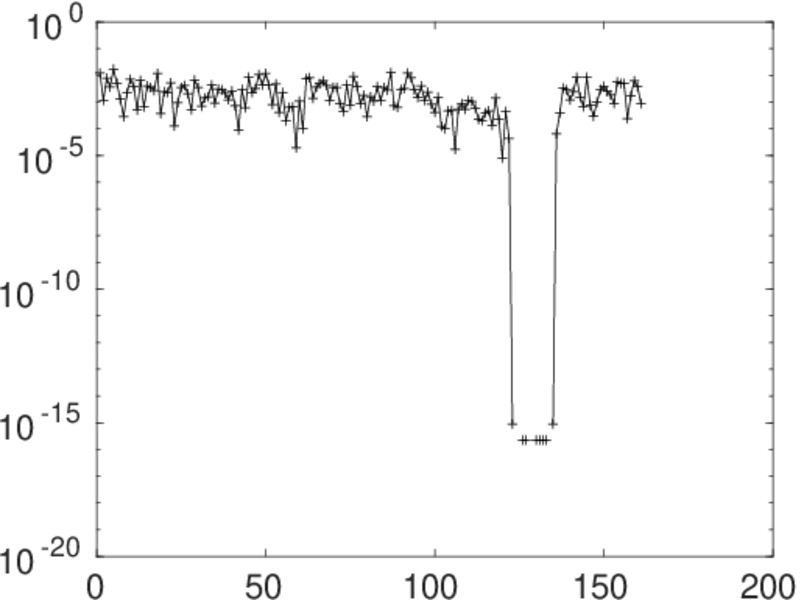
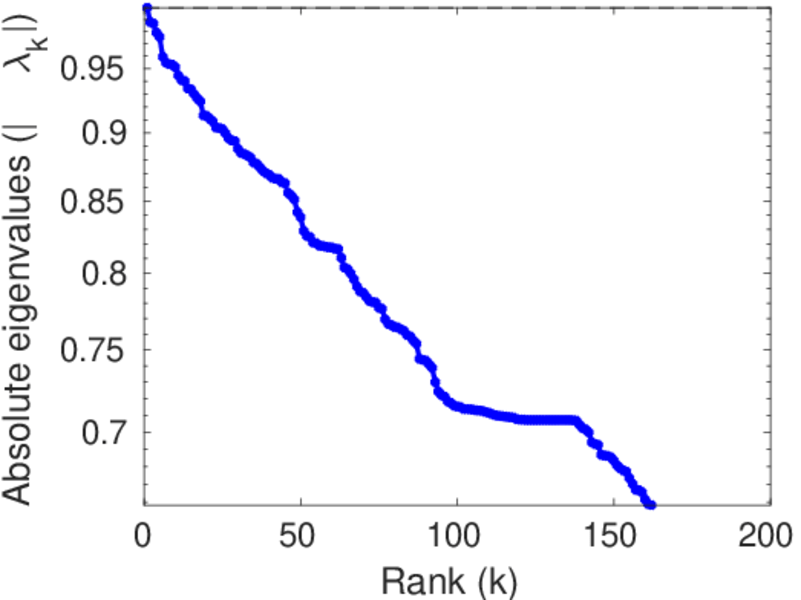
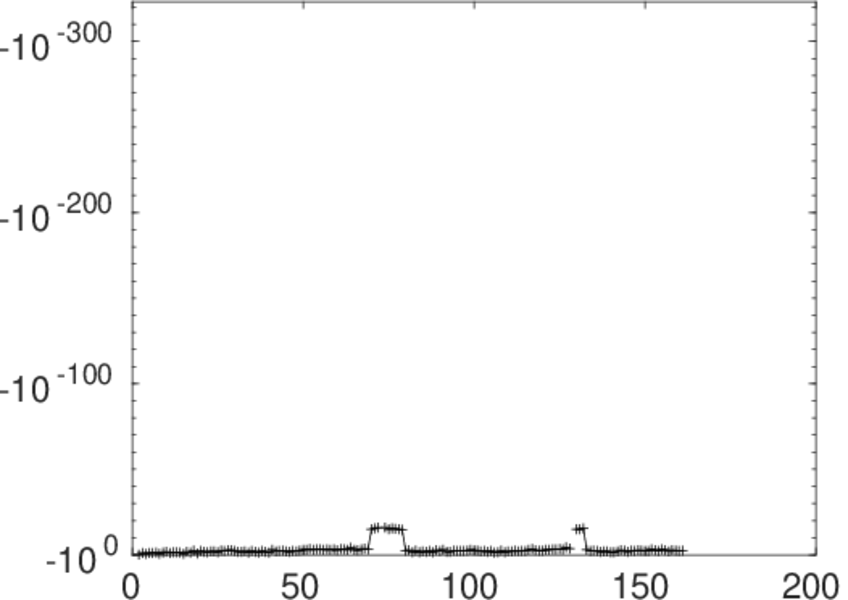
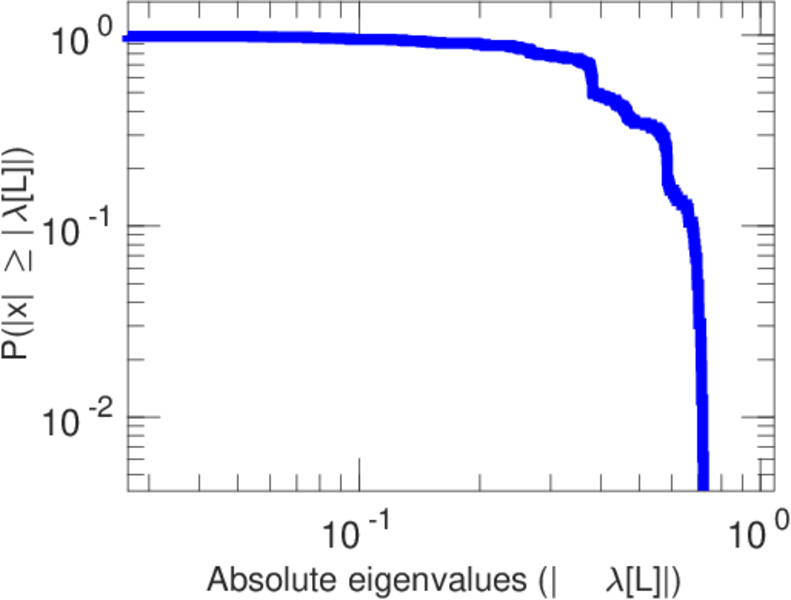
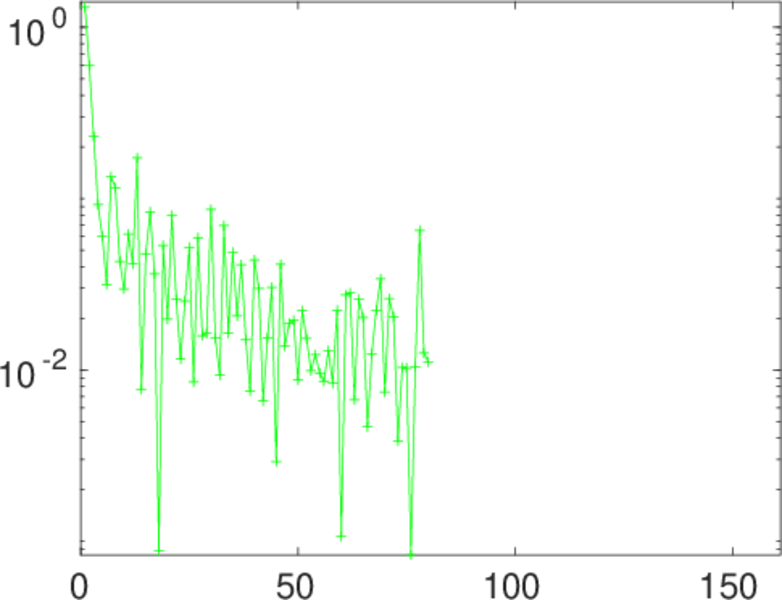
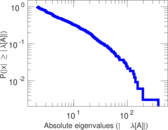
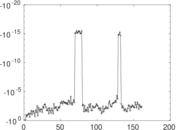
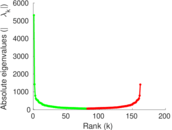
Matrix decompositions plots


Downloads
References
|
[1]
|
Jérôme Kunegis.
KONECT – The Koblenz Network Collection.
In Proc. Int. Conf. on World Wide Web Companion, pages
1343–1350, 2013.
[ http ]
|
|
[2]
|
Wikimedia Foundation.
Wikimedia downloads.
http://dumps.wikimedia.org/, January 2010.
|
 KONECT ‣ Networks ‣
Buy Me a Coffee
KONECT ‣ Networks ‣
Buy Me a Coffee