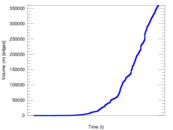
Wikipedia edits (pa)
This is the bipartite edit network of the Punjabi Wikipedia. It contains users
and pages from the Punjabi Wikipedia, connected by edit events. Each edge
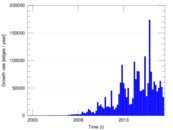
represents an edit. The dataset includes the timestamp of each edit.
Metadata
Statistics
| Size | n = | 90,005
|
| Left size | n1 = | 2,556
|
| Right size | n2 = | 87,449
|
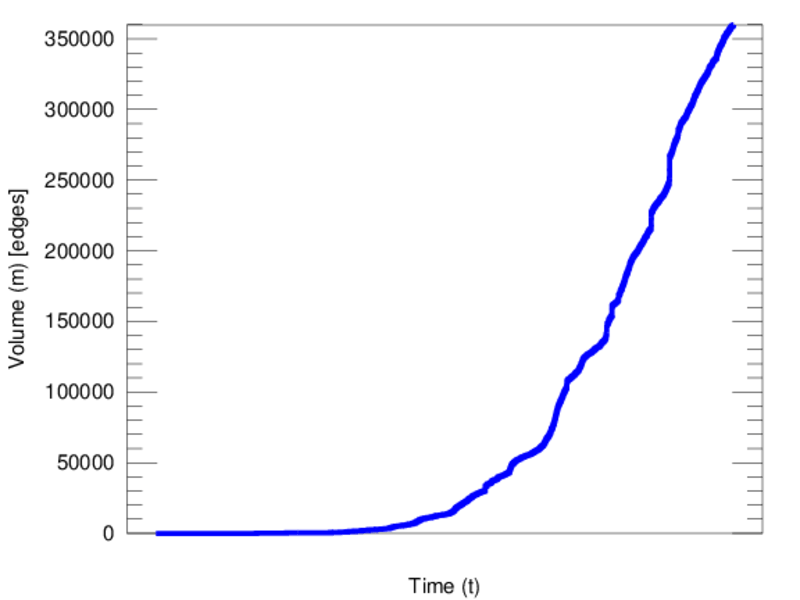
| Volume | m = | 359,766
|
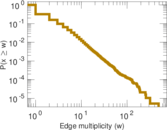
| Unique edge count | m̿ = | 189,836
|
| Wedge count | s = | 737,583,603
|
| Claw count | z = | 3,433,668,557,027
|
| Cross count | x = | 13,986,413,949,489,736
|
| Square count | q = | 229,270,842
|
| 4-Tour count | T4 = | 4,784,956,640
|
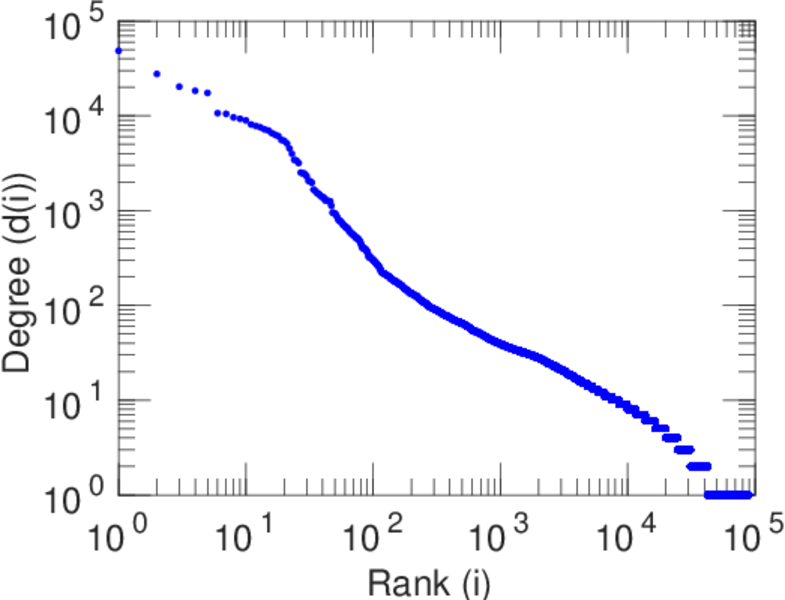
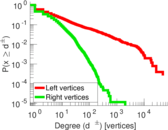
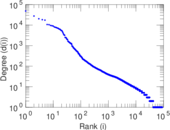
| Maximum degree | dmax = | 48,500
|
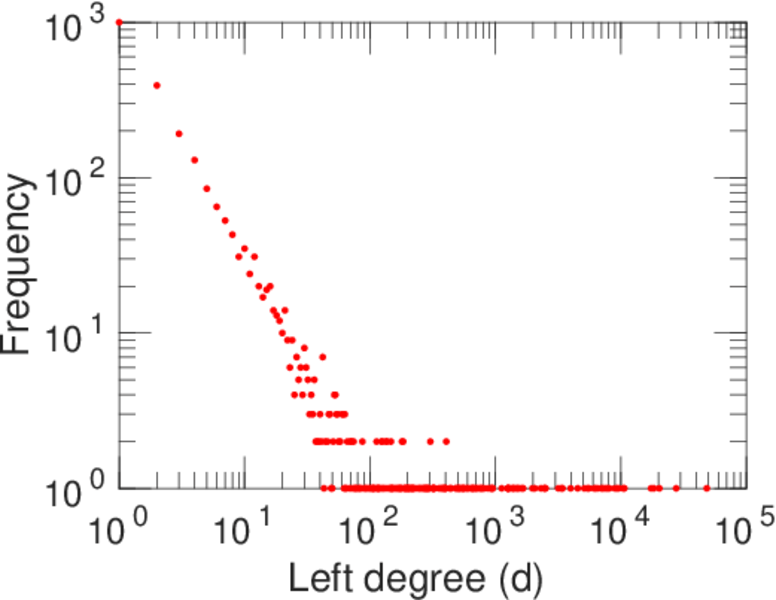
| Maximum left degree | d1max = | 48,500
|
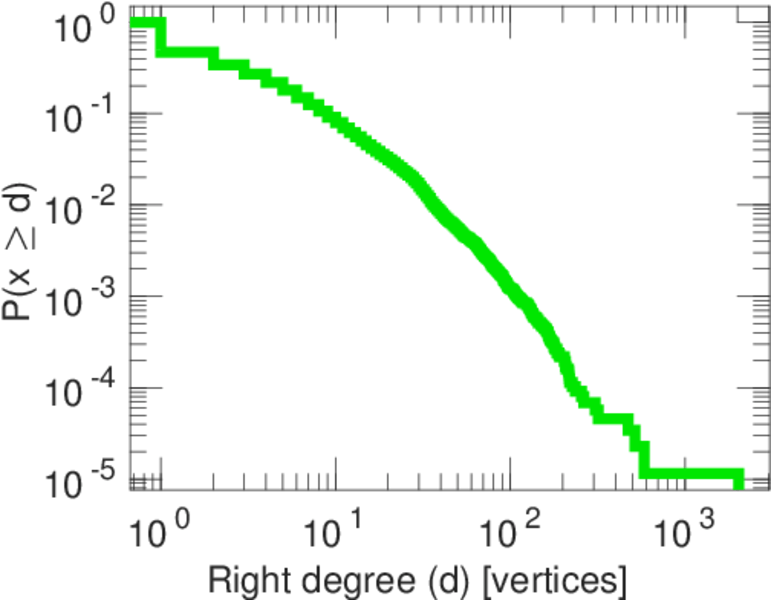
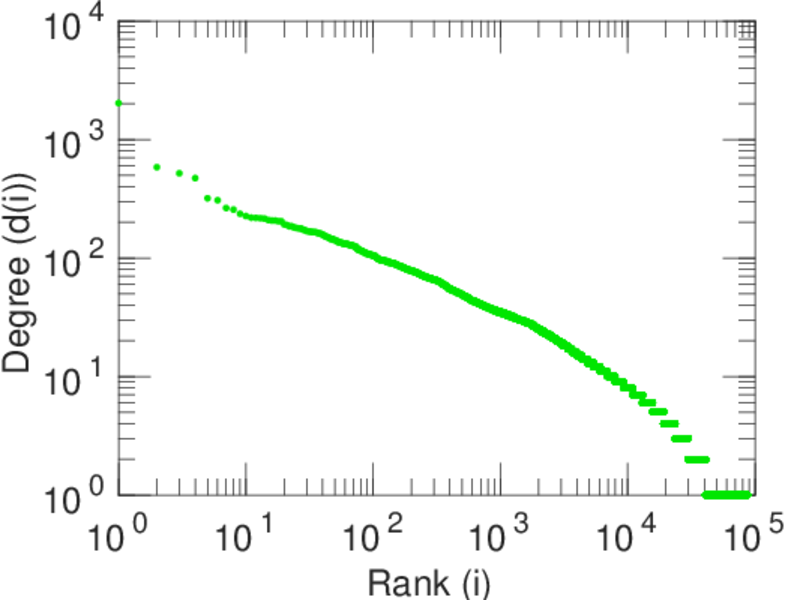
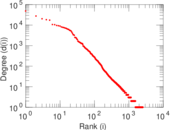
| Maximum right degree | d2max = | 2,029
|
| Average degree | d = | 7.994 36
|
| Average left degree | d1 = | 140.754
|
| Average right degree | d2 = | 4.114 01
|
| Fill | p = | 0.000 849 303
|
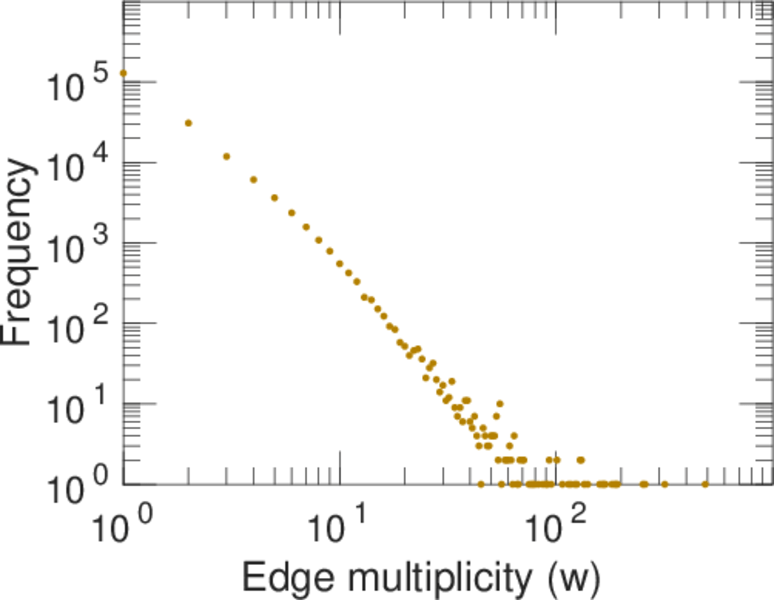
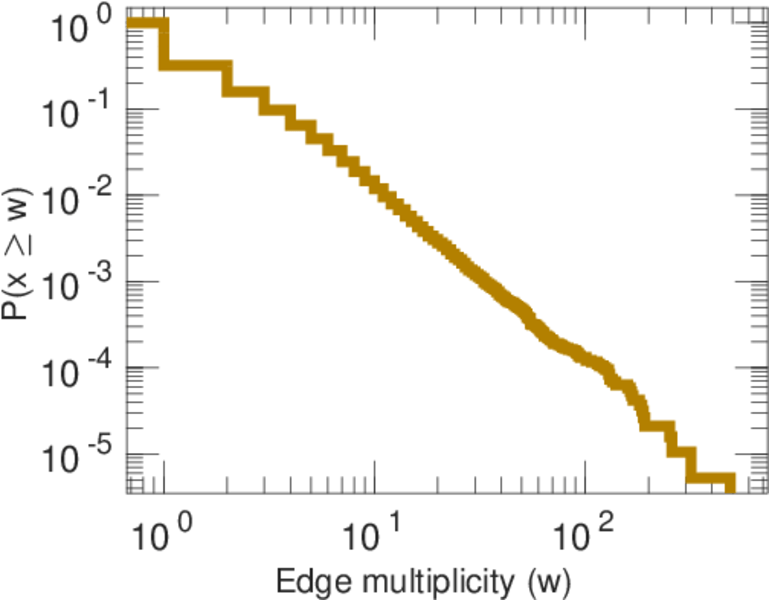
| Average edge multiplicity | m̃ = | 1.895 14
|
| Size of LCC | N = | 88,948
|
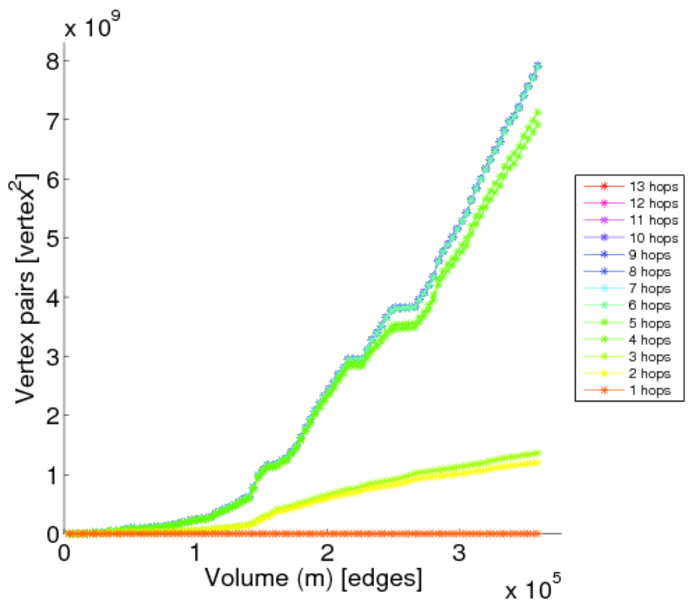
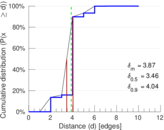
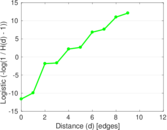
| Diameter | δ = | 13
|
| 50-Percentile effective diameter | δ0.5 = | 3.460 75
|
| 90-Percentile effective diameter | δ0.9 = | 4.037 71
|
| Median distance | δM = | 4
|
| Mean distance | δm = | 3.872 94
|
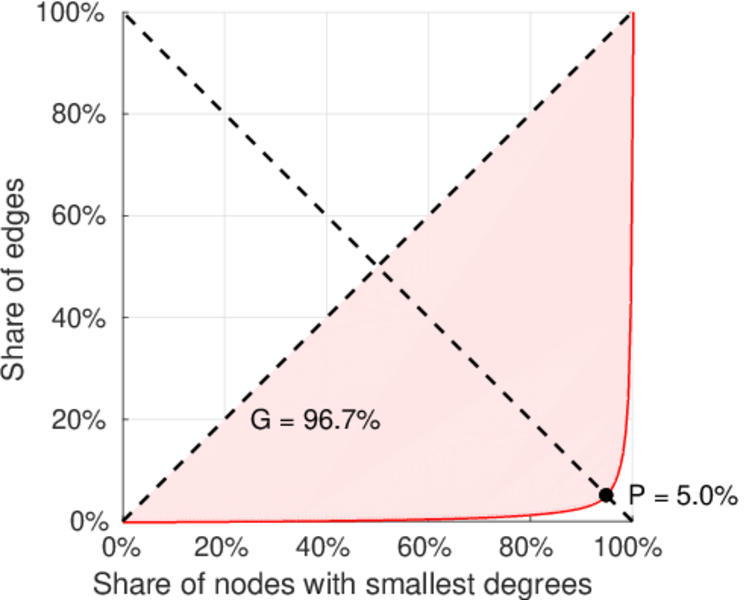
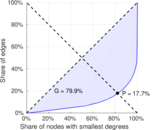
| Gini coefficient | G = | 0.804 026
|
| Balanced inequality ratio | P = | 0.173 199
|
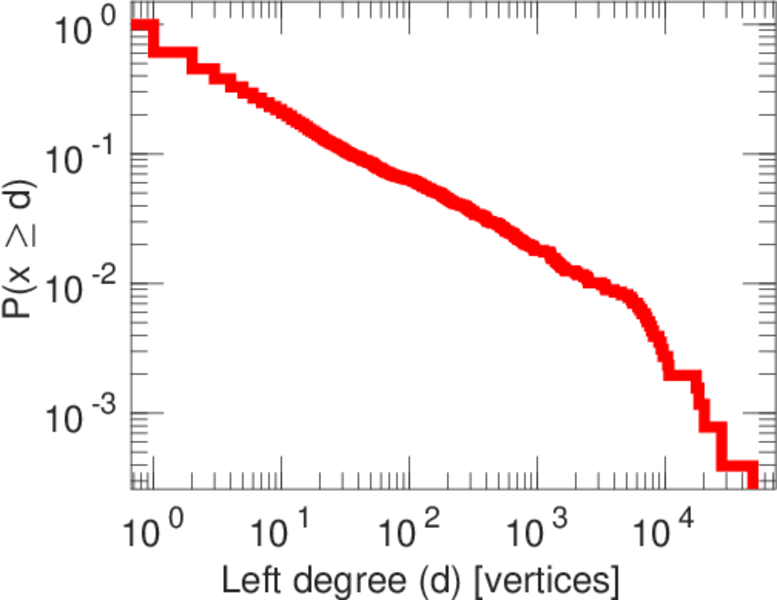
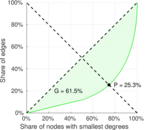
| Left balanced inequality ratio | P1 = | 0.049 724 0
|
| Right balanced inequality ratio | P2 = | 0.252 764
|
| Relative edge distribution entropy | Her = | 0.717 180
|
| Power law exponent | γ = | 3.241 83
|
| Tail power law exponent | γt = | 2.411 00
|
| Tail power law exponent with p | γ3 = | 2.411 00
|
| p-value | p = | 0.000 00
|
| Left tail power law exponent with p | γ3,1 = | 1.551 00
|
| Left p-value | p1 = | 0.000 00
|
| Right tail power law exponent with p | γ3,2 = | 2.471 00
|
| Right p-value | p2 = | 0.000 00
|
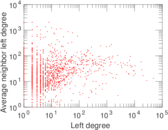
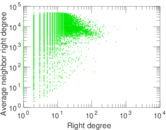
| Degree assortativity | ρ = | −0.291 245
|
| Degree assortativity p-value | pρ = | 0.000 00
|
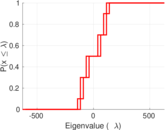
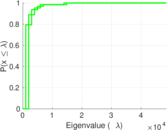
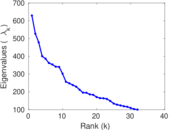
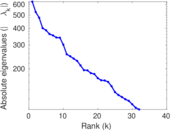
| Spectral norm | α = | 629.430
|
| Algebraic connectivity | a = | 0.007 796 32
|
| Spectral separation | |λ1[A] / λ2[A]| = | 1.193 72
|
| Controllability | C = | 85,081
|
| Relative controllability | Cr = | 0.946 891
|
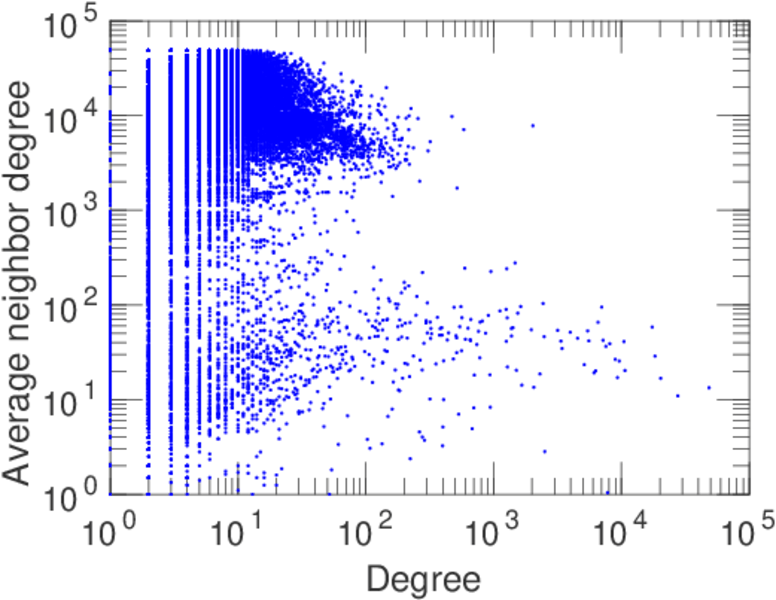
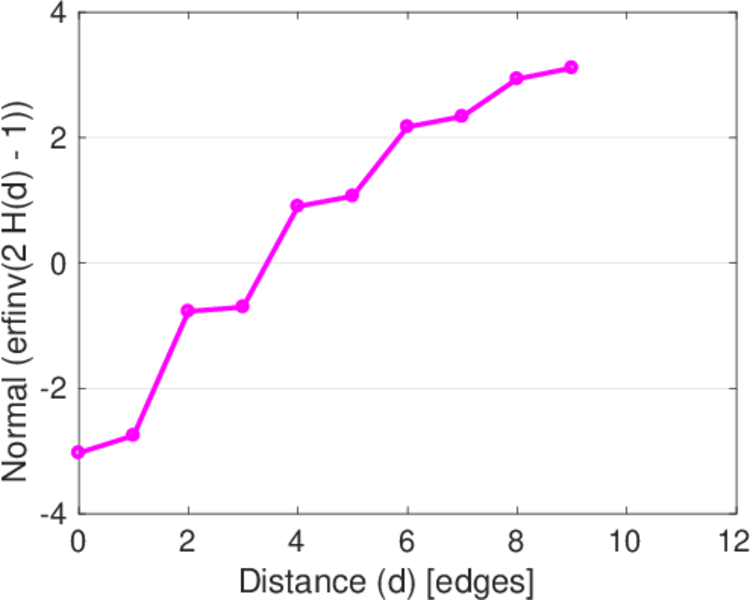
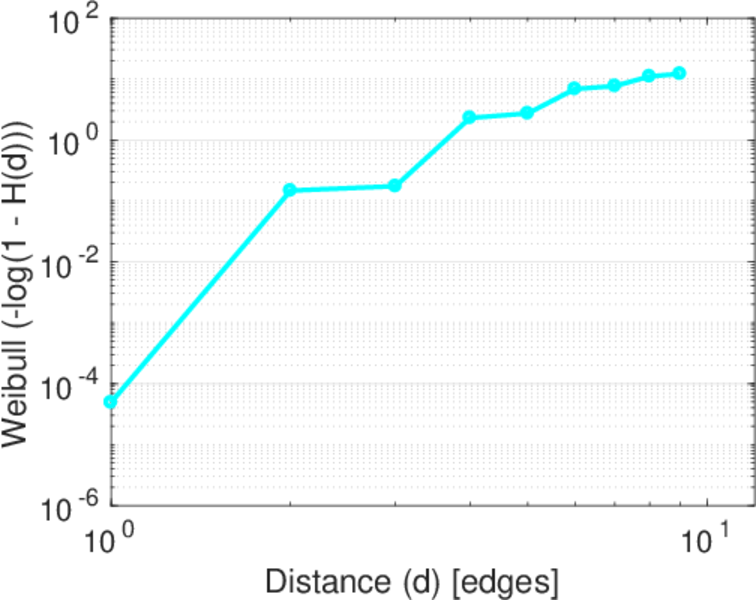
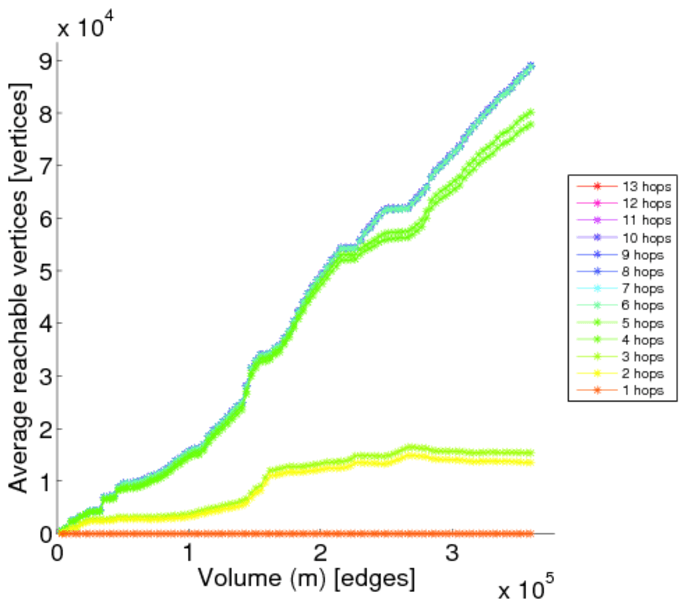
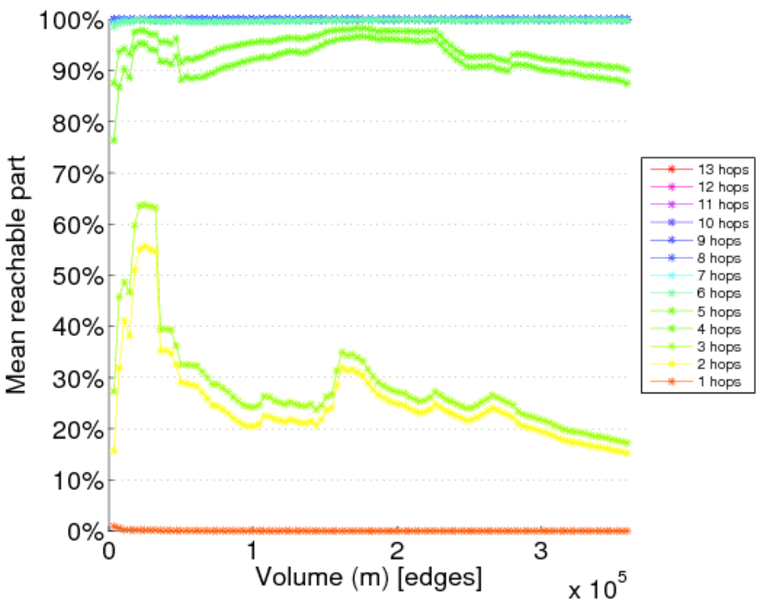
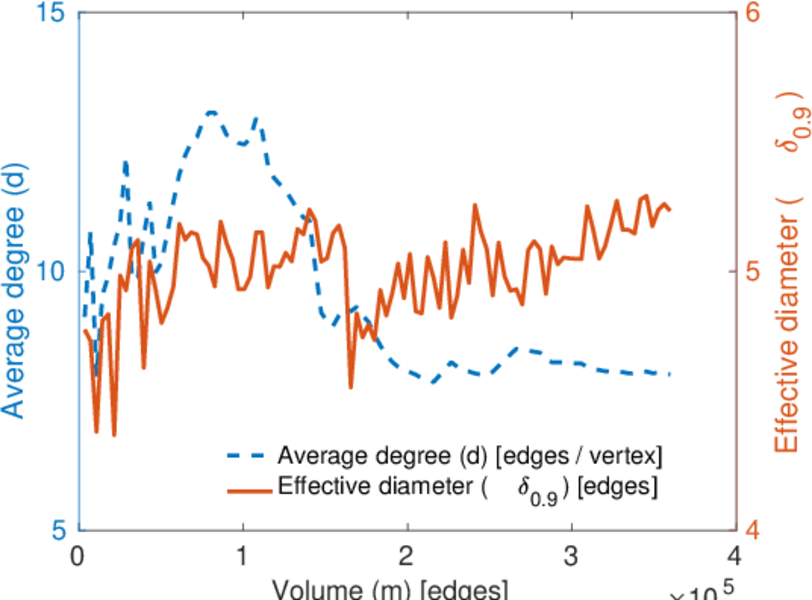
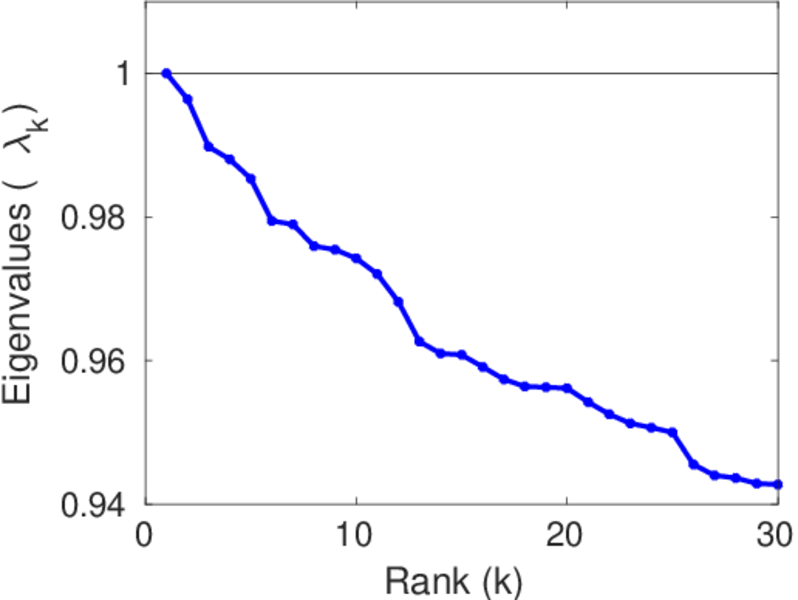
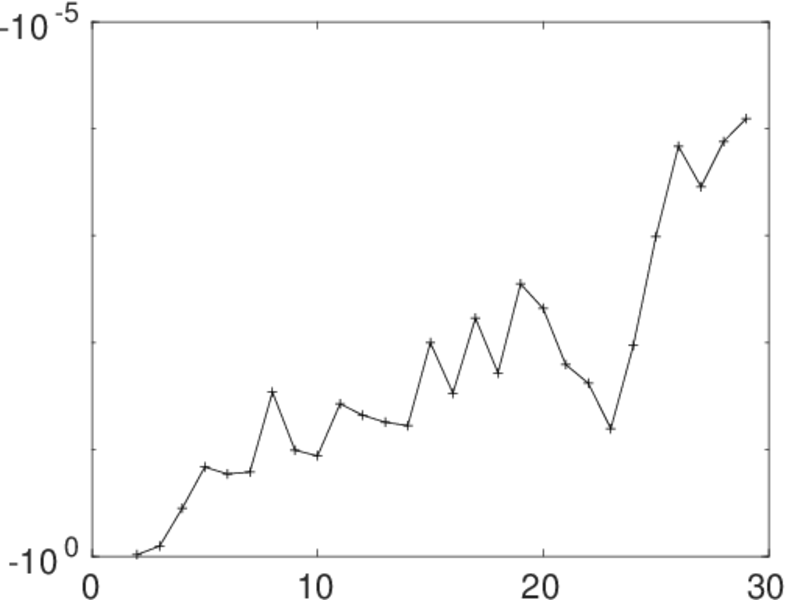
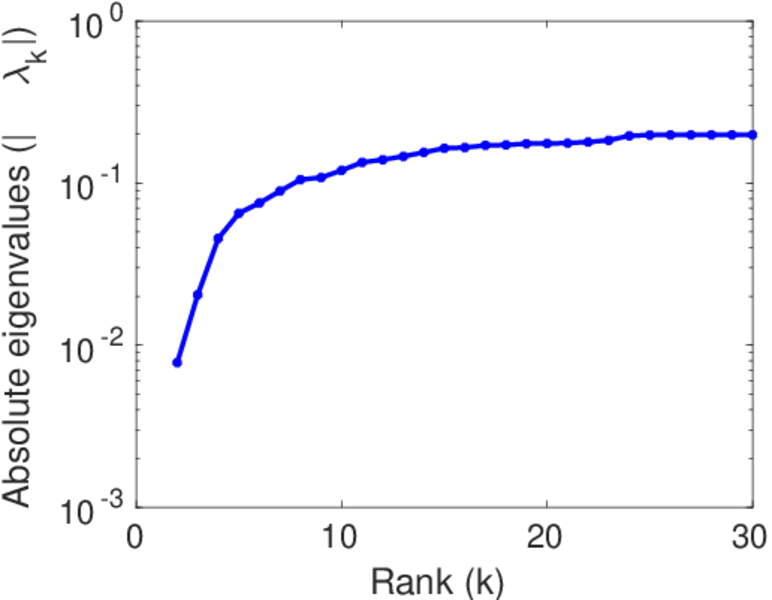
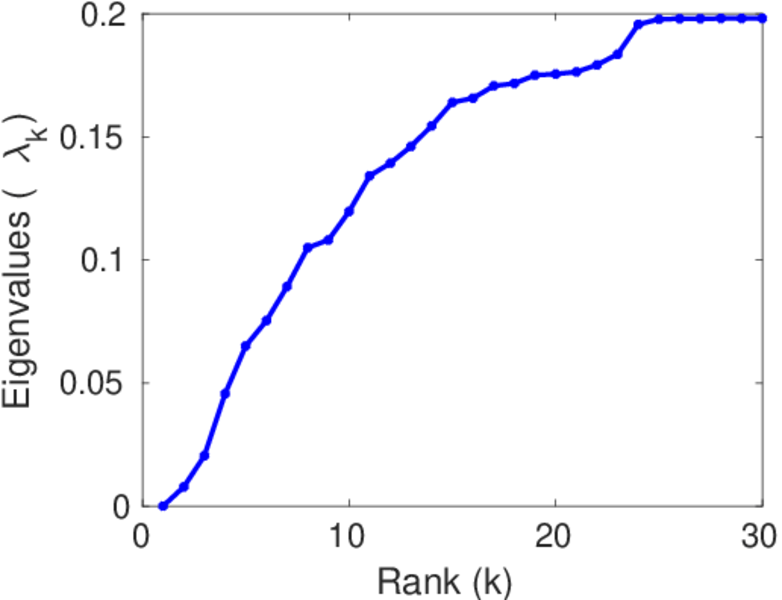
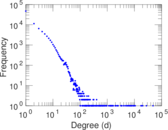
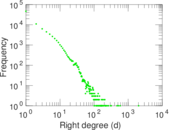
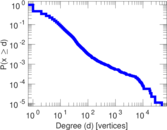
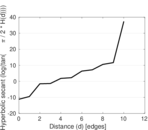
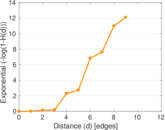
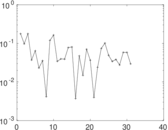
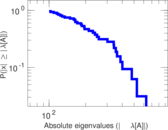
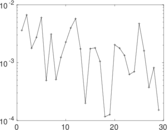
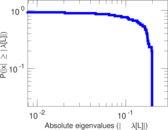
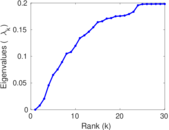
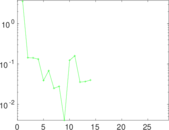
Plots


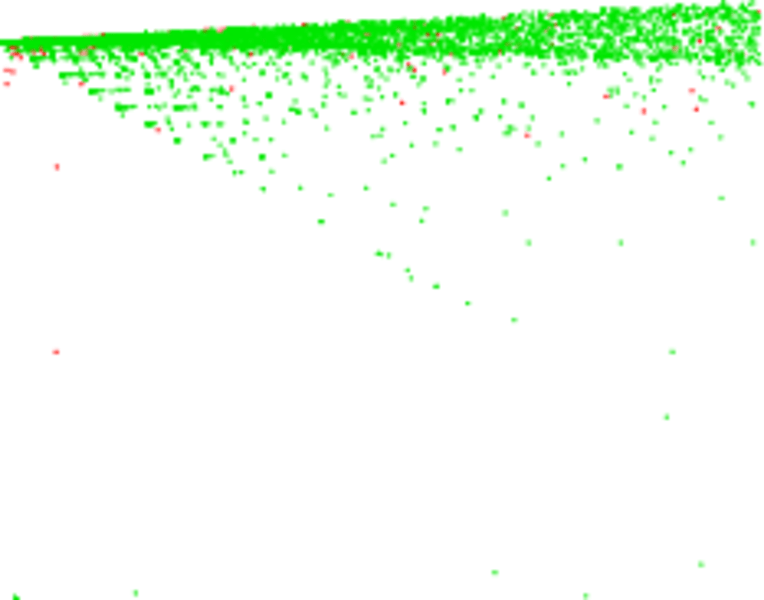
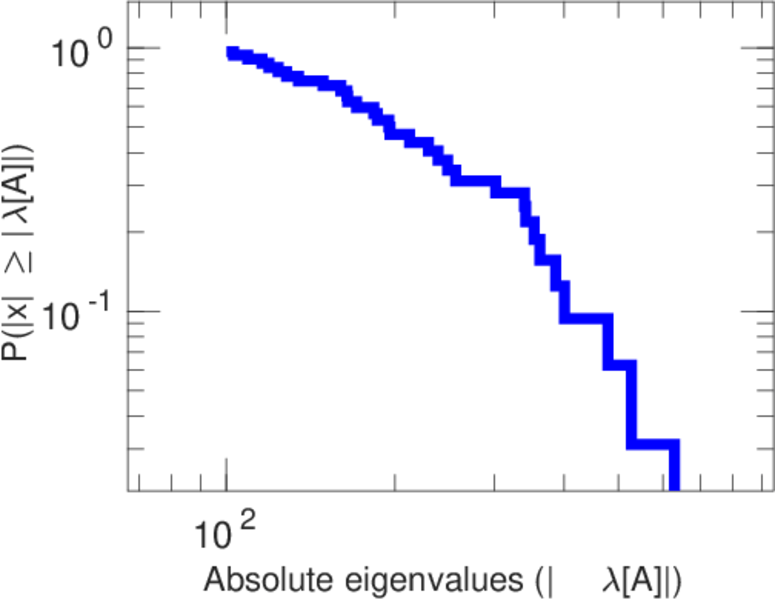
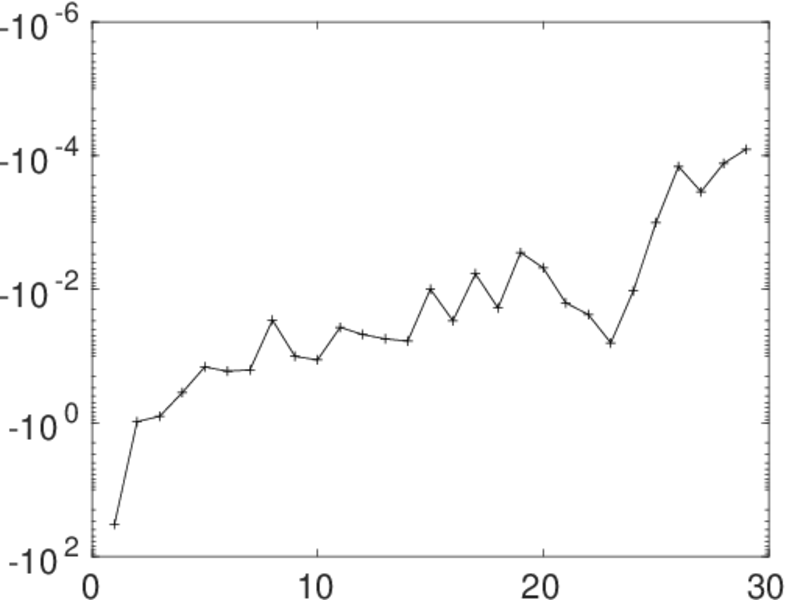
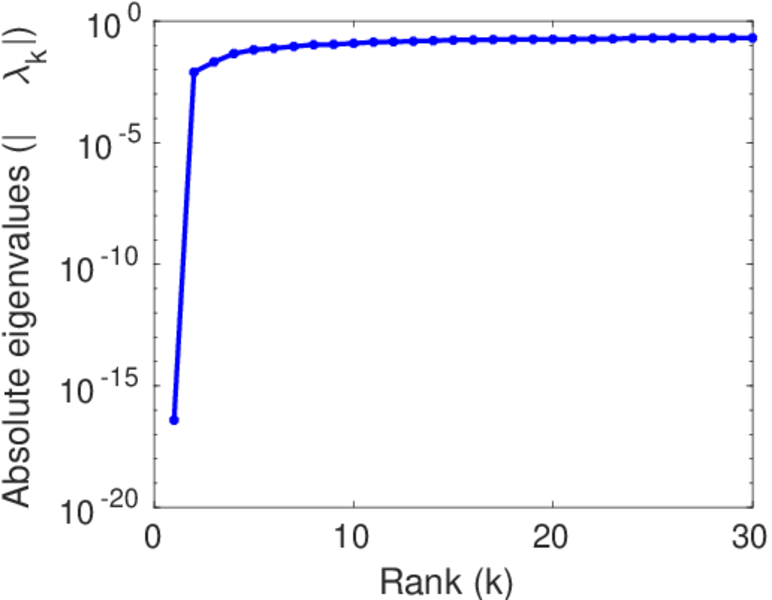
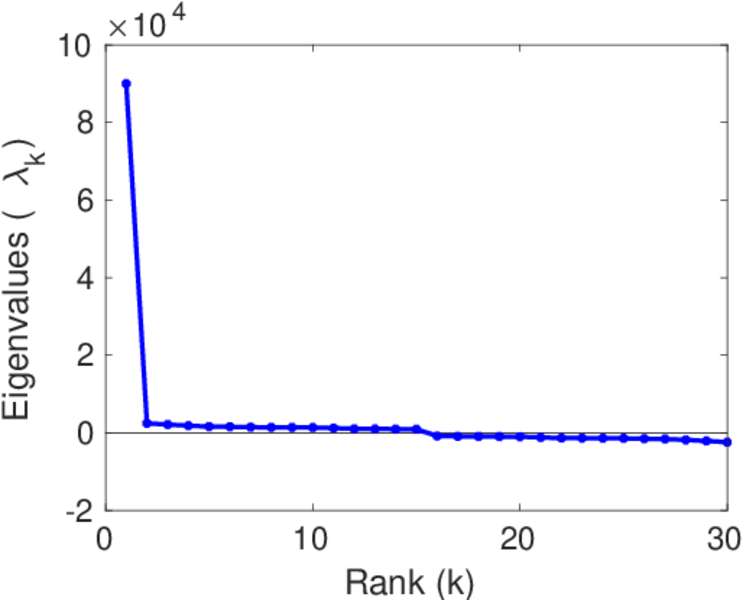
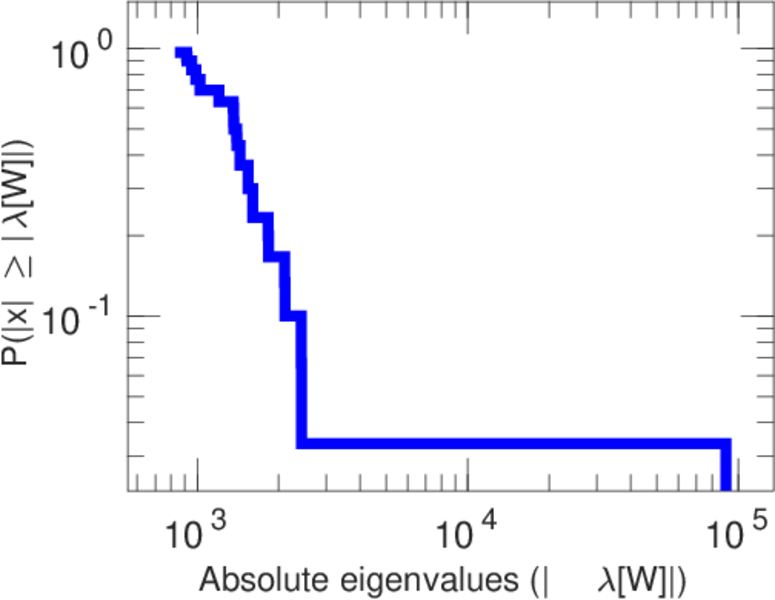
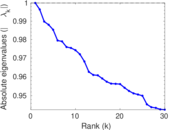
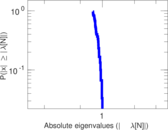
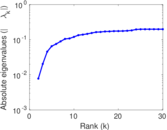
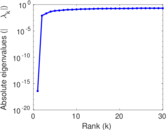
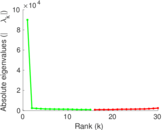
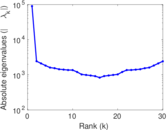
Matrix decompositions plots


Downloads
References
|
[1]
|
Jérôme Kunegis.
KONECT – The Koblenz Network Collection.
In Proc. Int. Conf. on World Wide Web Companion, pages
1343–1350, 2013.
[ http ]
|
|
[2]
|
Wikimedia Foundation.
Wikimedia downloads.
http://dumps.wikimedia.org/, January 2010.
|
 KONECT ‣ Networks ‣
Buy Me a Coffee
KONECT ‣ Networks ‣
Buy Me a Coffee