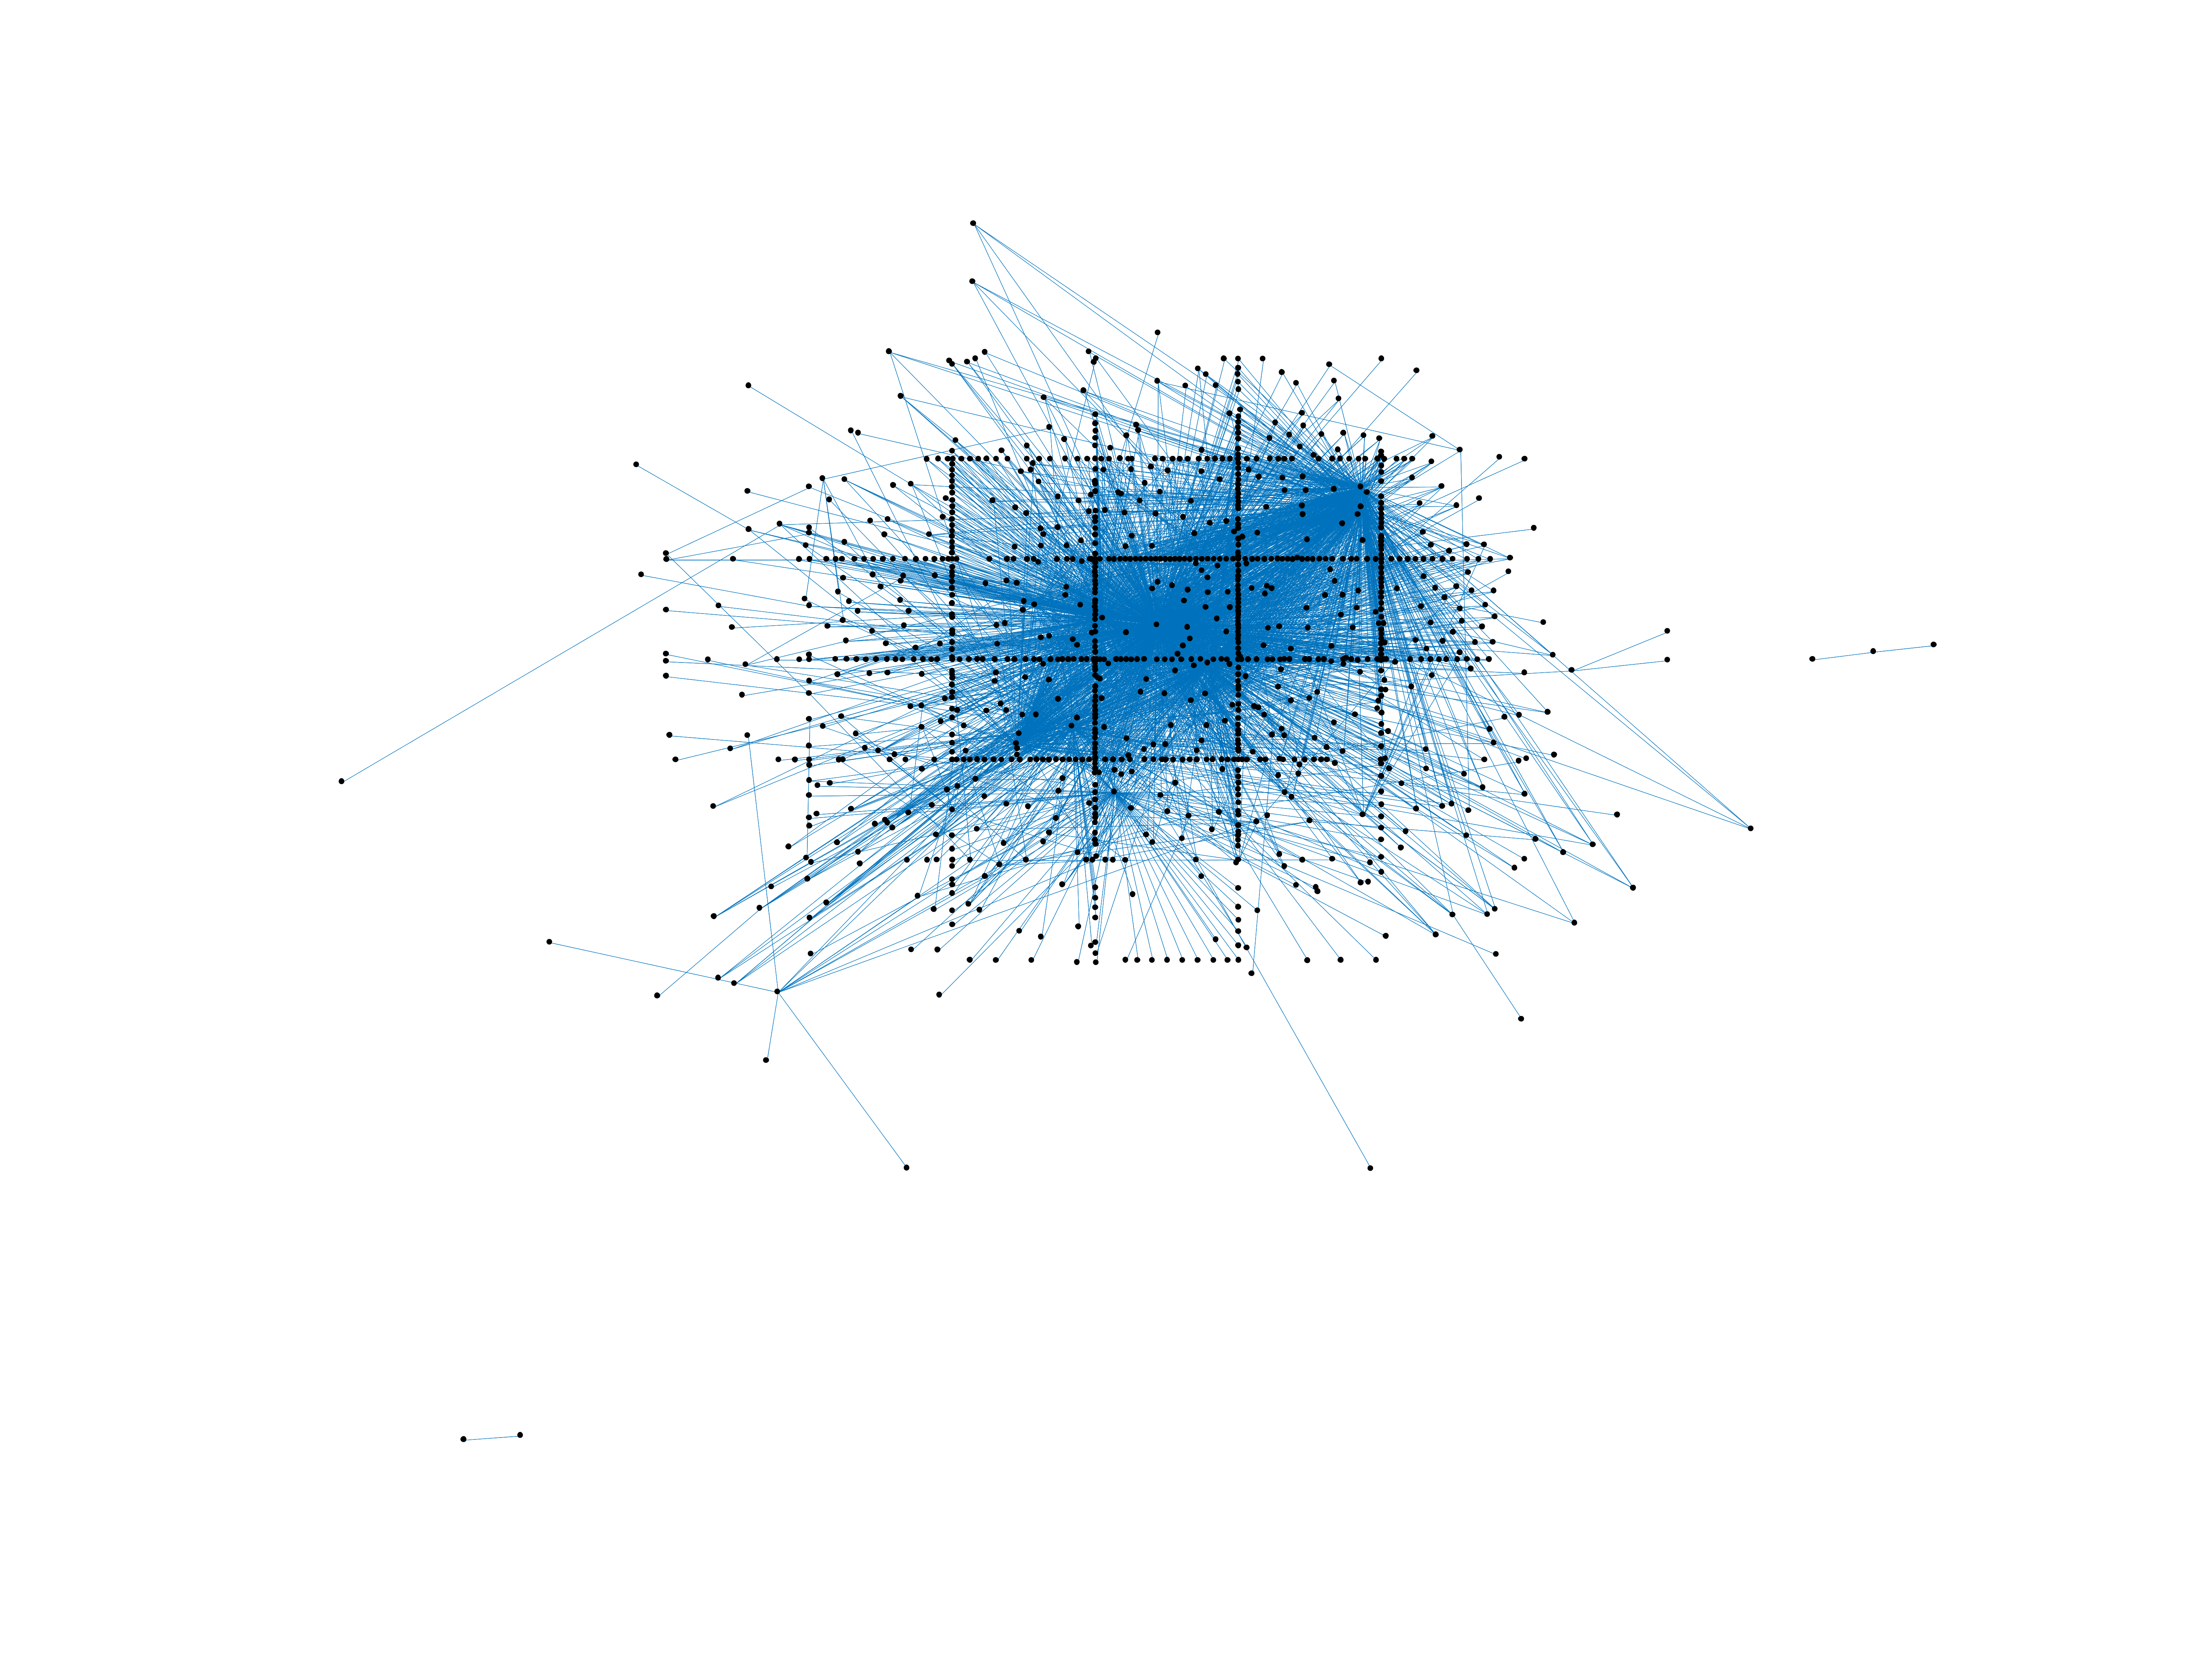
Wikiquote edits (pa)
This is the bipartite edit network of the Punjabi Wikisource. It contains users
and pages from the Punjabi Wikisource, connected by edit events. Each edge
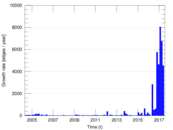
represents an edit. The dataset includes the timestamp of each edit.
Metadata
Statistics
| Size | n = | 1,113
|
| Left size | n1 = | 172
|
| Right size | n2 = | 941
|
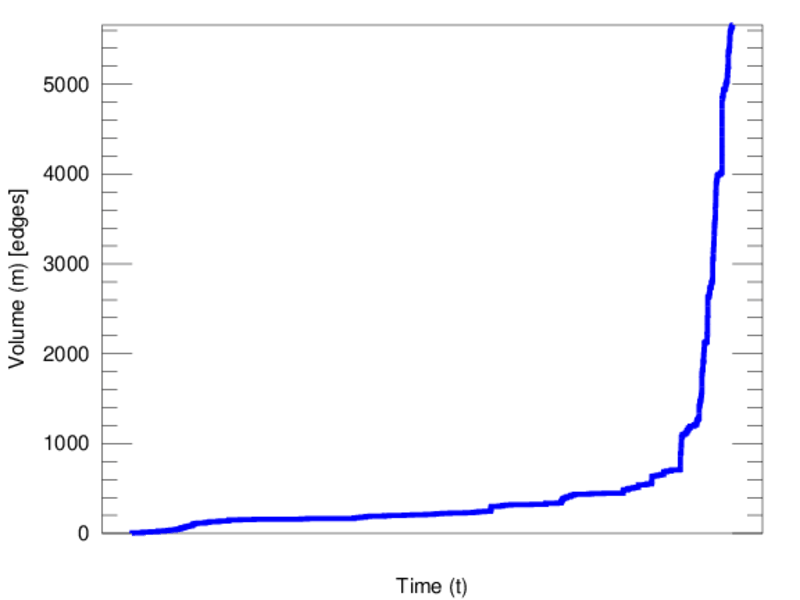
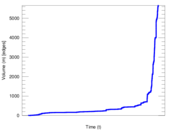
| Volume | m = | 5,660
|
| Unique edge count | m̿ = | 3,144
|
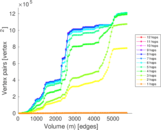
| Wedge count | s = | 634,993
|
| Claw count | z = | 136,046,311
|
| Cross count | x = | 26,063,786,611
|
| Square count | q = | 310,509
|
| 4-Tour count | T4 = | 5,036,244
|
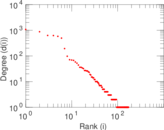
| Maximum degree | dmax = | 1,076
|
| Maximum left degree | d1max = | 1,076
|
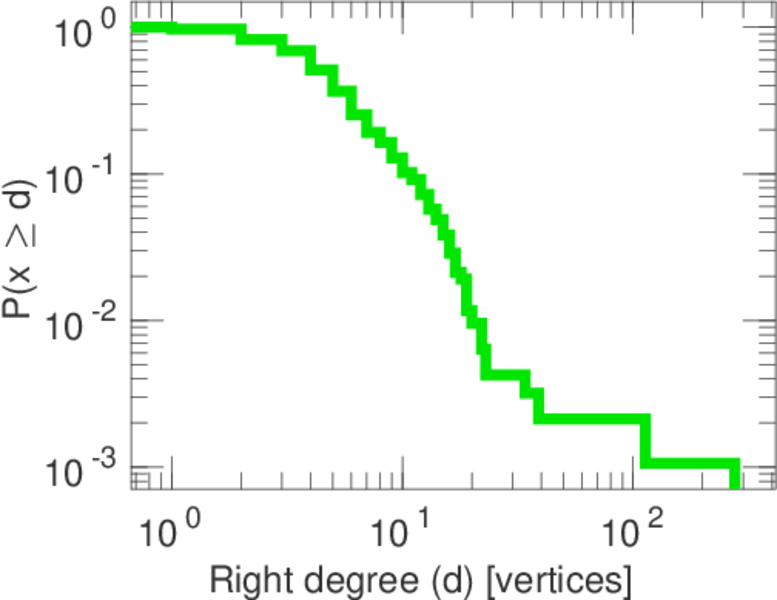
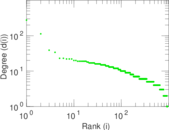
| Maximum right degree | d2max = | 276
|
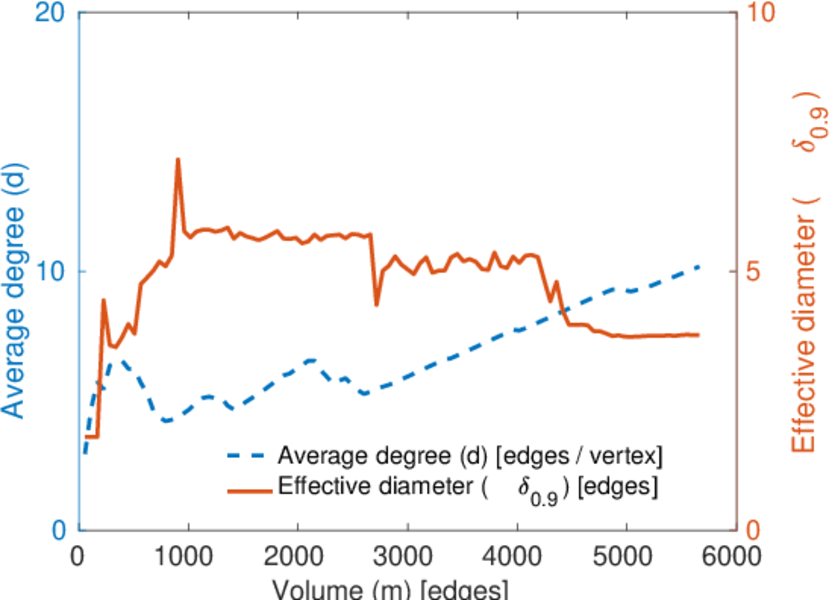
| Average degree | d = | 10.170 7
|
| Average left degree | d1 = | 32.907 0
|
| Average right degree | d2 = | 6.014 88
|
| Fill | p = | 0.019 425 2
|
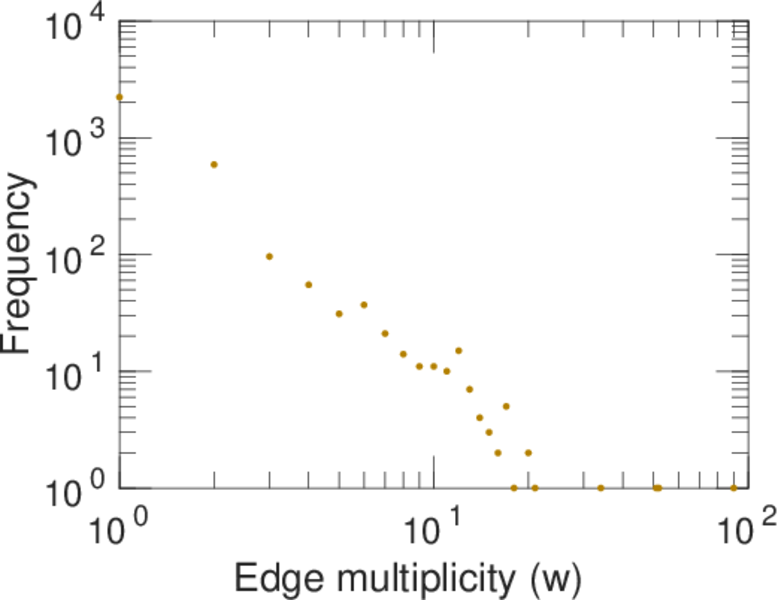
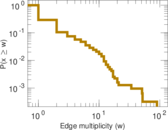
| Average edge multiplicity | m̃ = | 1.800 25
|
| Size of LCC | N = | 1,100
|
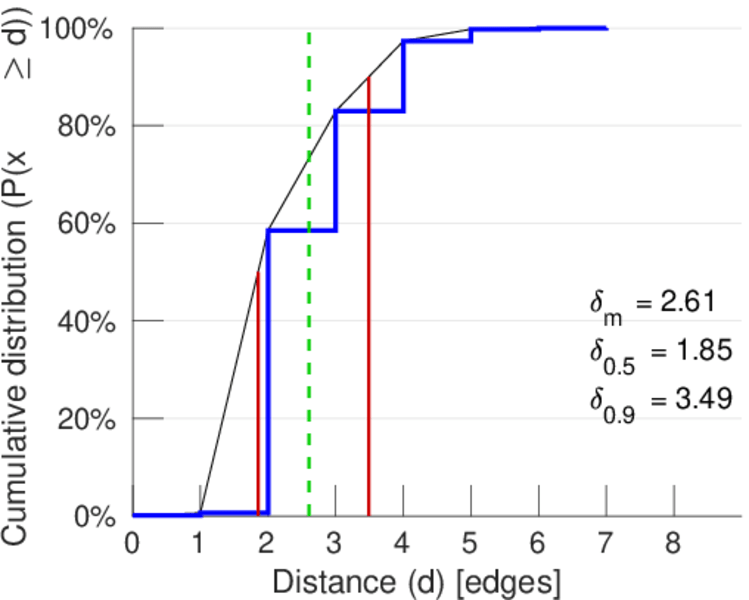
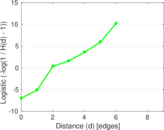
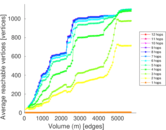
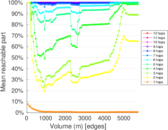
| Diameter | δ = | 7
|
| 50-Percentile effective diameter | δ0.5 = | 1.853 01
|
| 90-Percentile effective diameter | δ0.9 = | 3.490 71
|
| Median distance | δM = | 2
|
| Mean distance | δm = | 2.607 87
|
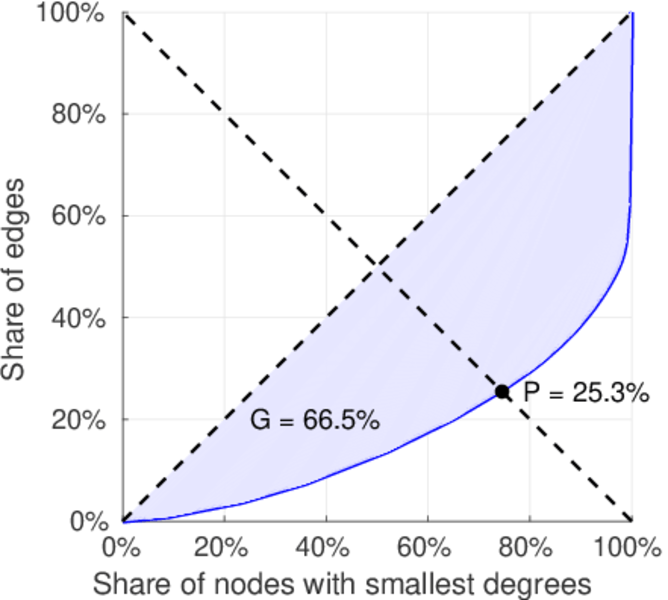
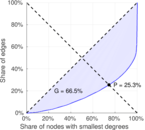
| Gini coefficient | G = | 0.659 823
|
| Balanced inequality ratio | P = | 0.251 767
|
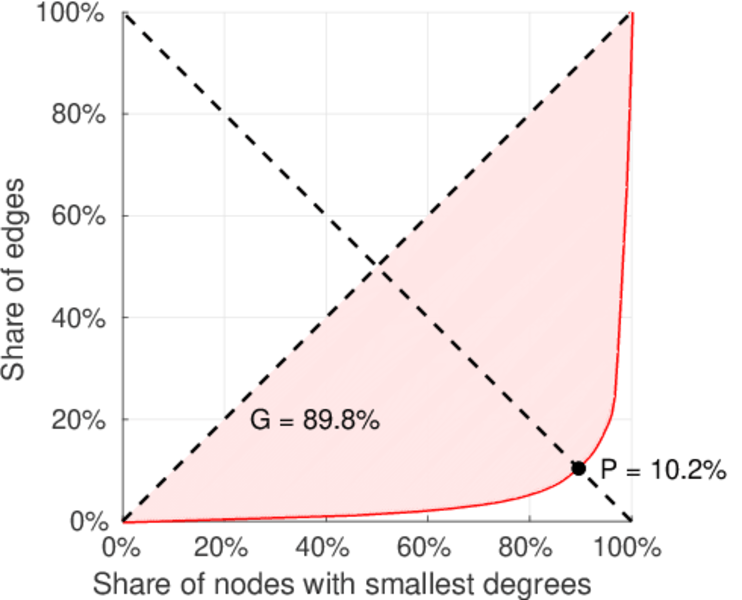
| Left balanced inequality ratio | P1 = | 0.102 120
|
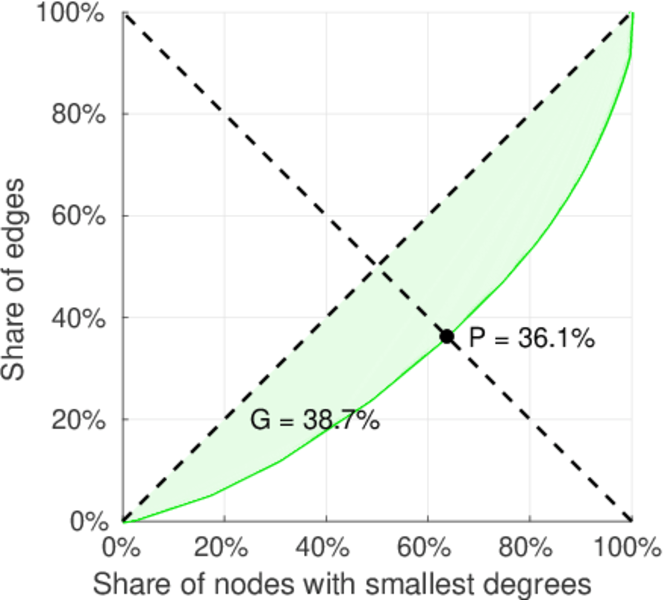
| Right balanced inequality ratio | P2 = | 0.361 484
|
| Relative edge distribution entropy | Her = | 0.773 208
|
| Power law exponent | γ = | 1.963 03
|
| Tail power law exponent | γt = | 1.721 00
|
| Tail power law exponent with p | γ3 = | 1.721 00
|
| p-value | p = | 0.778 000
|
| Left tail power law exponent with p | γ3,1 = | 1.551 00
|
| Left p-value | p1 = | 0.736 000
|
| Right tail power law exponent with p | γ3,2 = | 7.881 00
|
| Right p-value | p2 = | 0.000 00
|
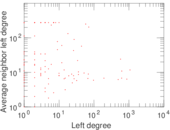
| Degree assortativity | ρ = | −0.219 835
|
| Degree assortativity p-value | pρ = | 1.028 76 × 10−35
|
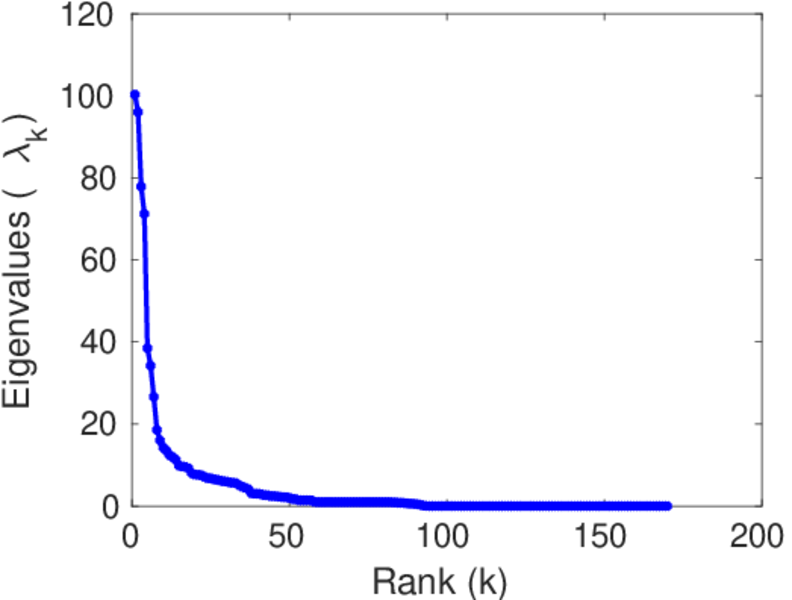
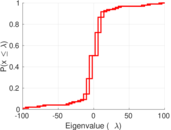
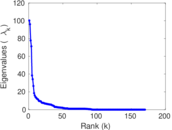
| Spectral norm | α = | 100.279
|
| Algebraic connectivity | a = | 0.236 030
|
| Spectral separation | |λ1[A] / λ2[A]| = | 1.044 26
|
| Controllability | C = | 926
|
| Relative controllability | Cr = | 0.832 734
|
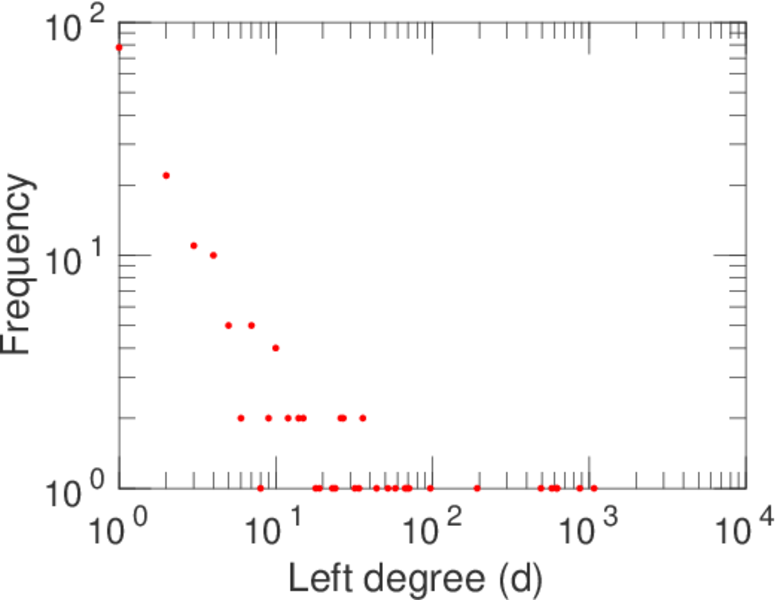
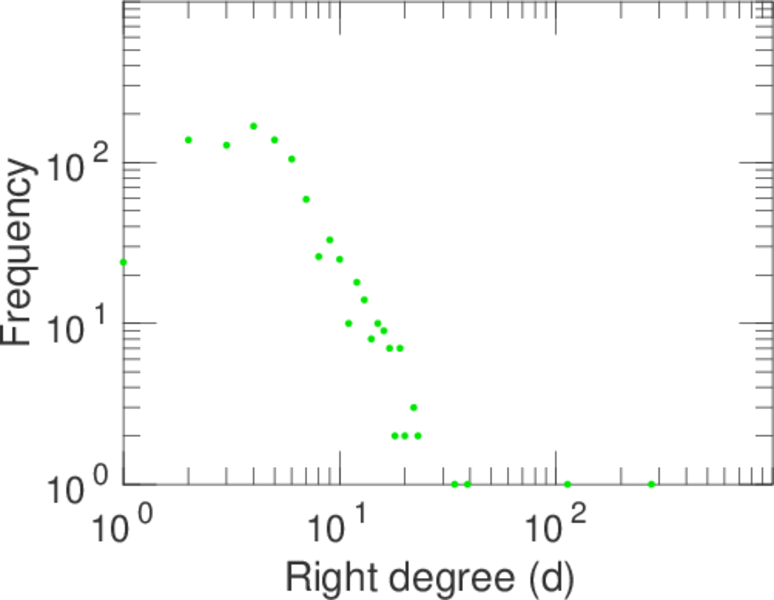
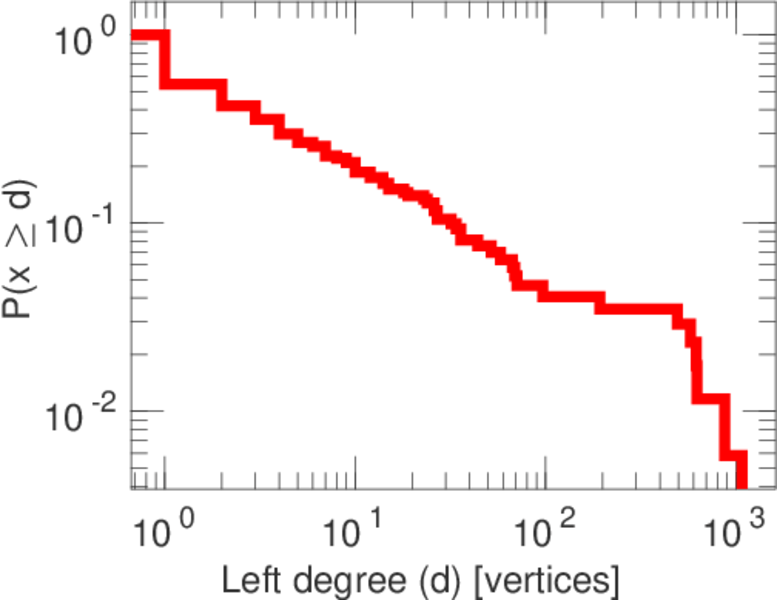
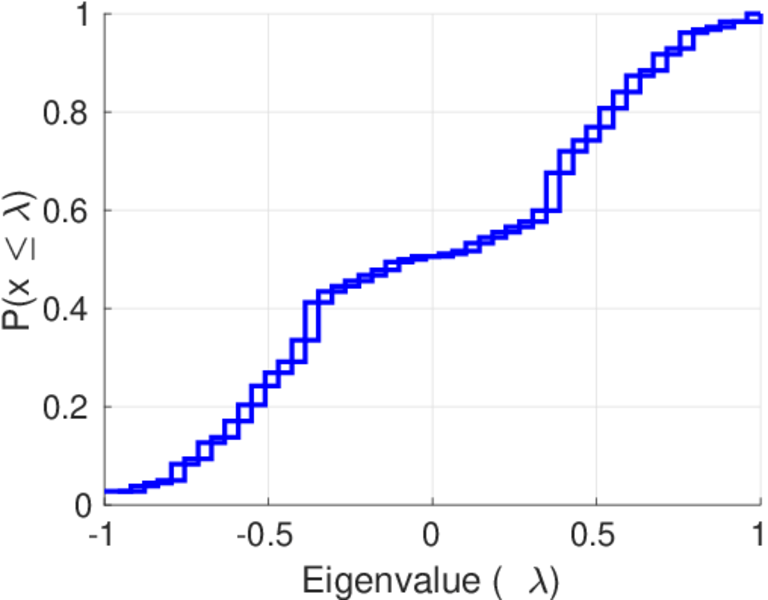
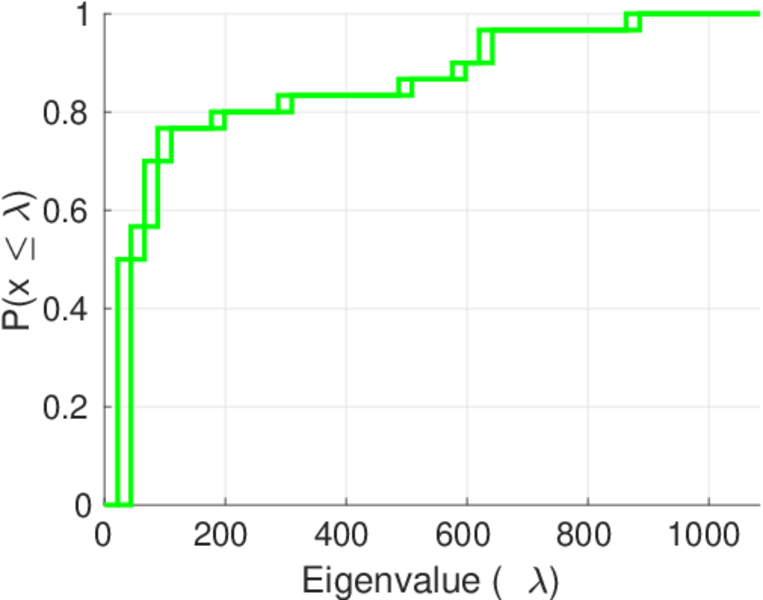
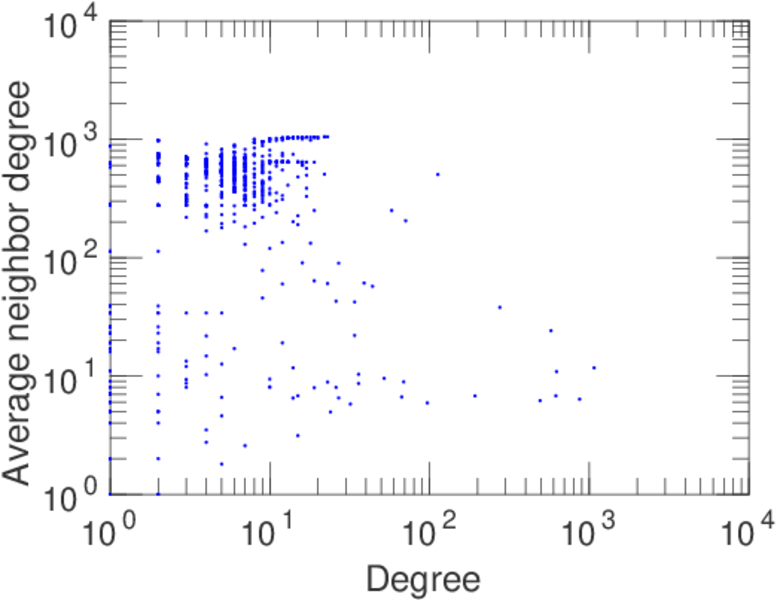
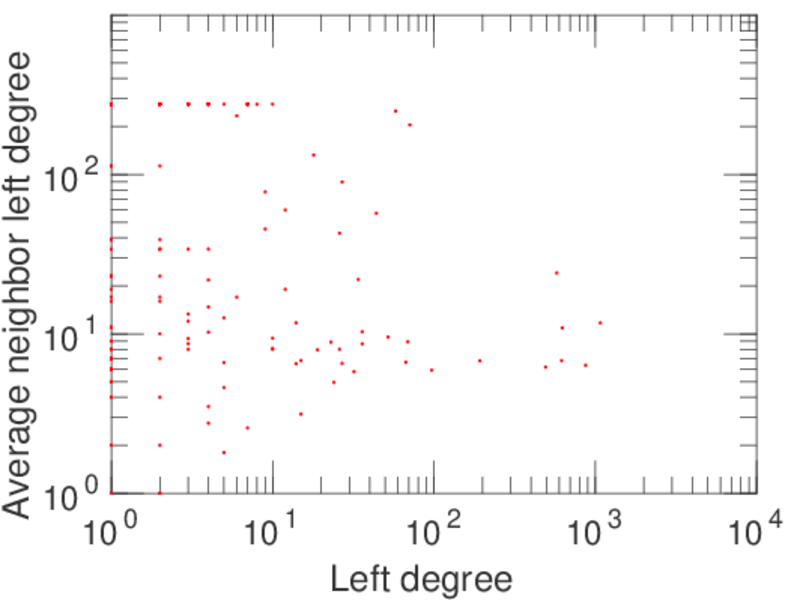
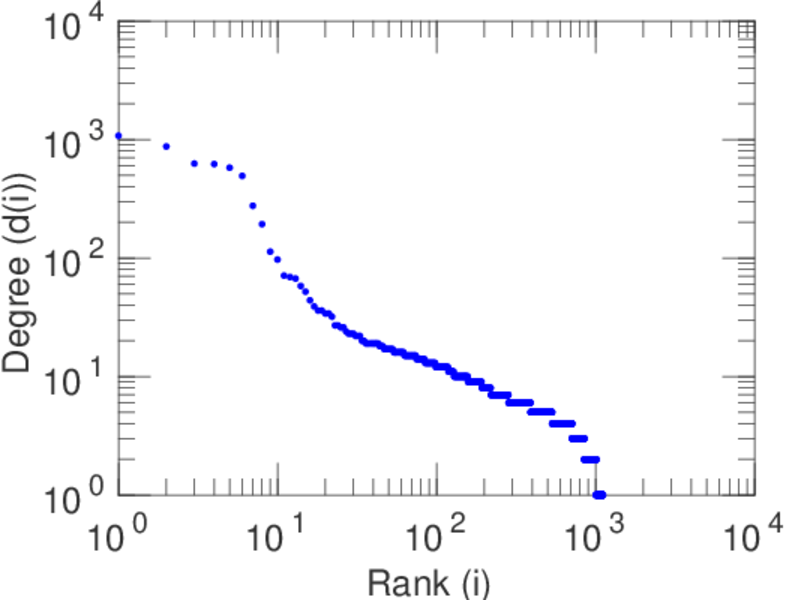
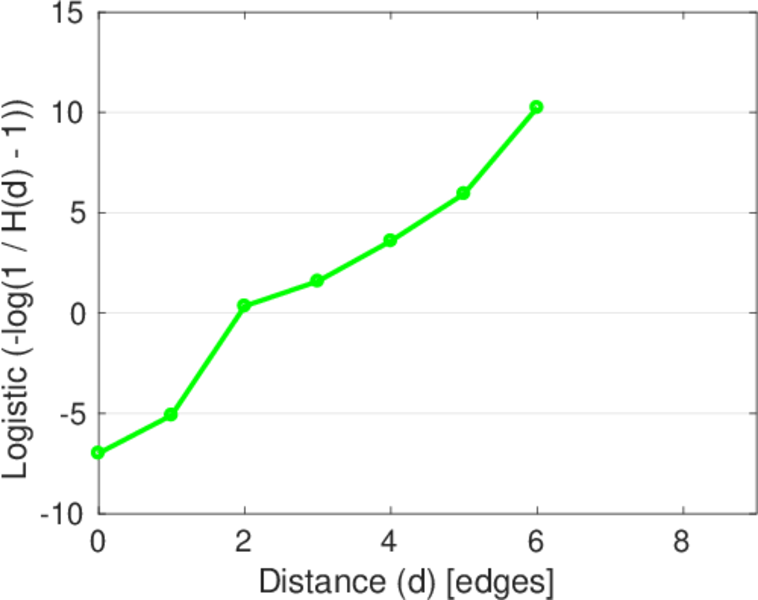
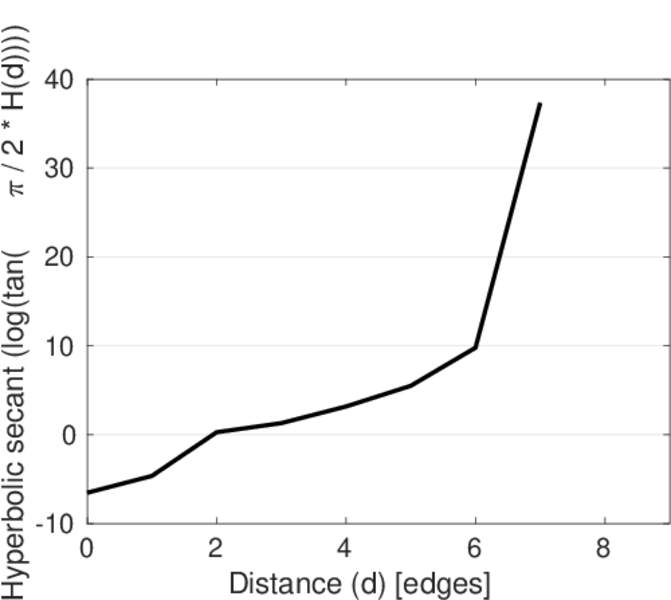
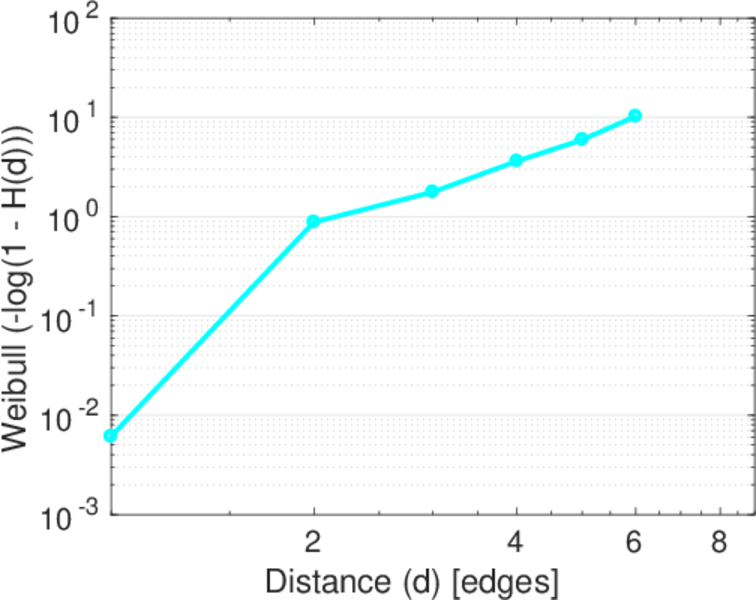
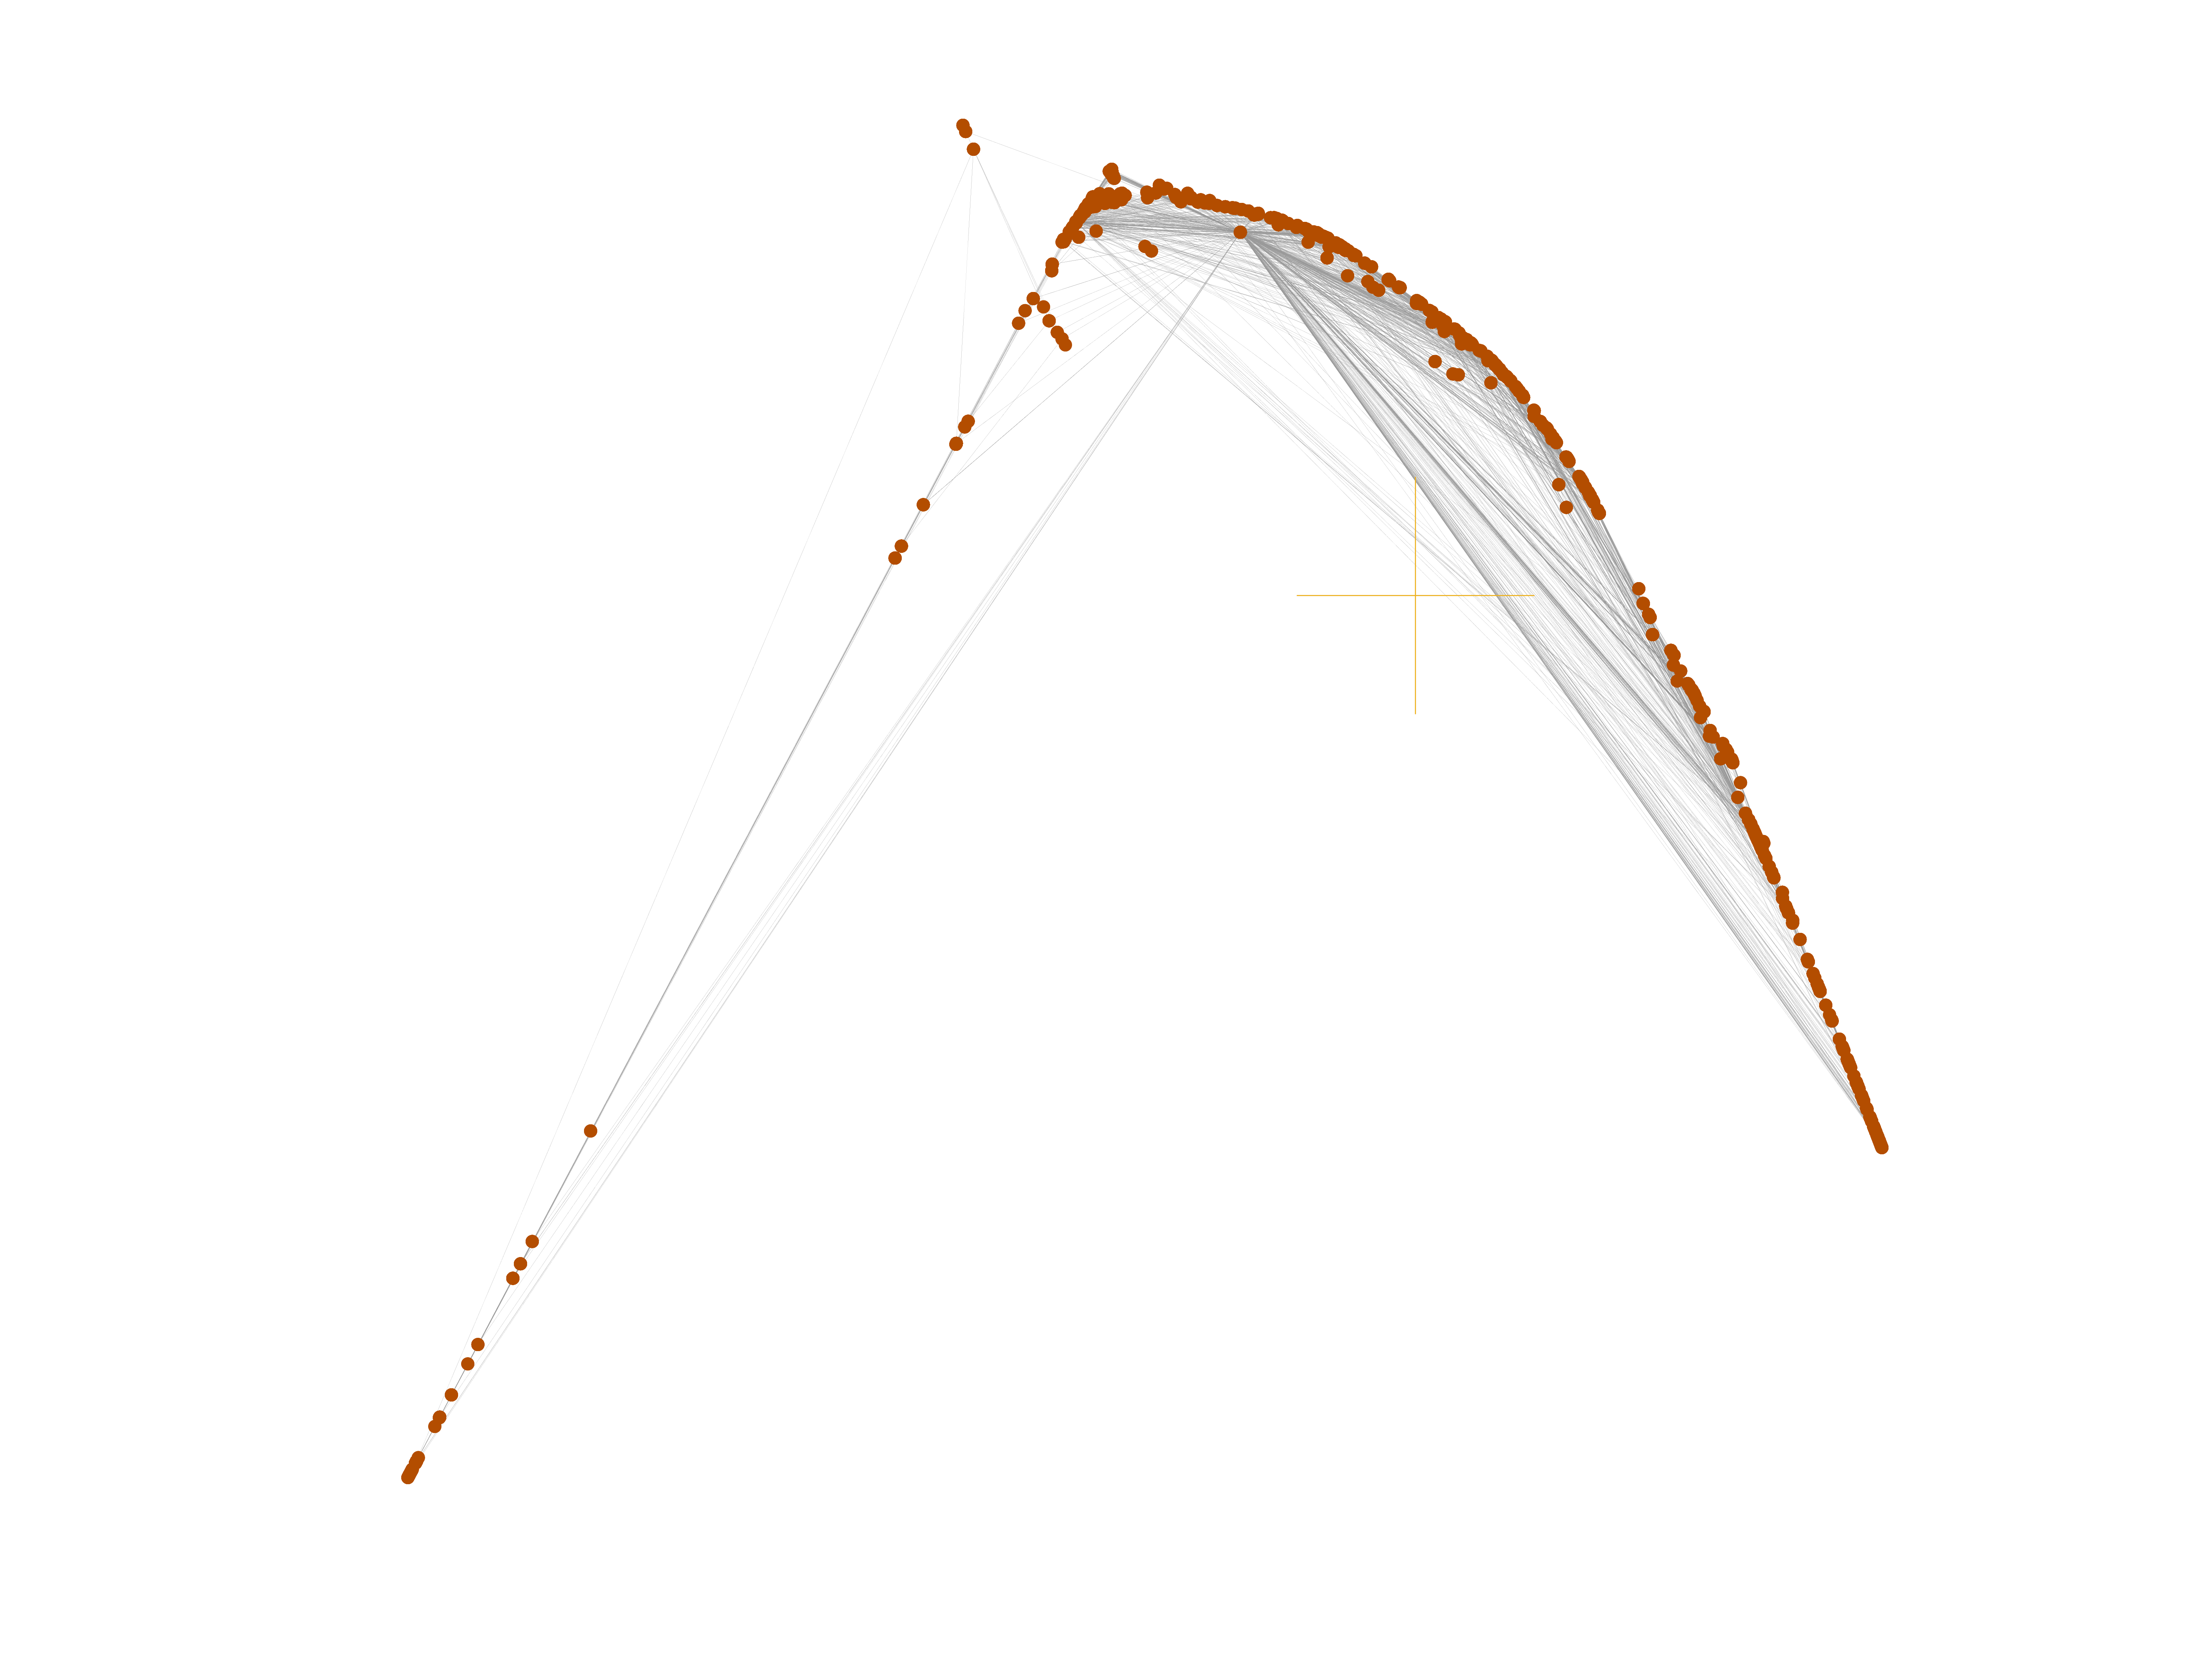
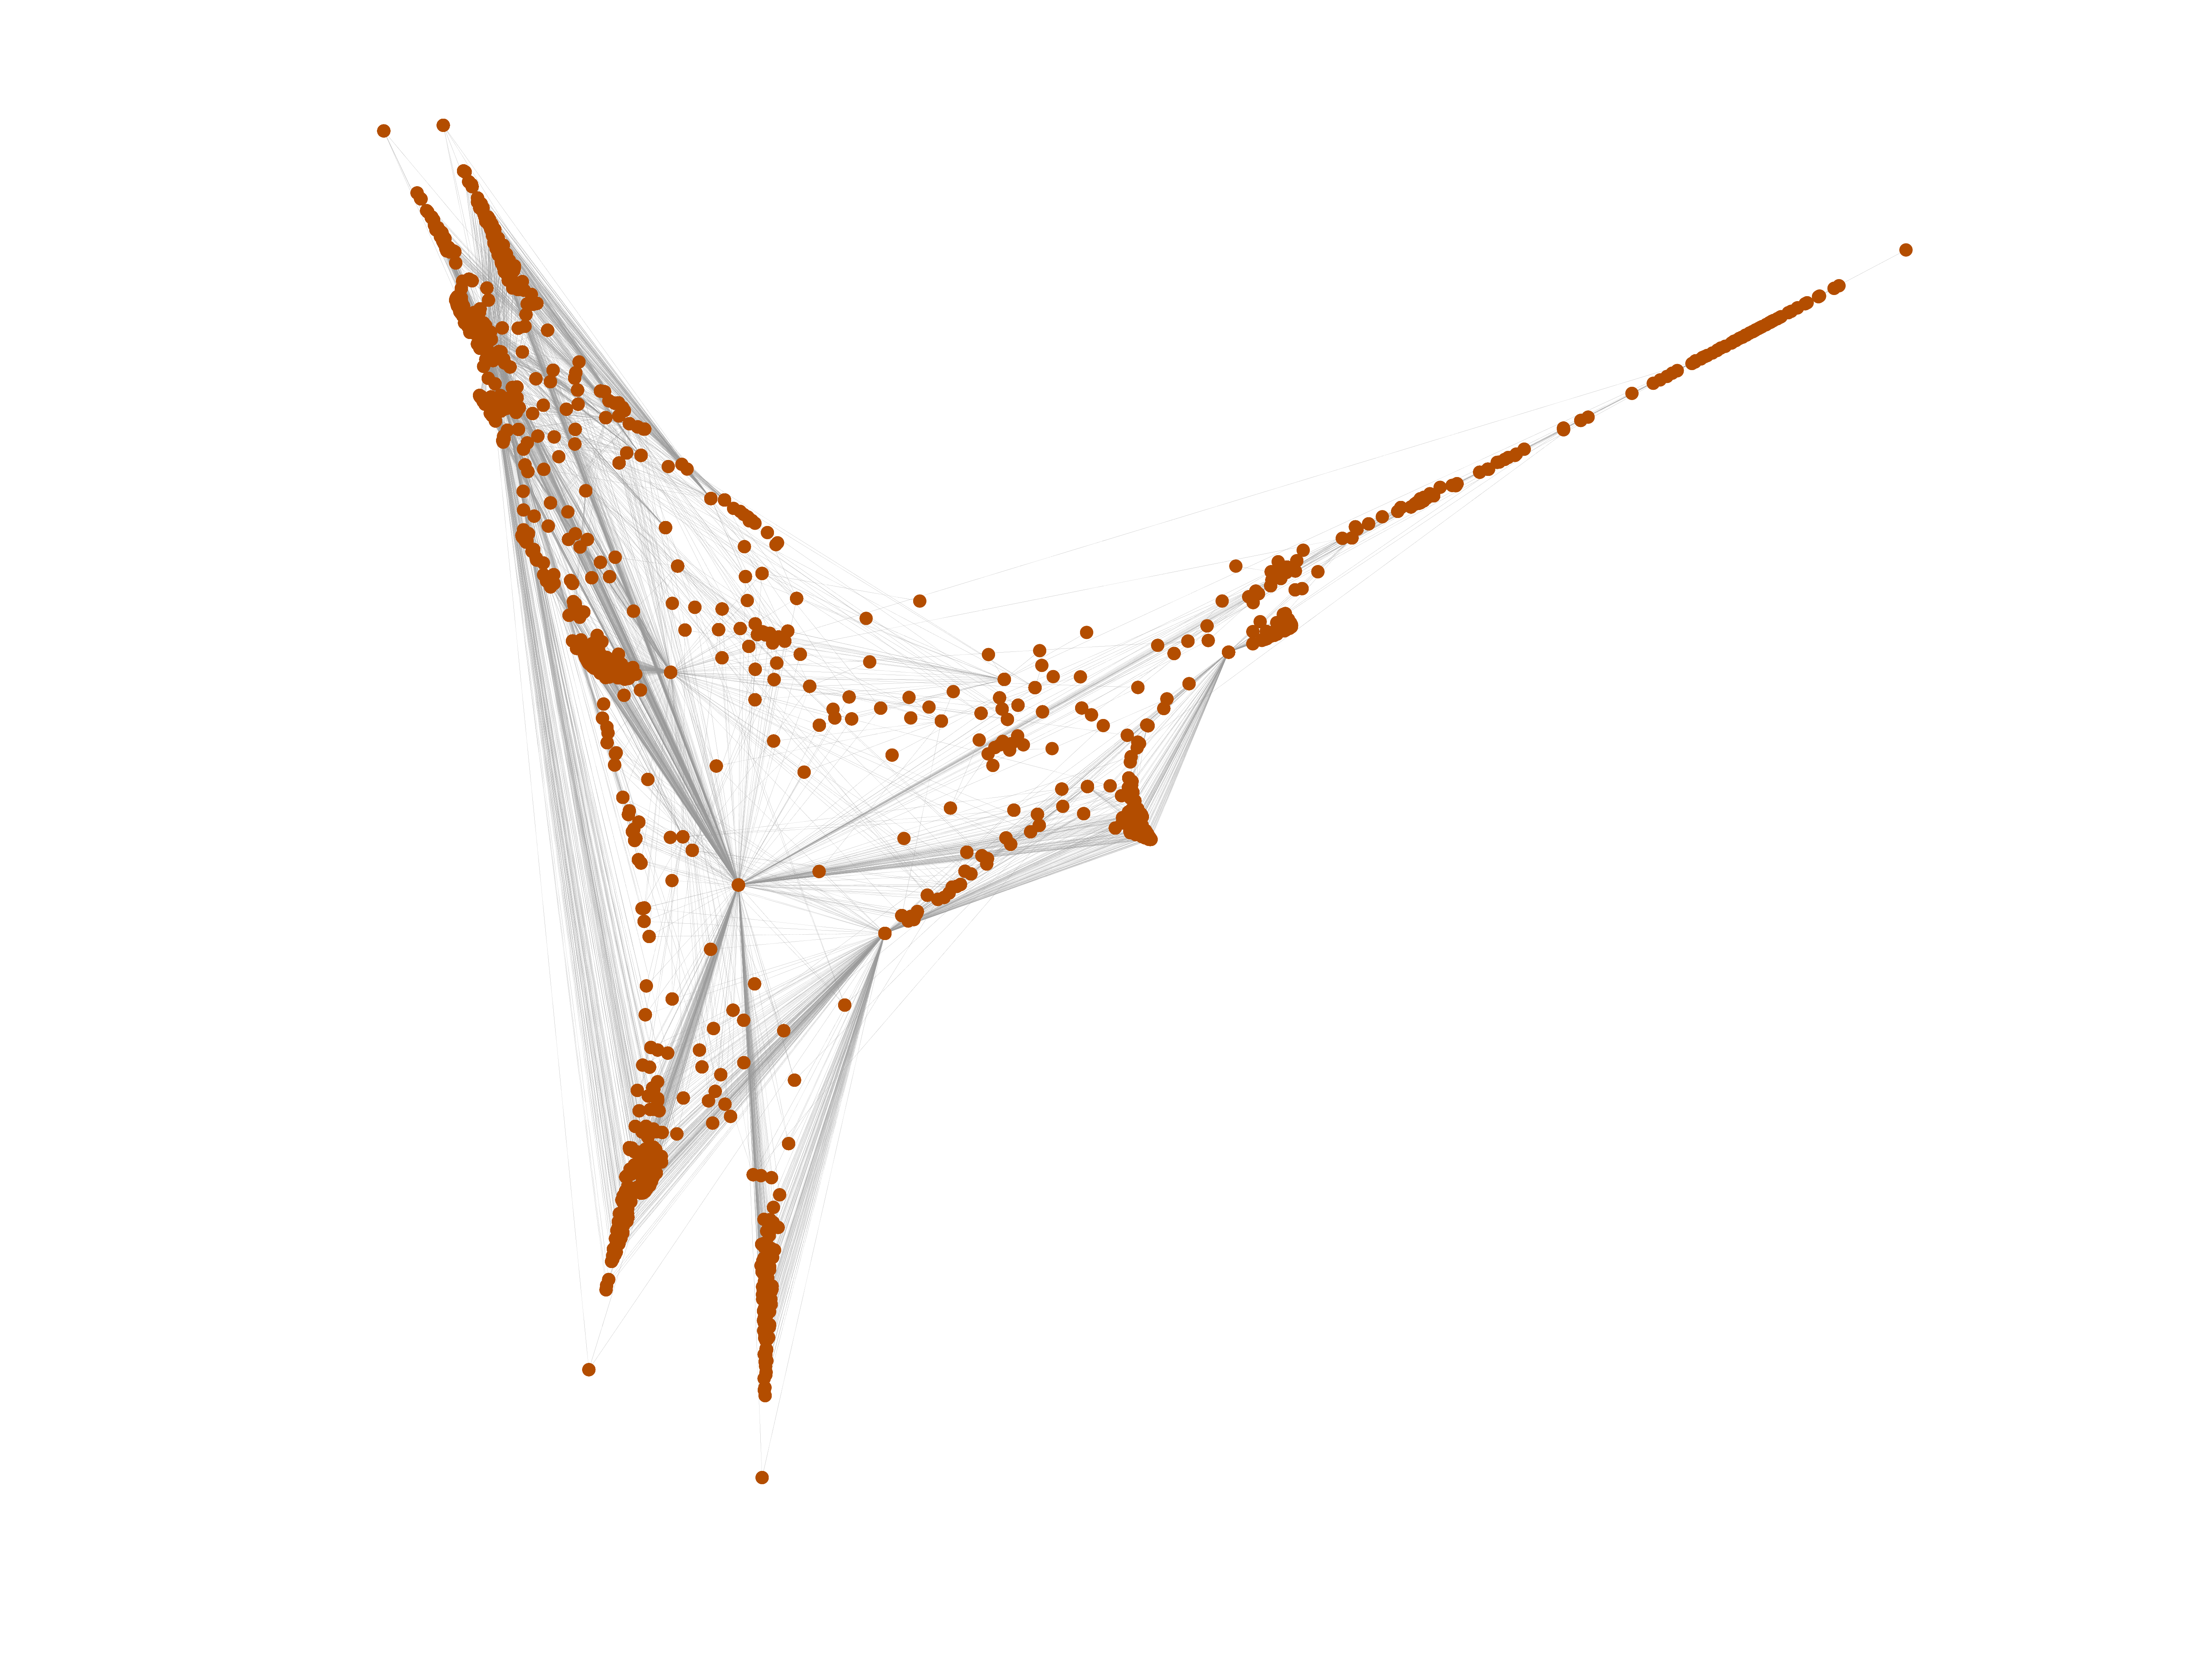
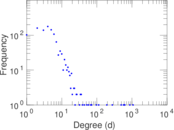
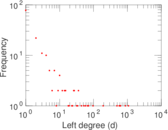
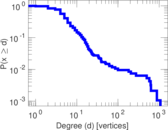
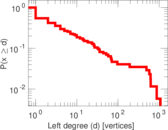
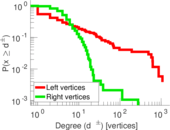
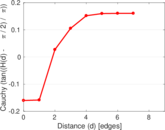
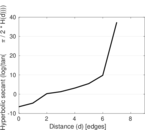
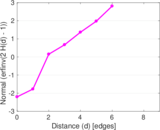
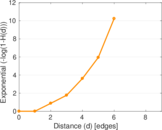
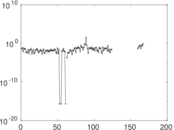
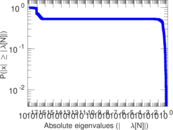
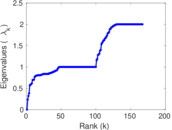
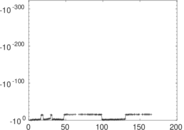
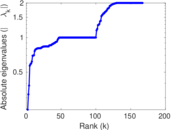
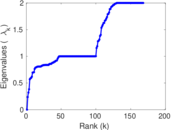
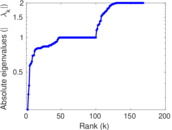
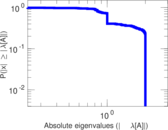
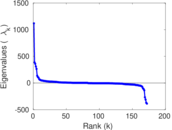
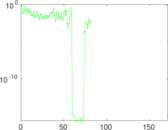
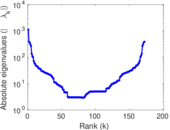
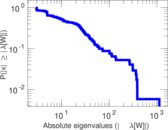
Plots


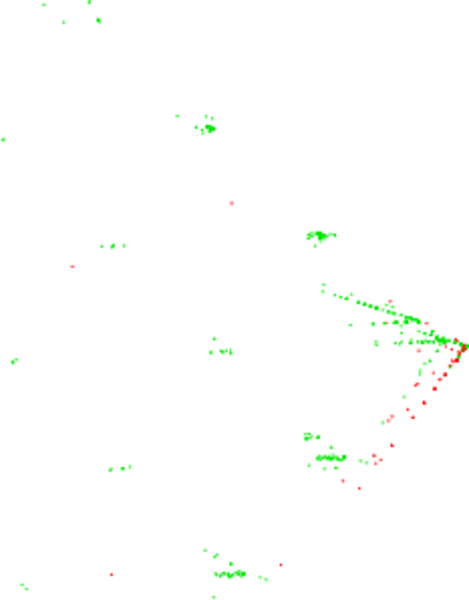
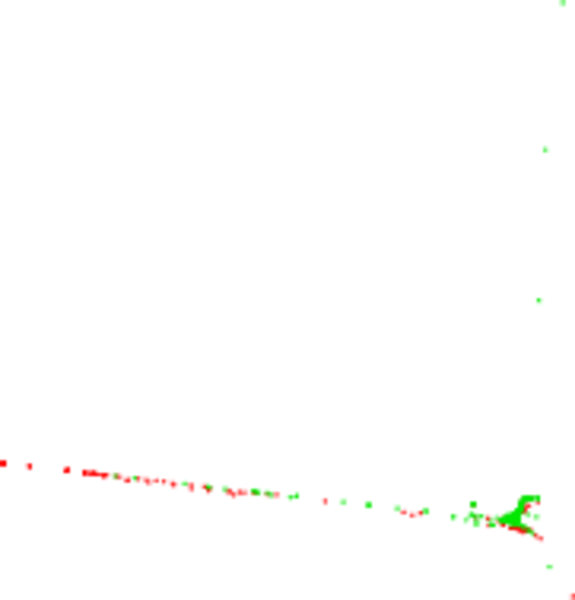
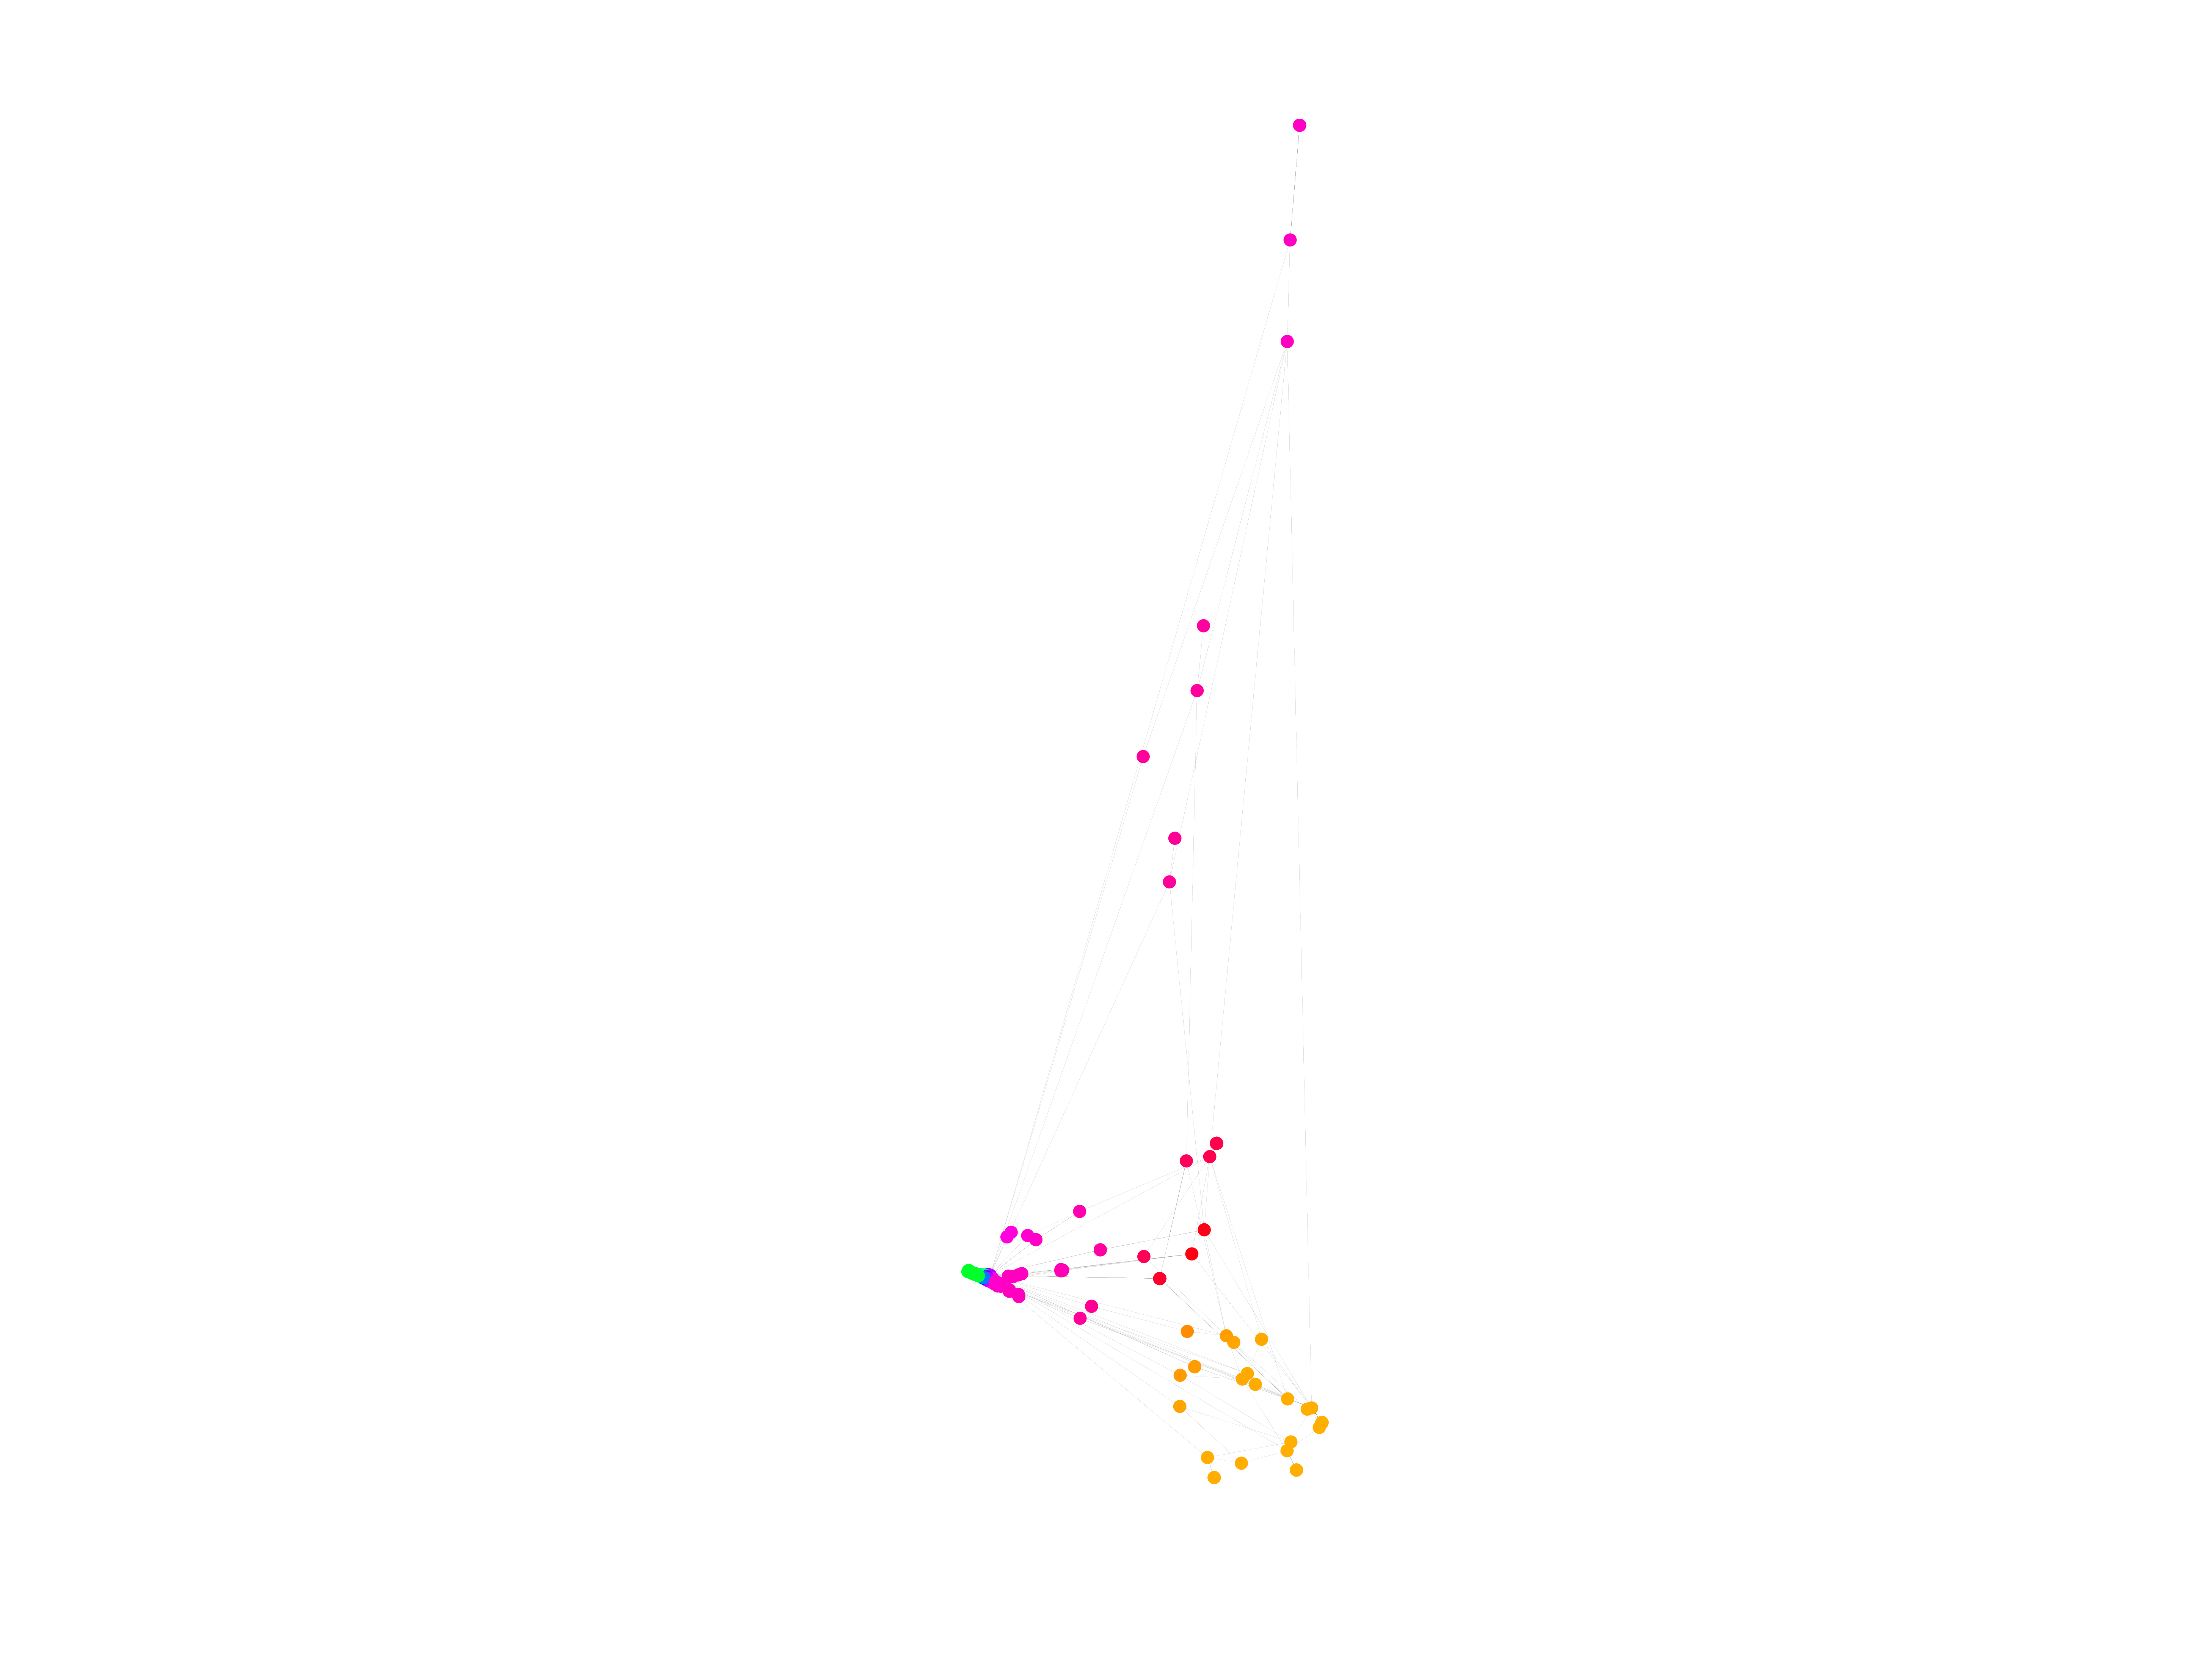
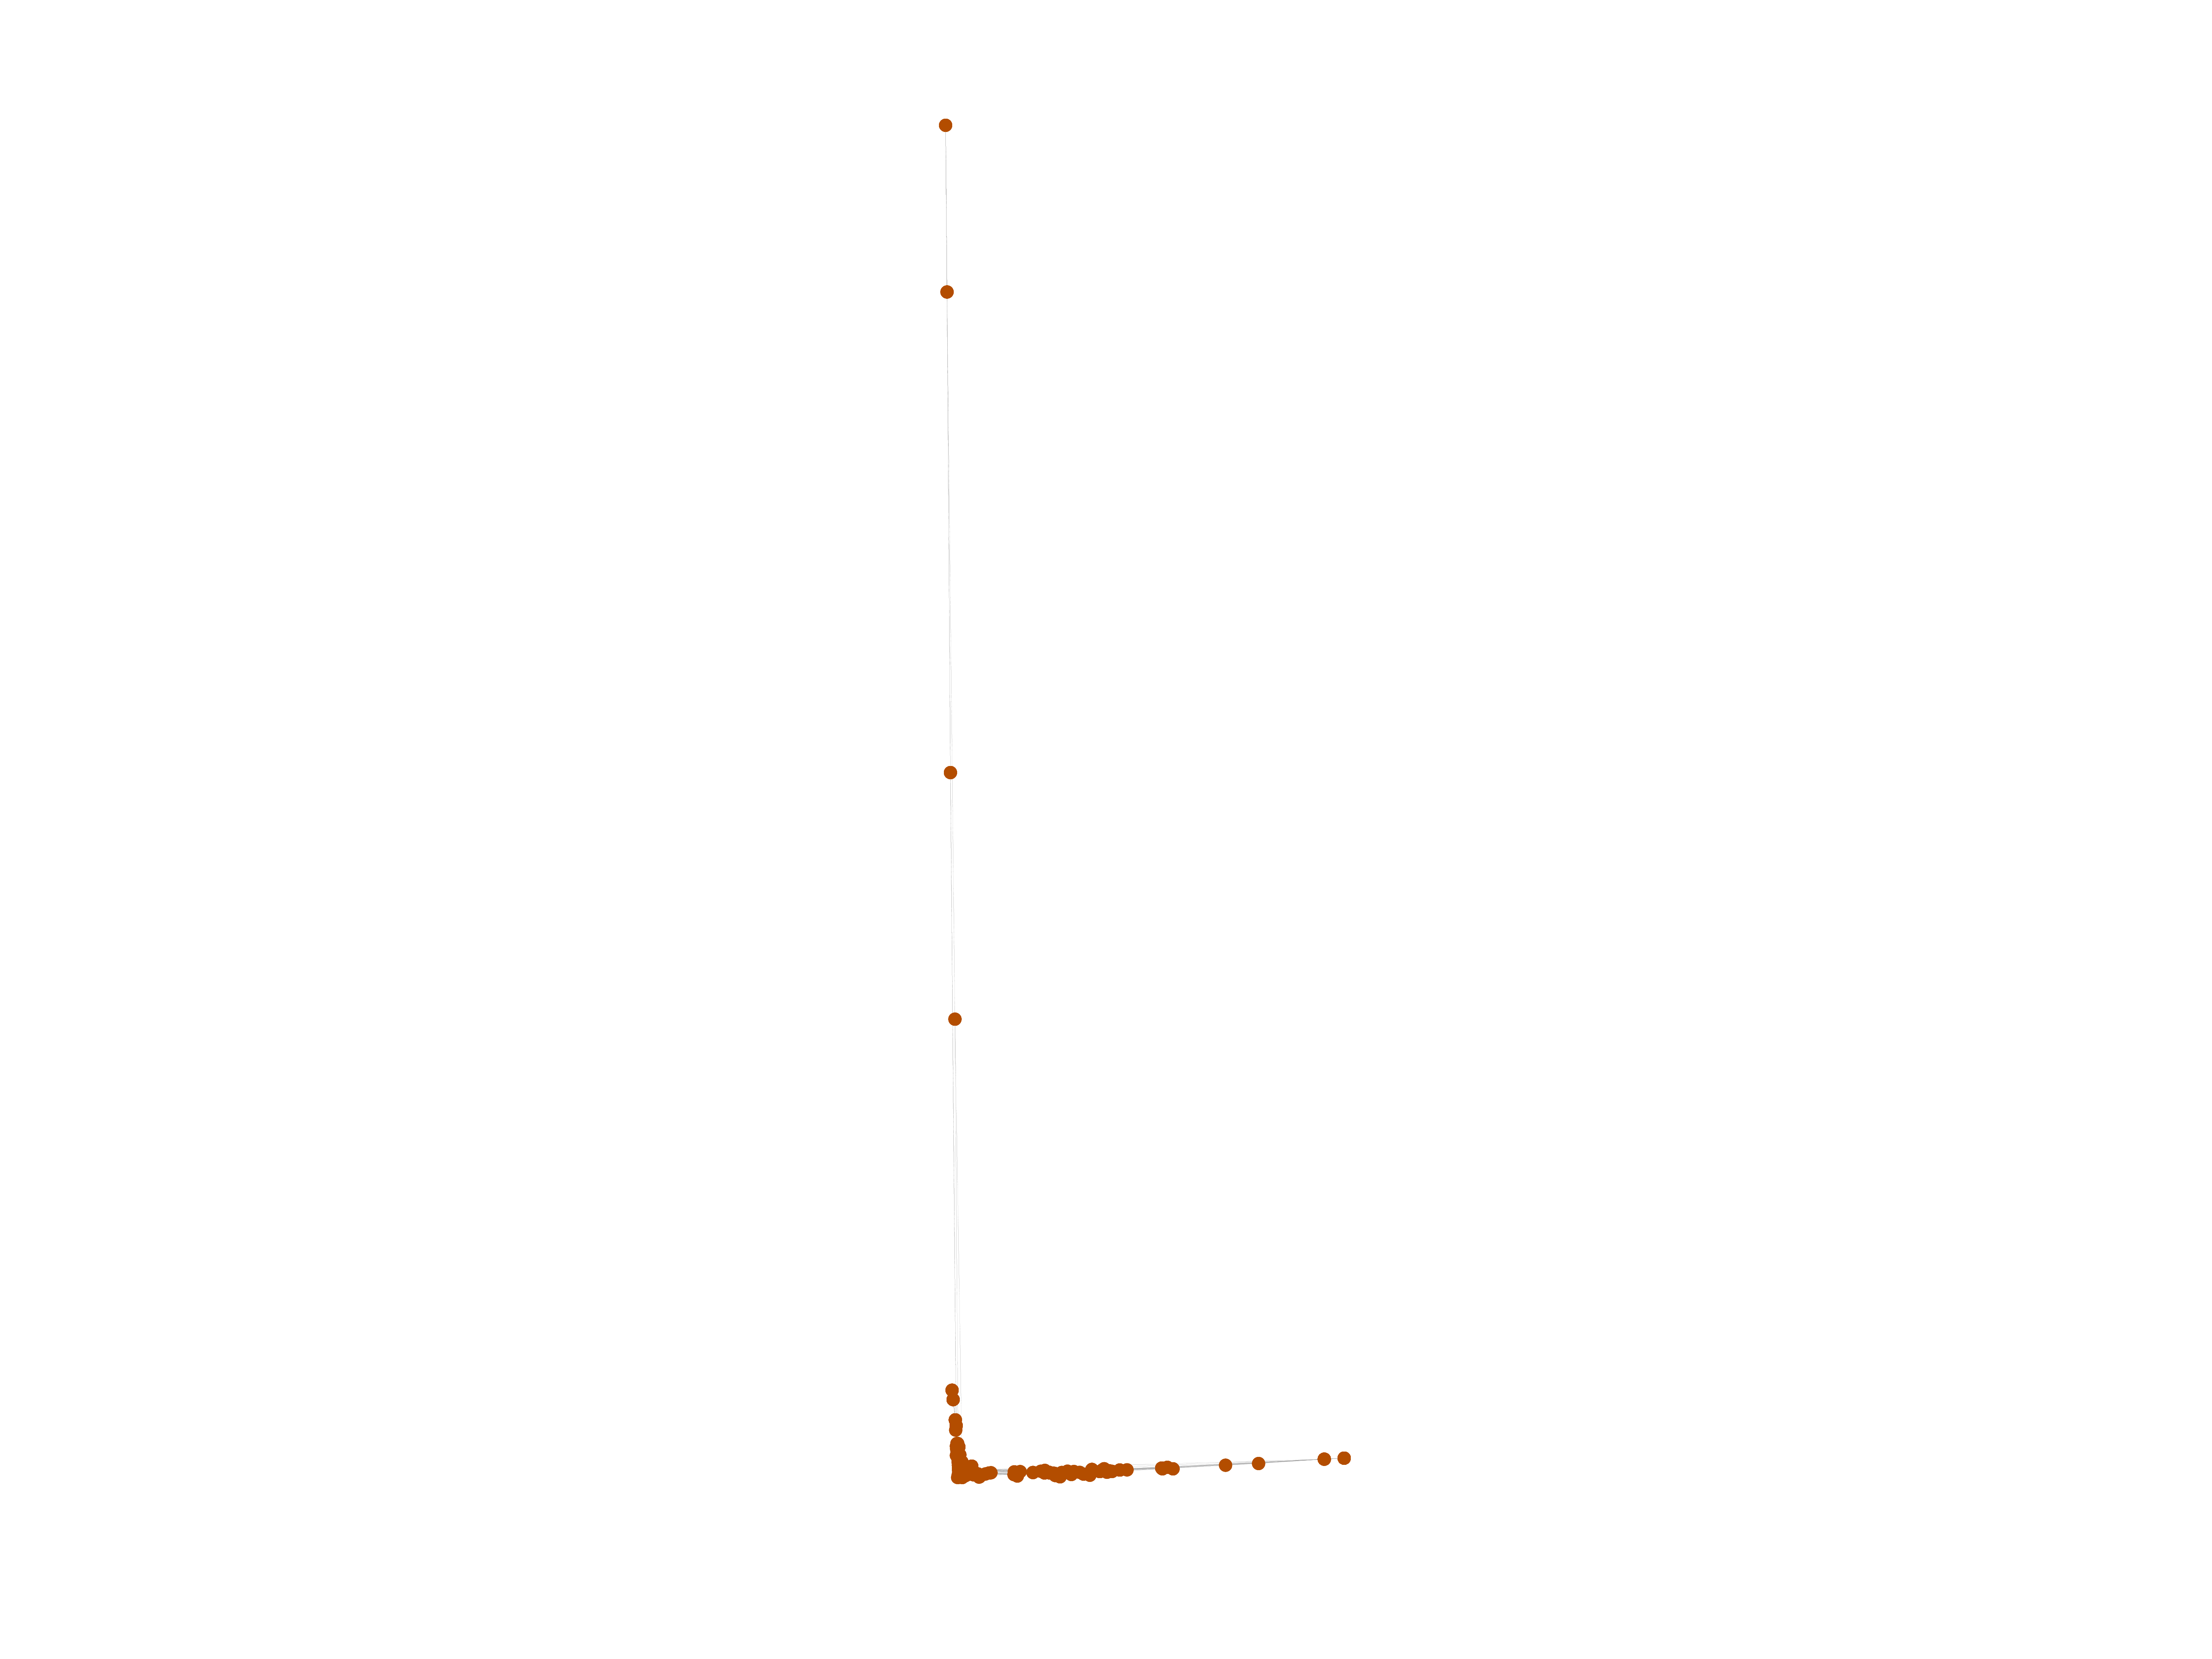
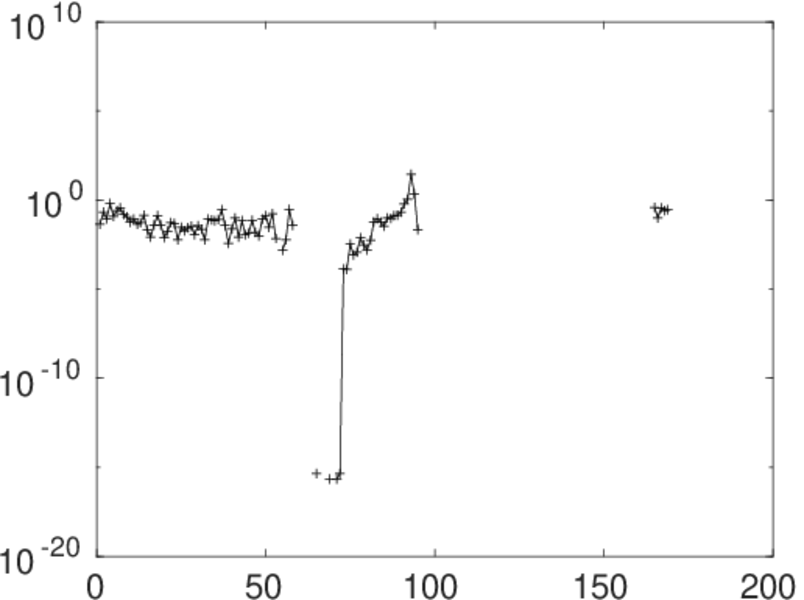
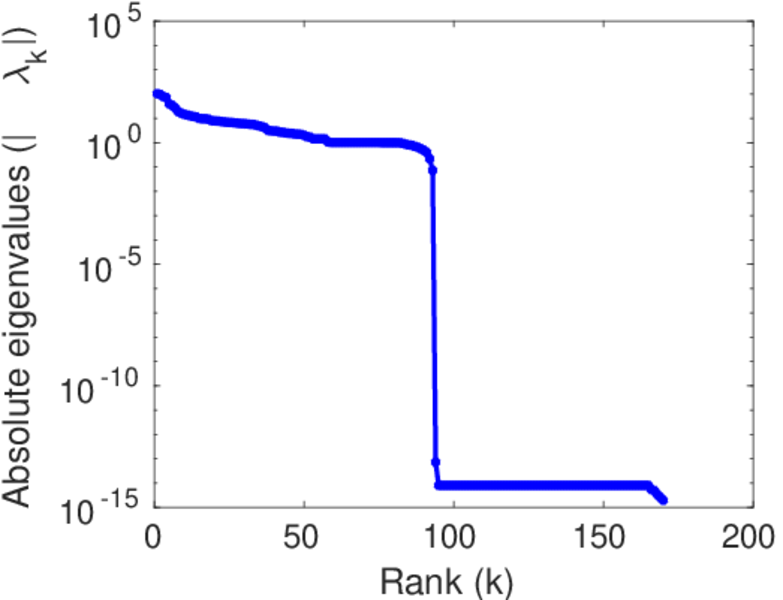
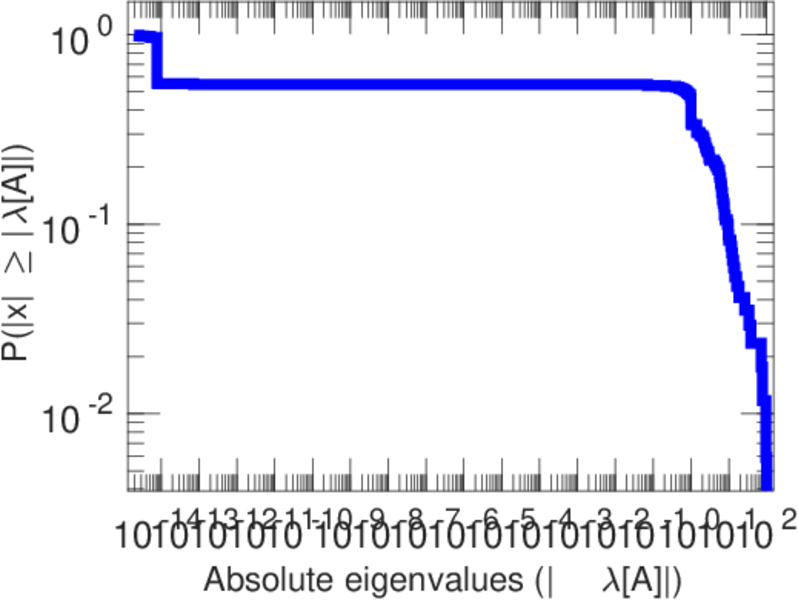
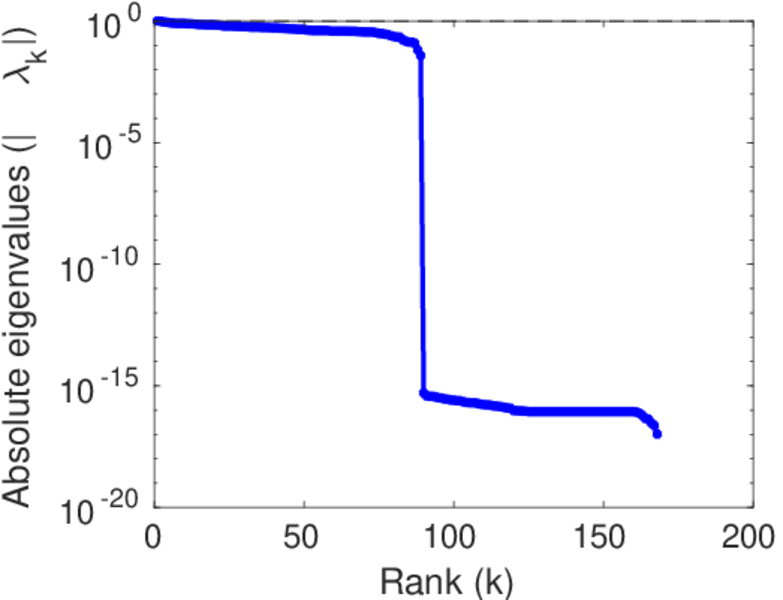
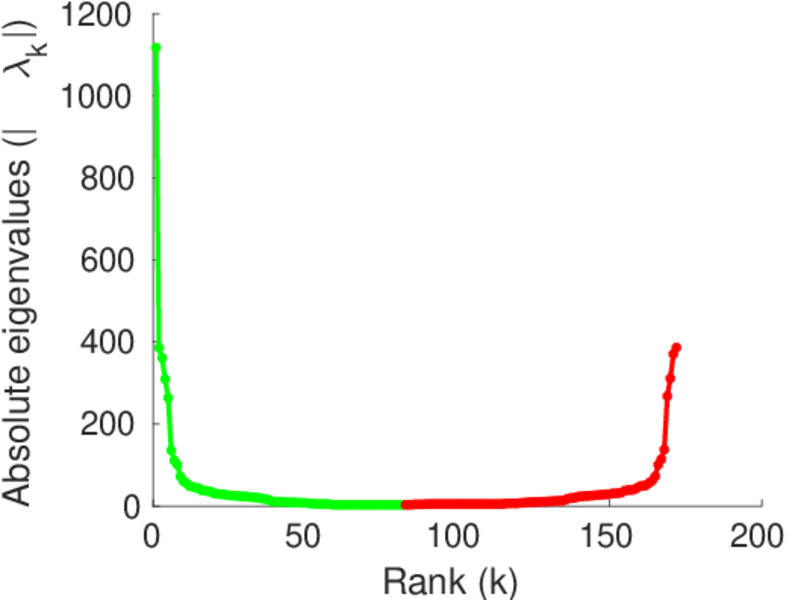
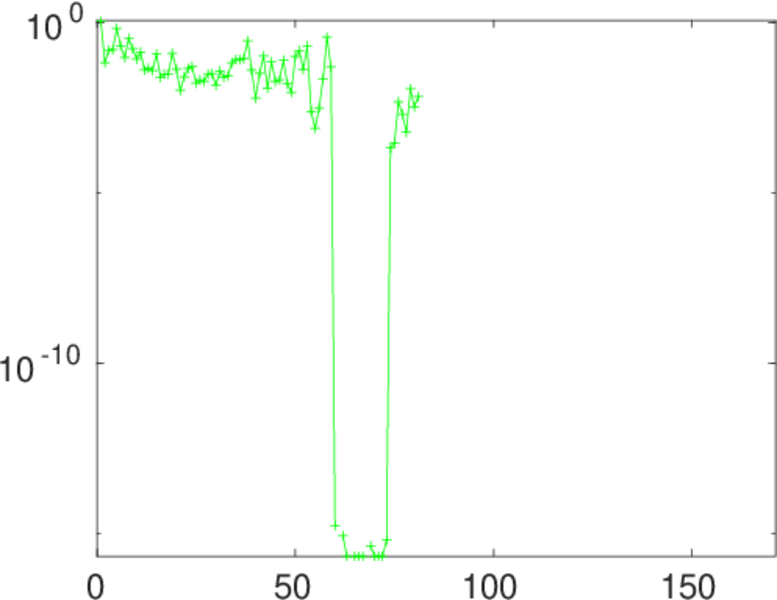
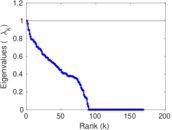
Matrix decompositions plots


Downloads
References
|
[1]
|
Jérôme Kunegis.
KONECT – The Koblenz Network Collection.
In Proc. Int. Conf. on World Wide Web Companion, pages
1343–1350, 2013.
[ http ]
|
|
[2]
|
Wikimedia Foundation.
Wikimedia downloads.
http://dumps.wikimedia.org/, January 2010.
|
 KONECT ‣ Networks ‣
Buy Me a Coffee
KONECT ‣ Networks ‣
Buy Me a Coffee