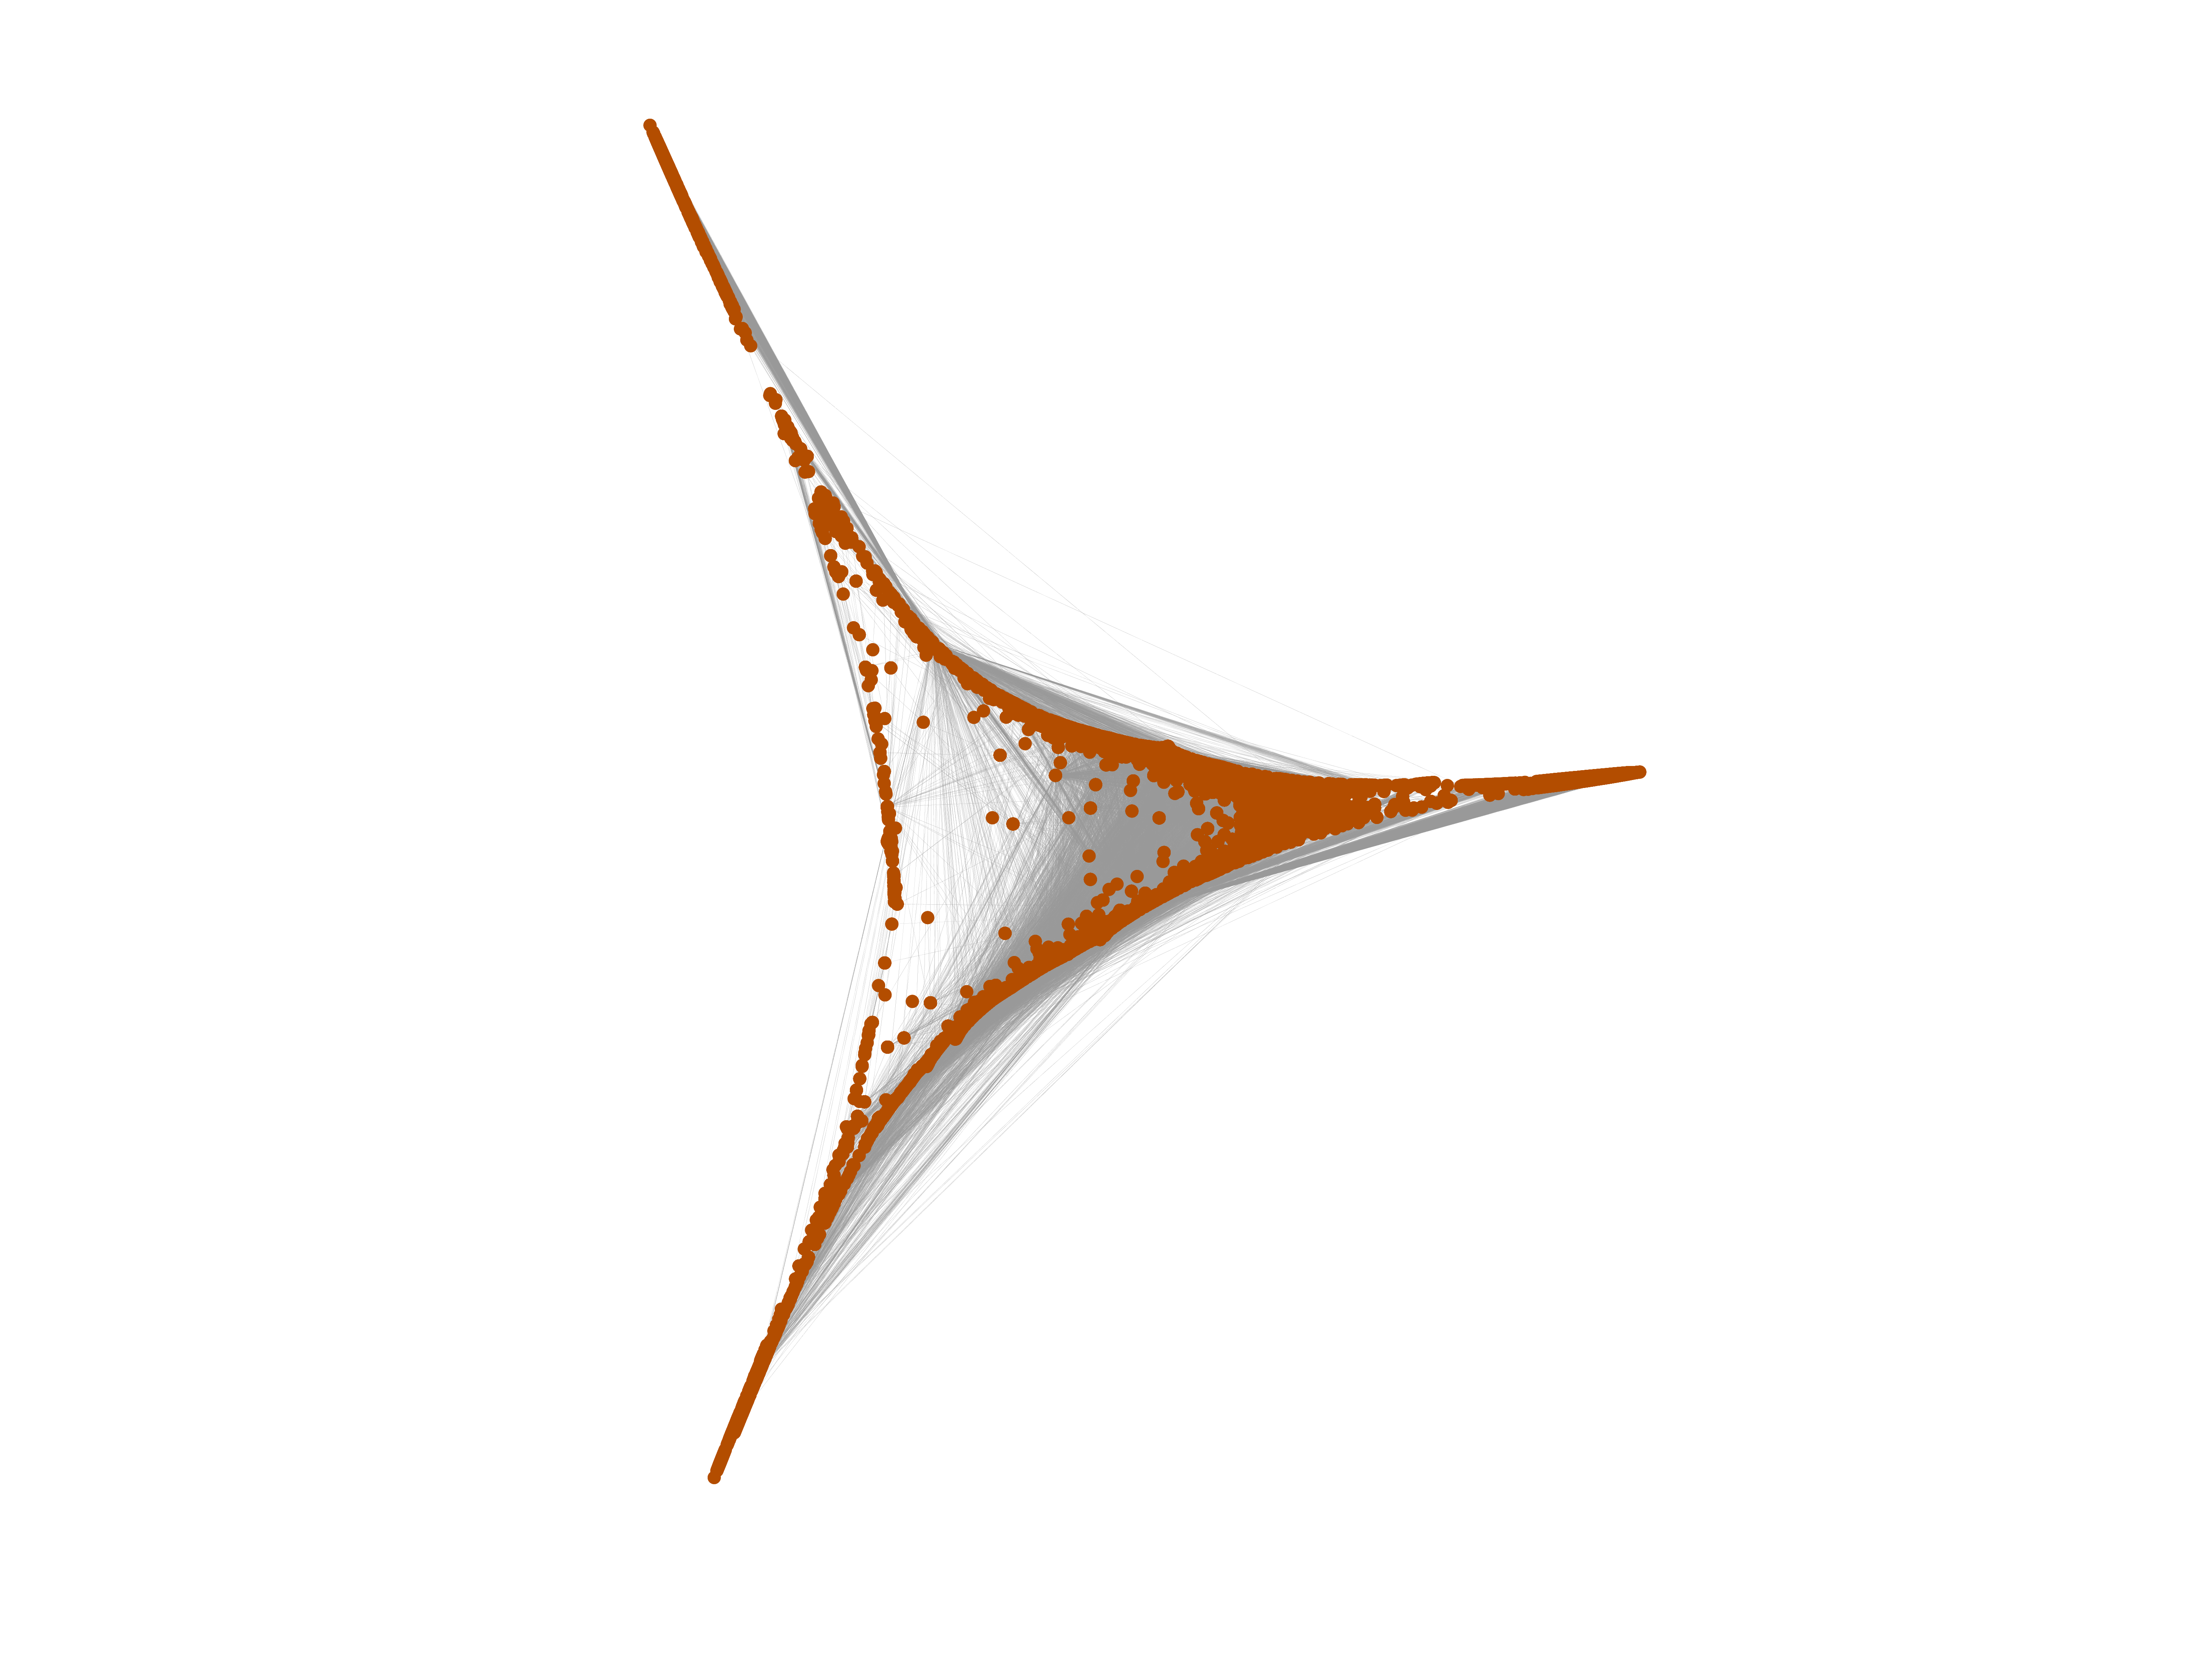
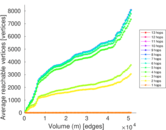
Wikipedia edits (pcd)
This is the bipartite edit network of the Picard Wikipedia. It contains users
and pages from the Picard Wikipedia, connected by edit events. Each edge
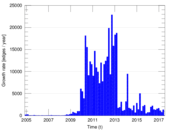
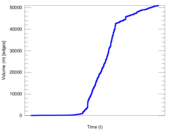
represents an edit. The dataset includes the timestamp of each edit.
Metadata
Statistics
| Size | n = | 8,580
|
| Left size | n1 = | 787
|
| Right size | n2 = | 7,793
|
| Volume | m = | 50,982
|
| Unique edge count | m̿ = | 25,944
|
| Wedge count | s = | 18,665,545
|
| Claw count | z = | 17,558,238,574
|
| Cross count | x = | 15,851,158,124,701
|
| Square count | q = | 14,356,382
|
| 4-Tour count | T4 = | 189,604,408
|
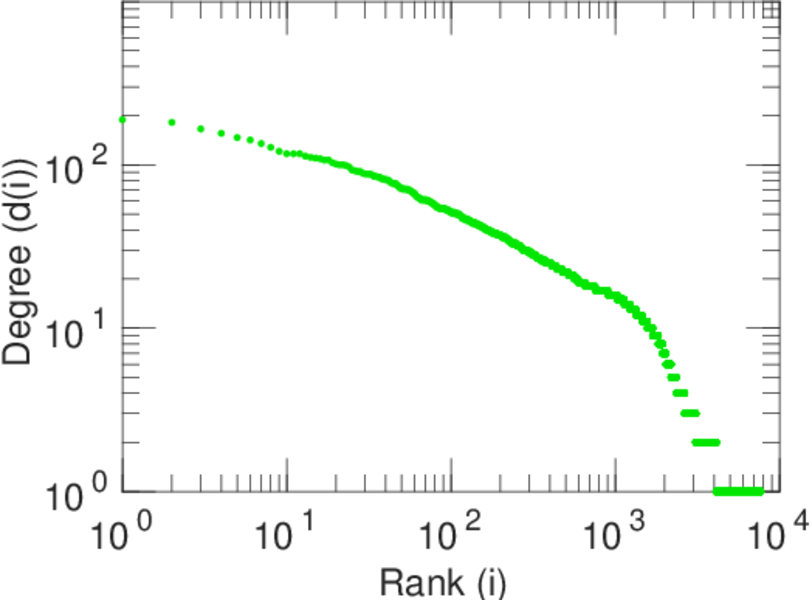
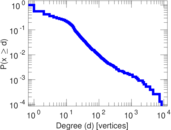
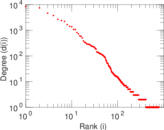
| Maximum degree | dmax = | 8,477
|
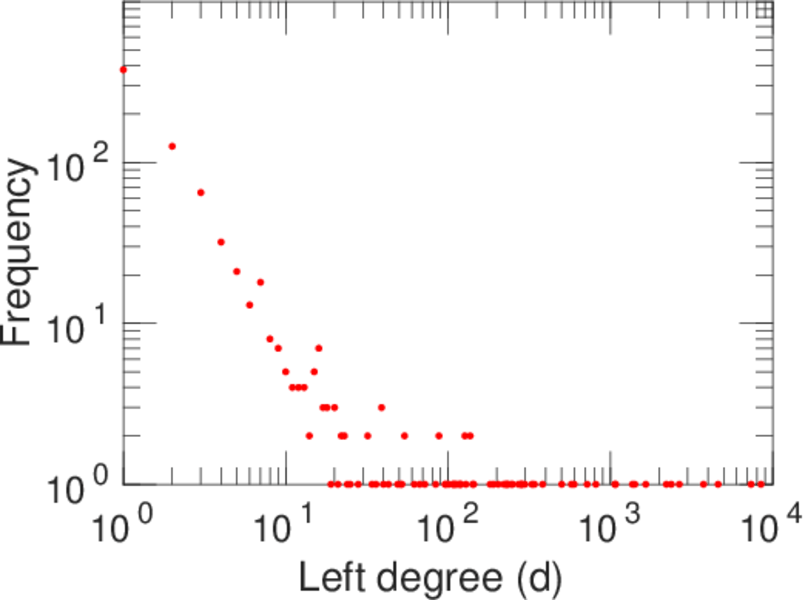
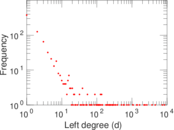
| Maximum left degree | d1max = | 8,477
|
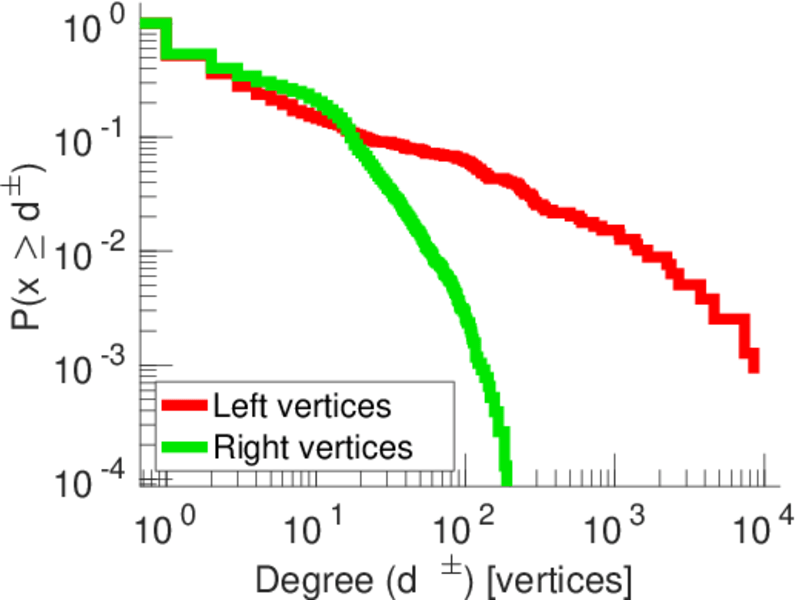
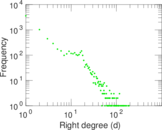
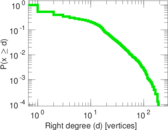
| Maximum right degree | d2max = | 189
|
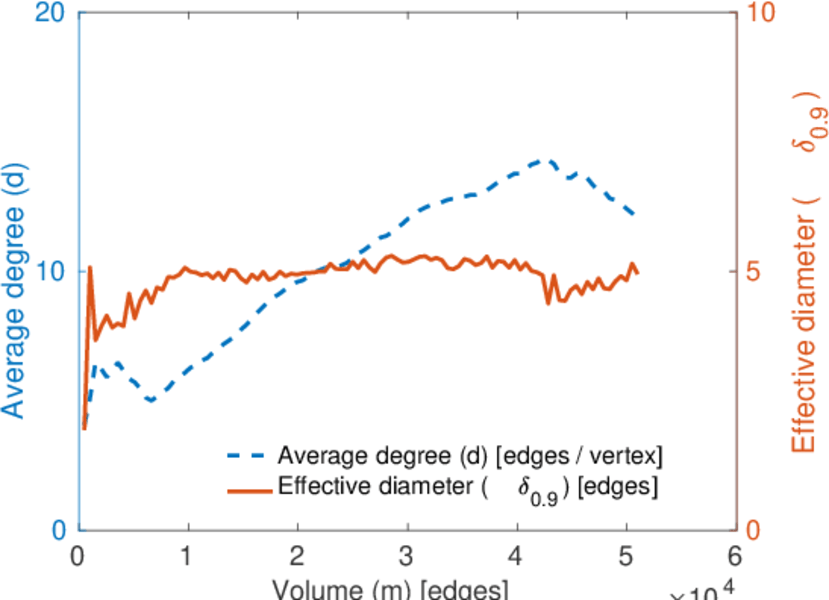
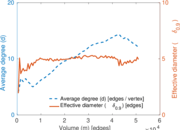
| Average degree | d = | 11.883 9
|
| Average left degree | d1 = | 64.780 2
|
| Average right degree | d2 = | 6.542 02
|
| Fill | p = | 0.004 230 17
|
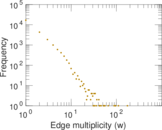
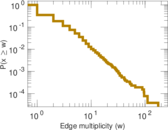
| Average edge multiplicity | m̃ = | 1.965 08
|
| Size of LCC | N = | 8,080
|
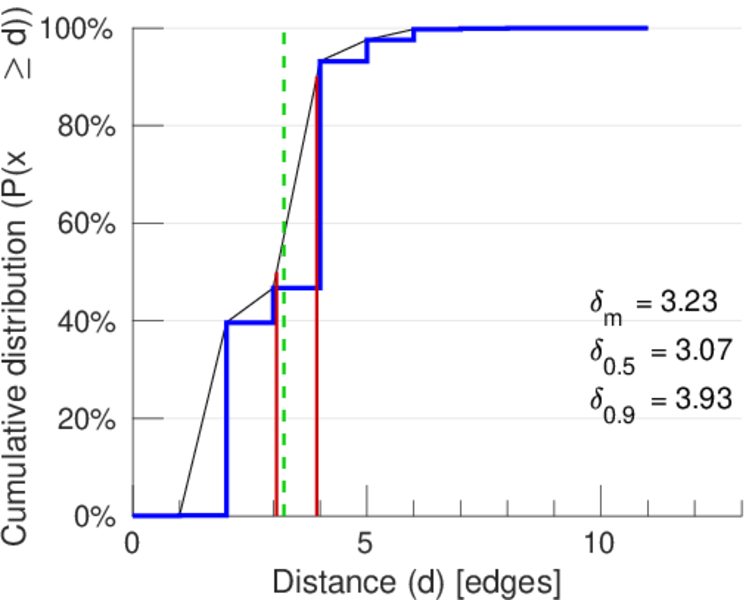
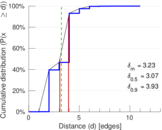
| Diameter | δ = | 13
|
| 50-Percentile effective diameter | δ0.5 = | 3.071 01
|
| 90-Percentile effective diameter | δ0.9 = | 3.931 14
|
| Median distance | δM = | 4
|
| Mean distance | δm = | 3.231 89
|
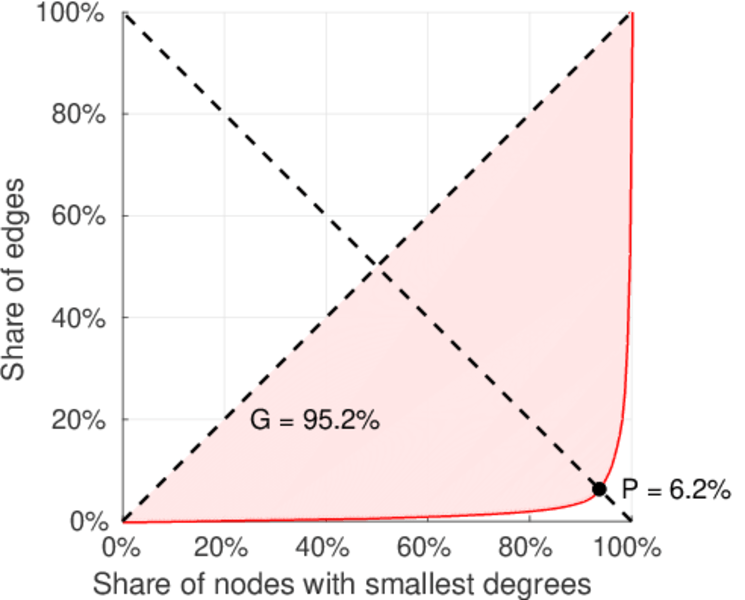
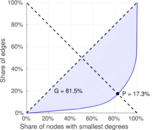
| Gini coefficient | G = | 0.819 555
|
| Balanced inequality ratio | P = | 0.173 846
|
| Left balanced inequality ratio | P1 = | 0.061 511 9
|
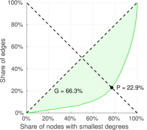
| Right balanced inequality ratio | P2 = | 0.228 551
|
| Relative edge distribution entropy | Her = | 0.748 109
|
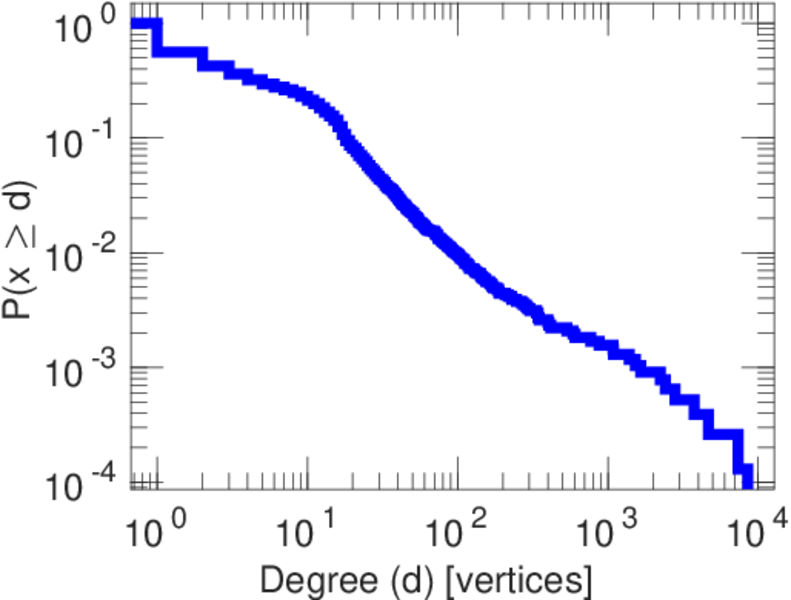
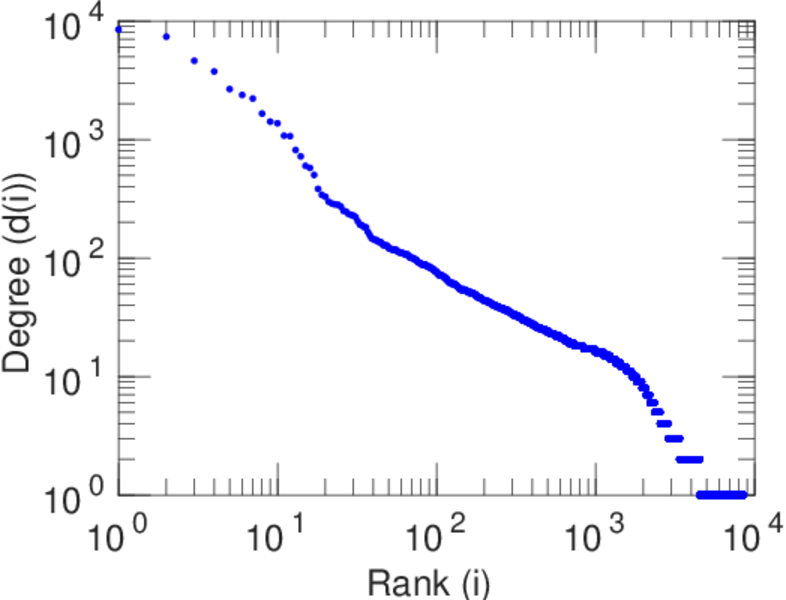
| Power law exponent | γ = | 2.384 82
|
| Tail power law exponent | γt = | 2.741 00
|
| Tail power law exponent with p | γ3 = | 2.741 00
|
| p-value | p = | 0.000 00
|
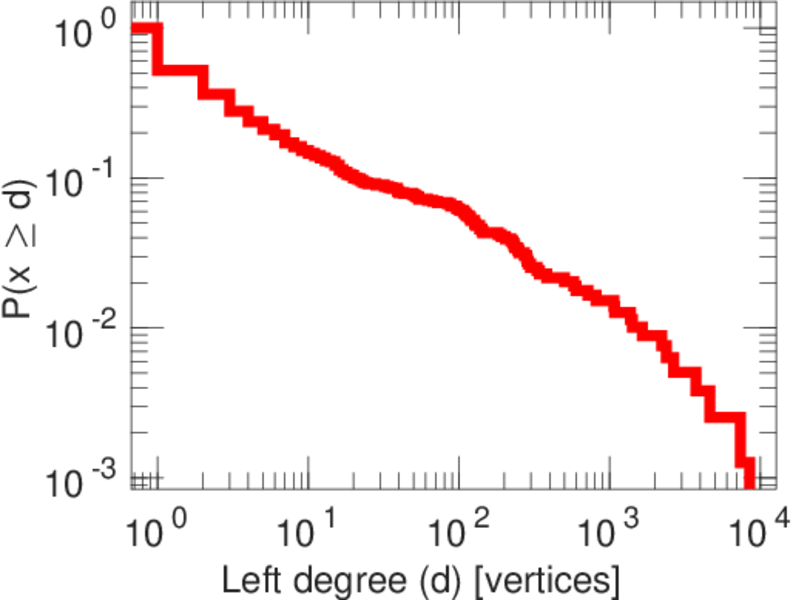
| Left tail power law exponent with p | γ3,1 = | 1.551 00
|
| Left p-value | p1 = | 0.010 000 0
|
| Right tail power law exponent with p | γ3,2 = | 5.001 00
|
| Right p-value | p2 = | 0.191 000
|
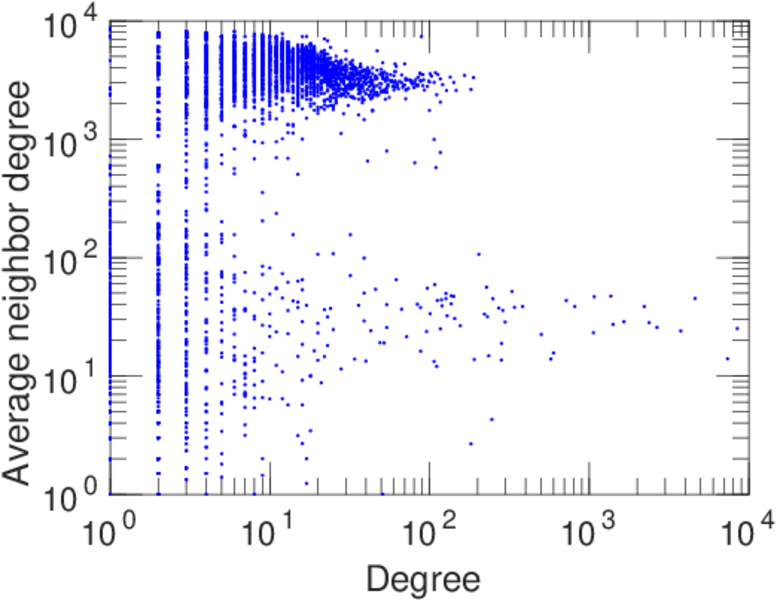
| Degree assortativity | ρ = | −0.326 220
|
| Degree assortativity p-value | pρ = | 0.000 00
|
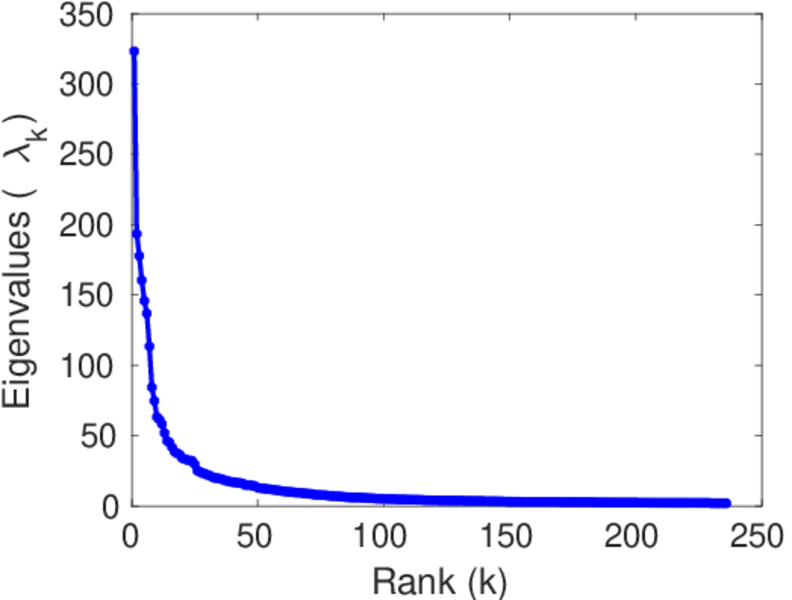
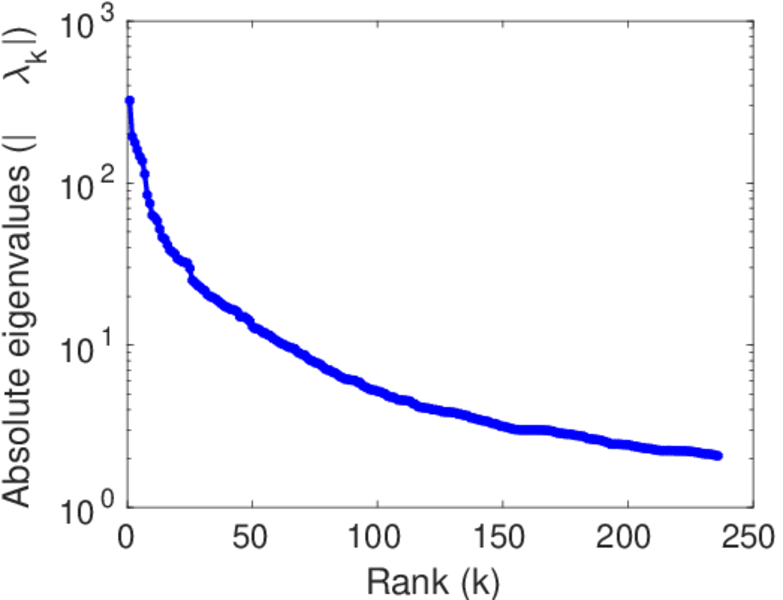
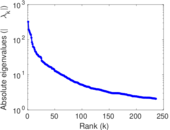
| Spectral norm | α = | 323.273
|
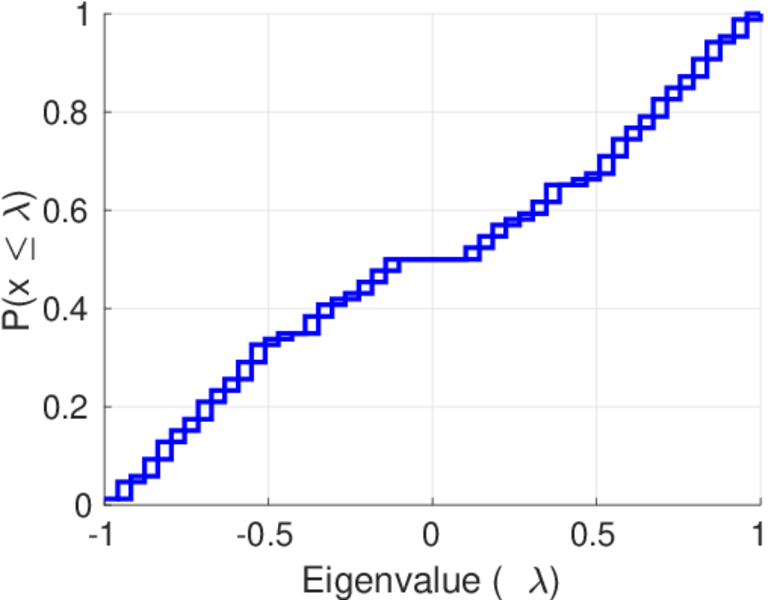
| Algebraic connectivity | a = | 0.027 794 5
|
| Spectral separation | |λ1[A] / λ2[A]| = | 1.671 36
|
| Controllability | C = | 7,147
|
| Relative controllability | Cr = | 0.843 702
|
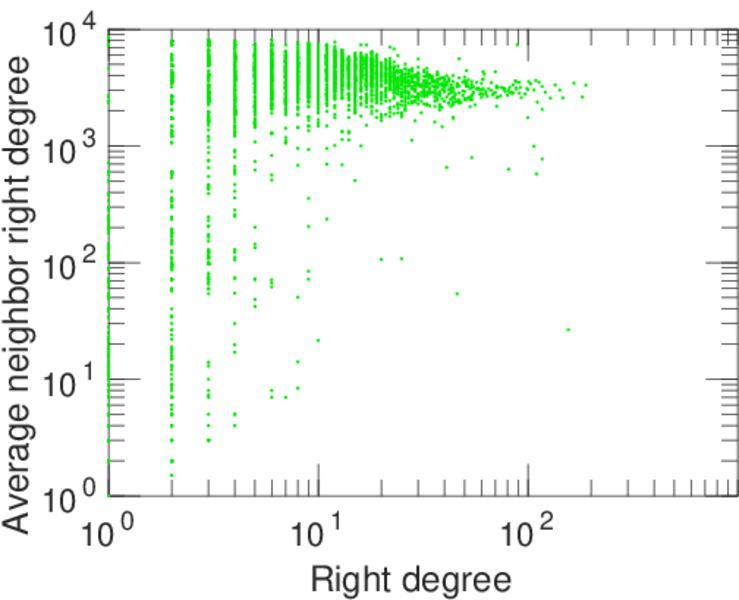
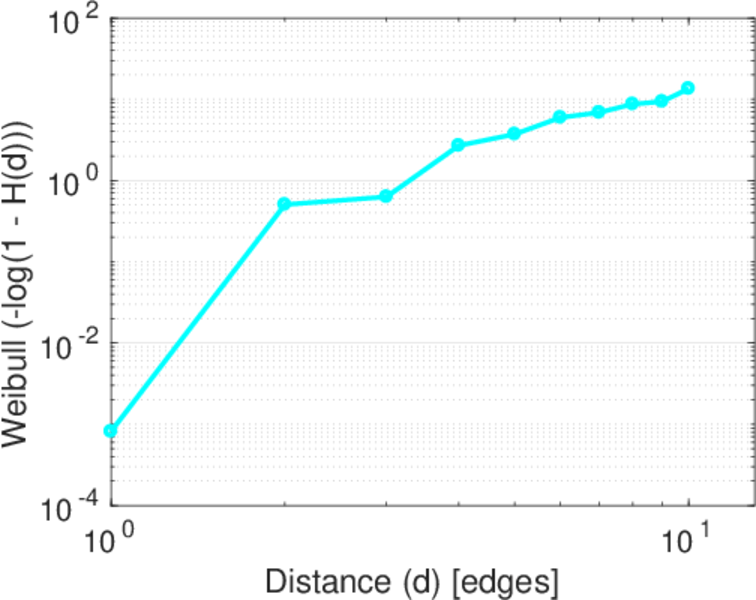
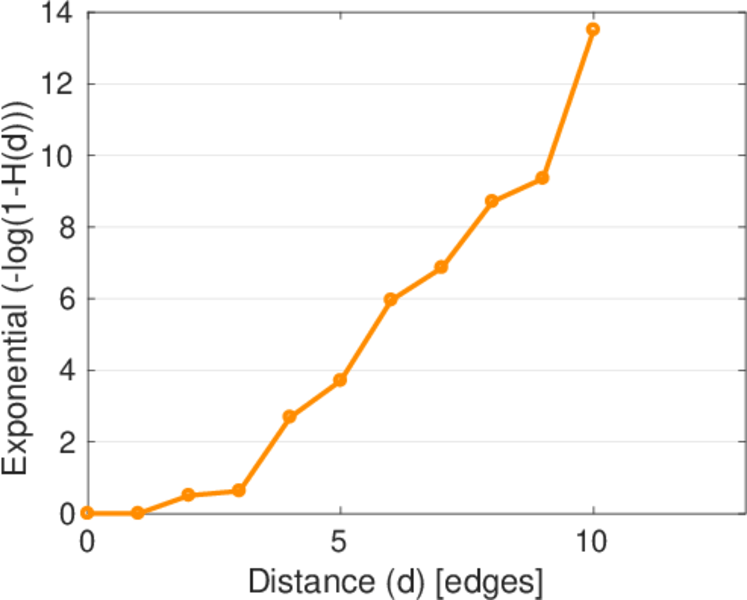
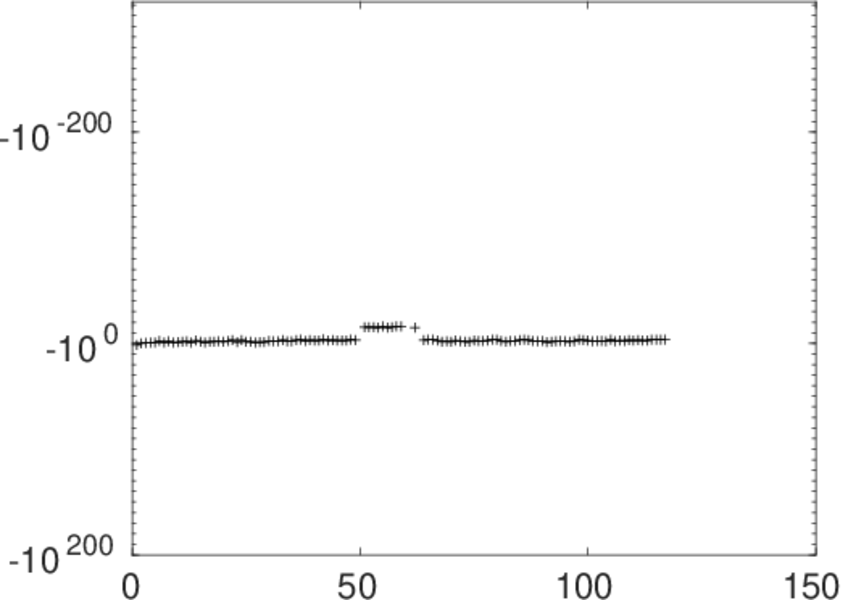
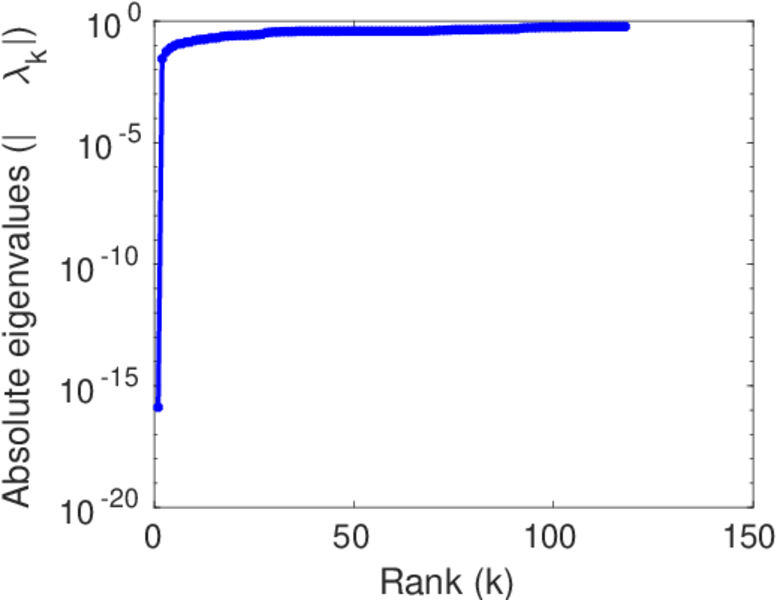
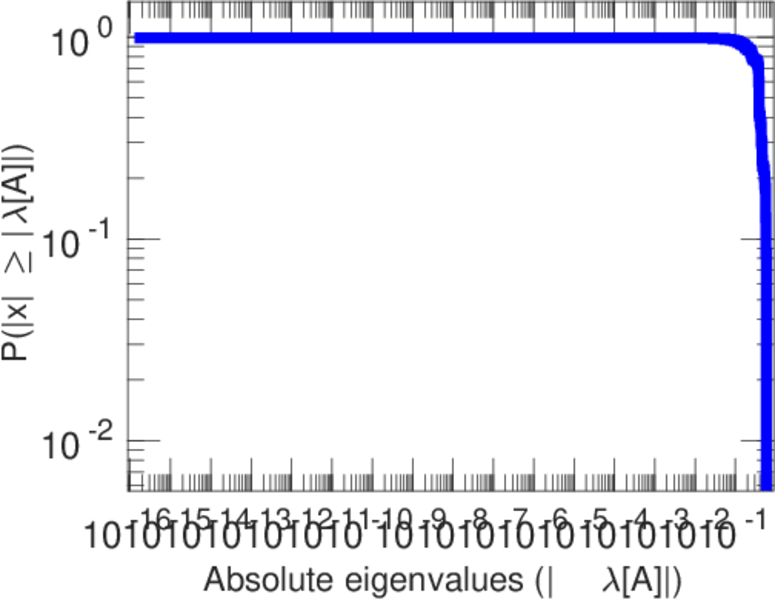
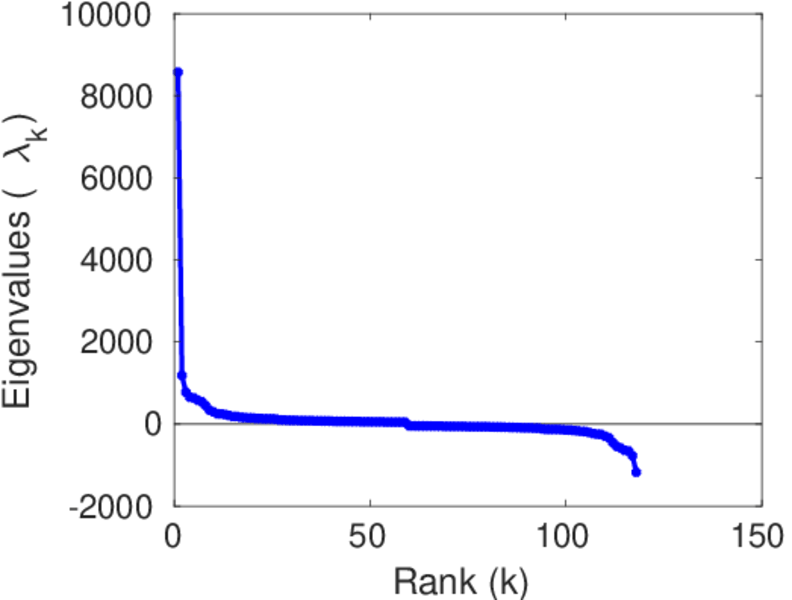
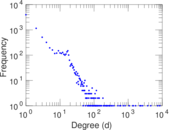
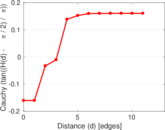
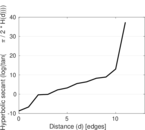
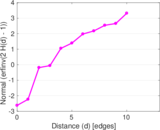
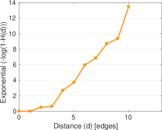
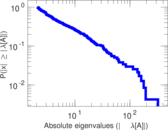
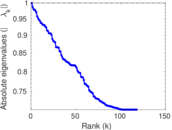
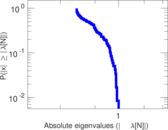
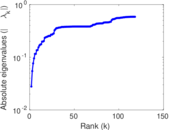
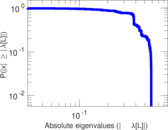
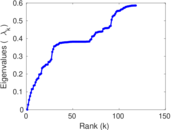
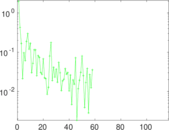
Plots


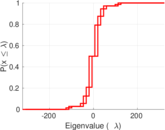

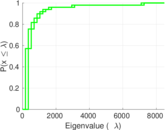


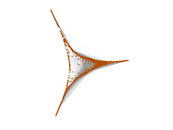


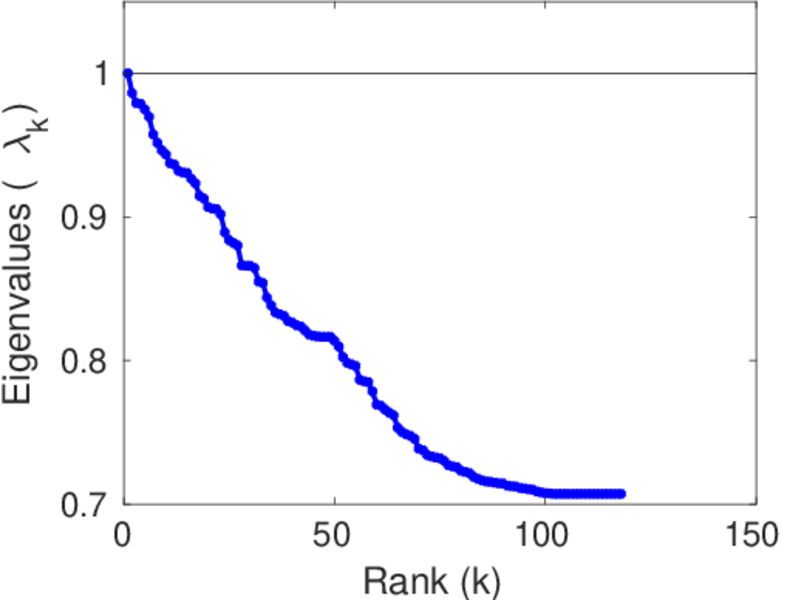
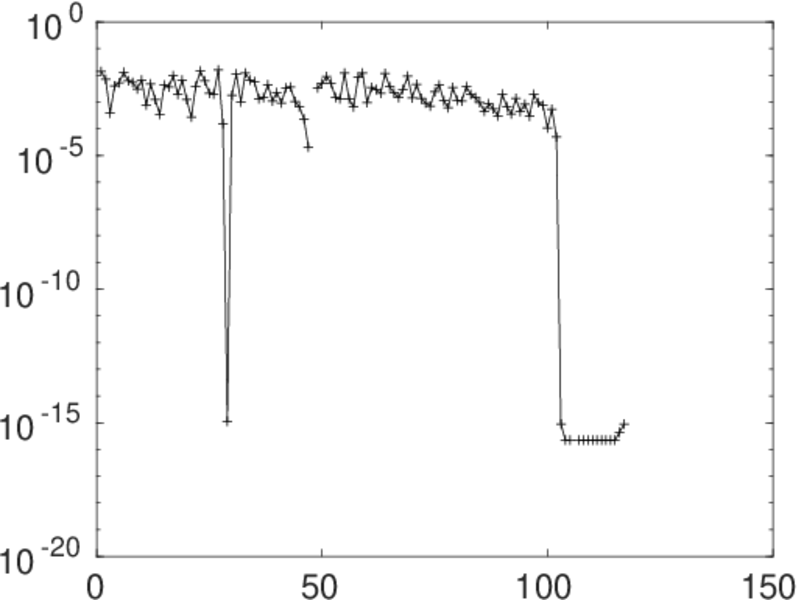
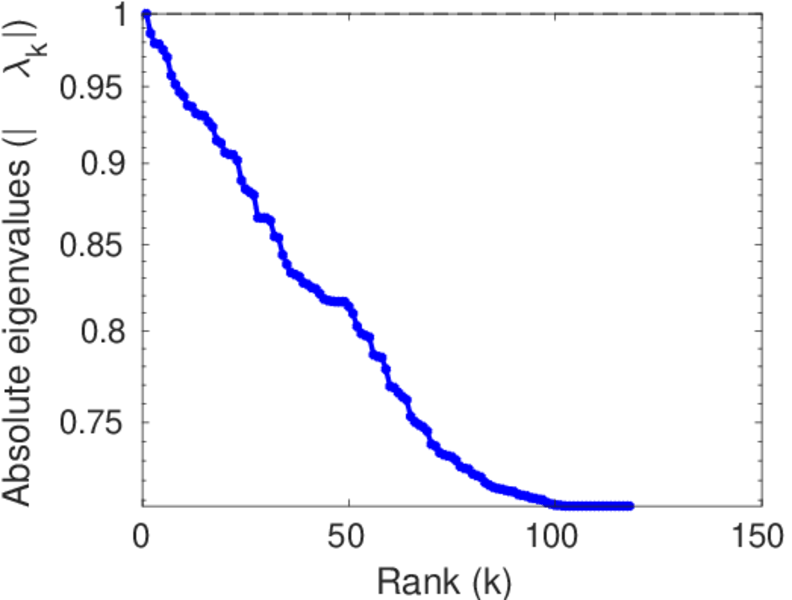
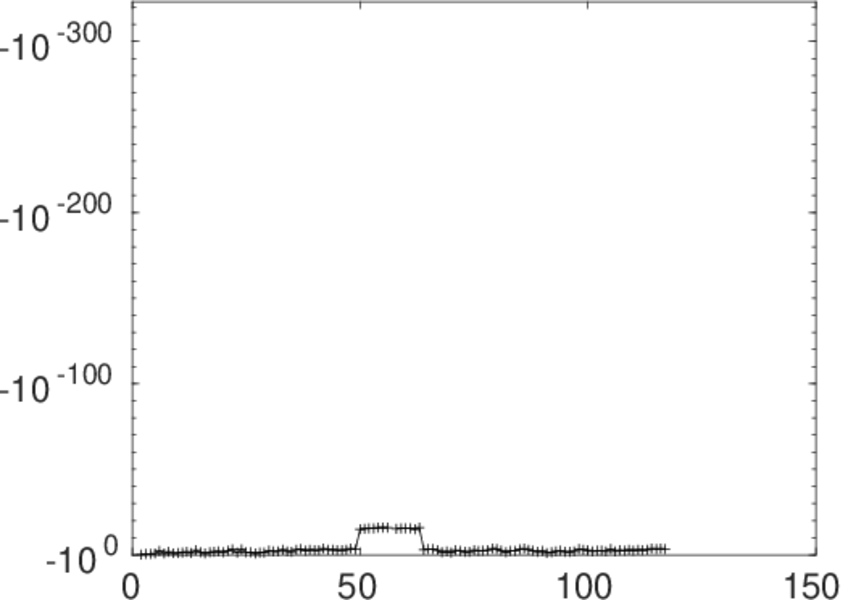
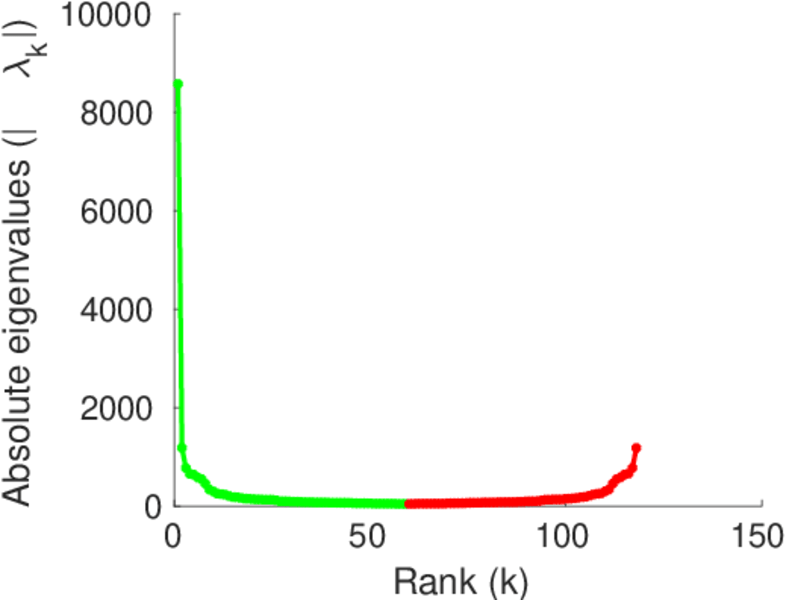
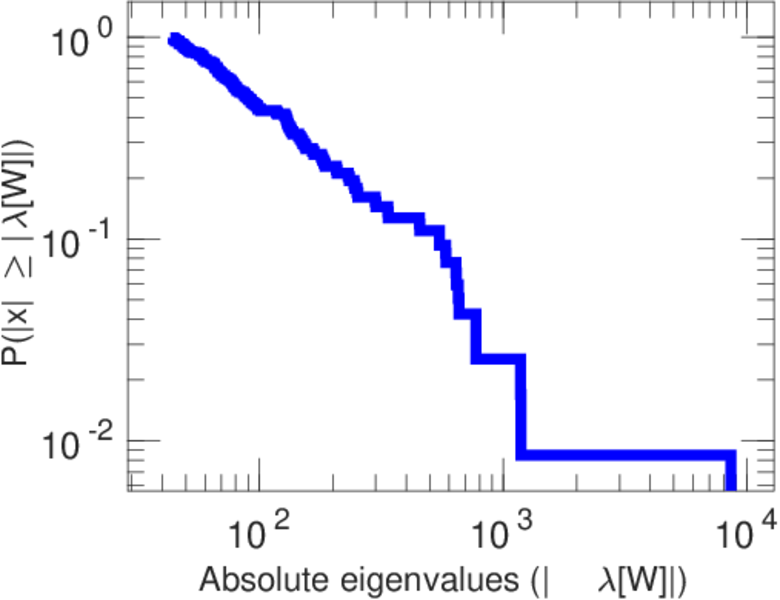
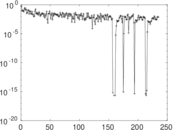
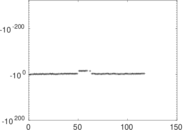
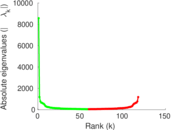
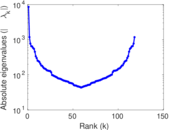
Matrix decompositions plots


Downloads
References
|
[1]
|
Jérôme Kunegis.
KONECT – The Koblenz Network Collection.
In Proc. Int. Conf. on World Wide Web Companion, pages
1343–1350, 2013.
[ http ]
|
|
[2]
|
Wikimedia Foundation.
Wikimedia downloads.
http://dumps.wikimedia.org/, January 2010.
|
 KONECT ‣ Networks ‣
Buy Me a Coffee
KONECT ‣ Networks ‣
Buy Me a Coffee