Wikipedia edits (pdc)
This is the bipartite edit network of the Pennsylvania German Wikipedia. It
contains users and pages from the Pennsylvania German Wikipedia, connected by
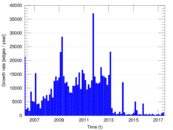
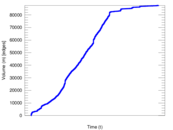
edit events. Each edge represents an edit. The dataset includes the timestamp
of each edit.
Metadata
Statistics
| Size | n = | 6,592
|
| Left size | n1 = | 1,138
|
| Right size | n2 = | 5,454
|
| Volume | m = | 87,558
|
| Unique edge count | m̿ = | 36,764
|
| Wedge count | s = | 14,543,621
|
| Claw count | z = | 6,633,200,539
|
| Cross count | x = | 2,947,929,237,594
|
| Square count | q = | 35,970,586
|
| 4-Tour count | T4 = | 346,056,296
|
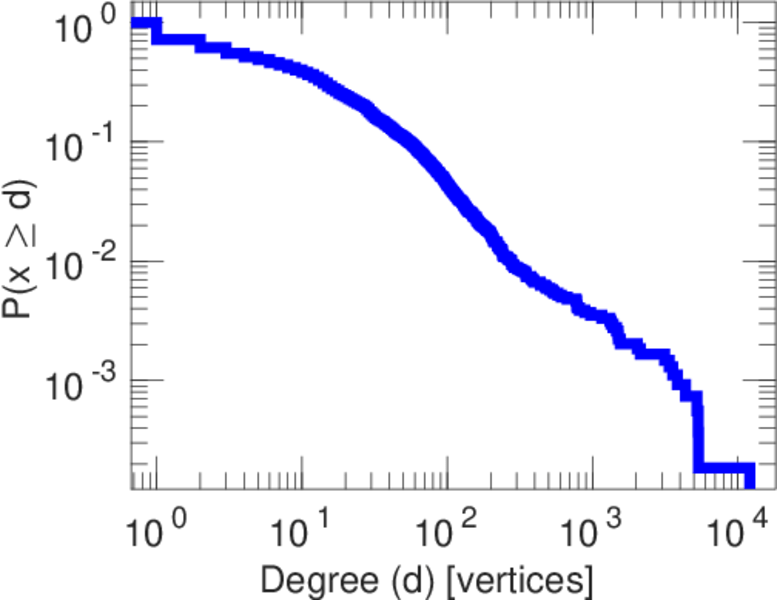
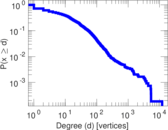
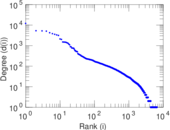
| Maximum degree | dmax = | 12,096
|
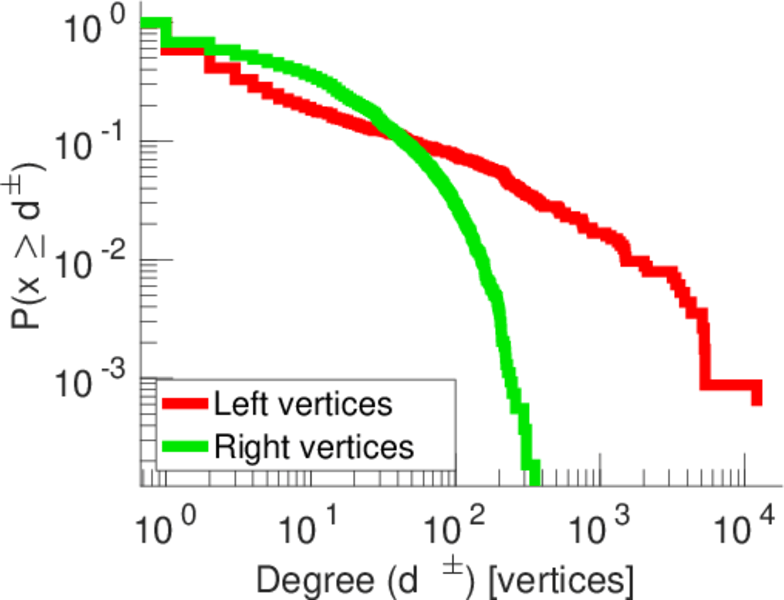
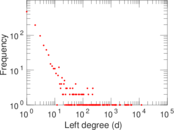
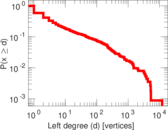
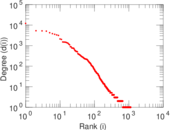
| Maximum left degree | d1max = | 12,096
|
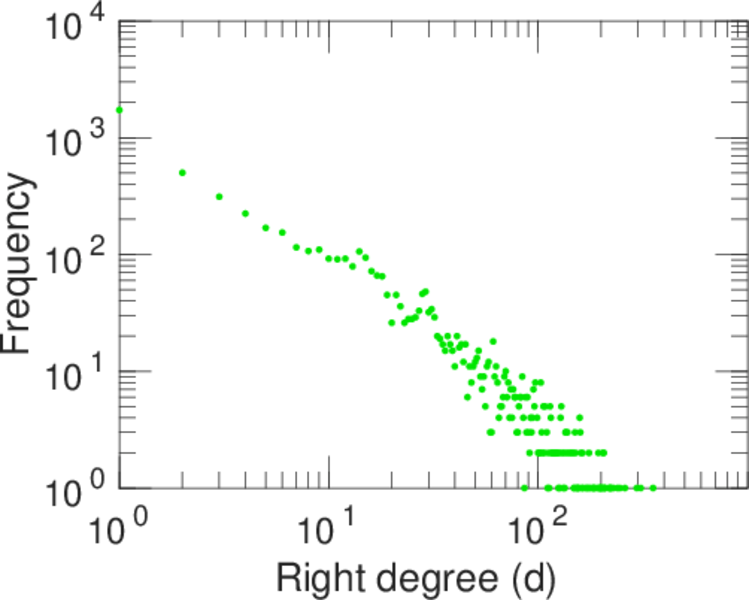
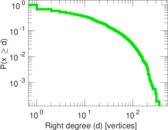
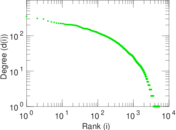
| Maximum right degree | d2max = | 354
|
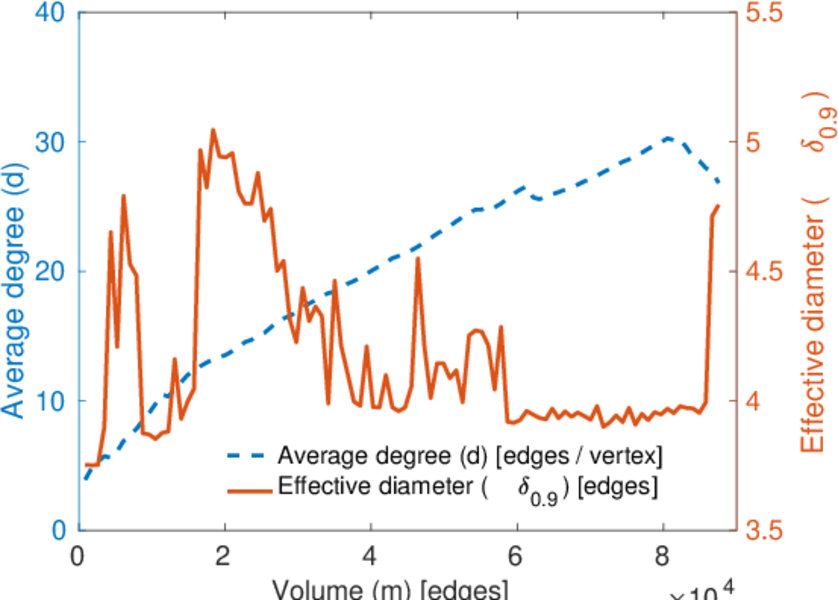
| Average degree | d = | 26.564 9
|
| Average left degree | d1 = | 76.940 2
|
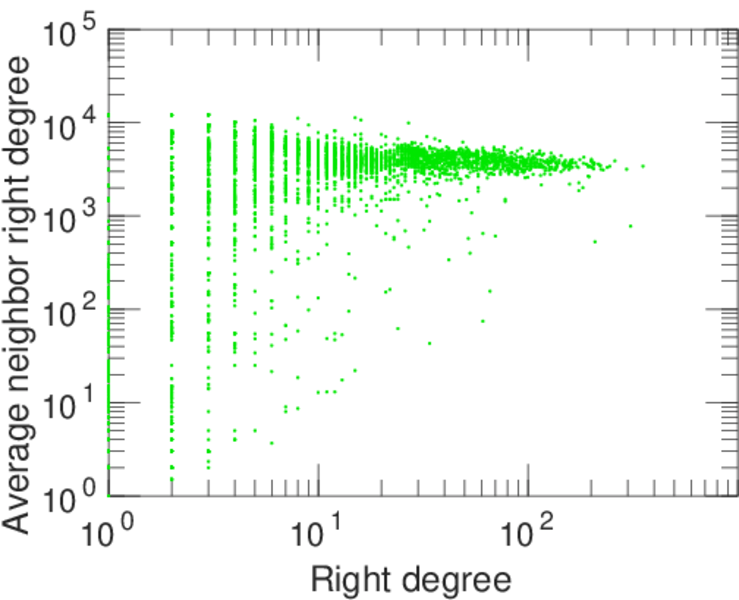
| Average right degree | d2 = | 16.053 9
|
| Fill | p = | 0.005 923 32
|
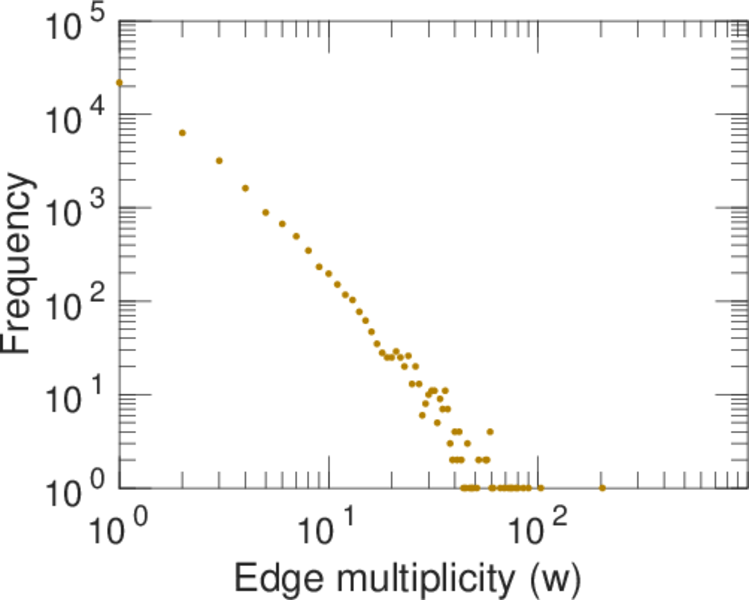
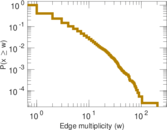
| Average edge multiplicity | m̃ = | 2.381 62
|
| Size of LCC | N = | 6,018
|
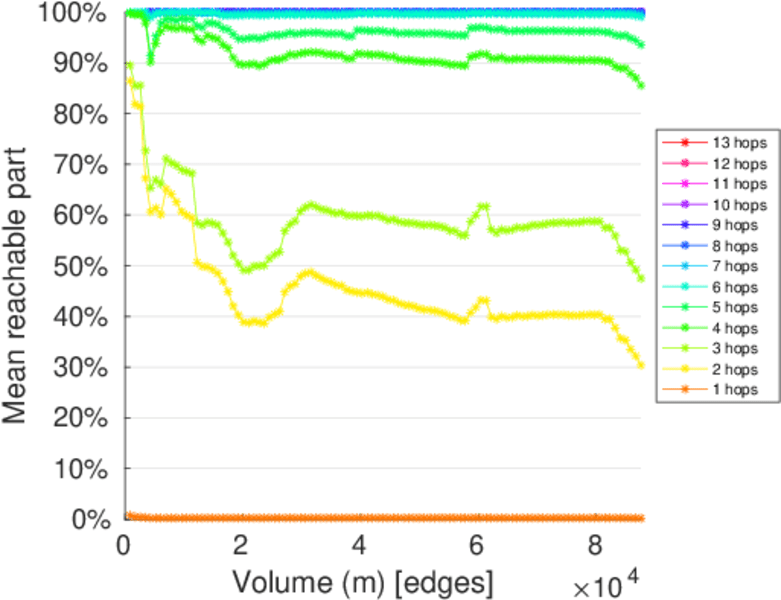
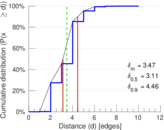
| Diameter | δ = | 13
|
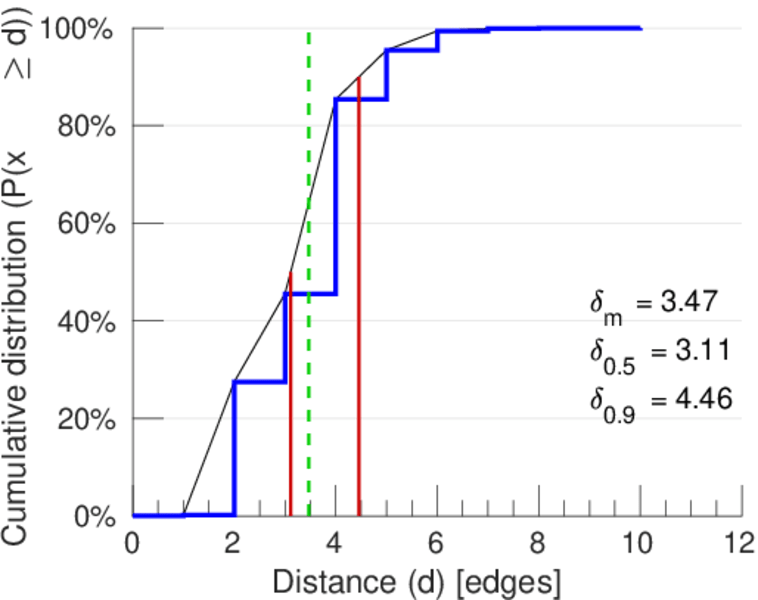
| 50-Percentile effective diameter | δ0.5 = | 3.112 16
|
| 90-Percentile effective diameter | δ0.9 = | 4.458 16
|
| Median distance | δM = | 4
|
| Mean distance | δm = | 3.467 47
|
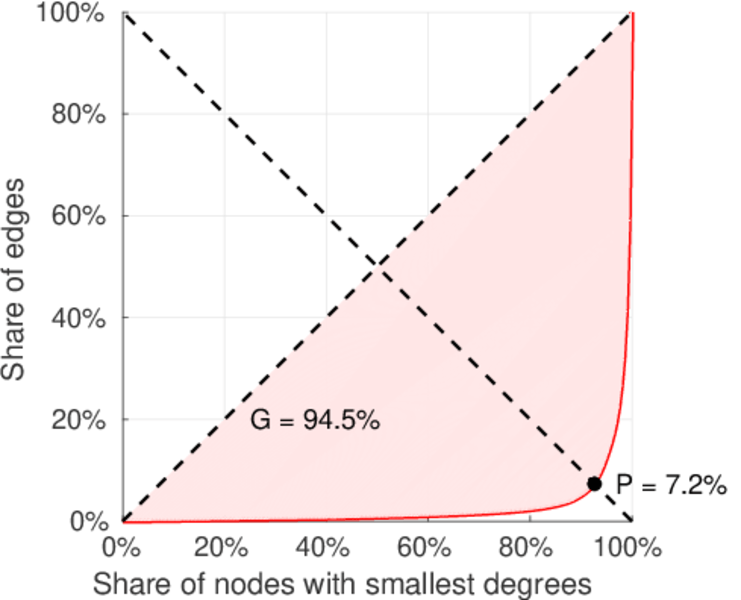
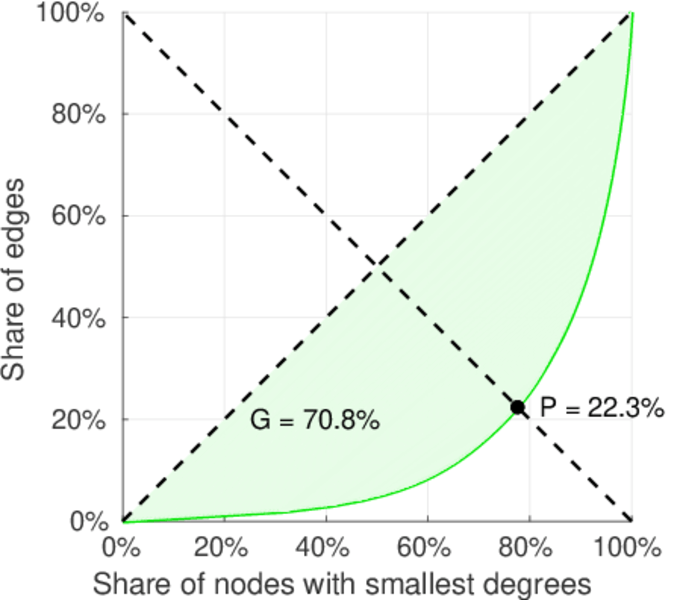
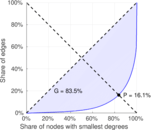
| Gini coefficient | G = | 0.826 697
|
| Balanced inequality ratio | P = | 0.170 344
|
| Left balanced inequality ratio | P1 = | 0.071 781 0
|
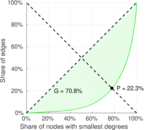
| Right balanced inequality ratio | P2 = | 0.222 515
|
| Relative edge distribution entropy | Her = | 0.790 216
|
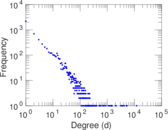
| Power law exponent | γ = | 1.864 81
|
| Tail power law exponent | γt = | 2.471 00
|
| Tail power law exponent with p | γ3 = | 2.471 00
|
| p-value | p = | 0.000 00
|
| Left tail power law exponent with p | γ3,1 = | 1.671 00
|
| Left p-value | p1 = | 0.000 00
|
| Right tail power law exponent with p | γ3,2 = | 4.651 00
|
| Right p-value | p2 = | 0.013 000 0
|
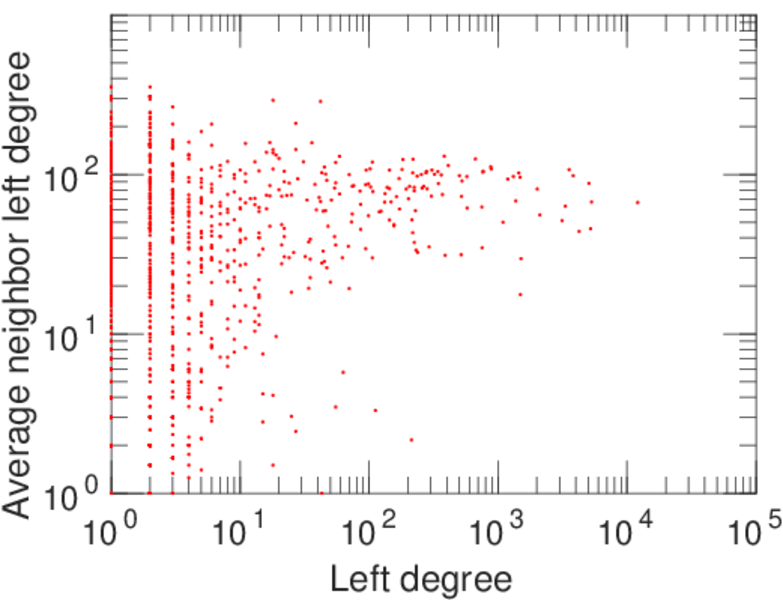
| Degree assortativity | ρ = | −0.251 276
|
| Degree assortativity p-value | pρ = | 0.000 00
|
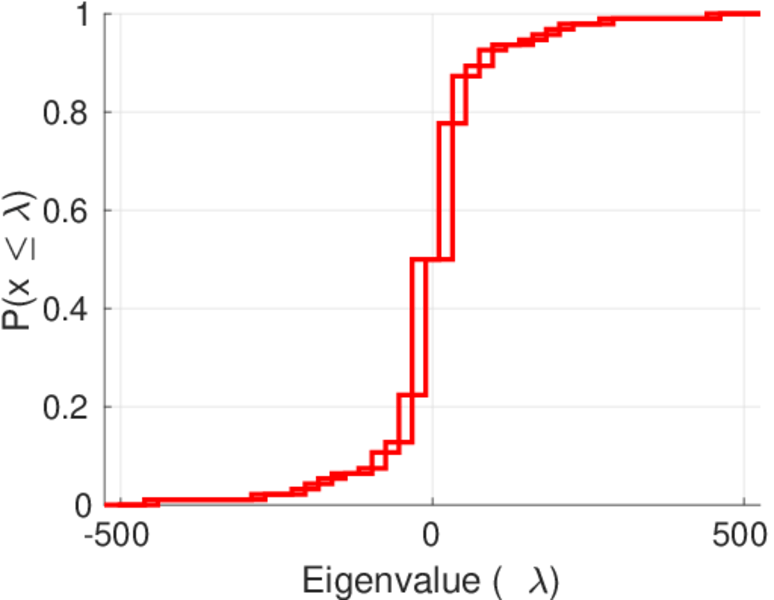
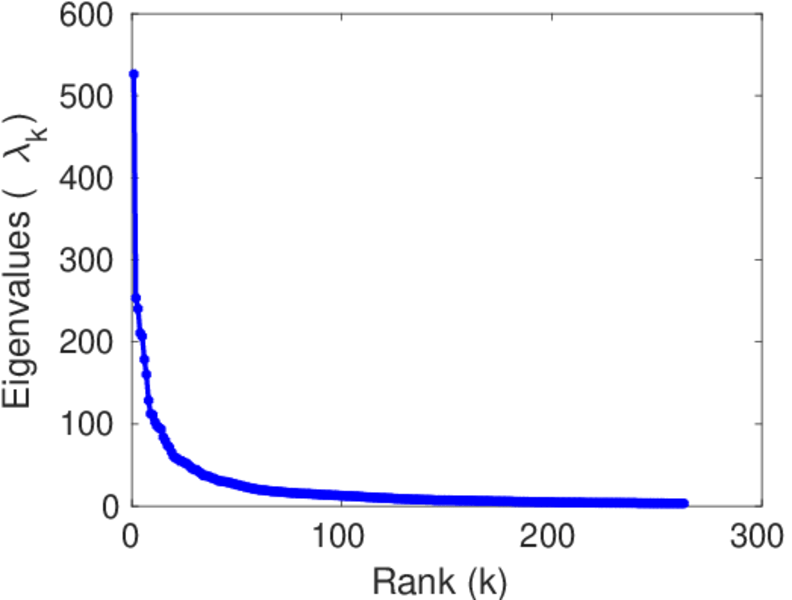
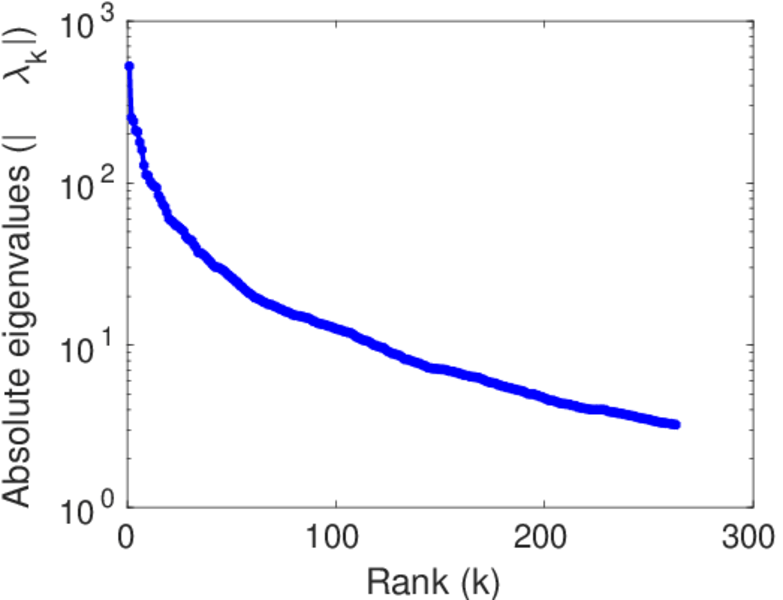
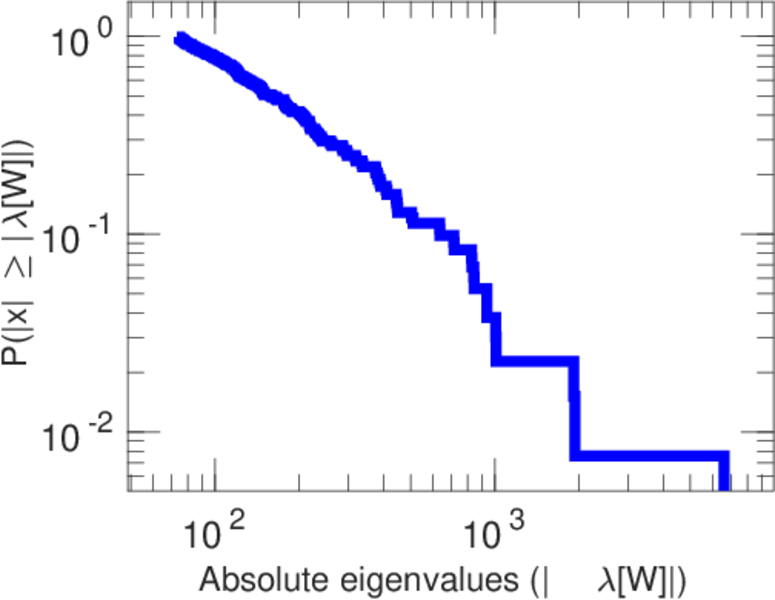
| Spectral norm | α = | 526.348
|
| Algebraic connectivity | a = | 0.051 608 7
|
| Spectral separation | |λ1[A] / λ2[A]| = | 2.074 77
|
| Controllability | C = | 4,430
|
| Relative controllability | Cr = | 0.678 200
|
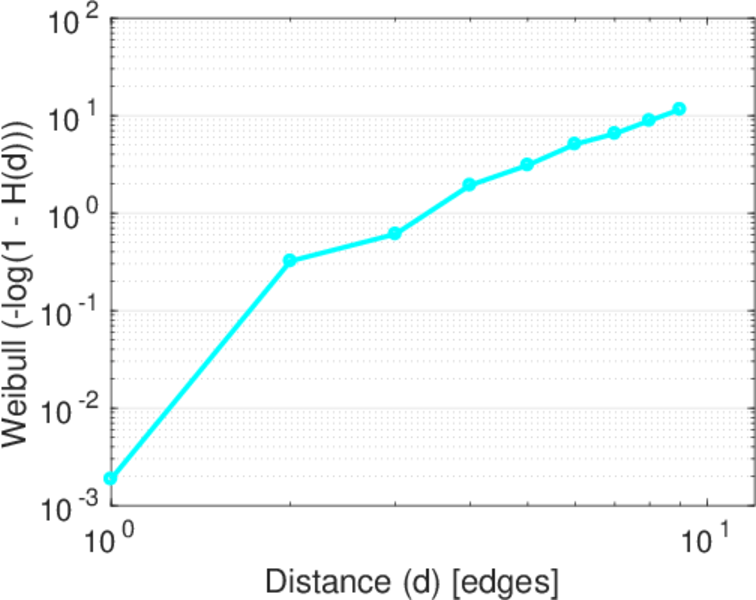
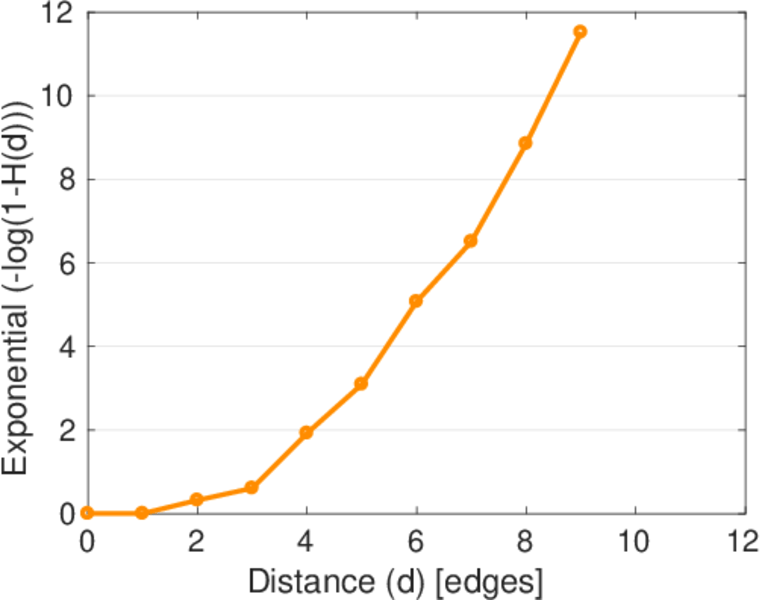
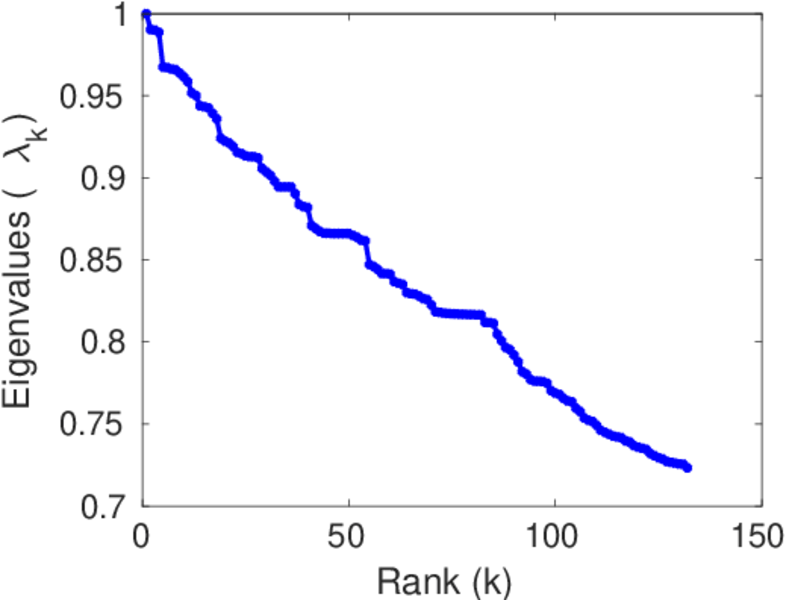
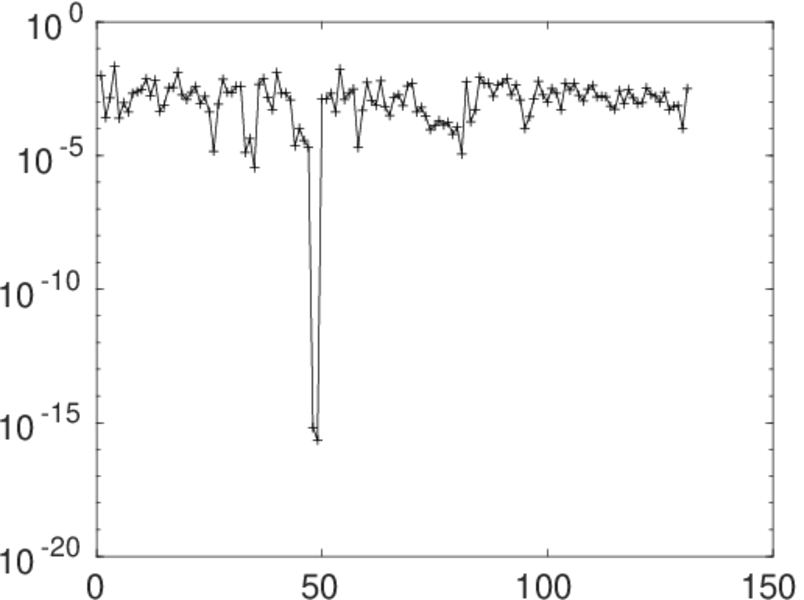
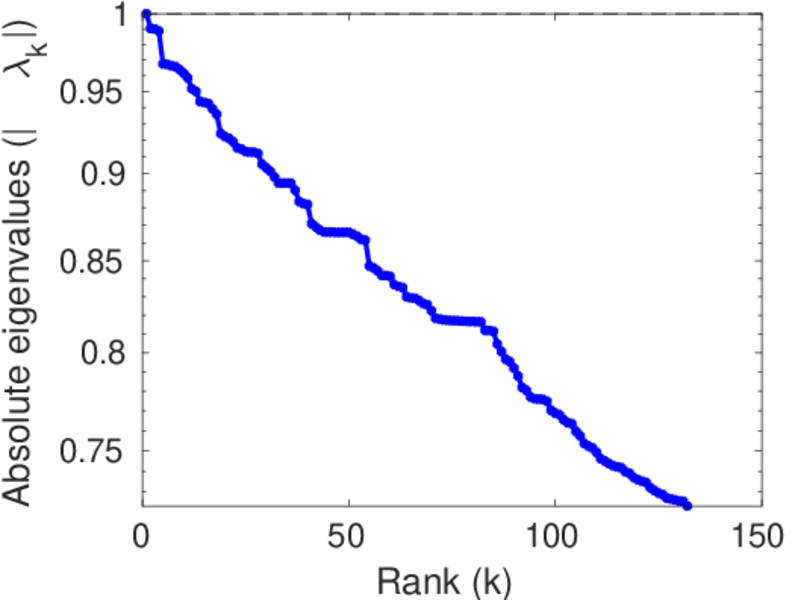
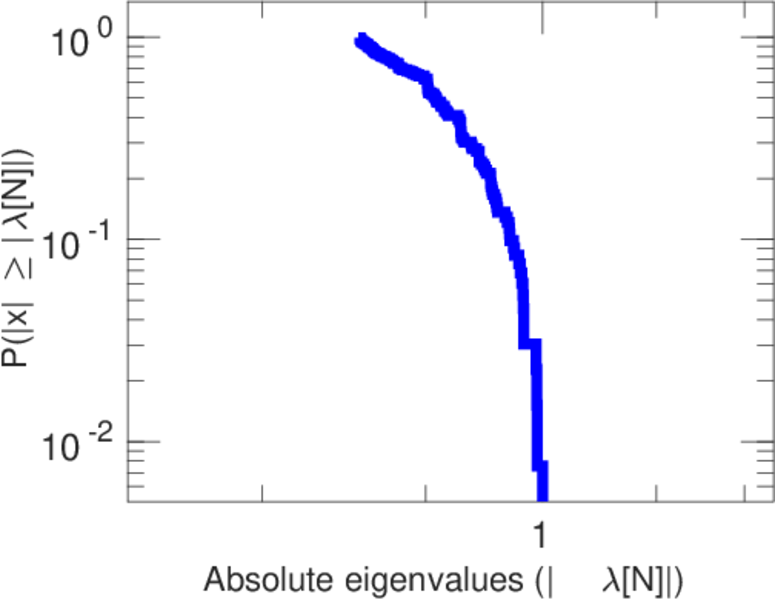
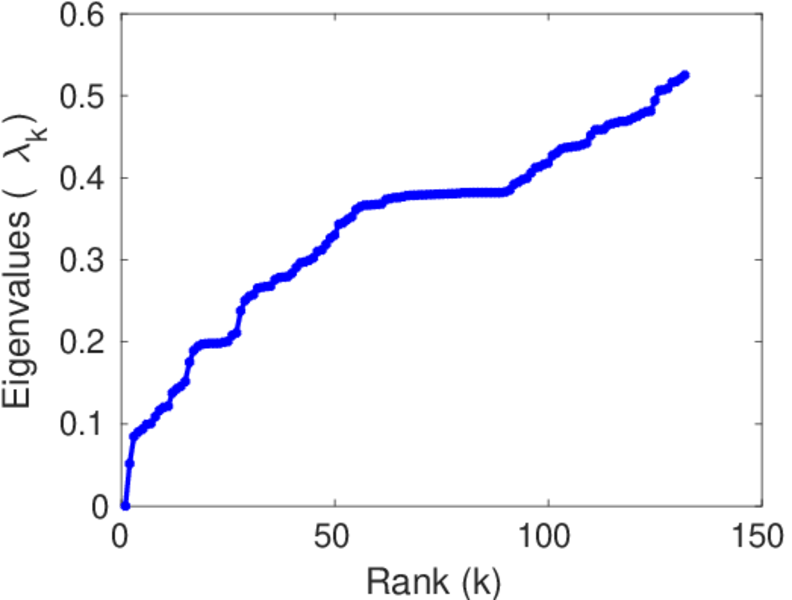
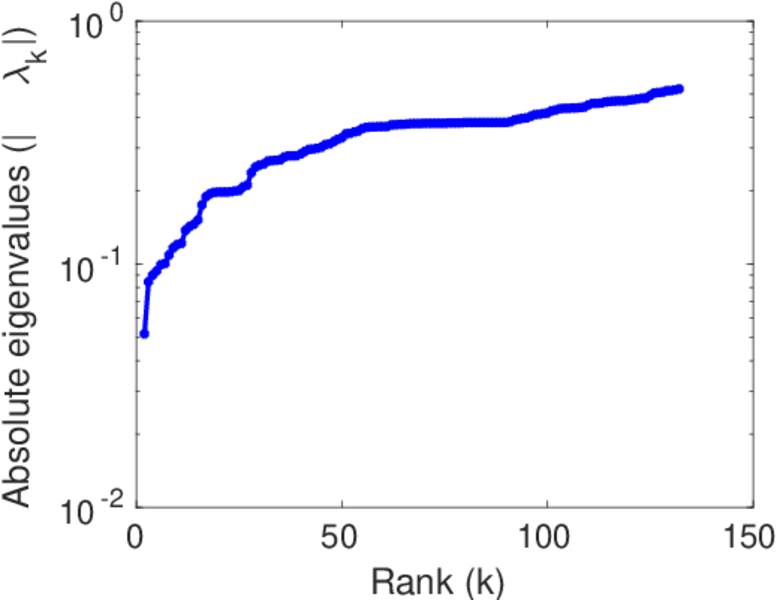
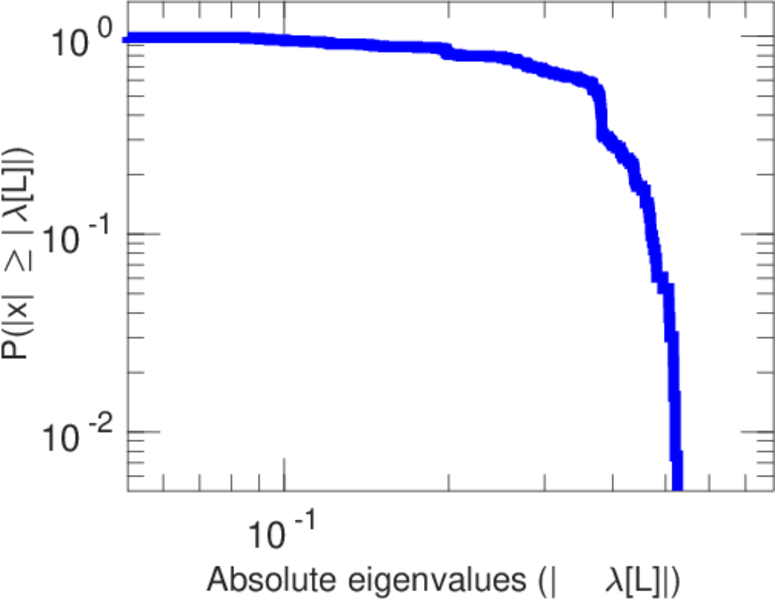
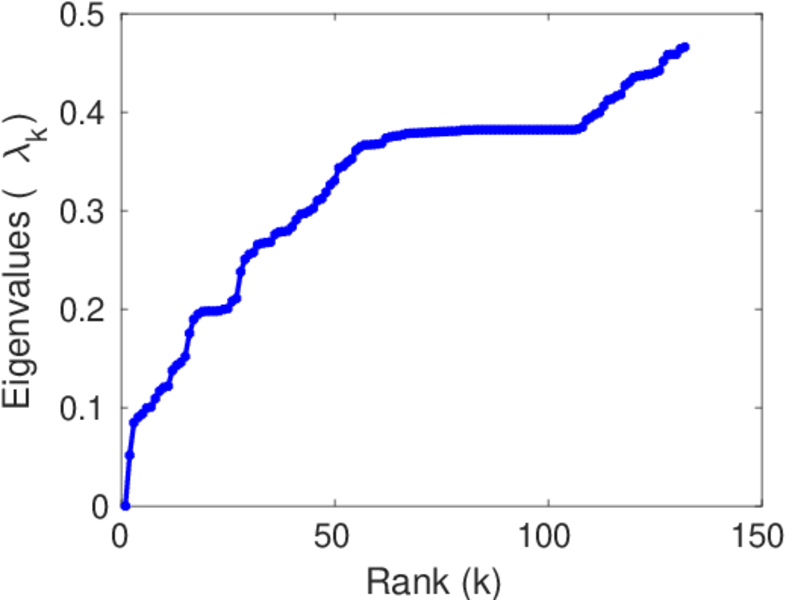
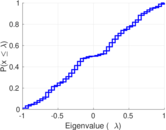
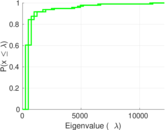
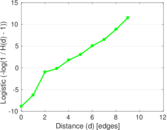
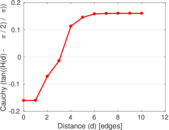
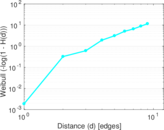
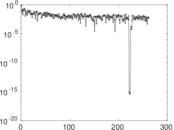
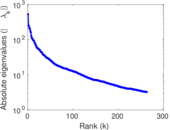
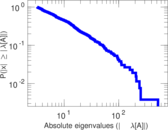
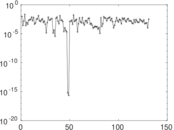
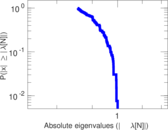
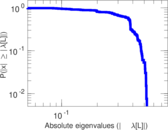
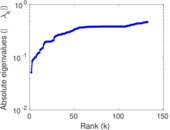
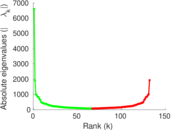
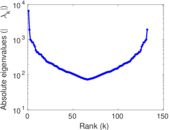
Plots


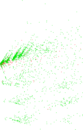

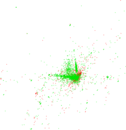


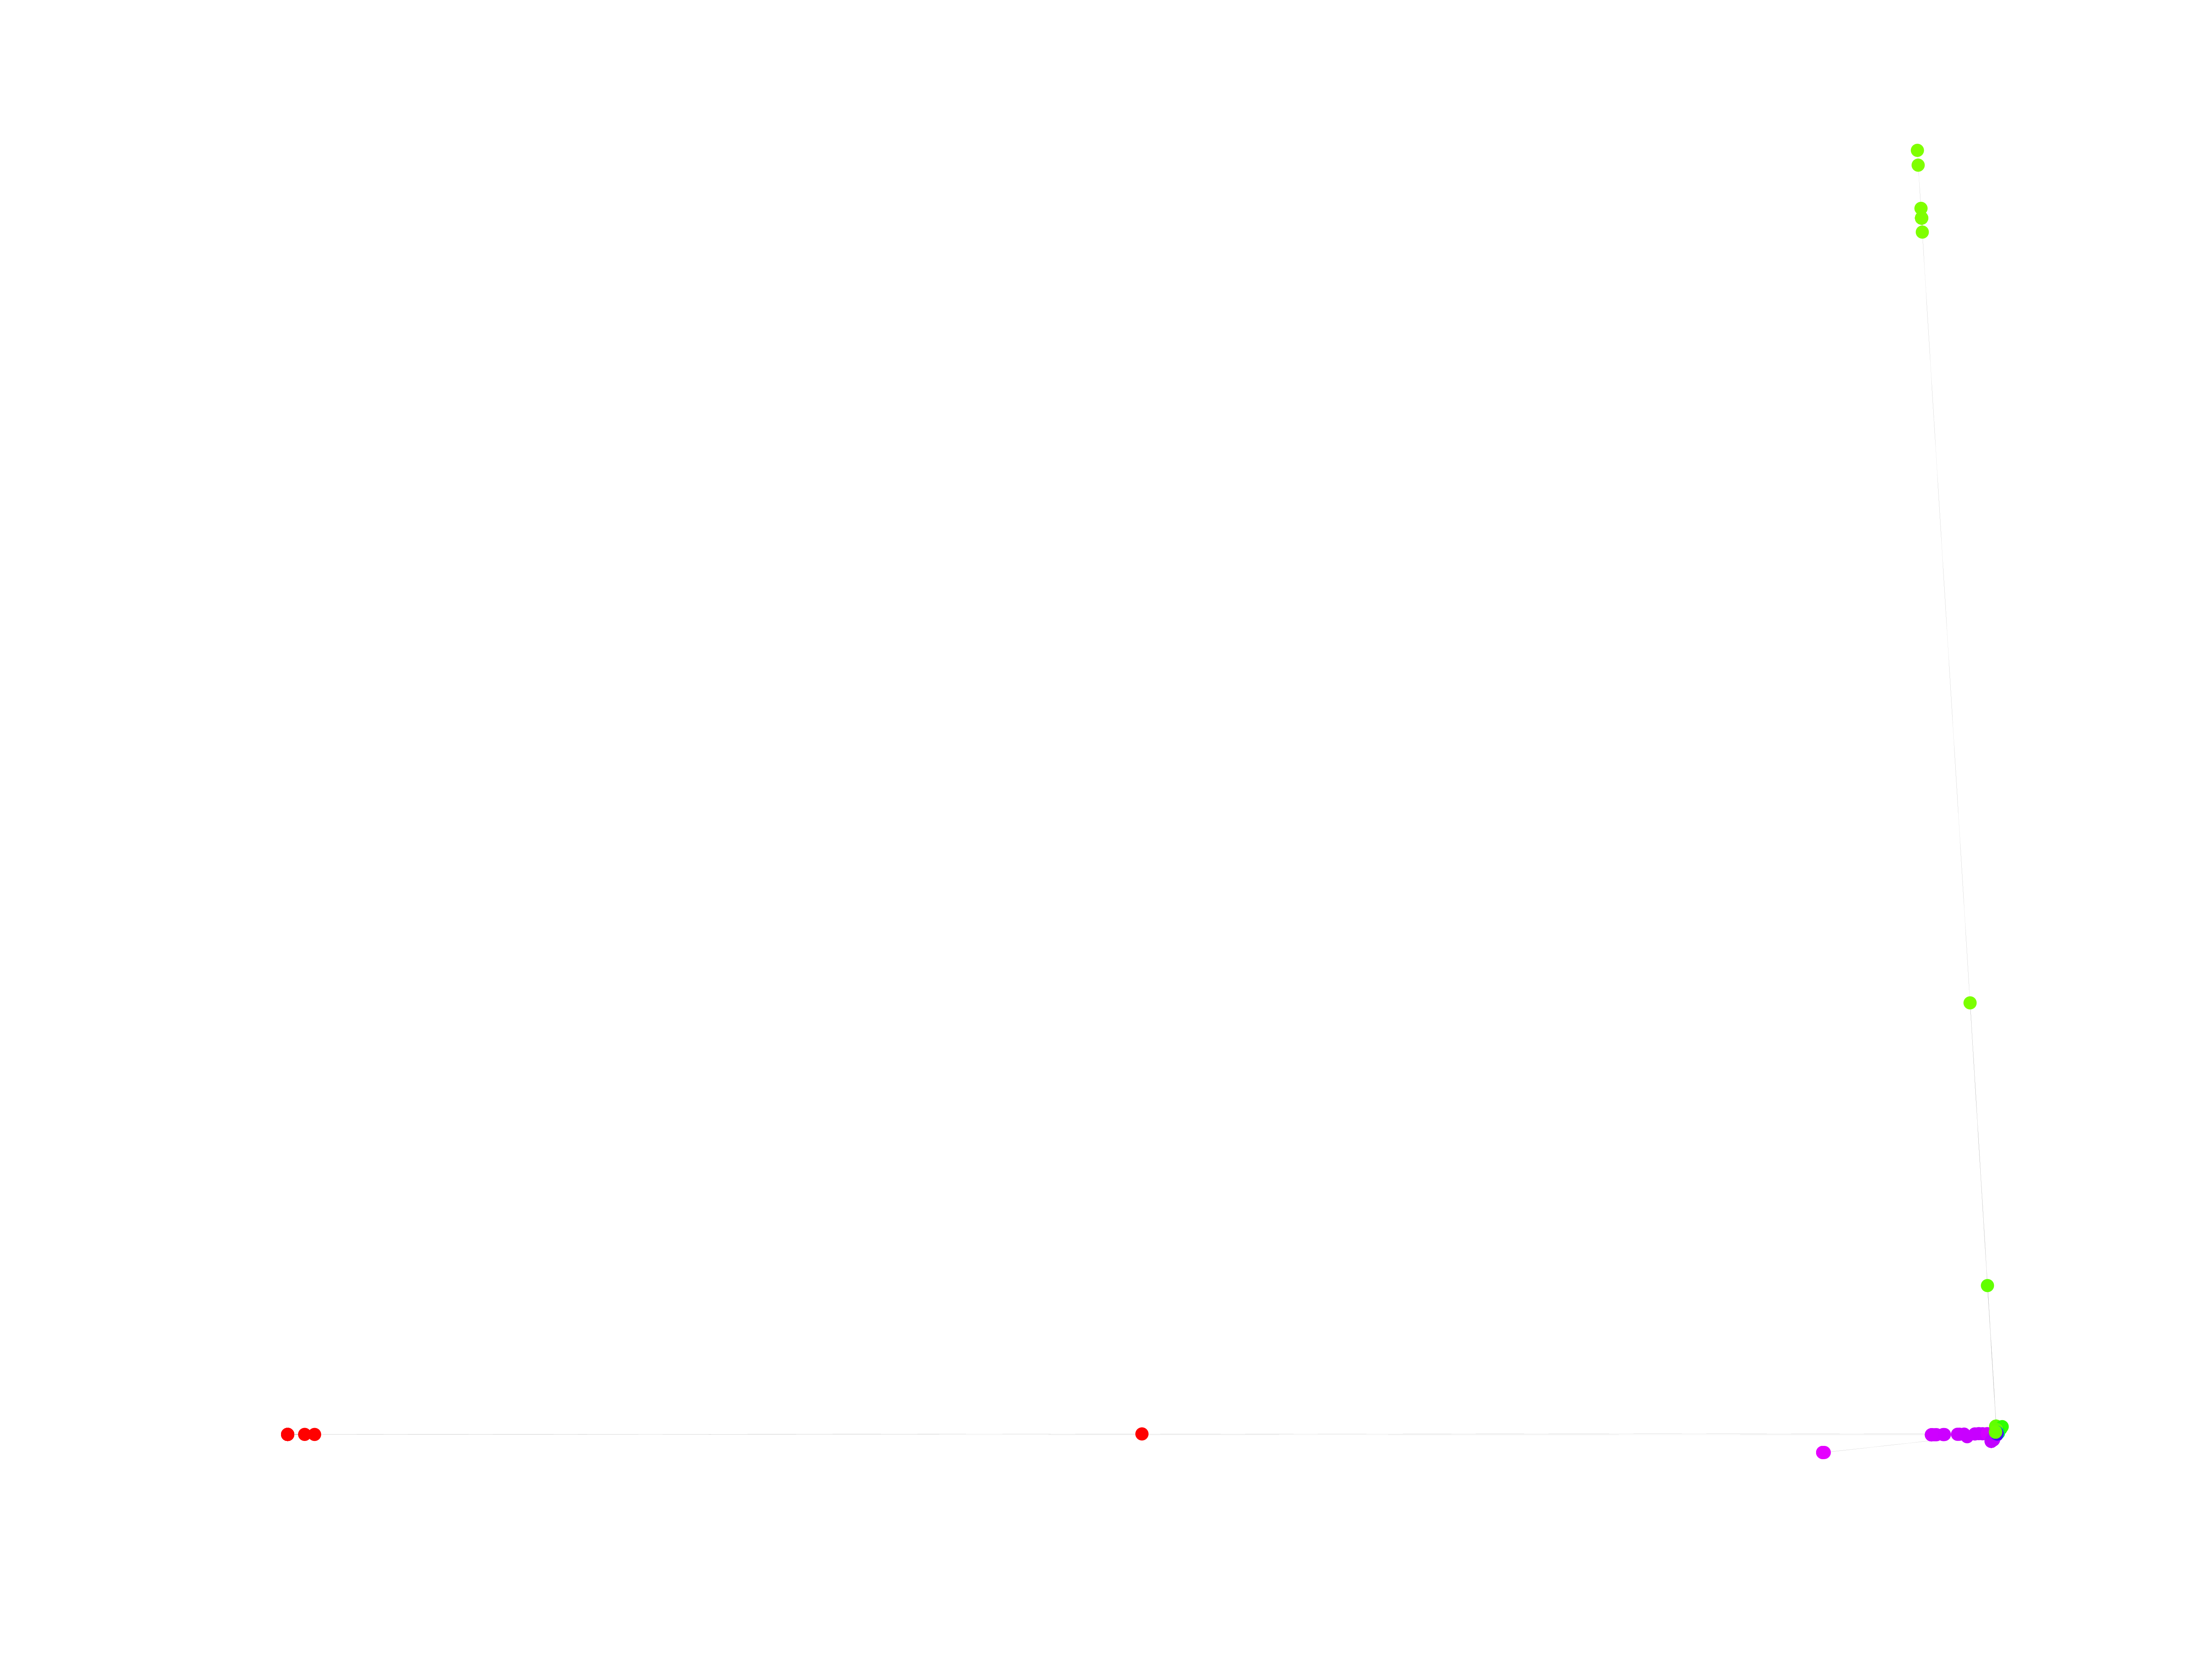
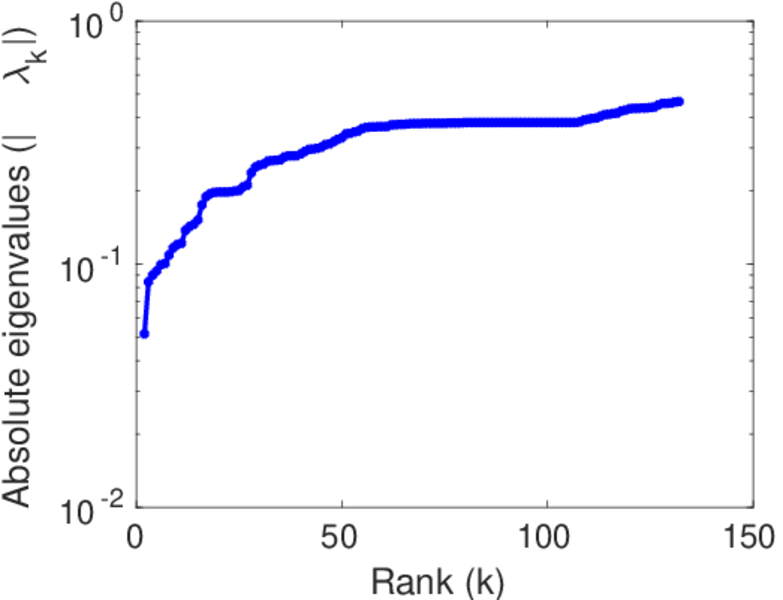
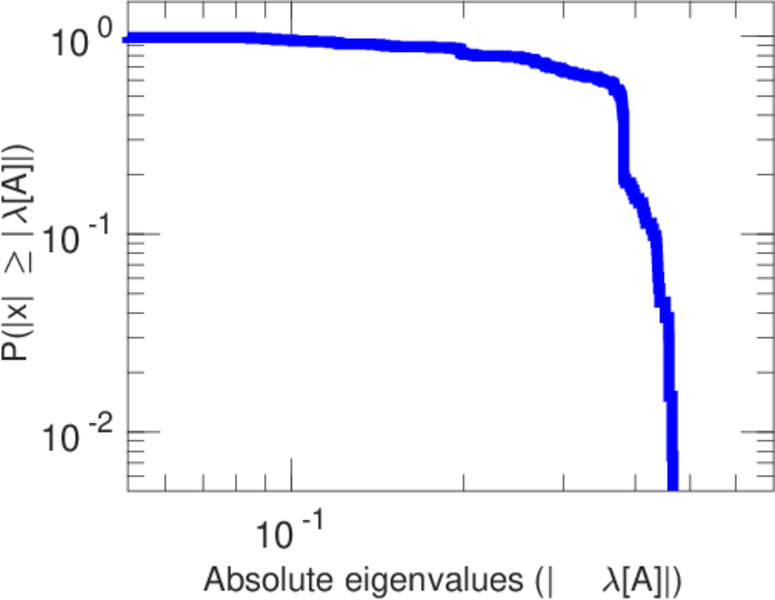
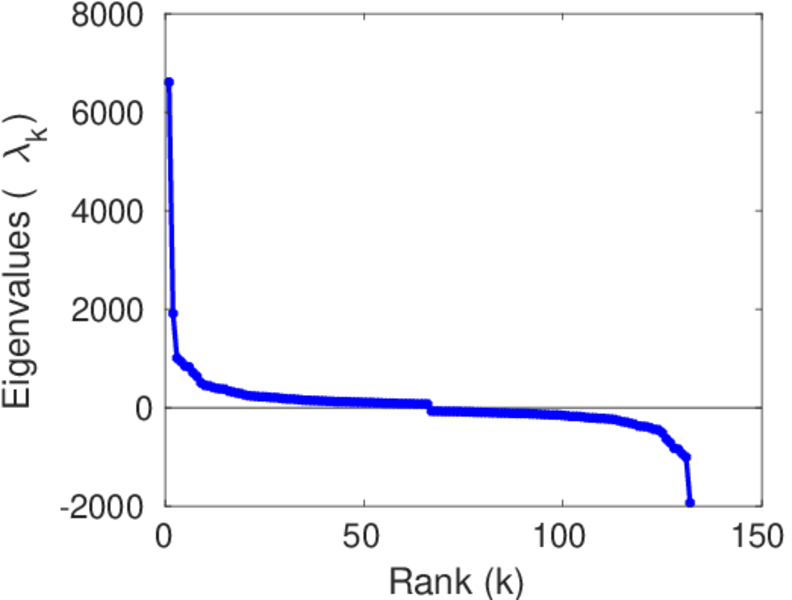
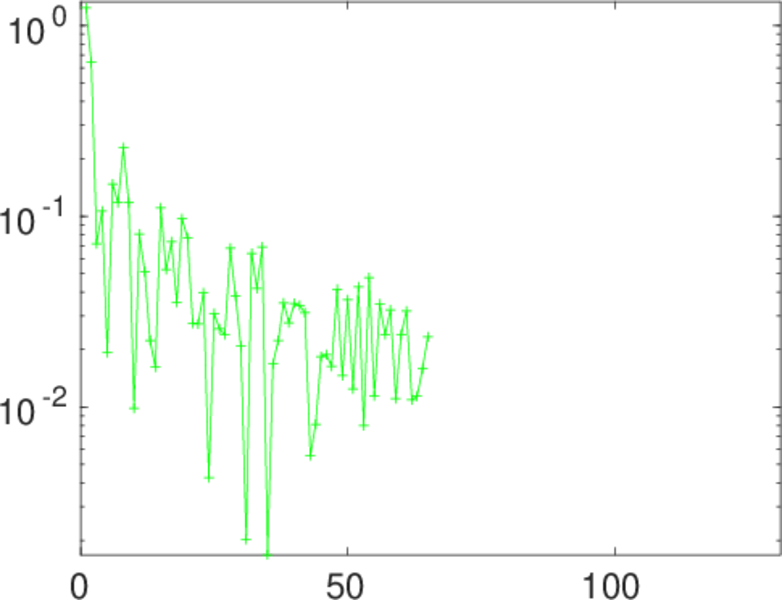
Matrix decompositions plots


Downloads
References
|
[1]
|
Jérôme Kunegis.
KONECT – The Koblenz Network Collection.
In Proc. Int. Conf. on World Wide Web Companion, pages
1343–1350, 2013.
[ http ]
|
|
[2]
|
Wikimedia Foundation.
Wikimedia downloads.
http://dumps.wikimedia.org/, January 2010.
|
 KONECT ‣ Networks ‣
Buy Me a Coffee
KONECT ‣ Networks ‣
Buy Me a Coffee