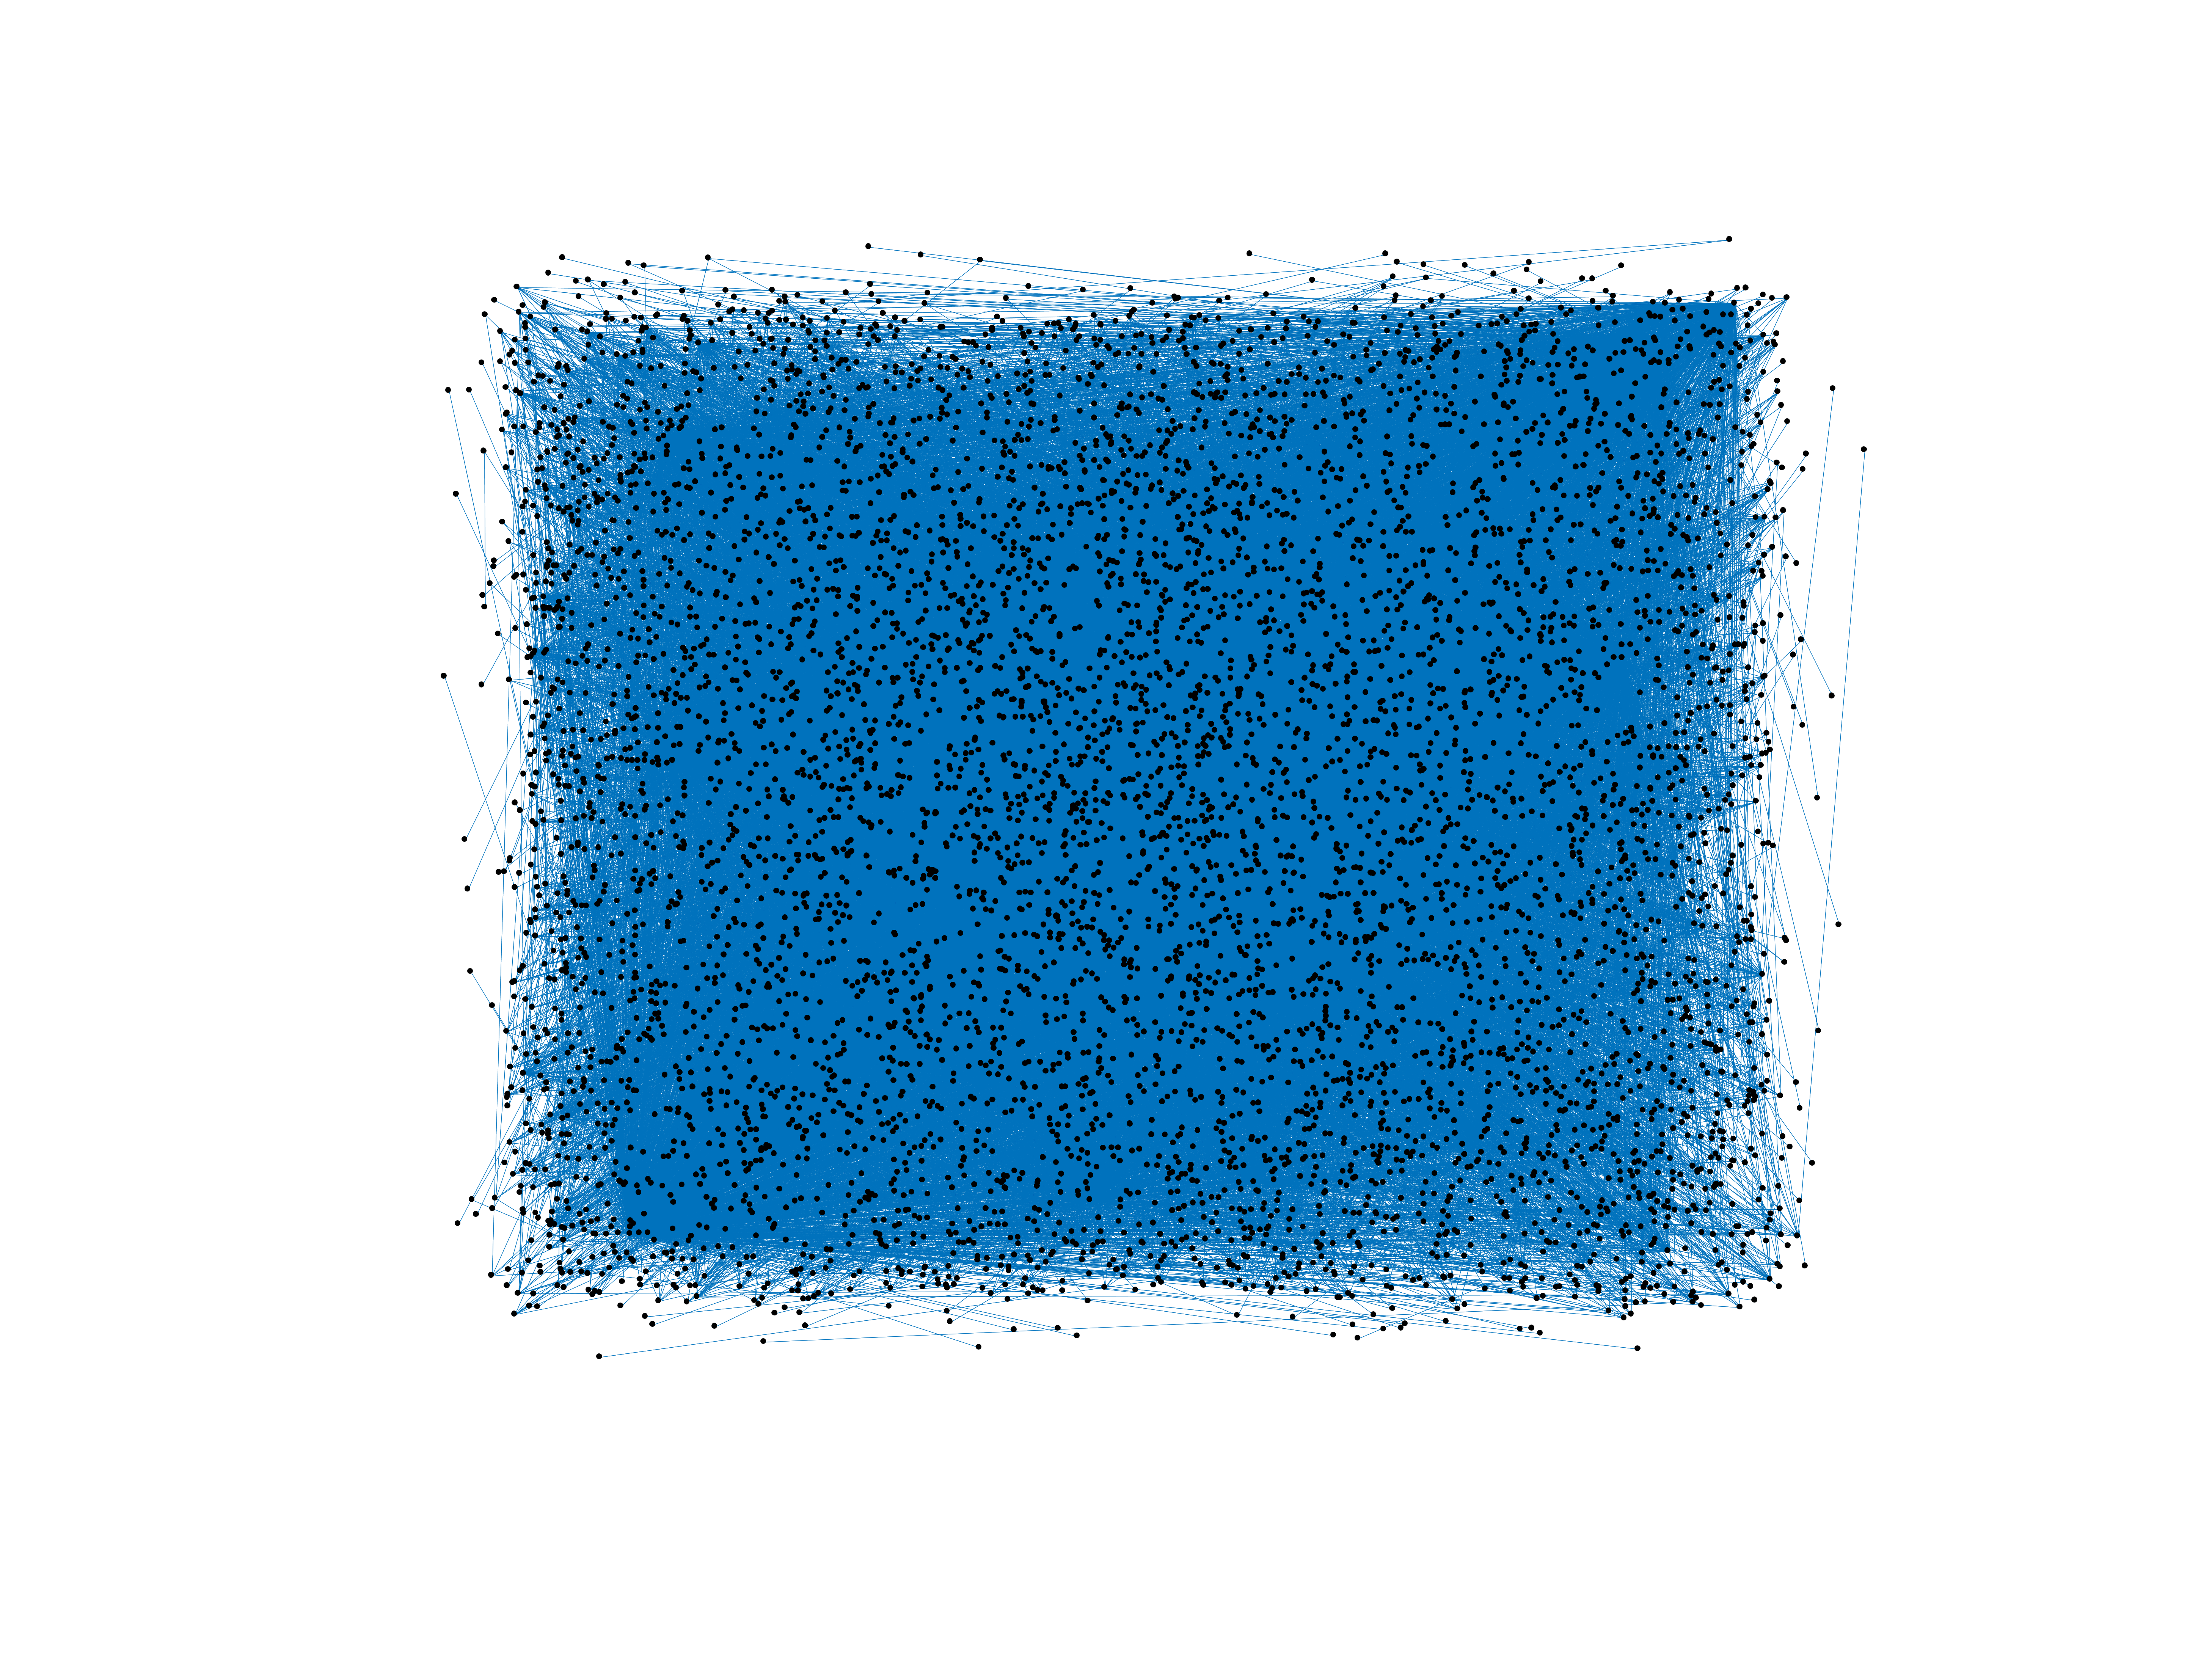
Wikipedia edits (pfl)
This is the bipartite edit network of the Palatine German Wikipedia. It
contains users and pages from the Palatine German Wikipedia, connected by edit
events. Each edge represents an edit. The dataset includes the timestamp of
each edit.
Metadata
Statistics
| Size | n = | 6,754
|
| Left size | n1 = | 1,511
|
| Right size | n2 = | 5,243
|
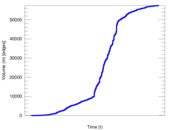
| Volume | m = | 57,473
|
| Unique edge count | m̿ = | 25,703
|
| Wedge count | s = | 10,551,428
|
| Claw count | z = | 4,848,084,260
|
| Cross count | x = | 1,954,542,910,476
|
| Square count | q = | 14,454,132
|
| 4-Tour count | T4 = | 157,922,586
|
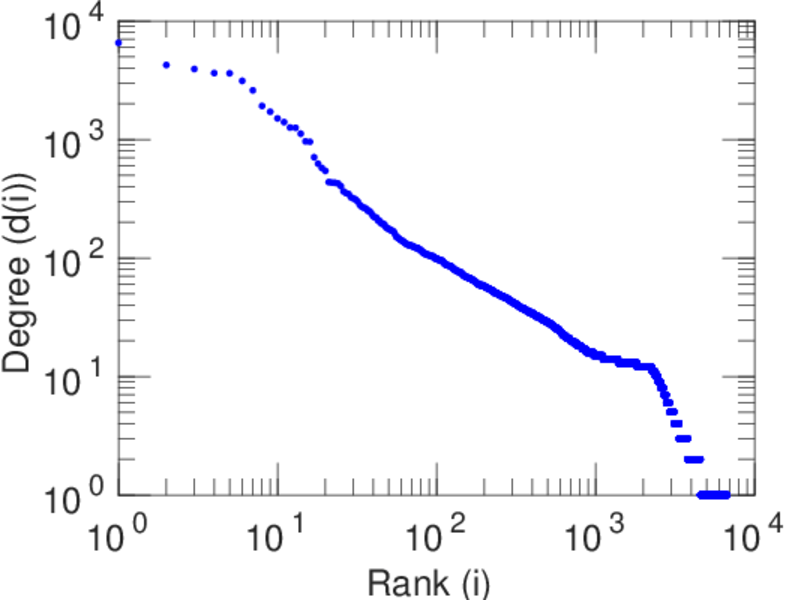
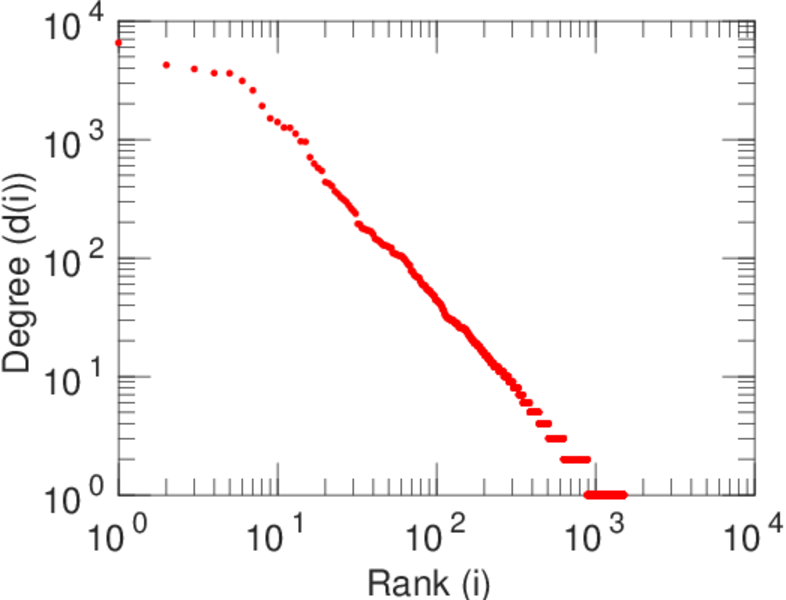
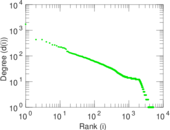
| Maximum degree | dmax = | 6,543
|
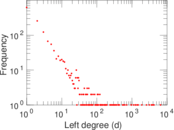
| Maximum left degree | d1max = | 6,543
|
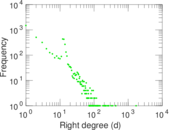
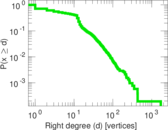
| Maximum right degree | d2max = | 1,713
|
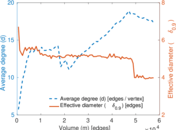
| Average degree | d = | 17.019 0
|
| Average left degree | d1 = | 38.036 4
|
| Average right degree | d2 = | 10.961 9
|
| Fill | p = | 0.003 244 44
|
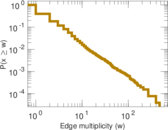
| Average edge multiplicity | m̃ = | 2.236 04
|
| Size of LCC | N = | 6,308
|
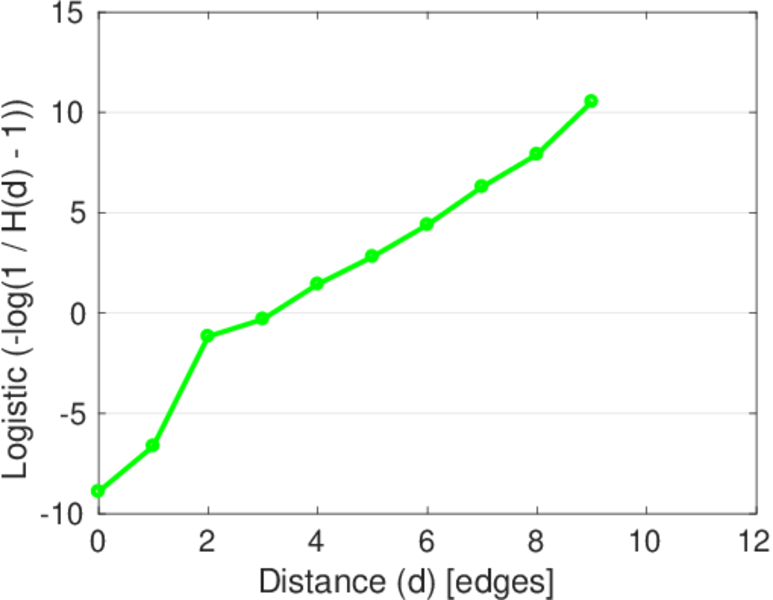
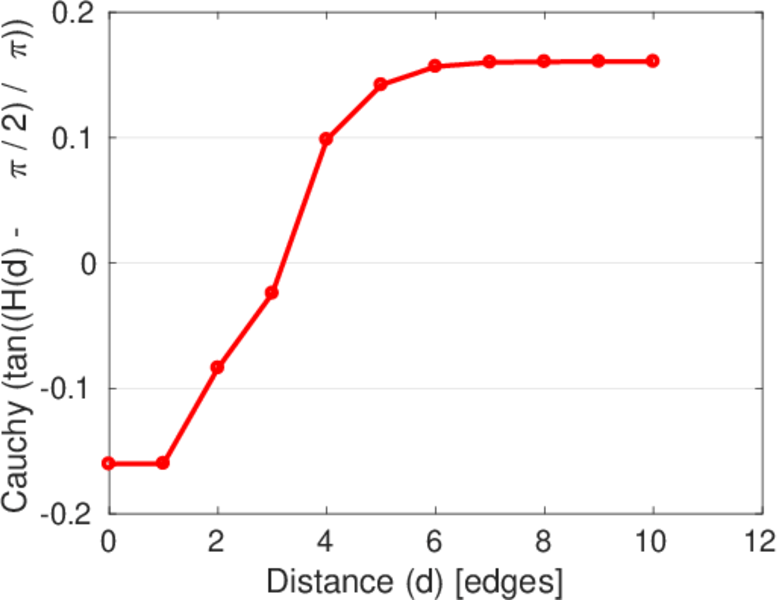
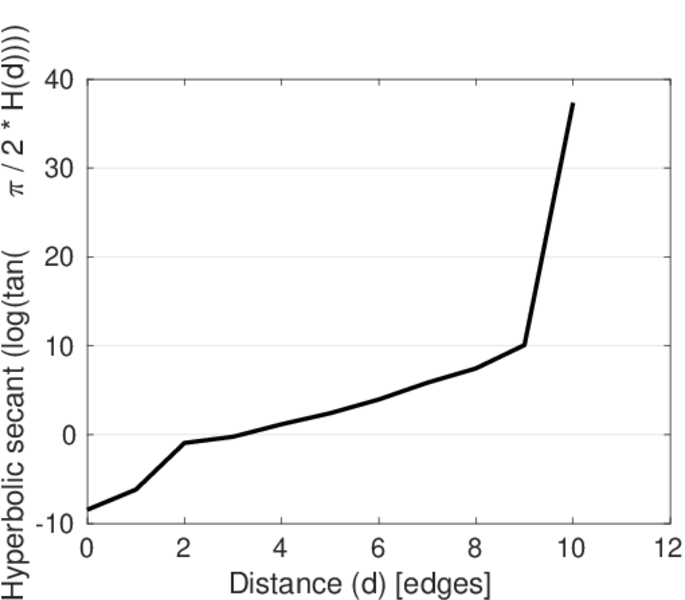
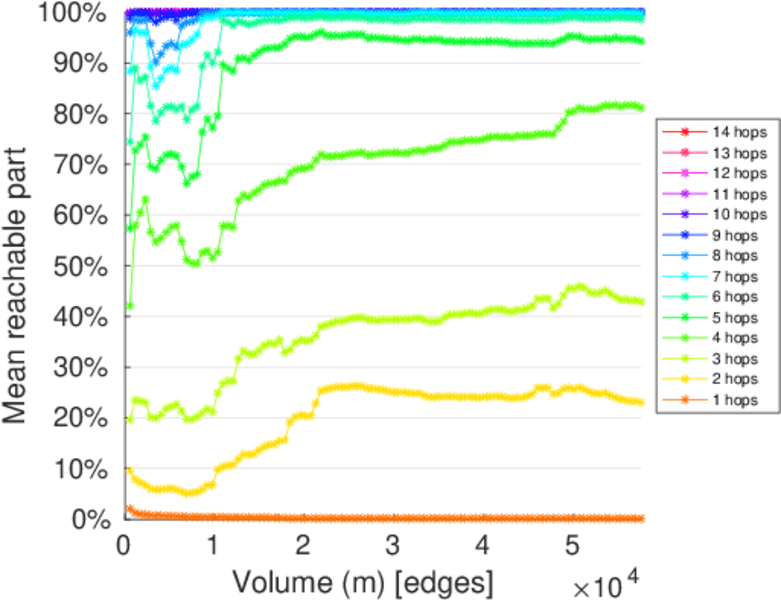
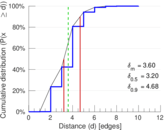
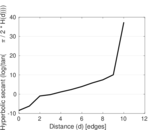
| Diameter | δ = | 12
|
| 50-Percentile effective diameter | δ0.5 = | 3.198 81
|
| 90-Percentile effective diameter | δ0.9 = | 4.682 01
|
| Median distance | δM = | 4
|
| Mean distance | δm = | 3.601 62
|
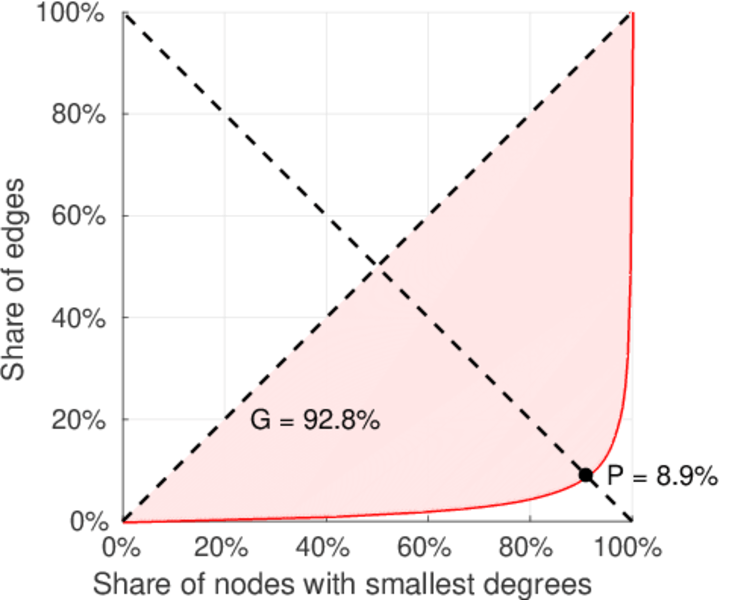
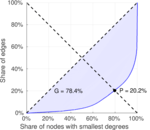
| Gini coefficient | G = | 0.771 957
|
| Balanced inequality ratio | P = | 0.206 828
|
| Left balanced inequality ratio | P1 = | 0.089 311 5
|
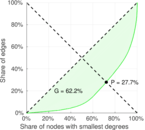
| Right balanced inequality ratio | P2 = | 0.277 261
|
| Relative edge distribution entropy | Her = | 0.790 689
|
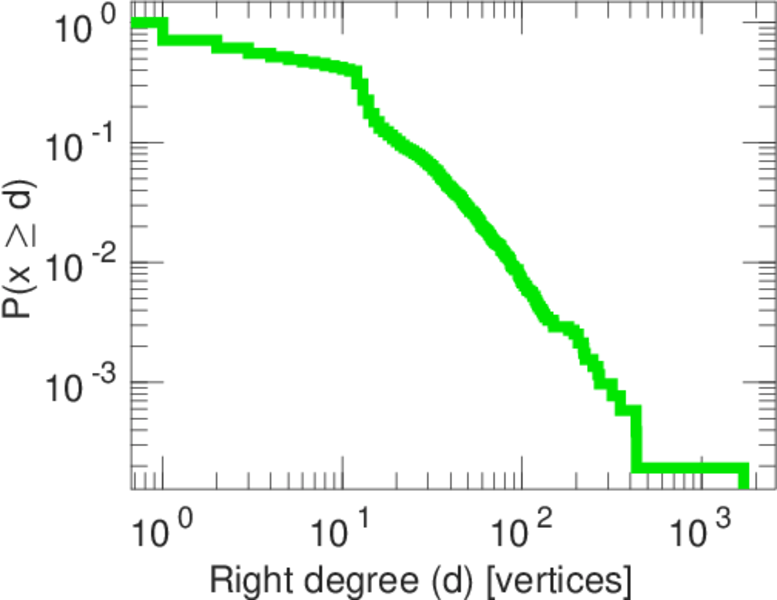
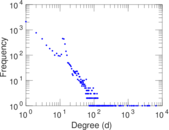
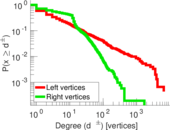
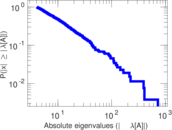
| Power law exponent | γ = | 1.971 98
|
| Tail power law exponent | γt = | 2.481 00
|
| Tail power law exponent with p | γ3 = | 2.481 00
|
| p-value | p = | 0.004 000 00
|
| Left tail power law exponent with p | γ3,1 = | 1.701 00
|
| Left p-value | p1 = | 0.713 000
|
| Right tail power law exponent with p | γ3,2 = | 4.911 00
|
| Right p-value | p2 = | 0.681 000
|
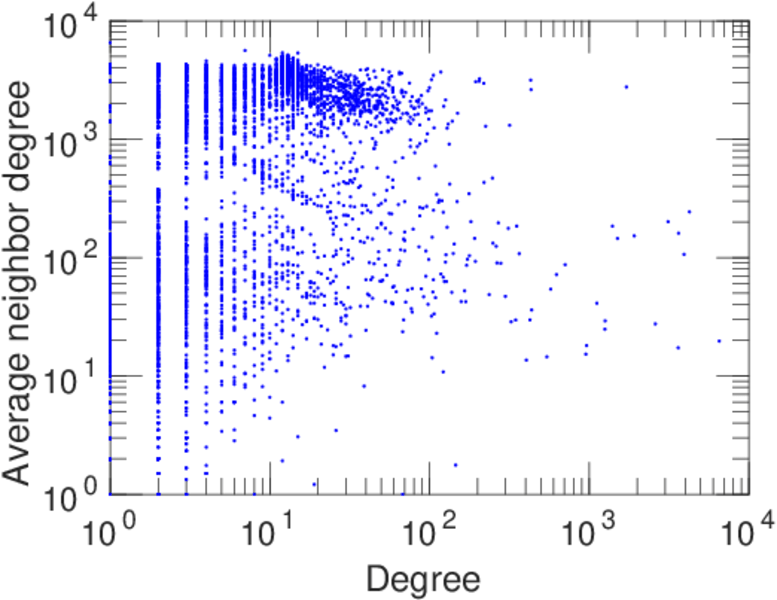
| Degree assortativity | ρ = | −0.291 113
|
| Degree assortativity p-value | pρ = | 0.000 00
|
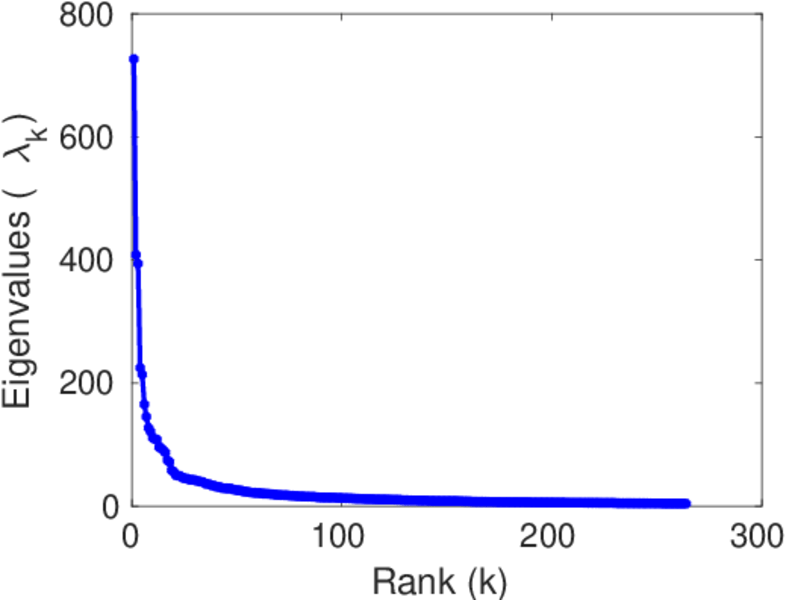
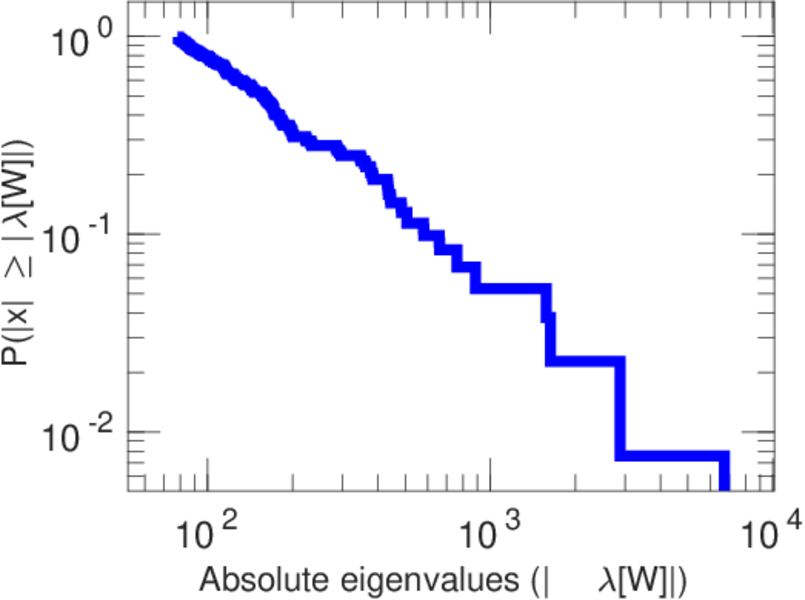
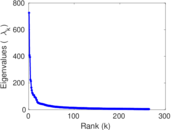
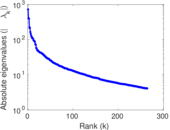
| Spectral norm | α = | 726.240
|
| Algebraic connectivity | a = | 0.023 813 3
|
| Spectral separation | |λ1[A] / λ2[A]| = | 1.778 20
|
| Controllability | C = | 4,920
|
| Relative controllability | Cr = | 0.737 410
|
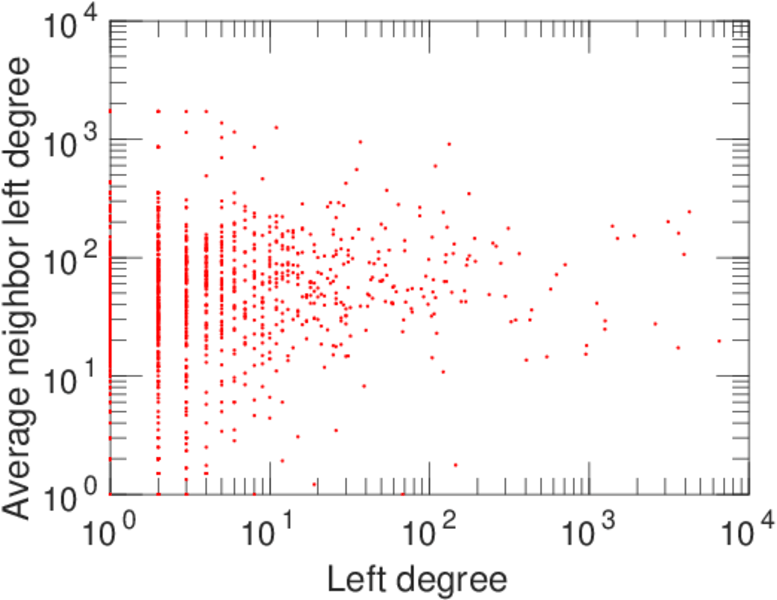
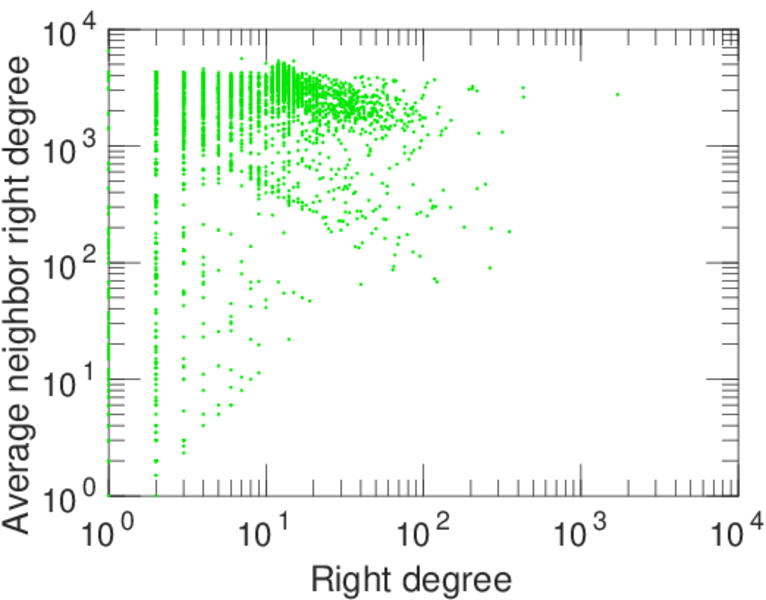
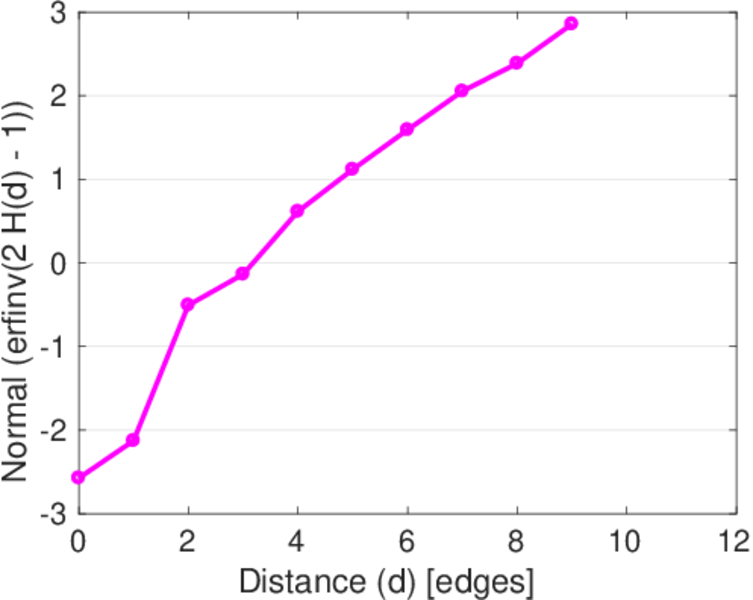
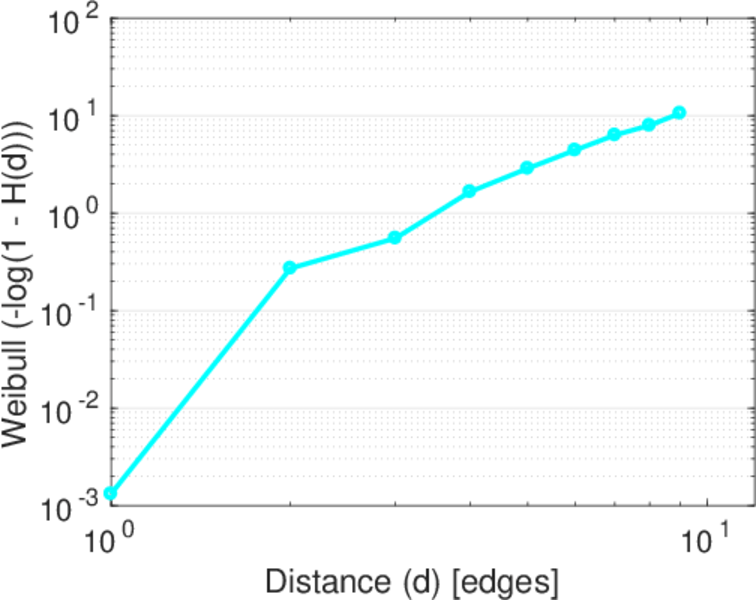
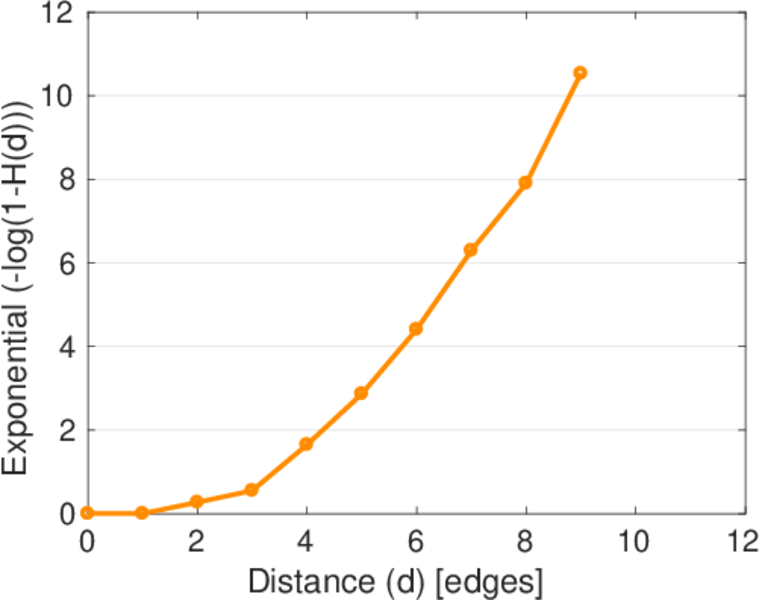
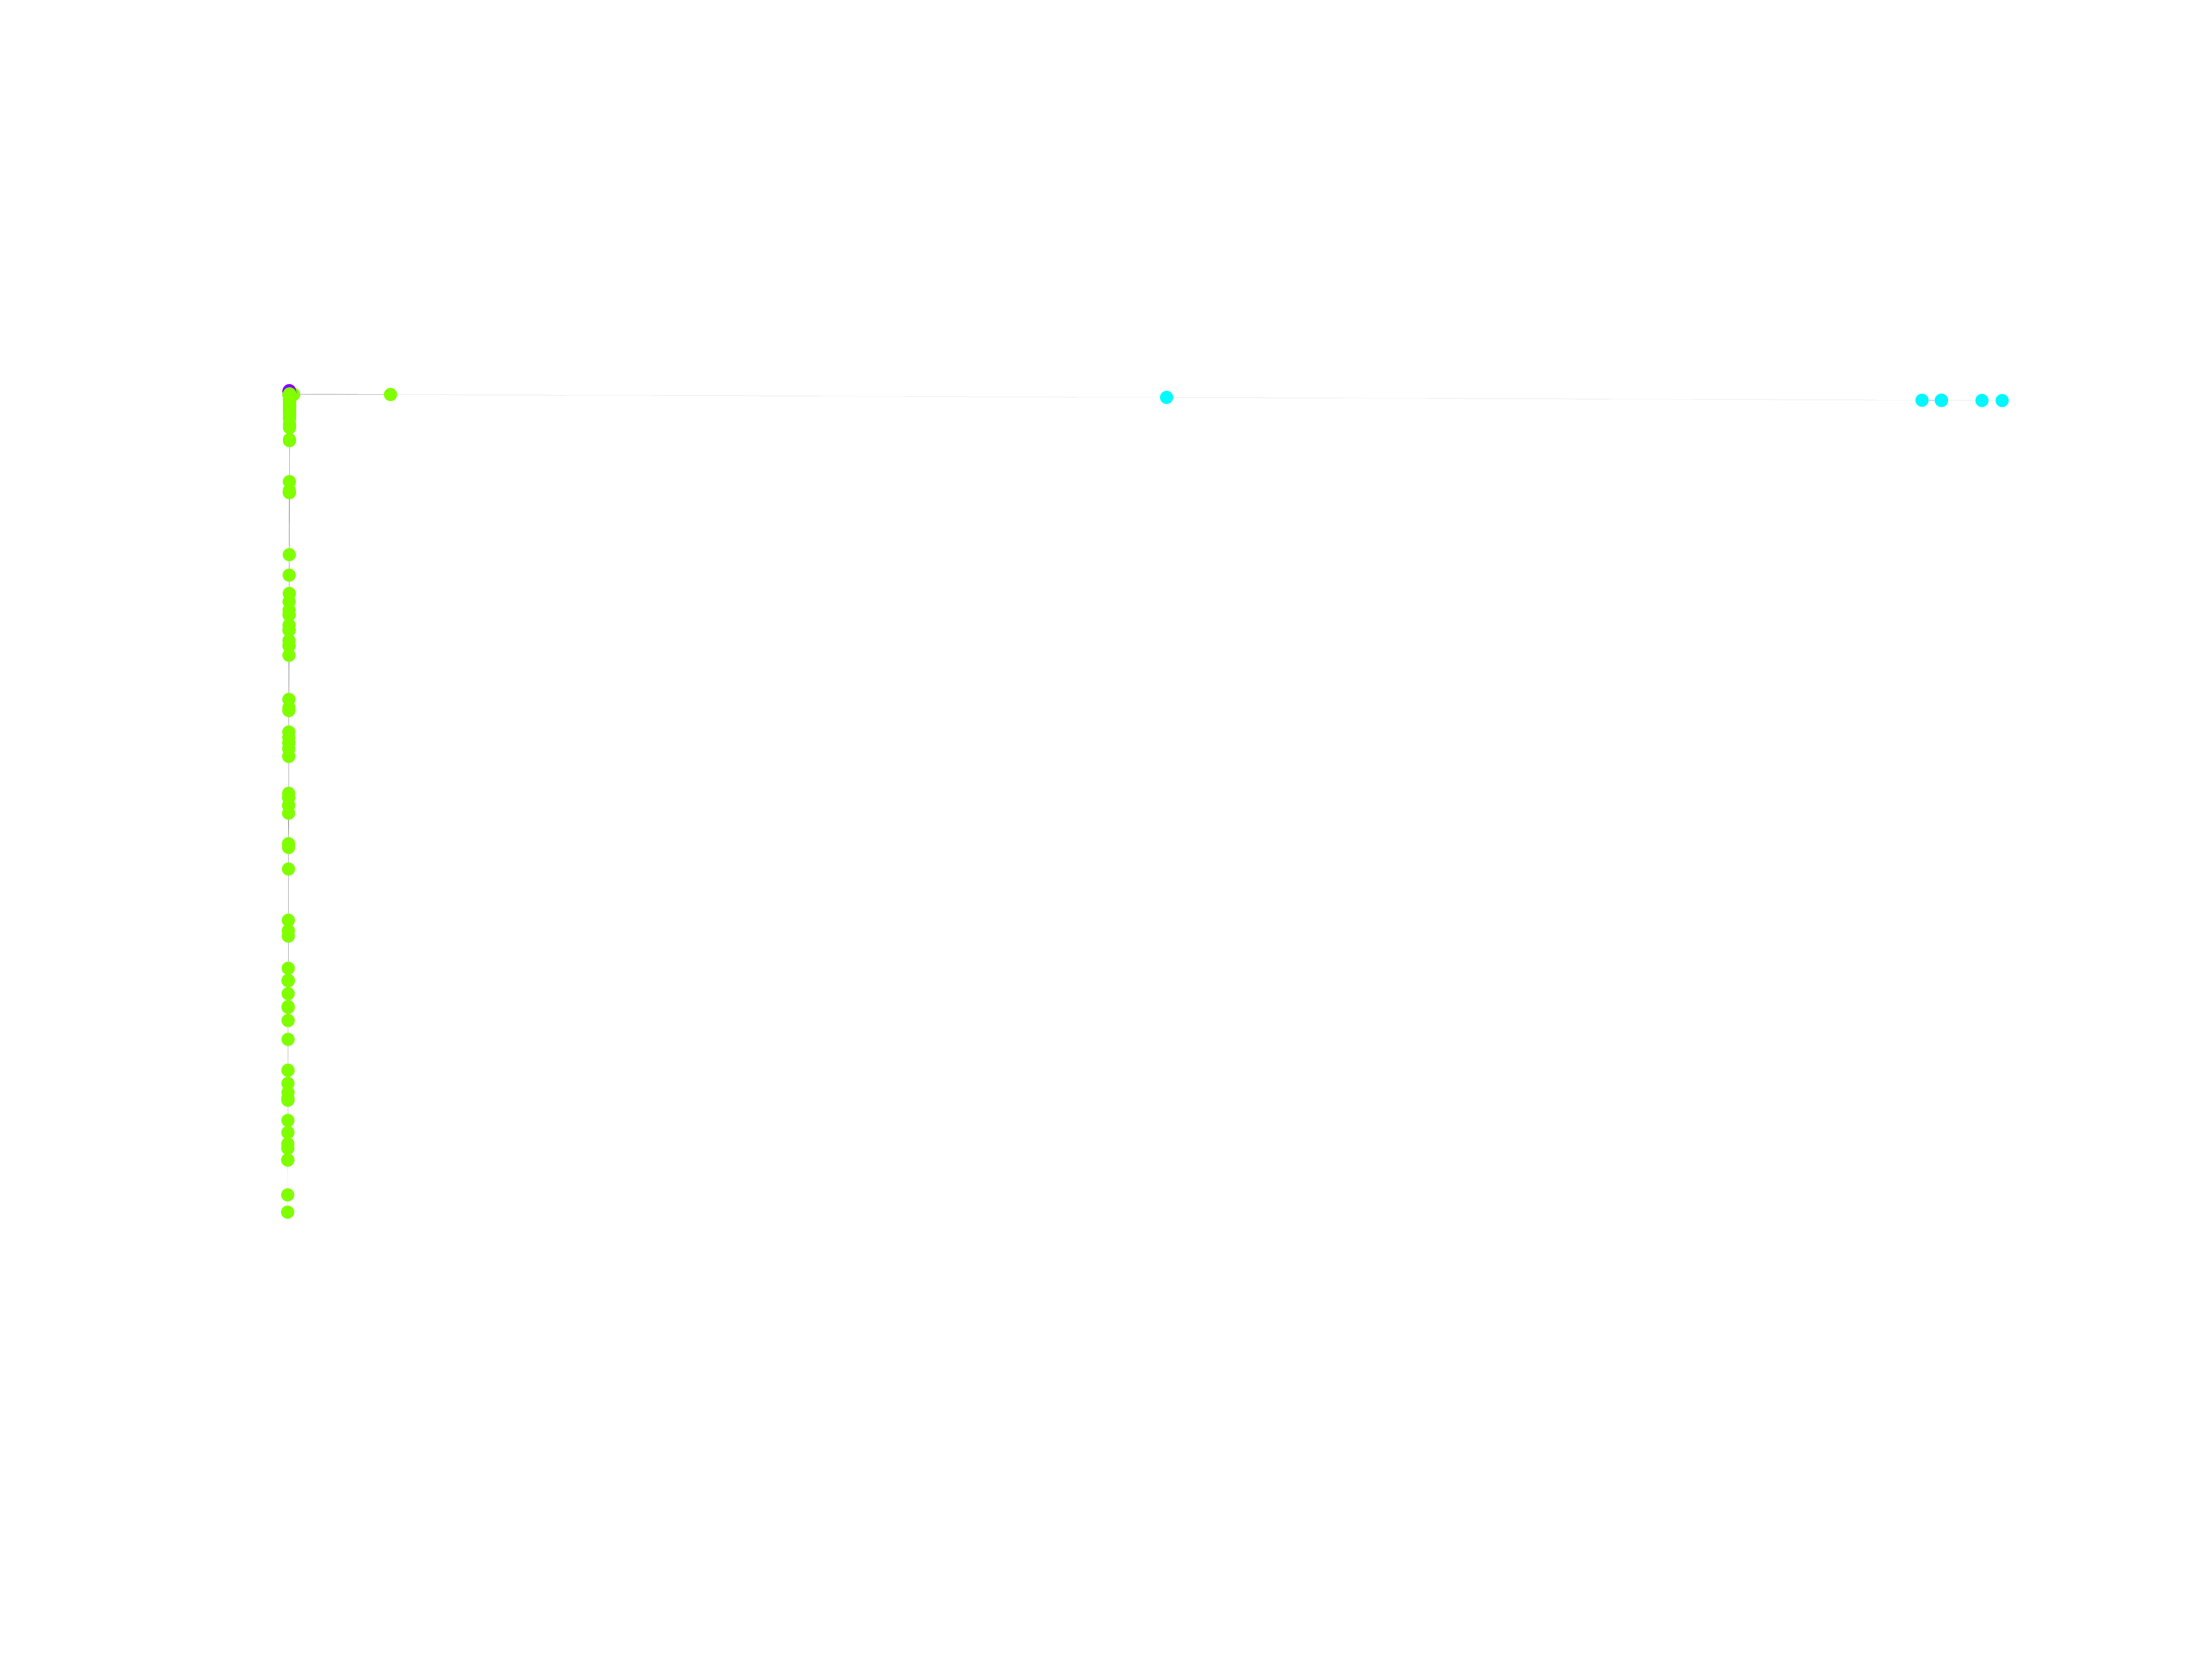
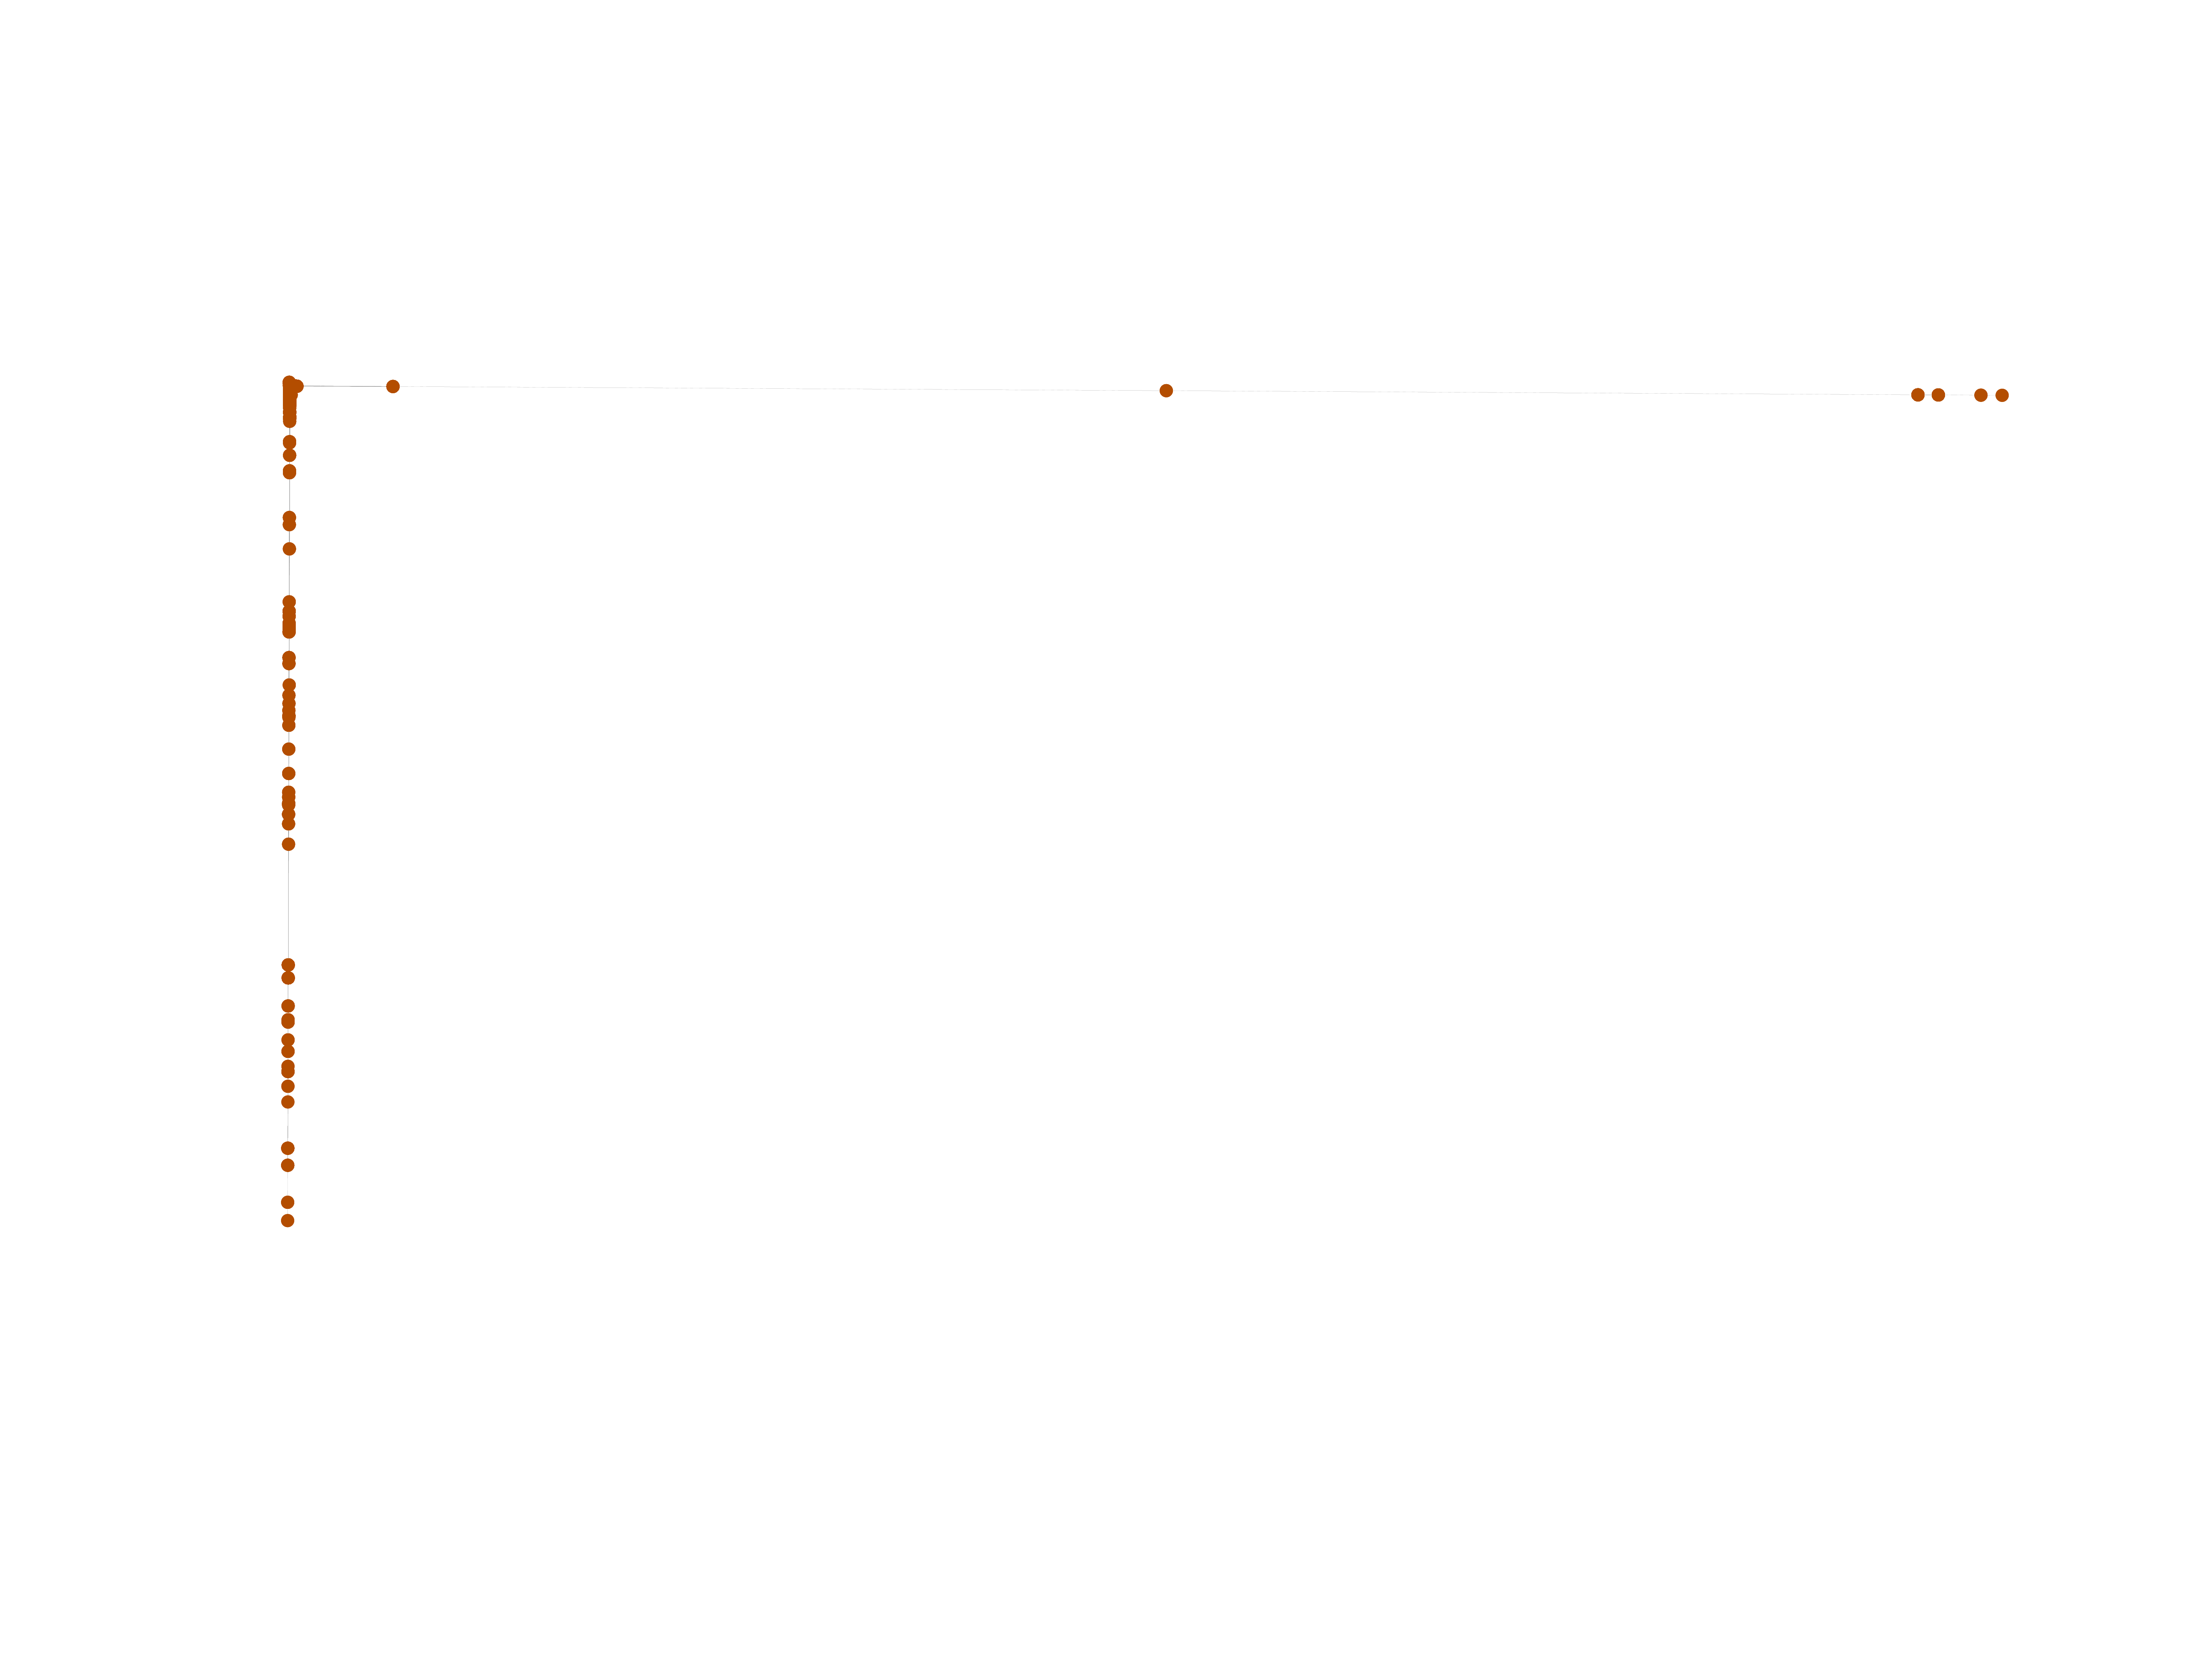
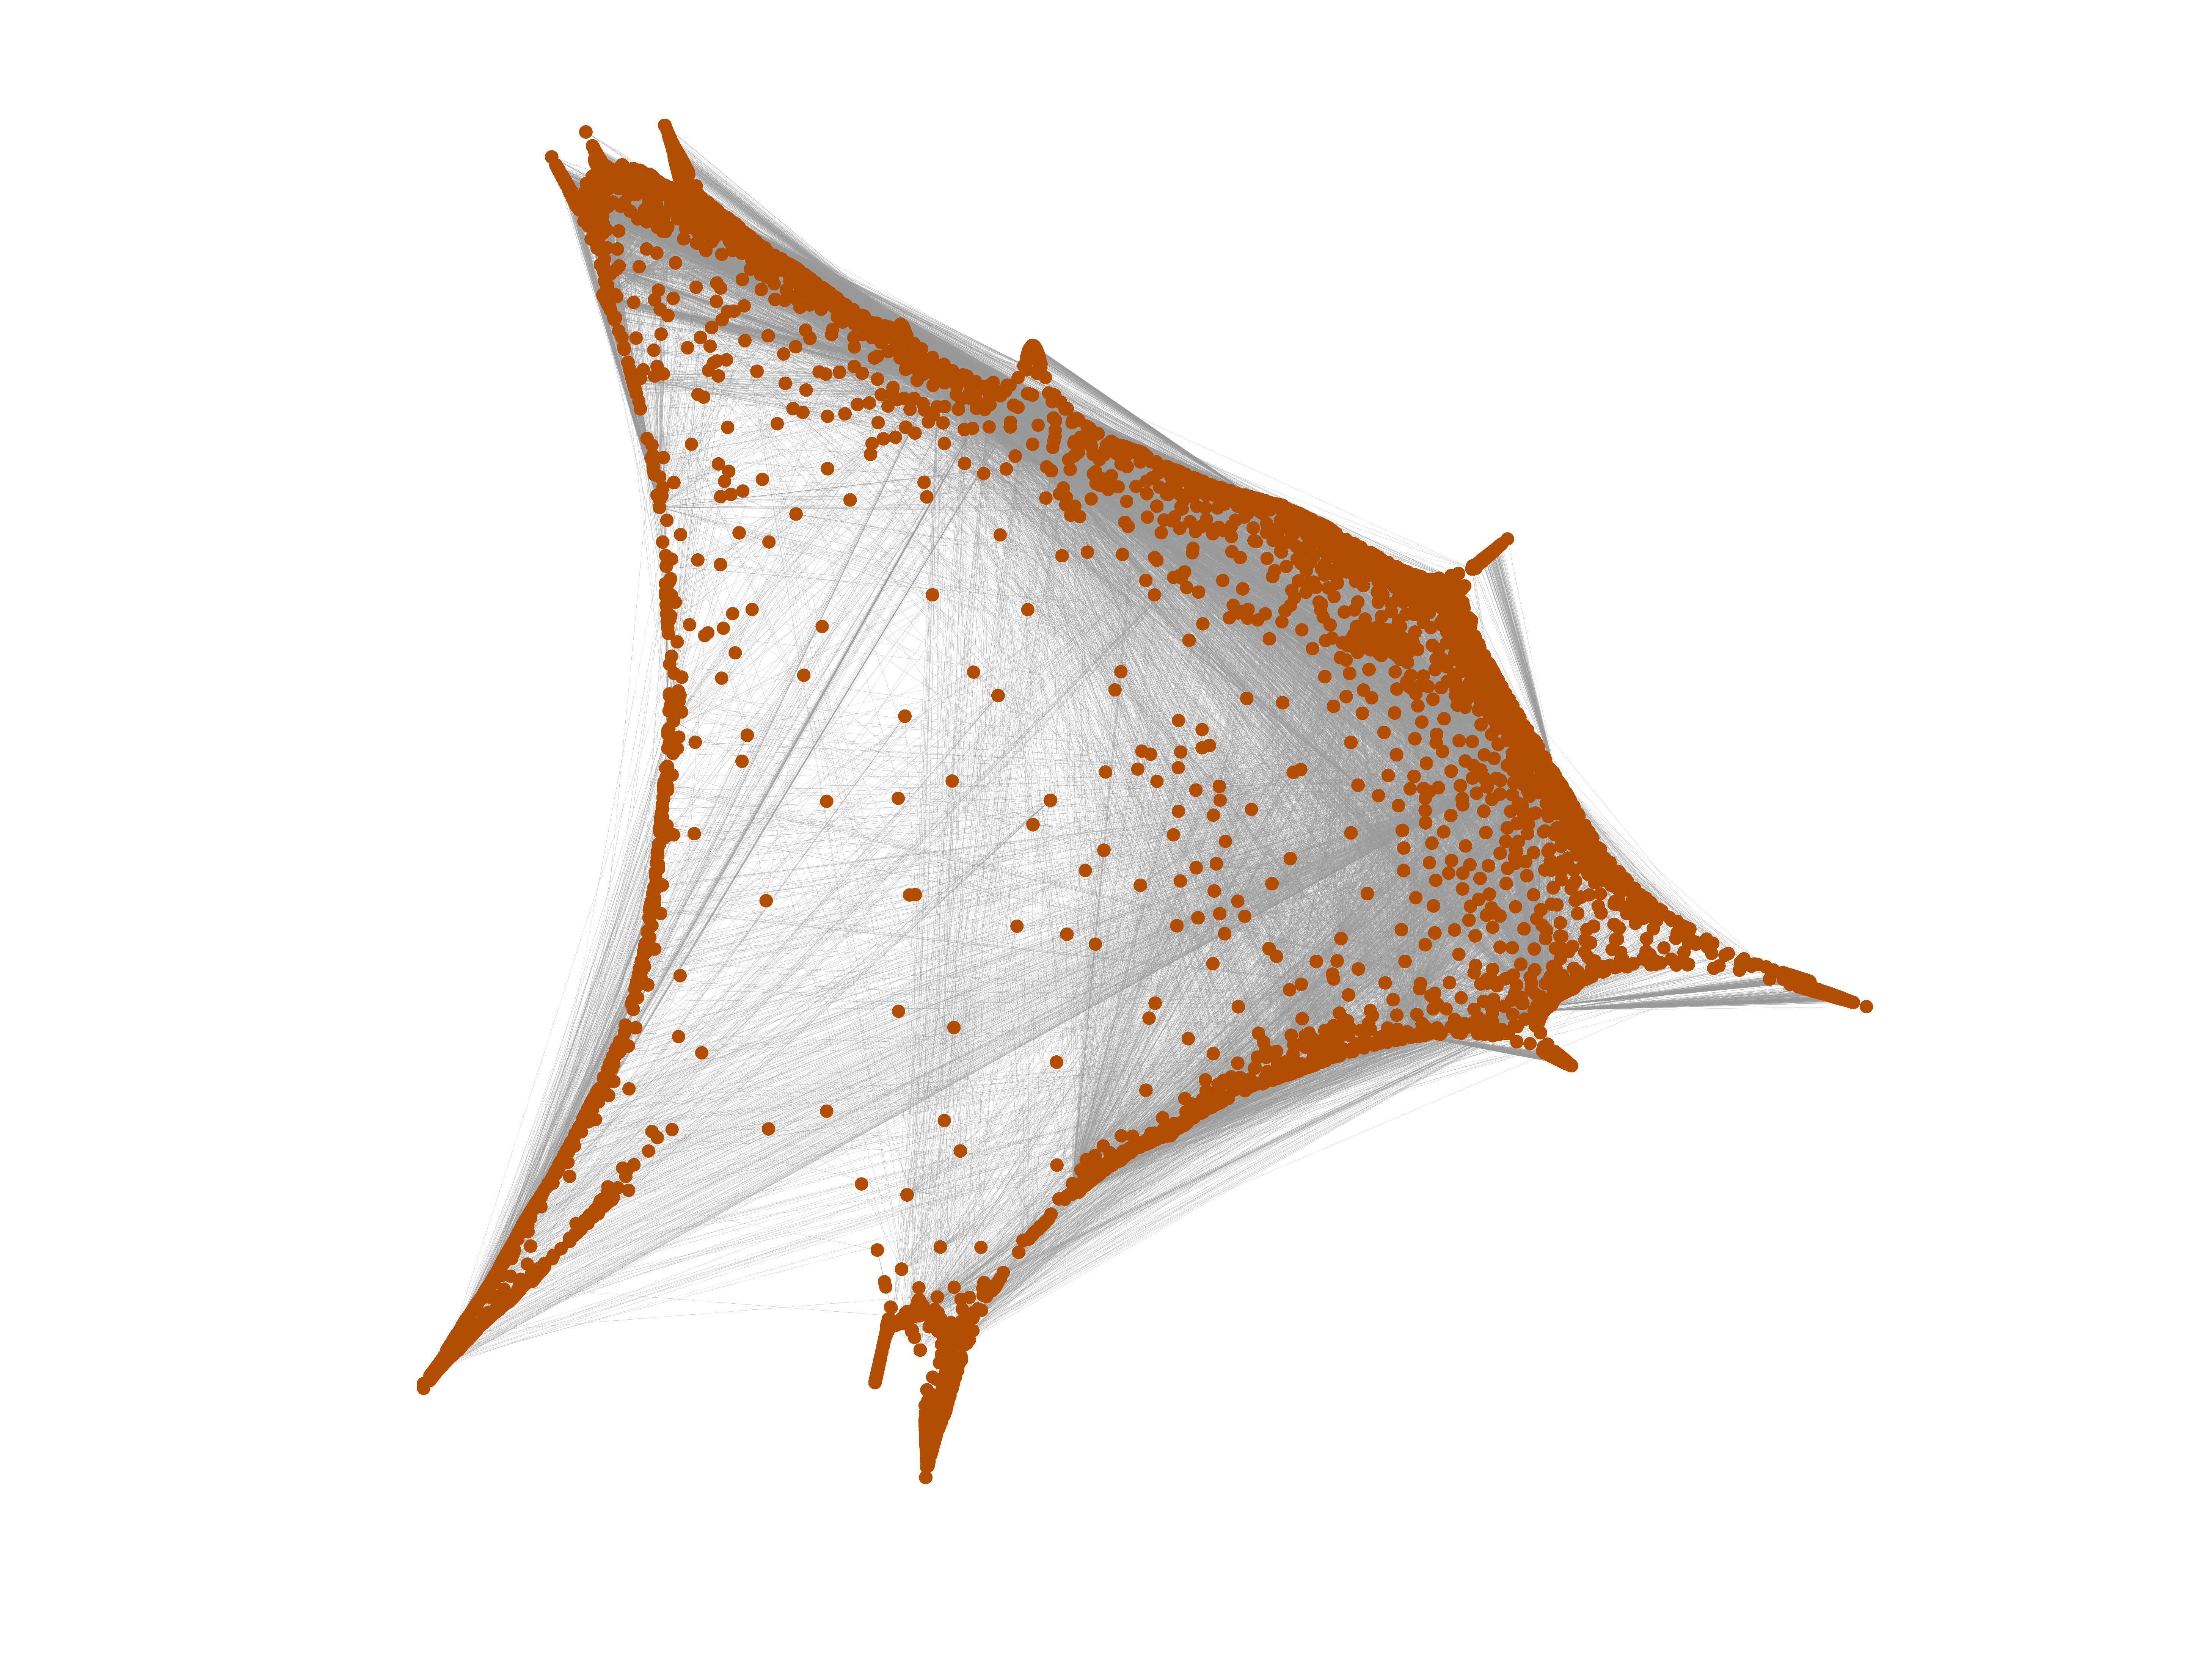
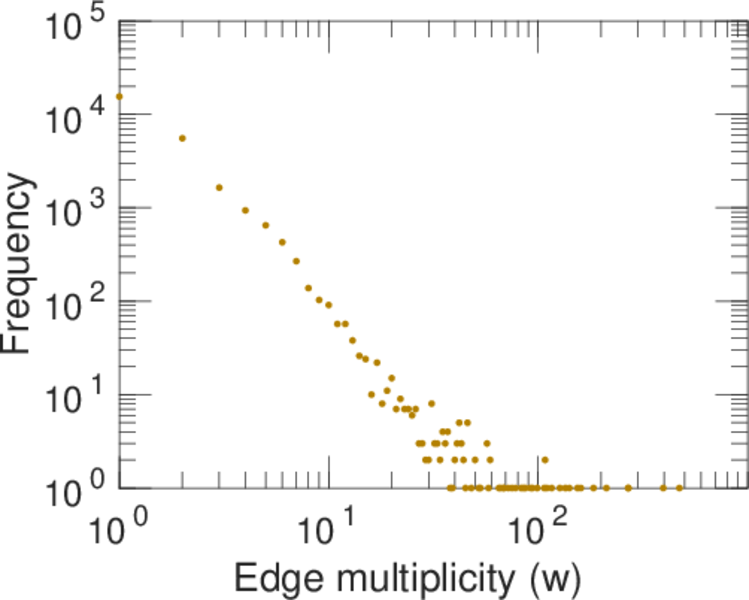
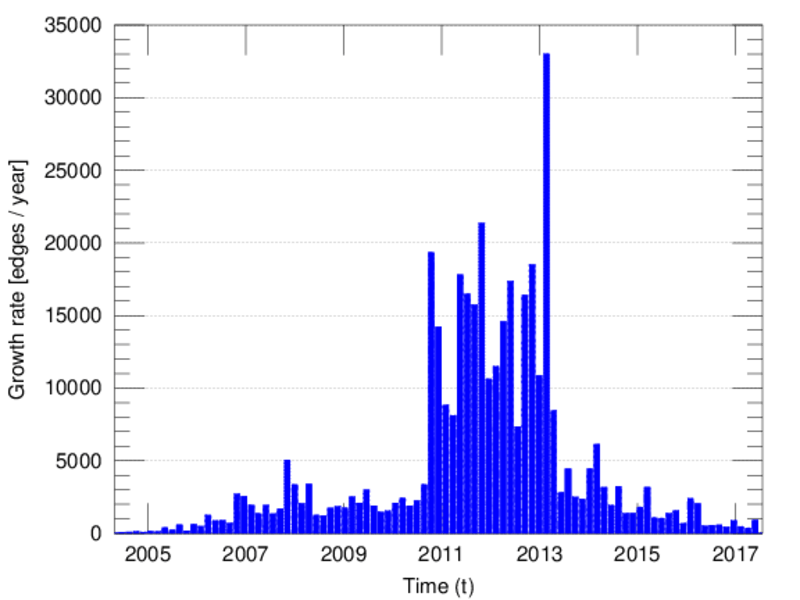
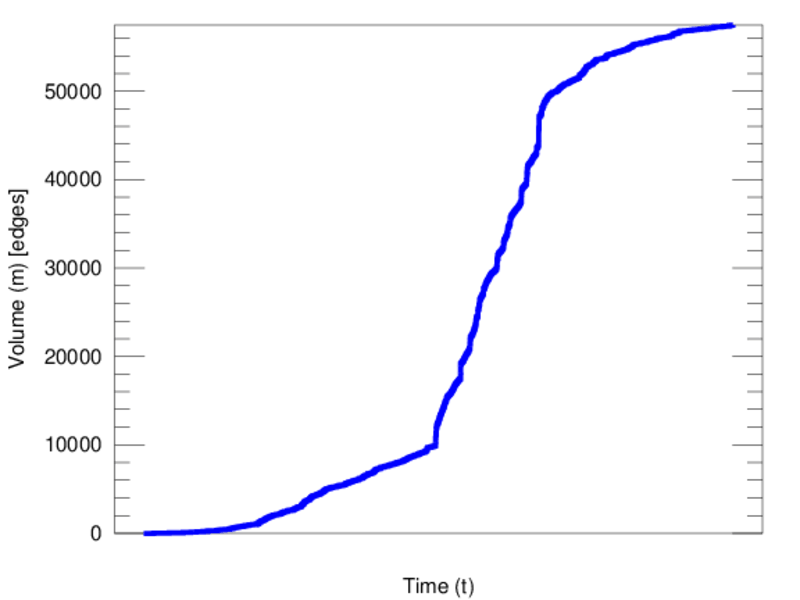
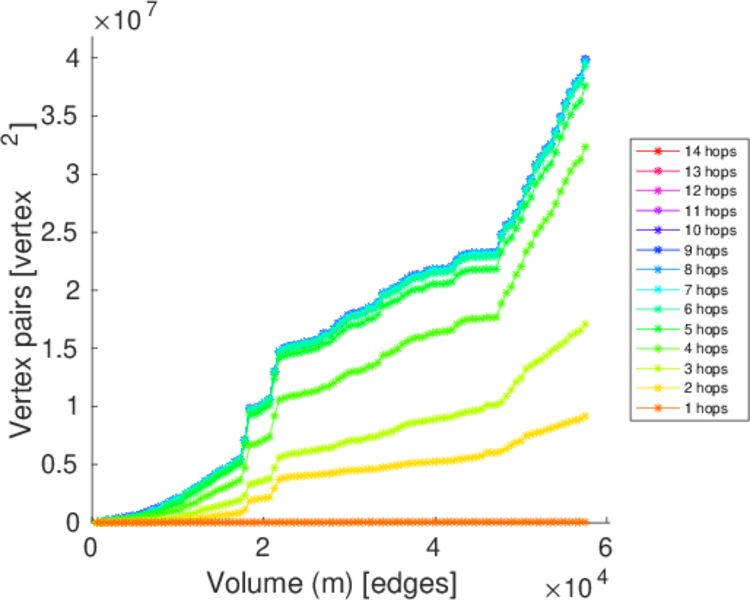
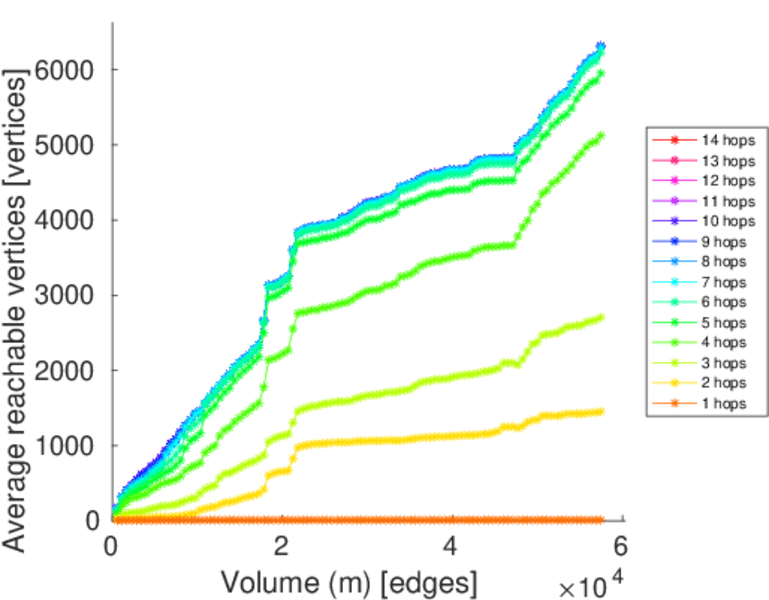
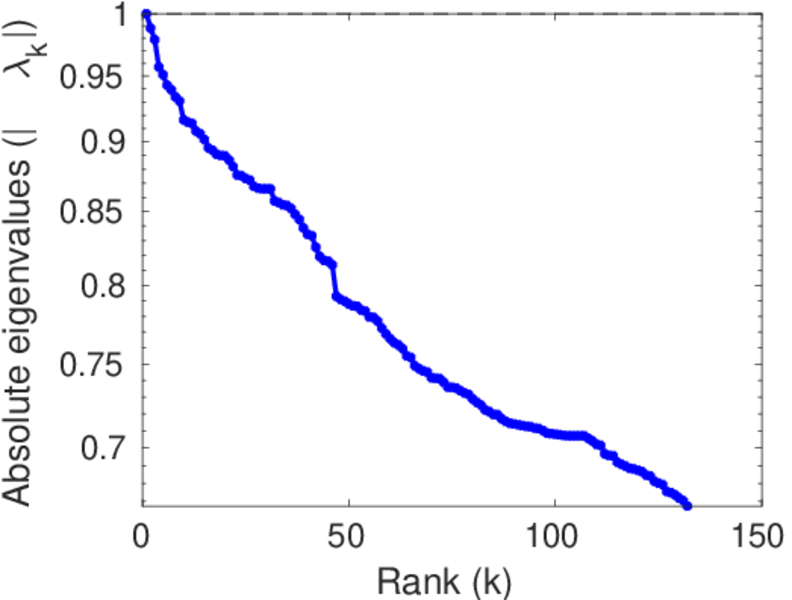
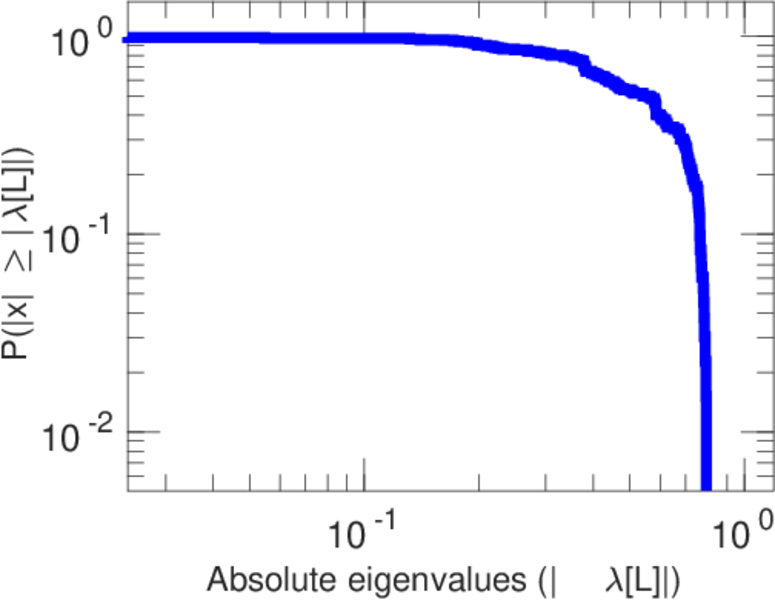
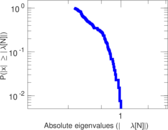
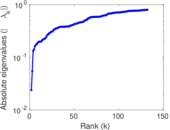
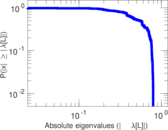
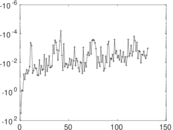
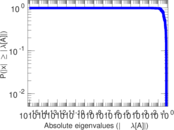
Plots


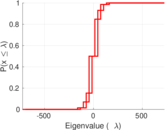
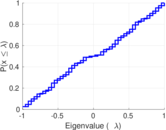
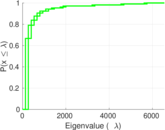
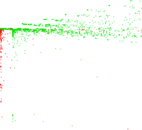


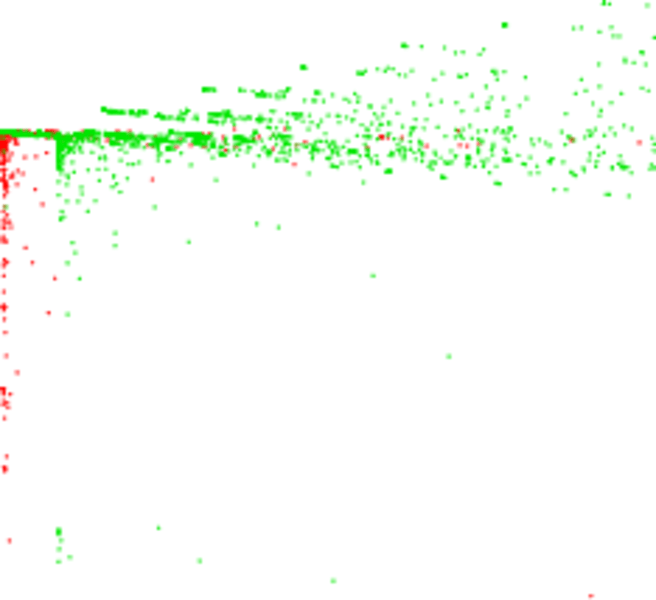
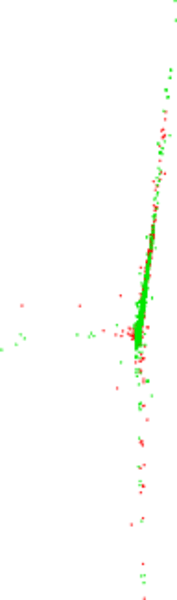
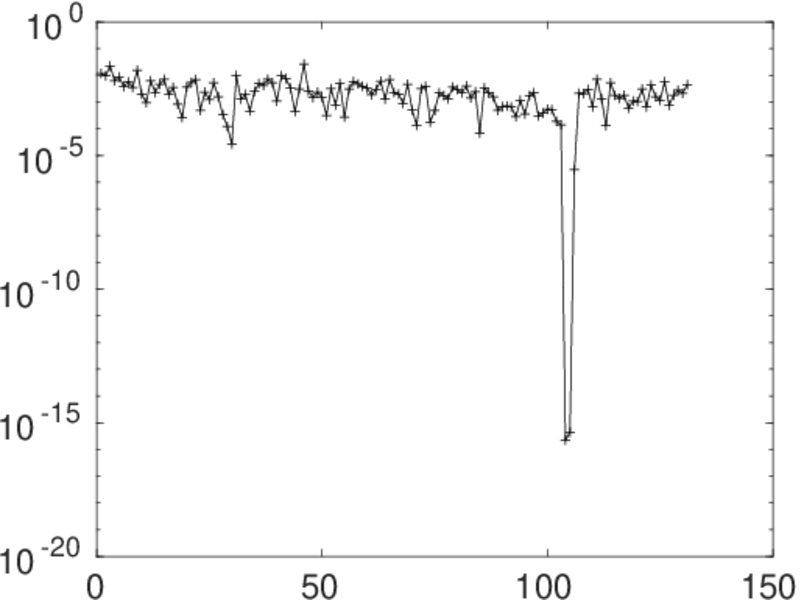
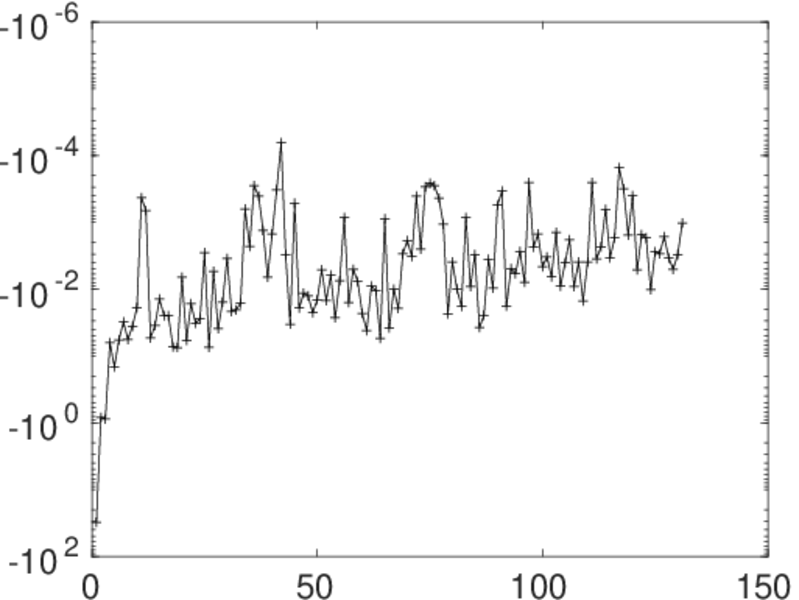
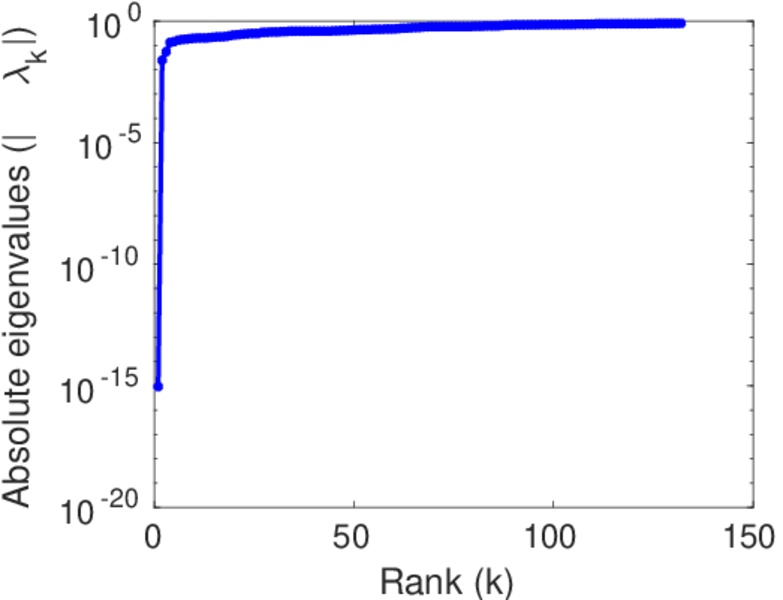
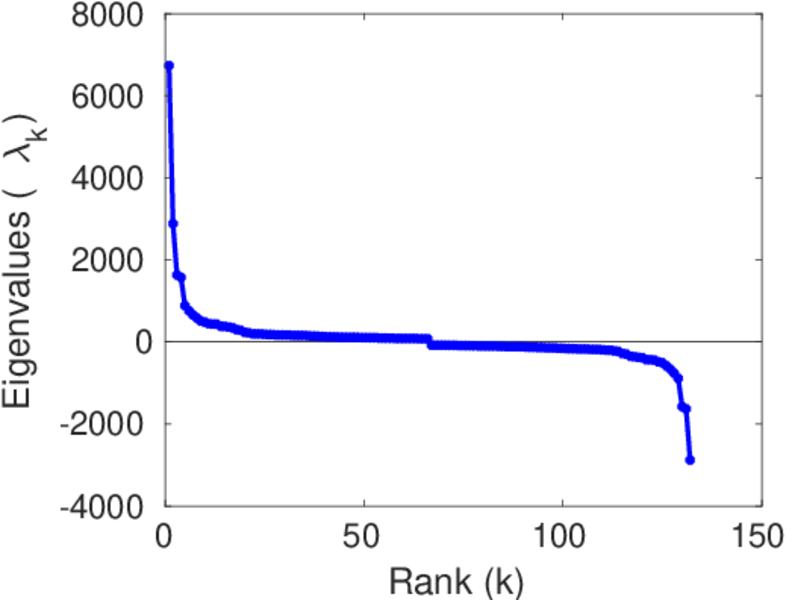
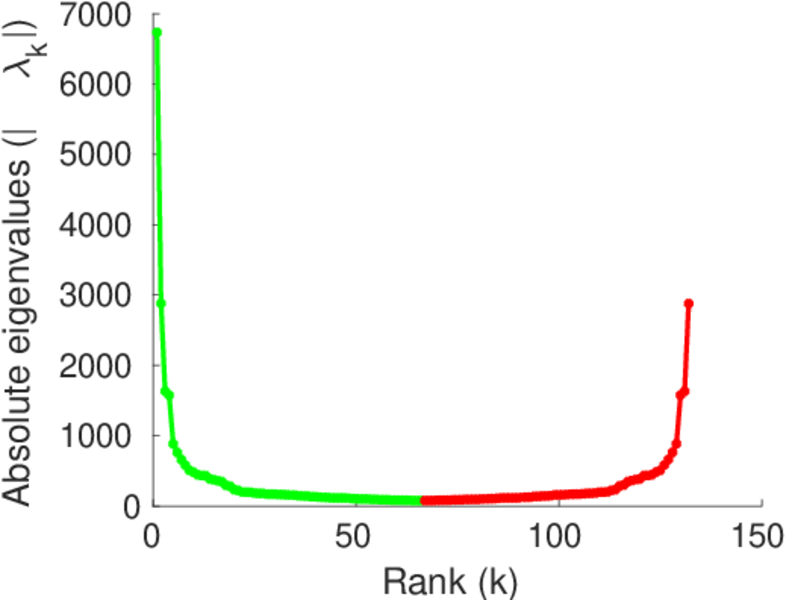
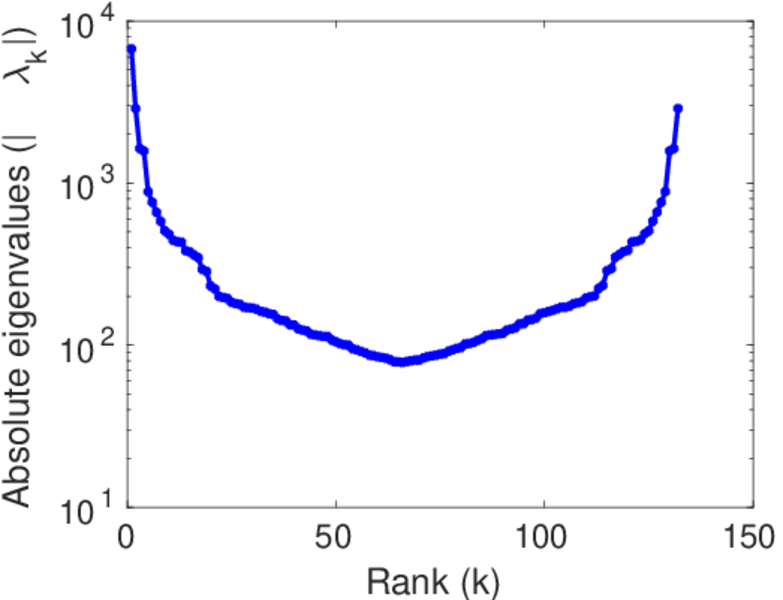
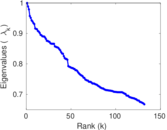
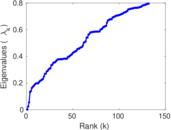
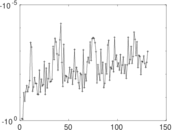
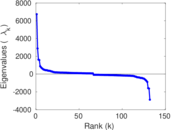
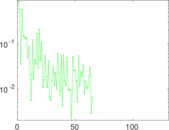
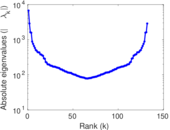
Matrix decompositions plots


Downloads
References
|
[1]
|
Jérôme Kunegis.
KONECT – The Koblenz Network Collection.
In Proc. Int. Conf. on World Wide Web Companion, pages
1343–1350, 2013.
[ http ]
|
|
[2]
|
Wikimedia Foundation.
Wikimedia downloads.
http://dumps.wikimedia.org/, January 2010.
|
 KONECT ‣ Networks ‣
Buy Me a Coffee
KONECT ‣ Networks ‣
Buy Me a Coffee