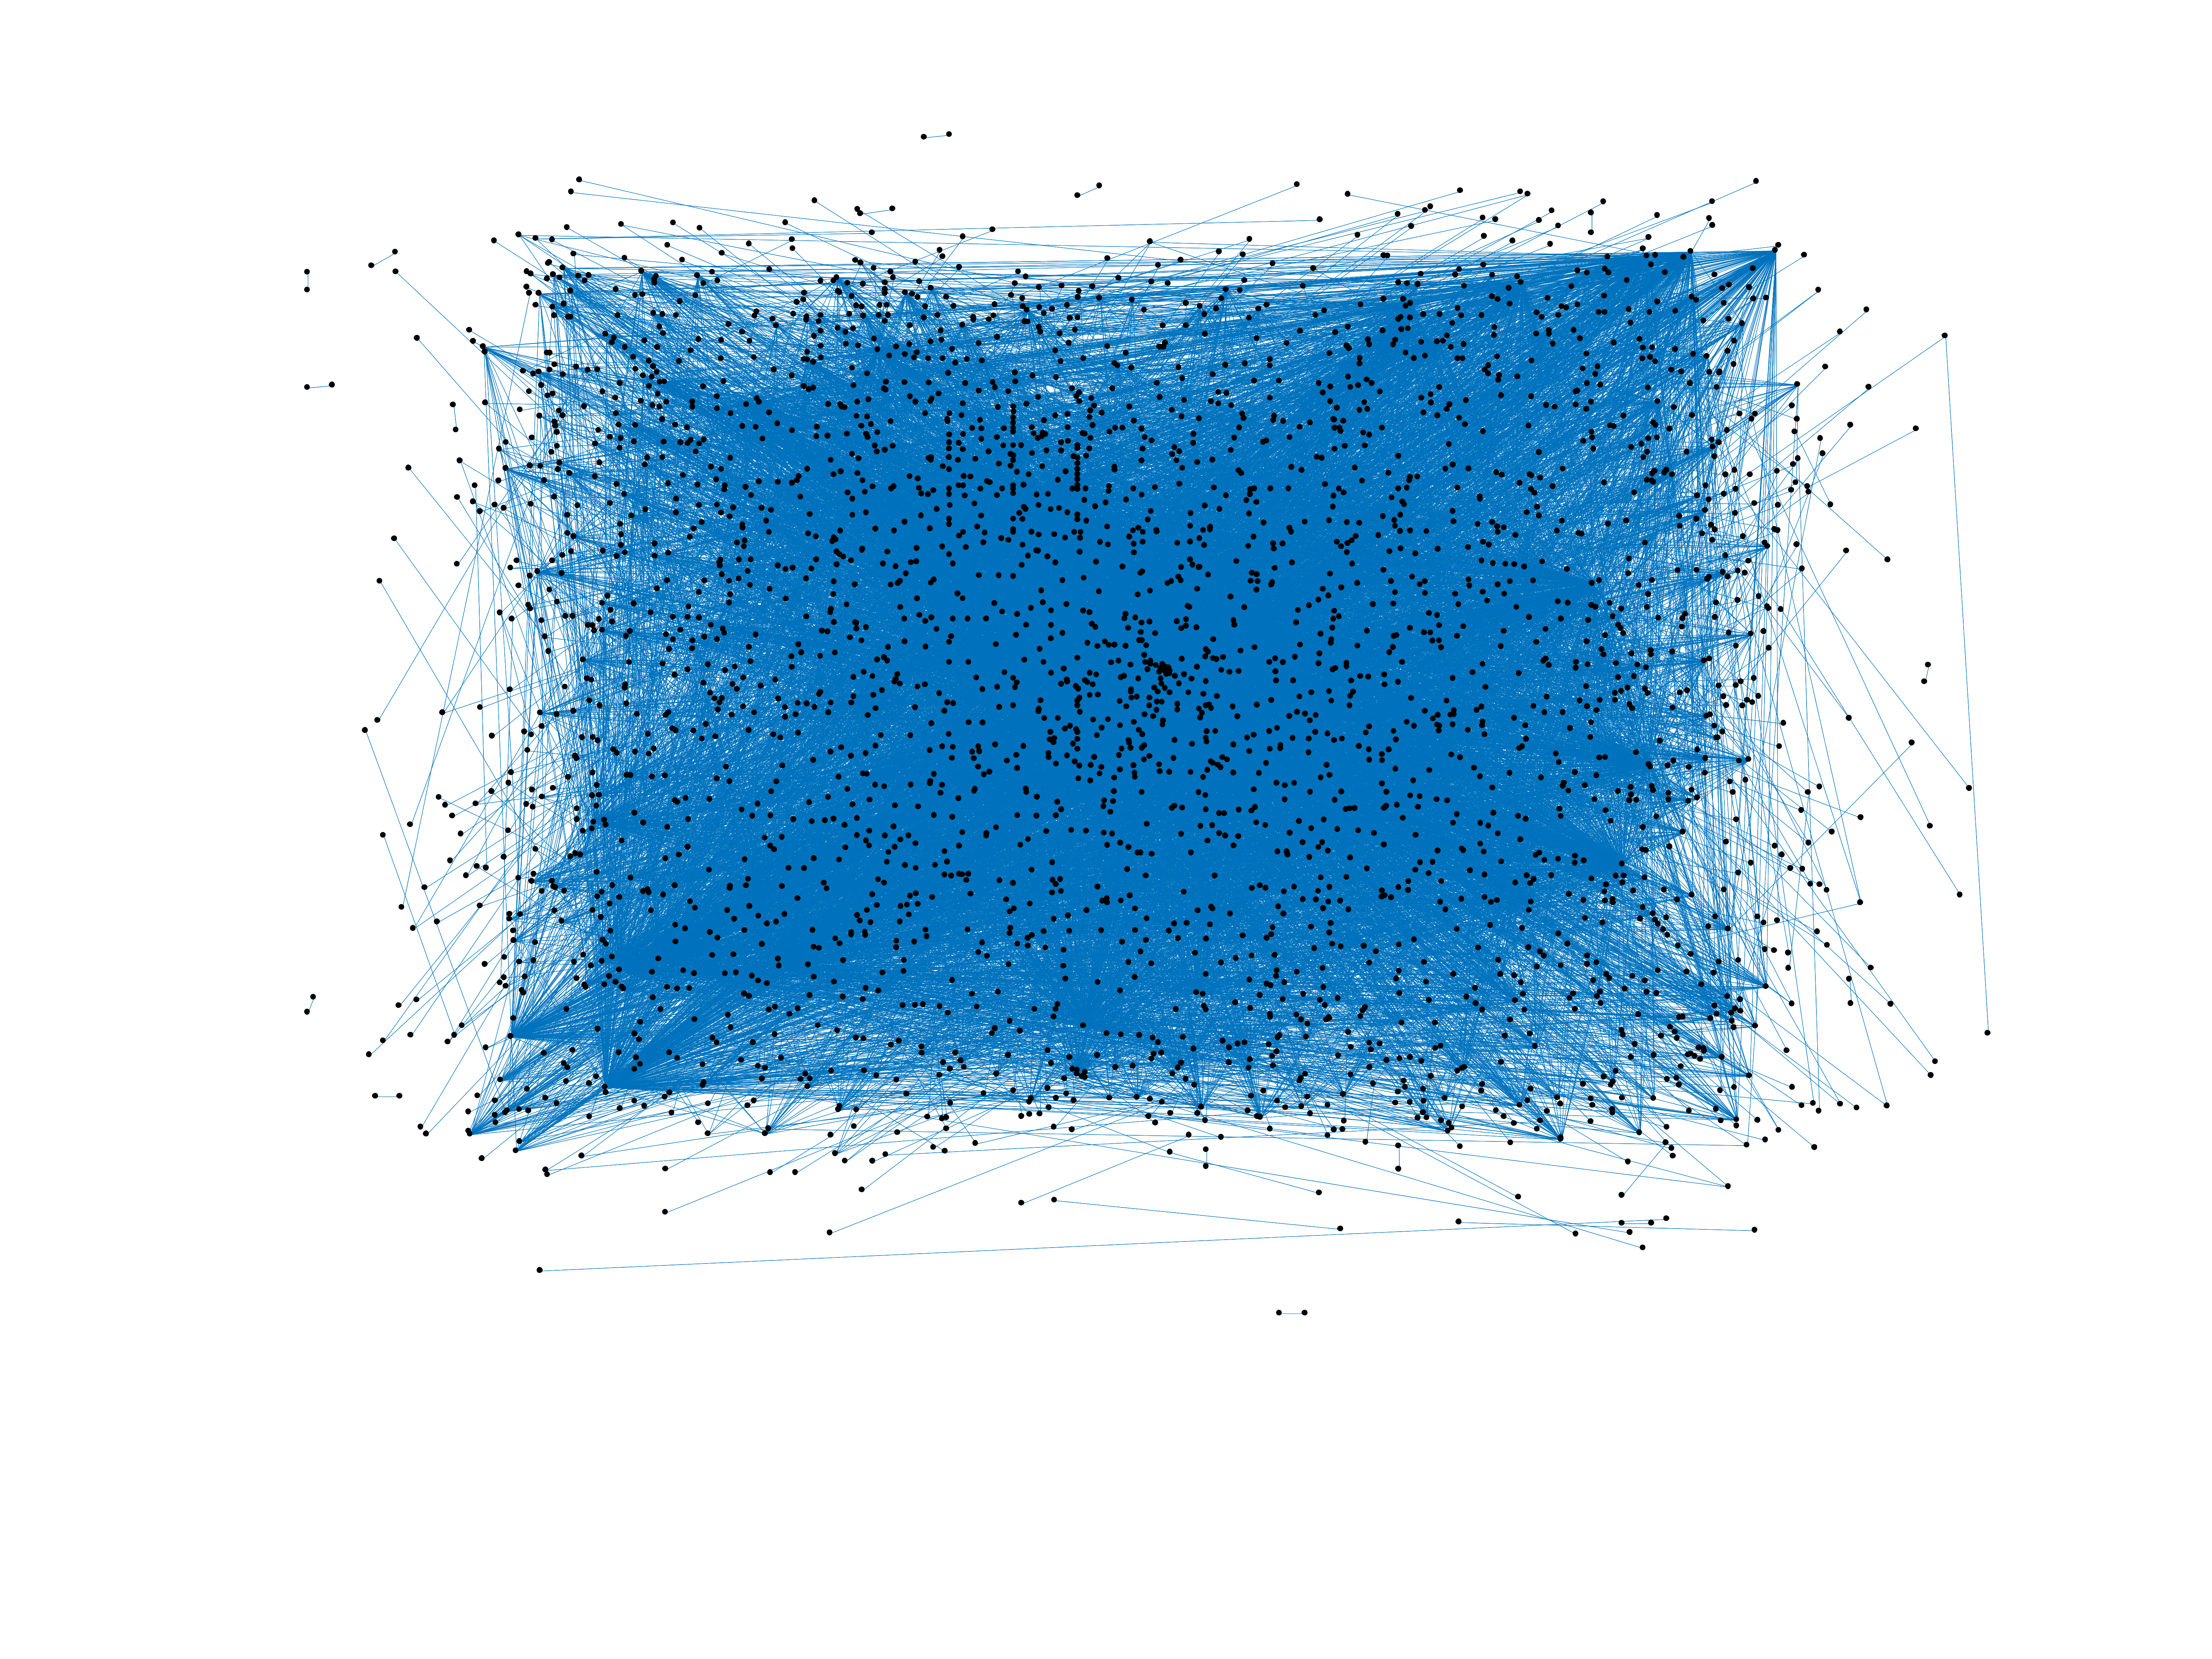
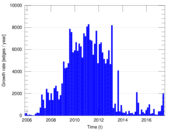
Wikipedia edits (pih)
This is the bipartite edit network of the Norfuk / Pitkern Wikipedia. It
contains users and pages from the Norfuk / Pitkern Wikipedia, connected by edit
events. Each edge represents an edit. The dataset includes the timestamp of
each edit.
Metadata
Statistics
| Size | n = | 3,152
|
| Left size | n1 = | 697
|
| Right size | n2 = | 2,455
|
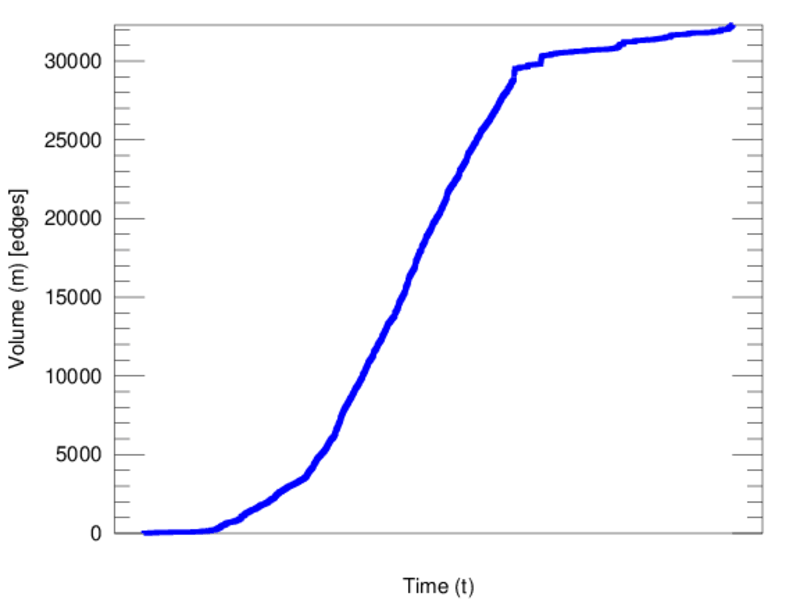
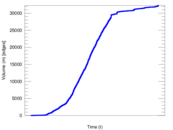
| Volume | m = | 32,283
|
| Unique edge count | m̿ = | 13,322
|
| Wedge count | s = | 1,518,800
|
| Claw count | z = | 156,714,589
|
| Cross count | x = | 16,980,089,410
|
| Square count | q = | 6,977,484
|
| 4-Tour count | T4 = | 61,928,848
|
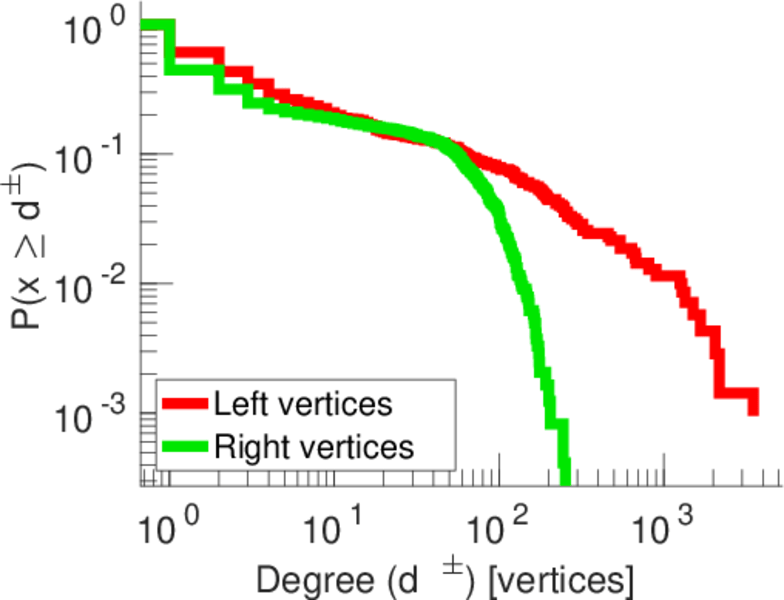
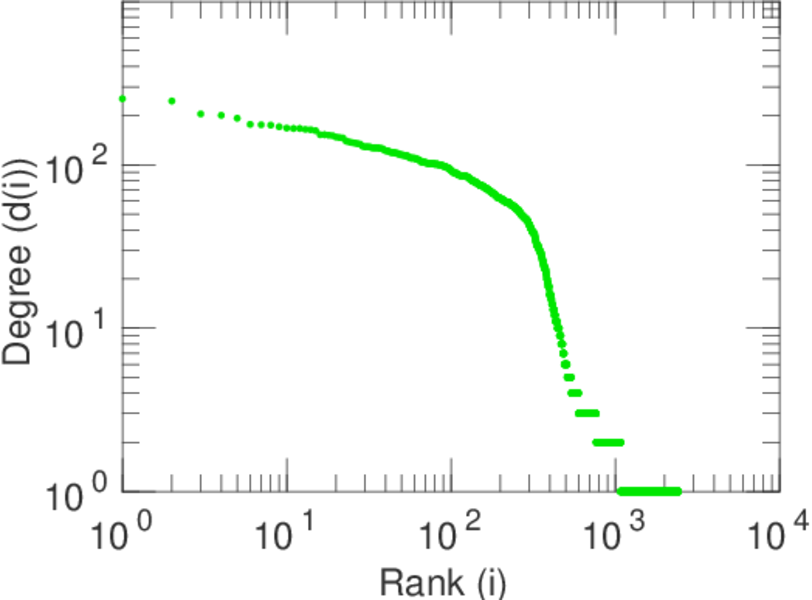
| Maximum degree | dmax = | 3,510
|
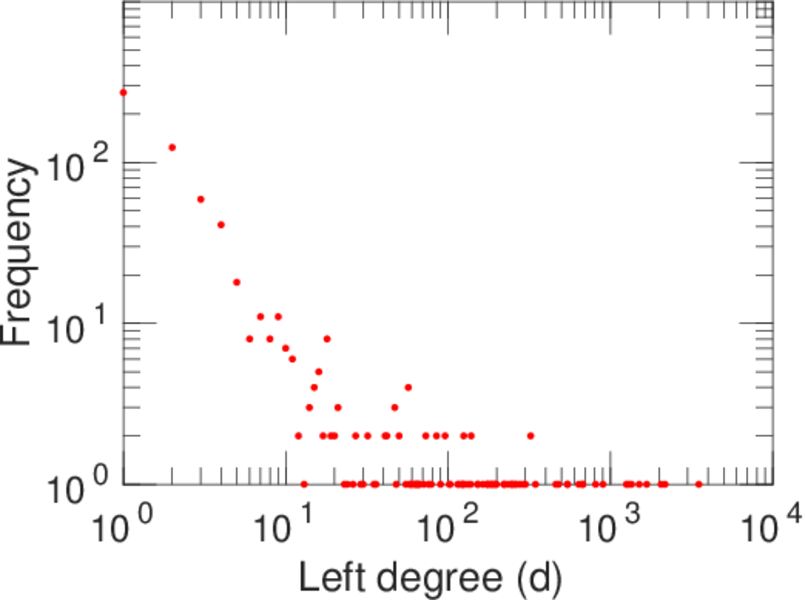
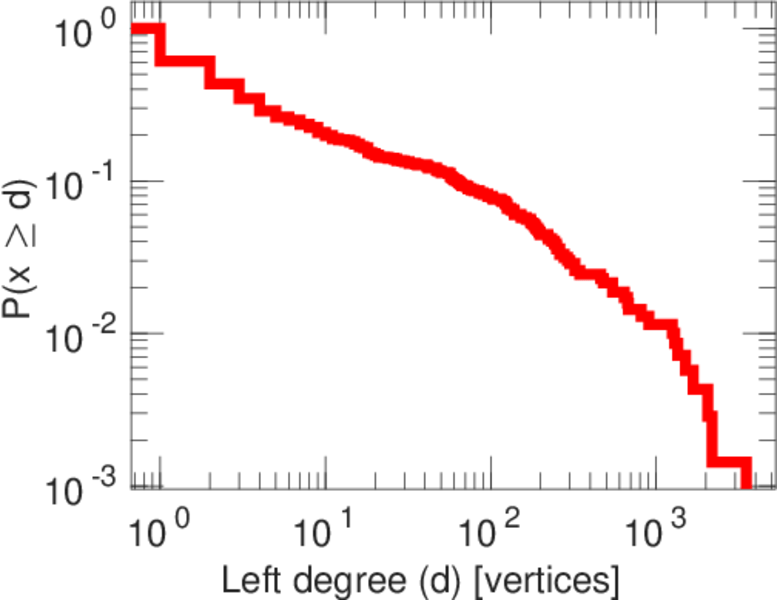
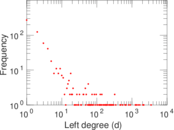
| Maximum left degree | d1max = | 3,510
|
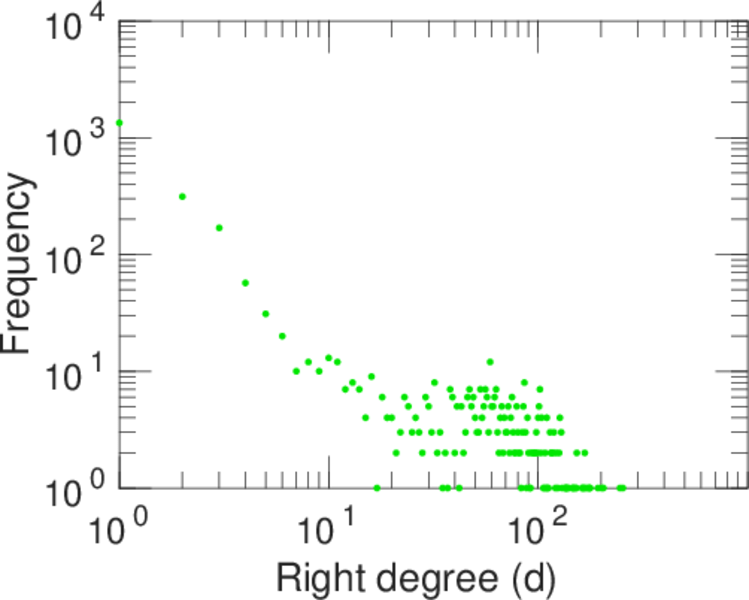
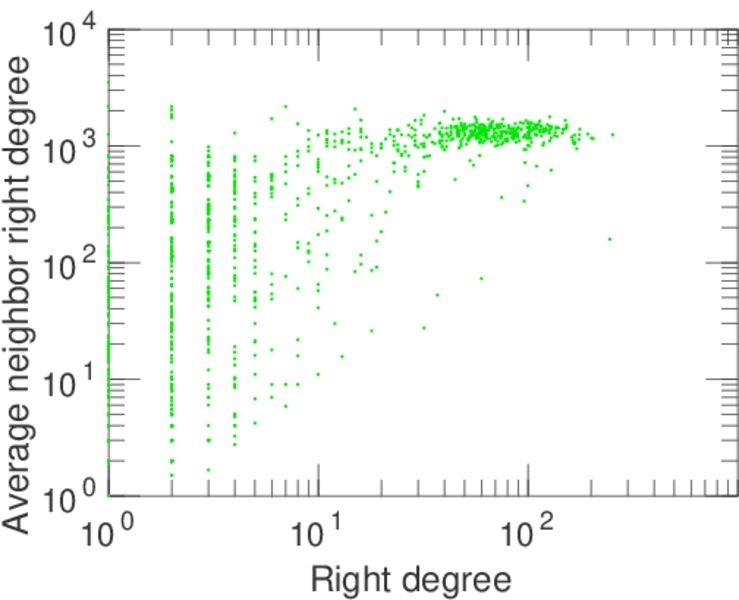
| Maximum right degree | d2max = | 254
|
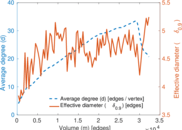
| Average degree | d = | 20.484 1
|
| Average left degree | d1 = | 46.317 1
|
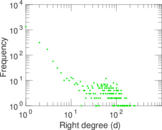
| Average right degree | d2 = | 13.149 9
|
| Fill | p = | 0.007 785 48
|
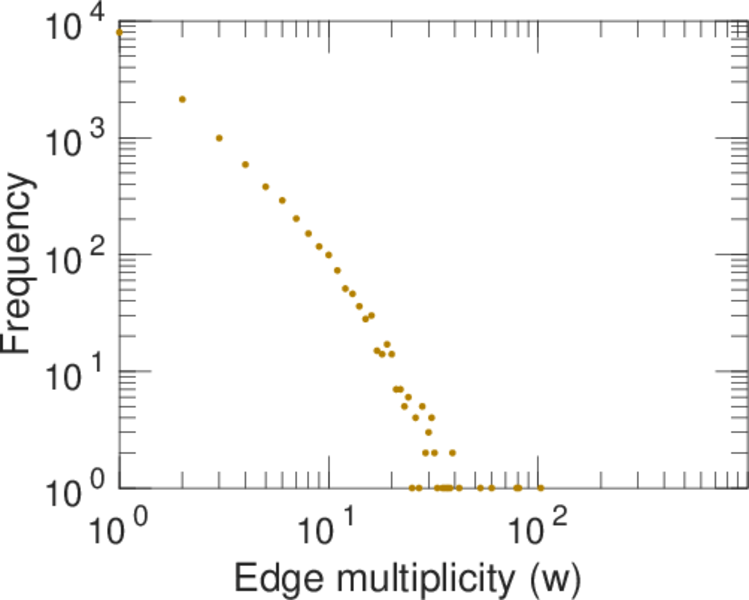
| Average edge multiplicity | m̃ = | 2.423 28
|
| Size of LCC | N = | 2,605
|
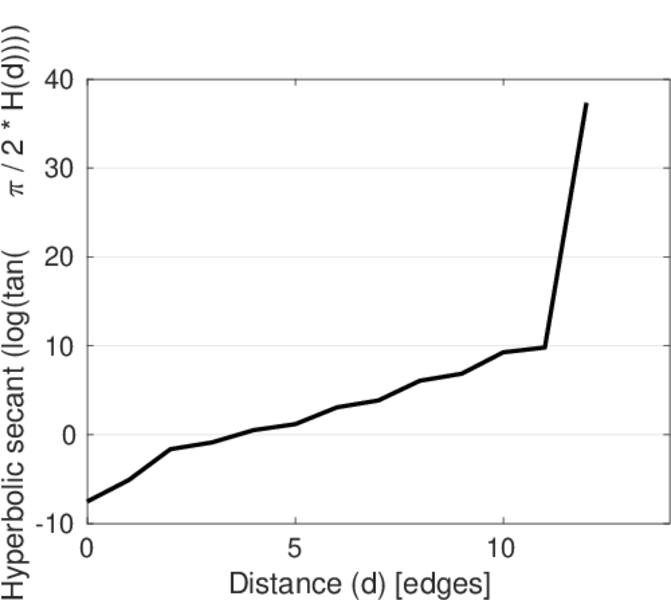
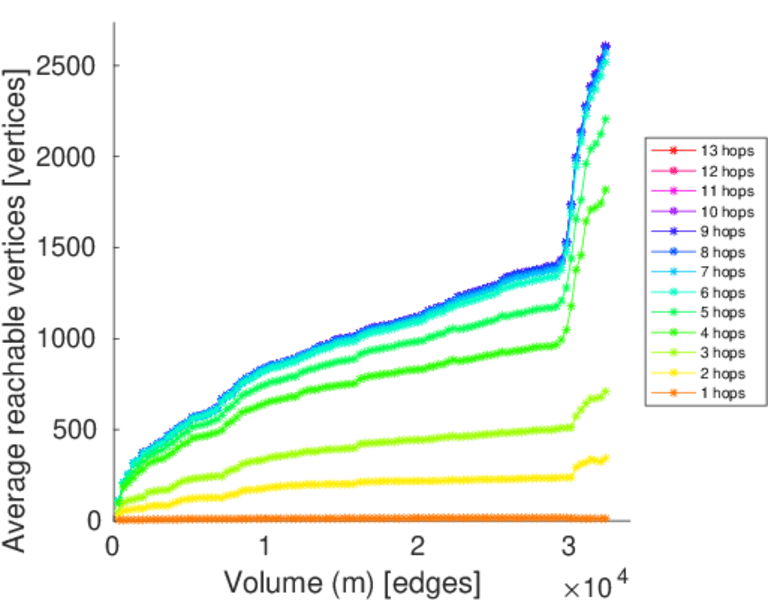
| Diameter | δ = | 13
|
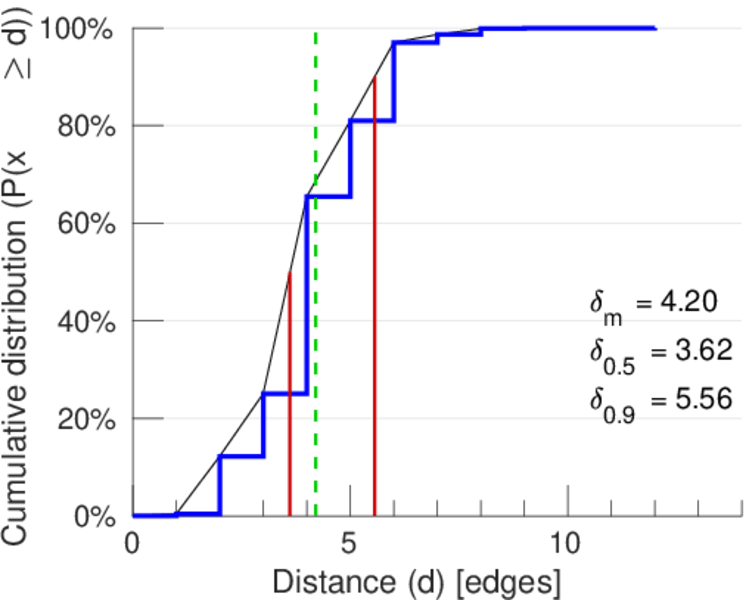
| 50-Percentile effective diameter | δ0.5 = | 3.617 84
|
| 90-Percentile effective diameter | δ0.9 = | 5.562 37
|
| Median distance | δM = | 4
|
| Mean distance | δm = | 4.204 44
|
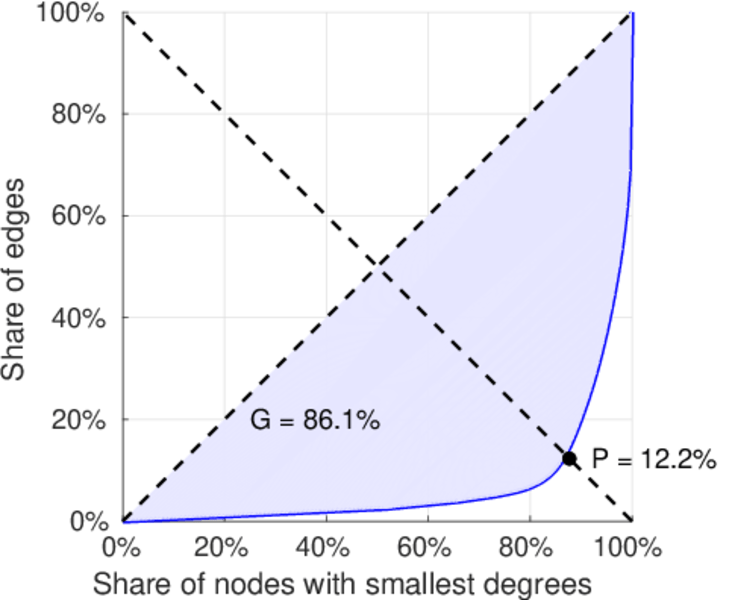
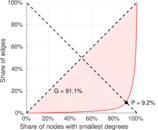
| Gini coefficient | G = | 0.857 160
|
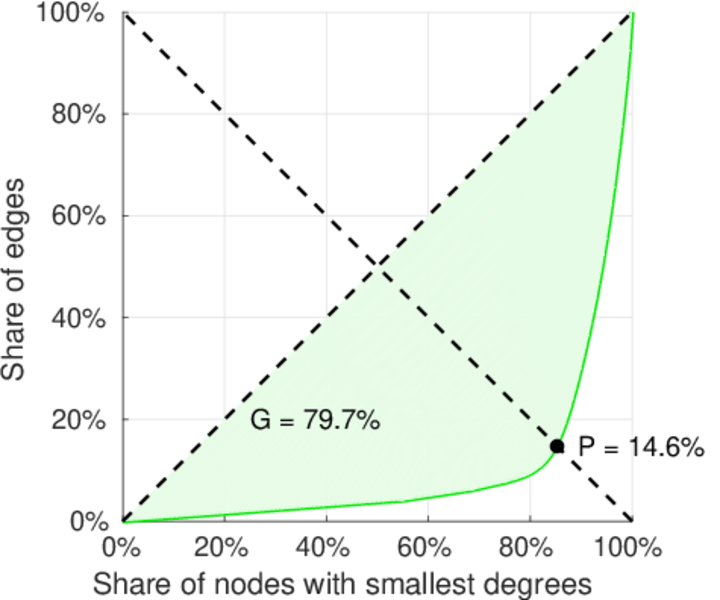
| Balanced inequality ratio | P = | 0.133 182
|
| Left balanced inequality ratio | P1 = | 0.092 060 8
|
| Right balanced inequality ratio | P2 = | 0.145 742
|
| Relative edge distribution entropy | Her = | 0.801 110
|
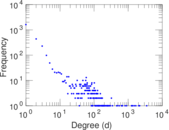
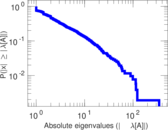
| Power law exponent | γ = | 2.282 24
|
| Tail power law exponent | γt = | 1.811 00
|
| Tail power law exponent with p | γ3 = | 1.811 00
|
| p-value | p = | 0.000 00
|
| Left tail power law exponent with p | γ3,1 = | 1.641 00
|
| Left p-value | p1 = | 0.000 00
|
| Right tail power law exponent with p | γ3,2 = | 1.881 00
|
| Right p-value | p2 = | 0.000 00
|
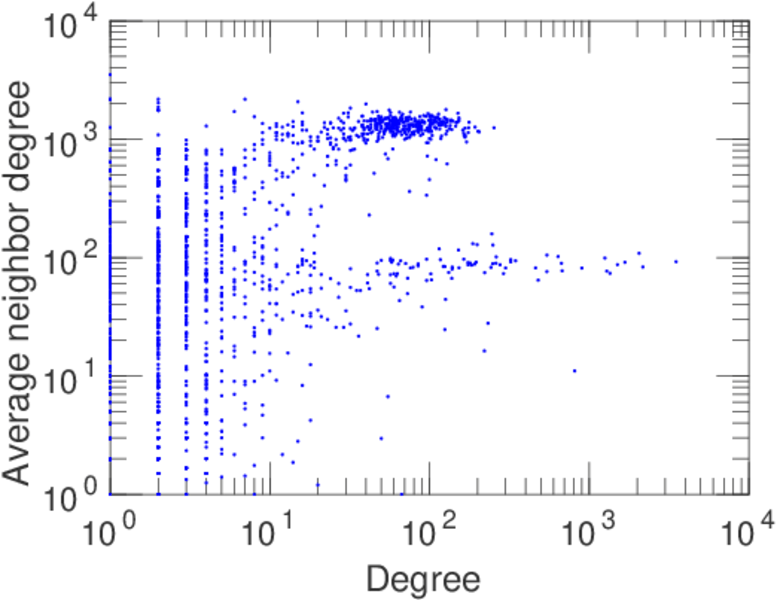
| Degree assortativity | ρ = | −0.128 517
|
| Degree assortativity p-value | pρ = | 3.609 00 × 10−50
|
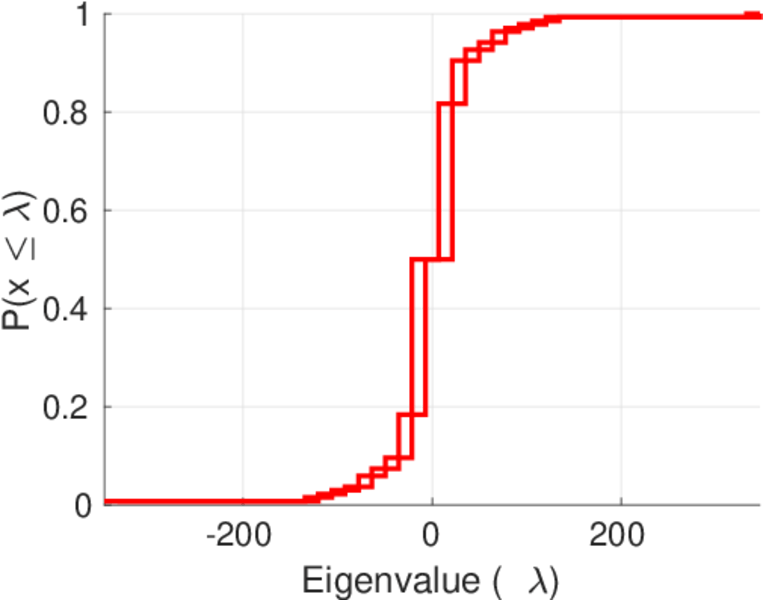
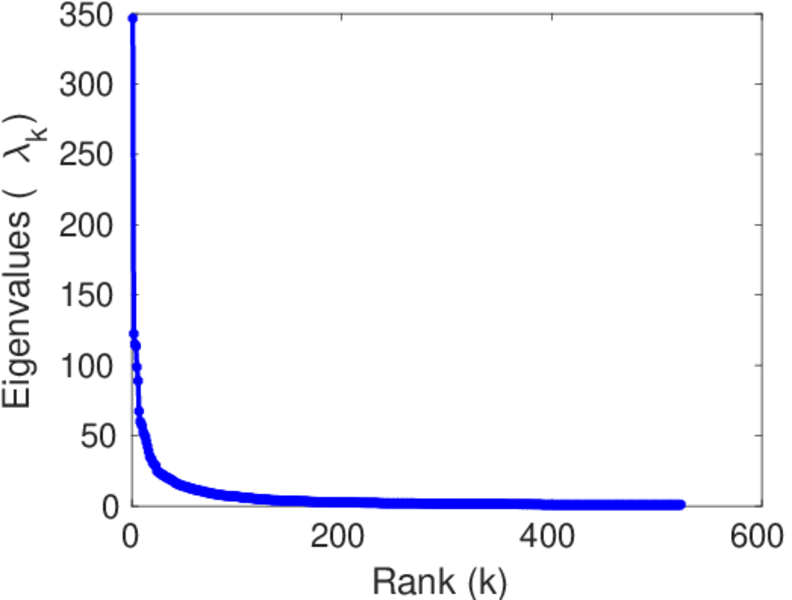
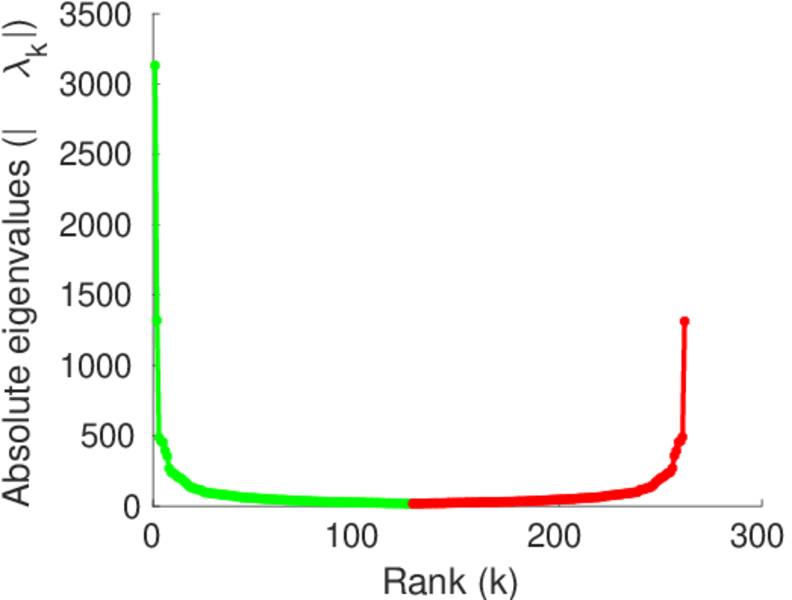
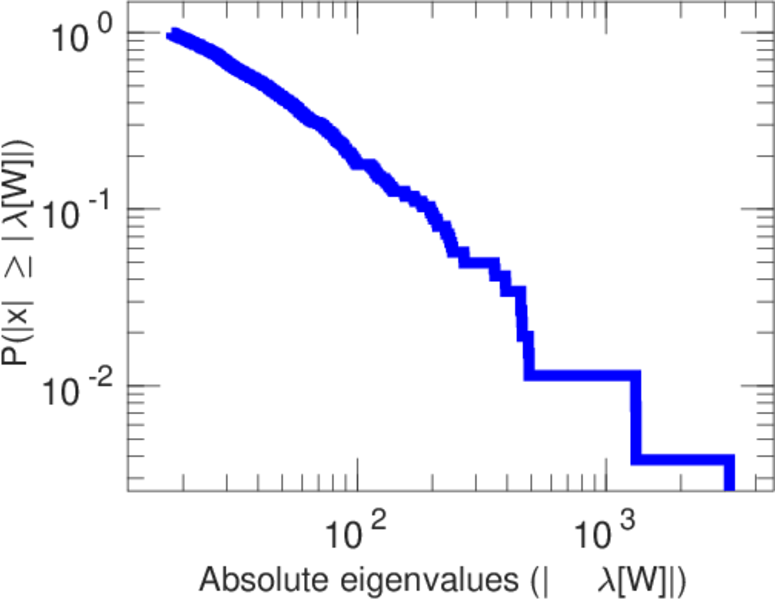
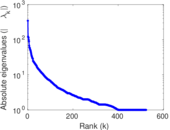
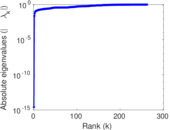
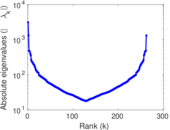
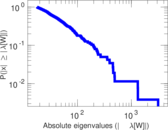
| Spectral norm | α = | 346.644
|
| Algebraic connectivity | a = | 0.024 013 7
|
| Spectral separation | |λ1[A] / λ2[A]| = | 2.830 53
|
| Controllability | C = | 1,855
|
| Relative controllability | Cr = | 0.595 506
|
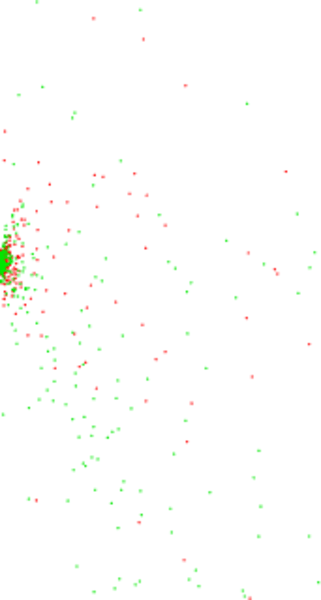
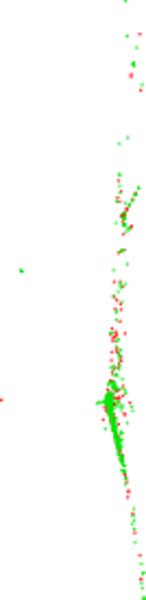
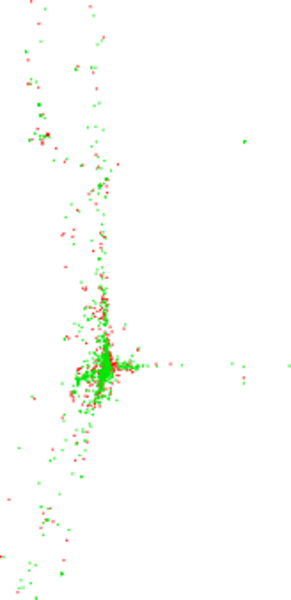
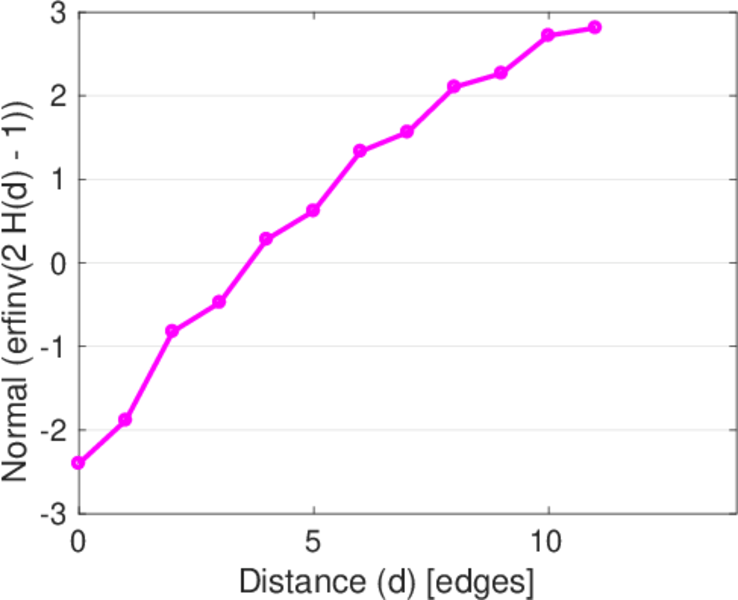
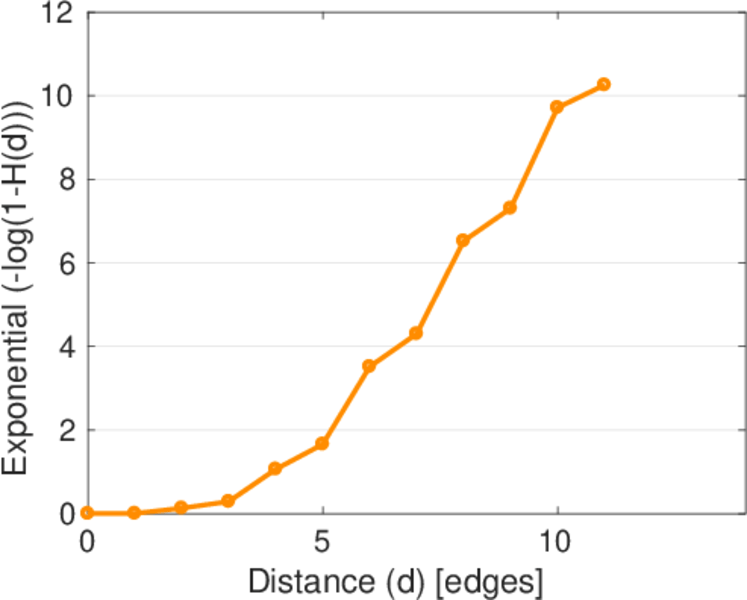
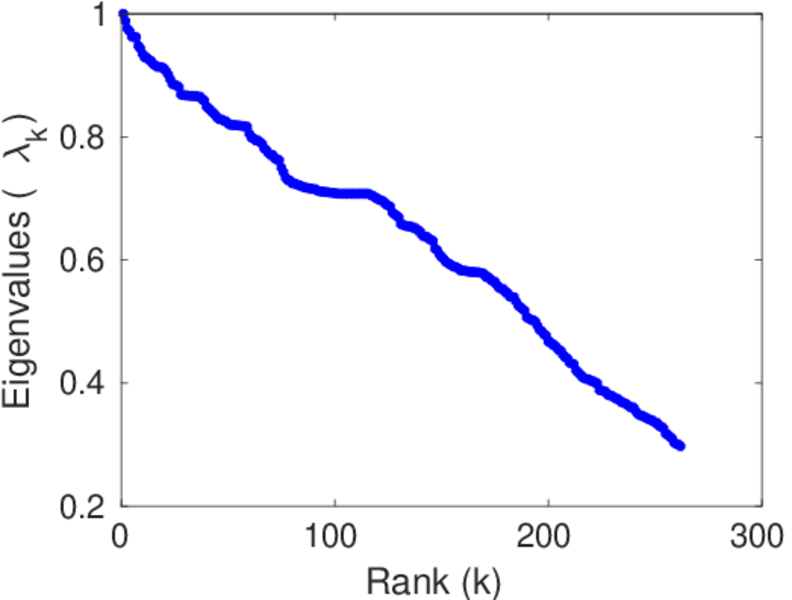
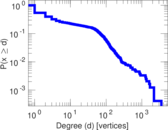
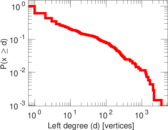
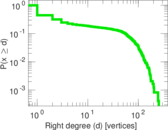
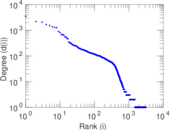
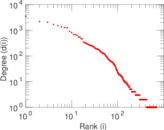
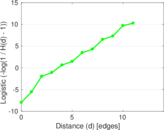
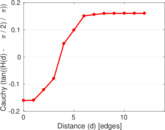
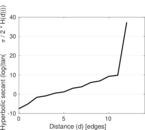
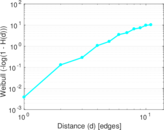
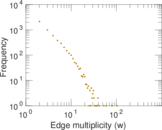
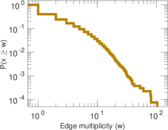
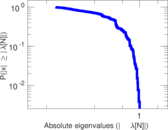
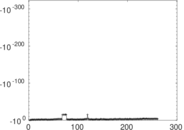
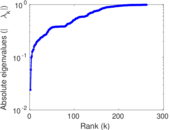
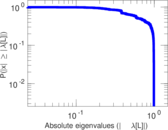
Plots


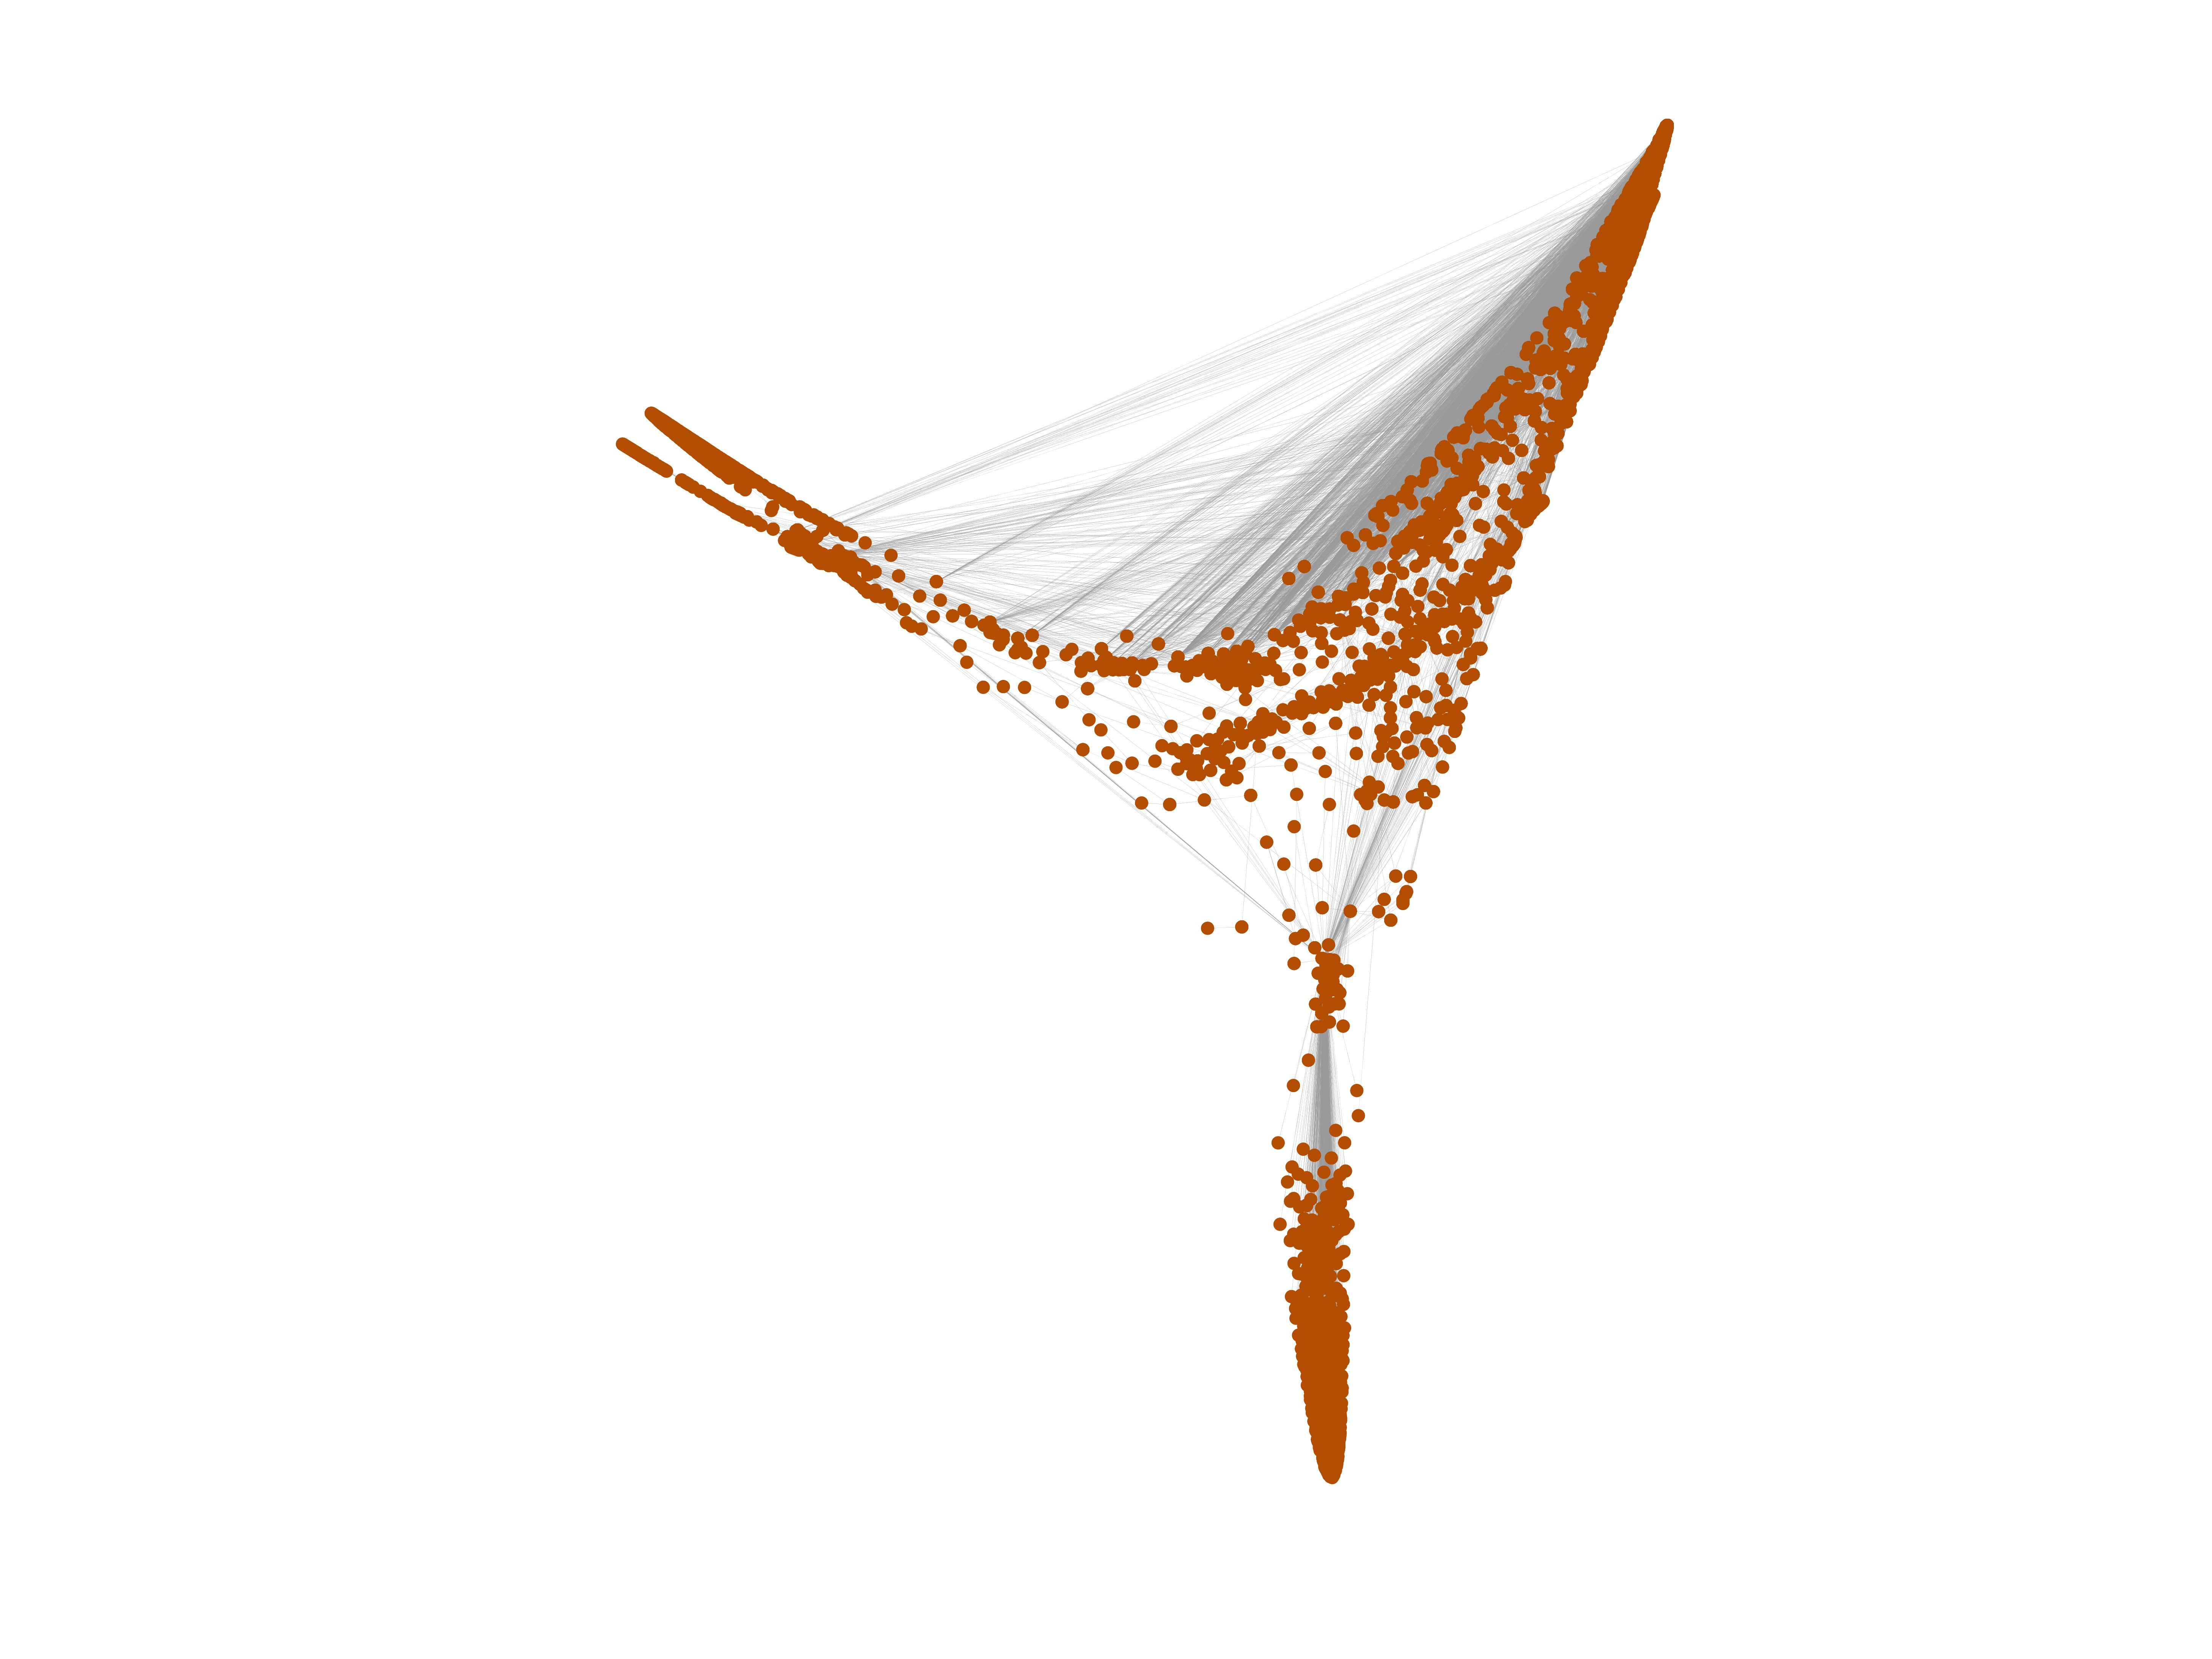
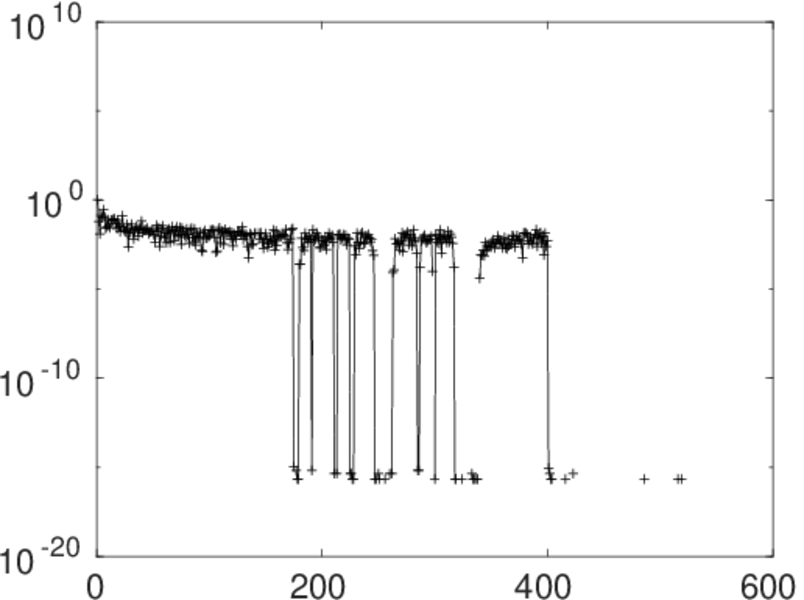
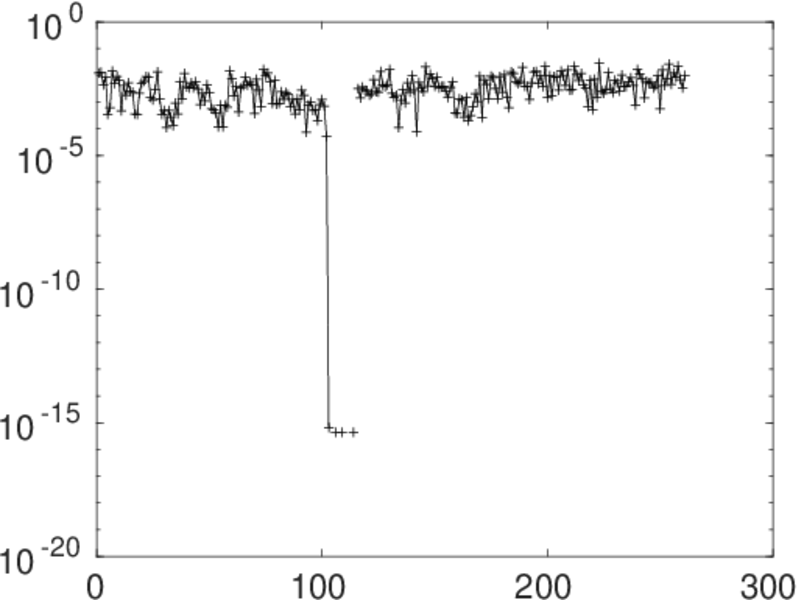
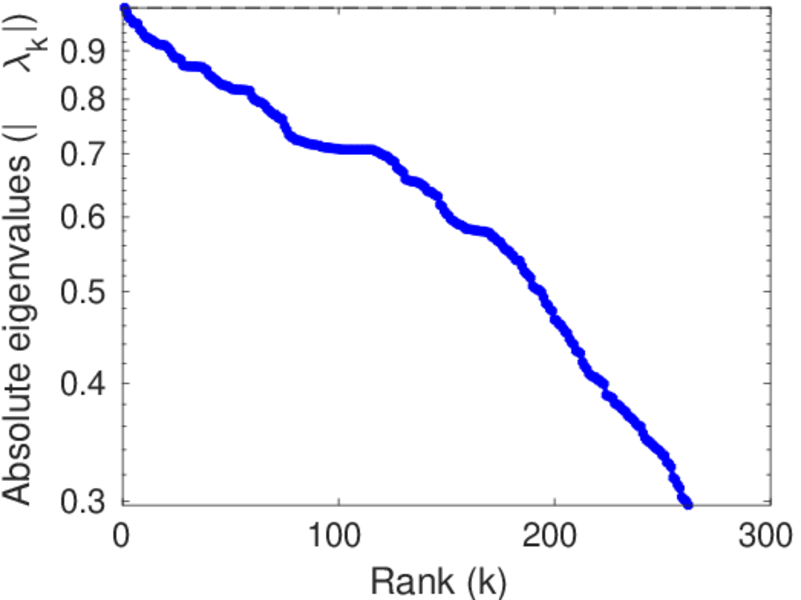
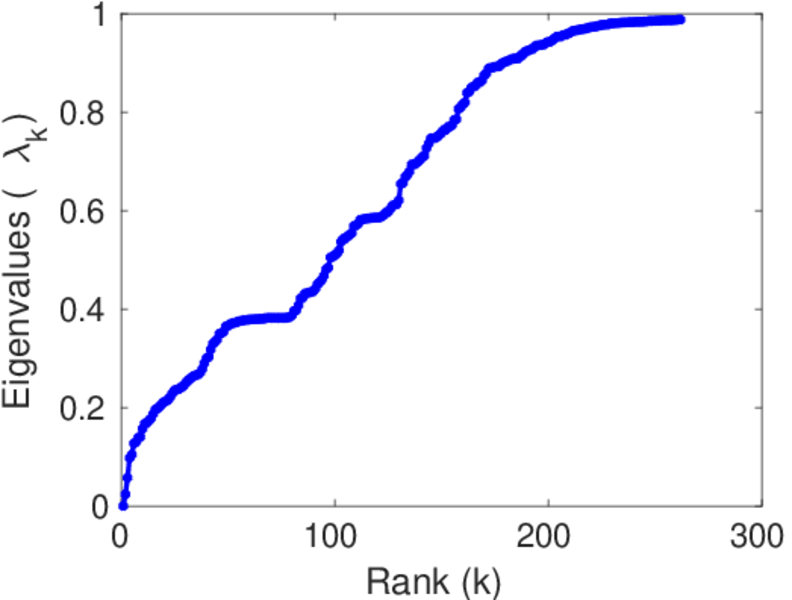
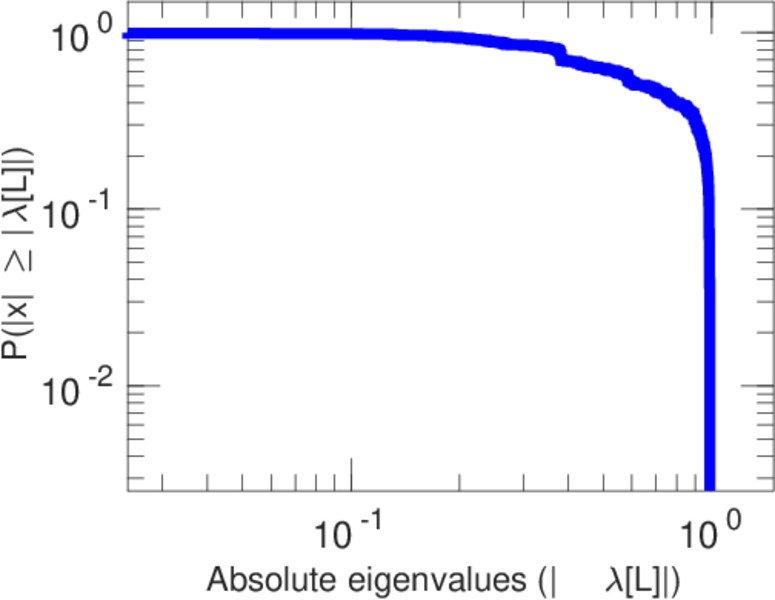
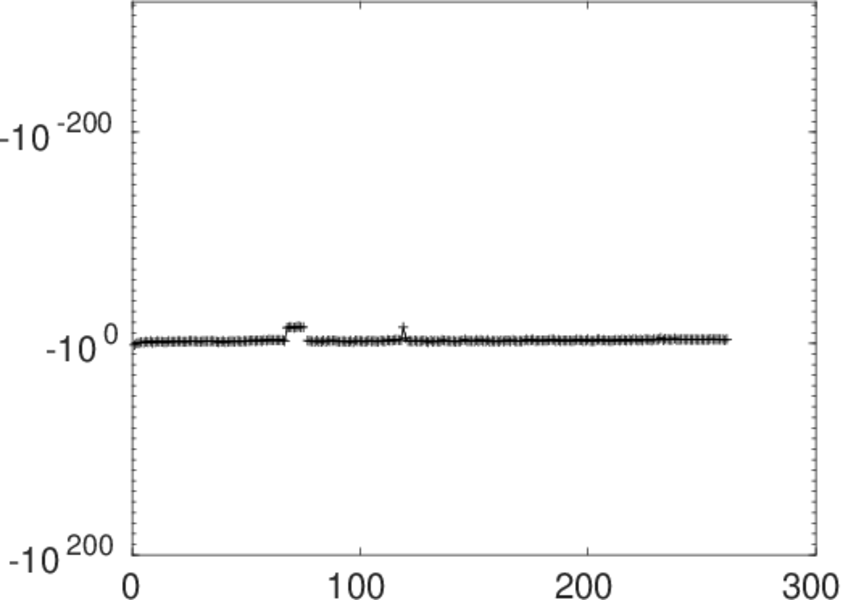
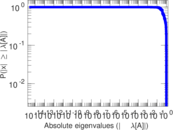
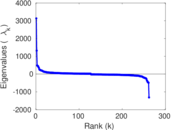
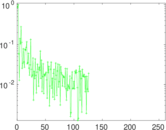
Matrix decompositions plots


Downloads
References
|
[1]
|
Jérôme Kunegis.
KONECT – The Koblenz Network Collection.
In Proc. Int. Conf. on World Wide Web Companion, pages
1343–1350, 2013.
[ http ]
|
|
[2]
|
Wikimedia Foundation.
Wikimedia downloads.
http://dumps.wikimedia.org/, January 2010.
|
 KONECT ‣ Networks ‣
Buy Me a Coffee
KONECT ‣ Networks ‣
Buy Me a Coffee