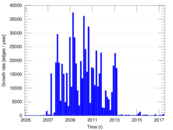
Wikipedia edits (pi)
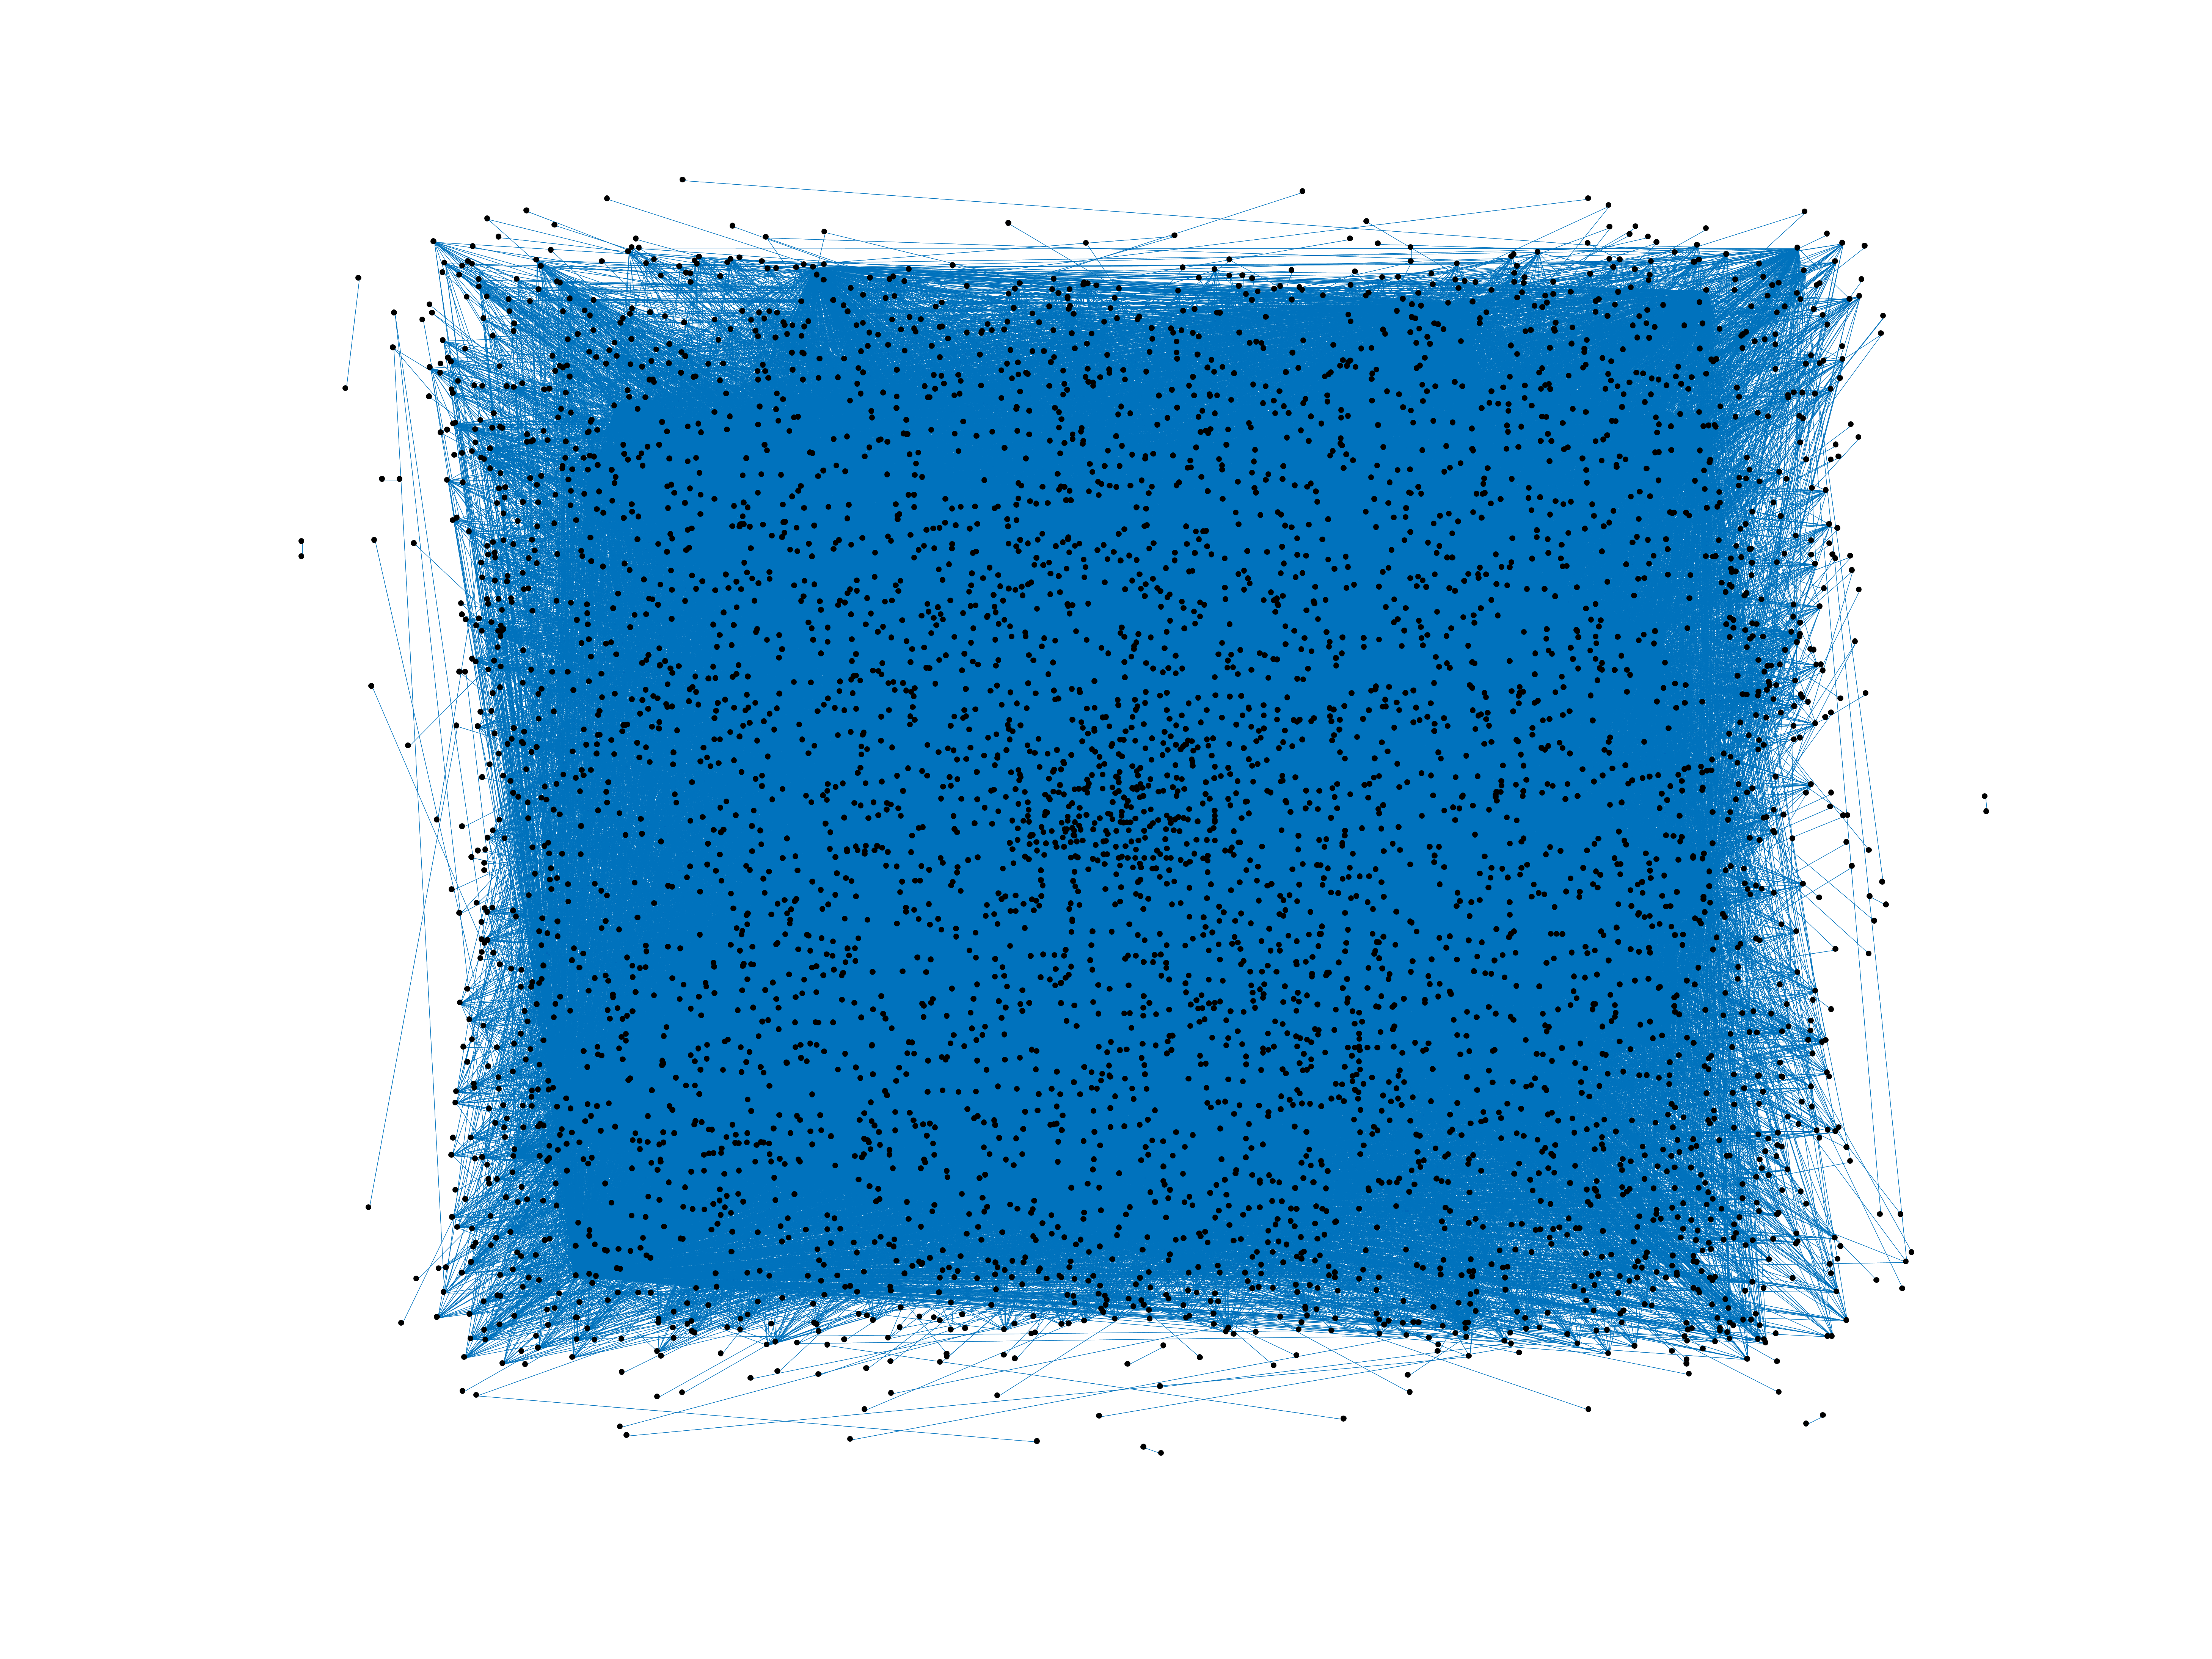
This is the bipartite edit network of the Pali Wikipedia. It contains users and
pages from the Pali Wikipedia, connected by edit events. Each edge represents
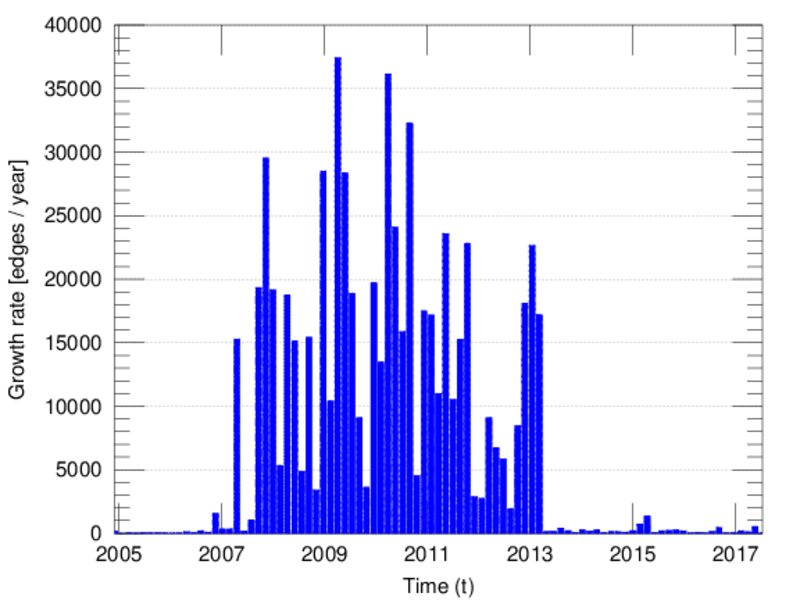
an edit. The dataset includes the timestamp of each edit.
Metadata
Statistics
| Size | n = | 4,912
|
| Left size | n1 = | 516
|
| Right size | n2 = | 4,396
|
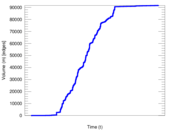
| Volume | m = | 91,685
|
| Unique edge count | m̿ = | 44,142
|
| Wedge count | s = | 30,953,805
|
| Claw count | z = | 17,996,949,094
|
| Cross count | x = | 8,548,398,675,173
|
| Square count | q = | 188,889,831
|
| 4-Tour count | T4 = | 1,635,051,724
|
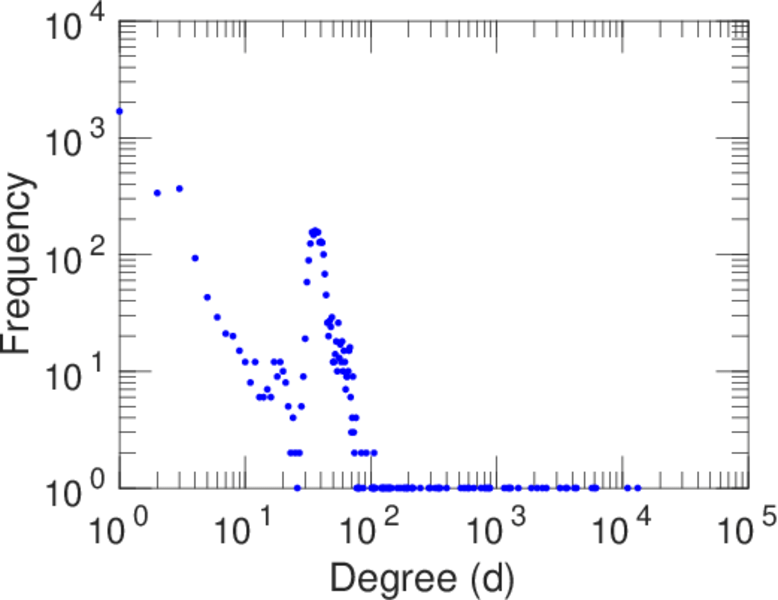
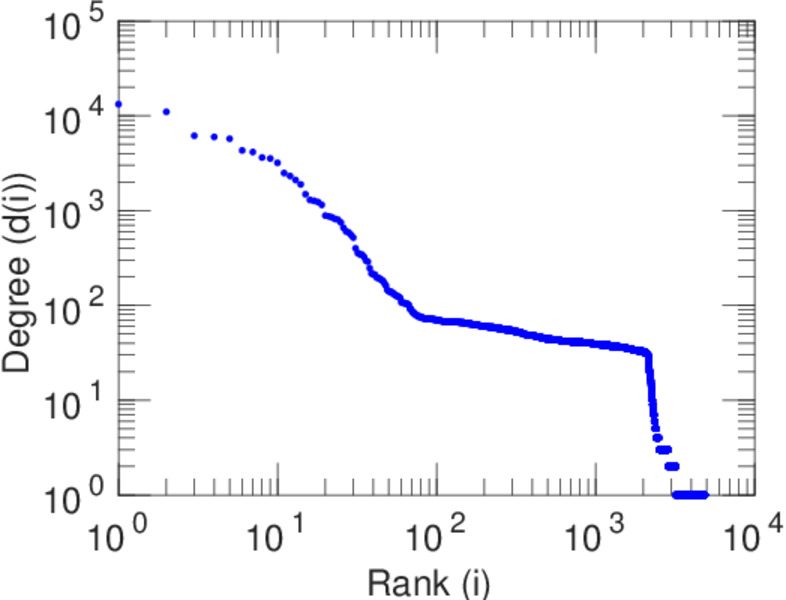
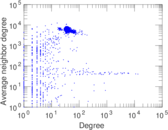
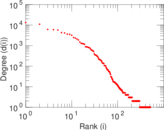
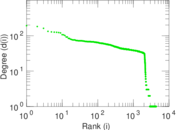
| Maximum degree | dmax = | 13,255
|
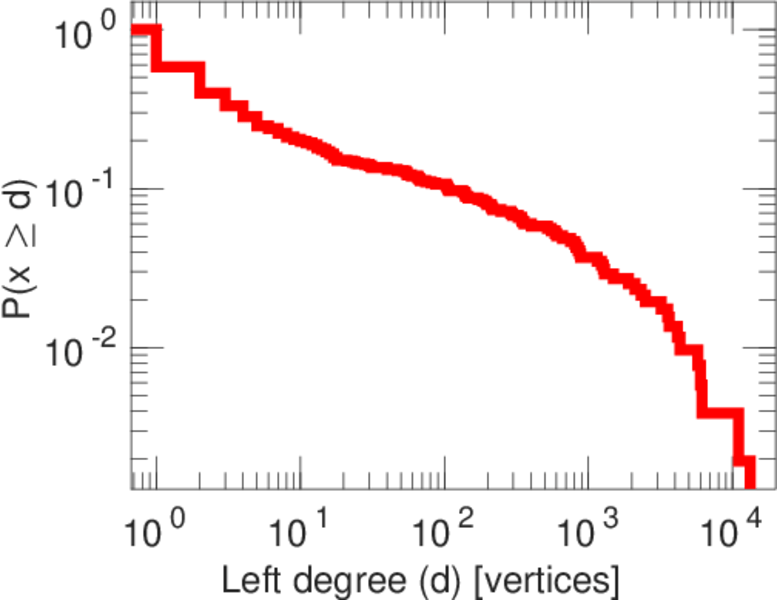
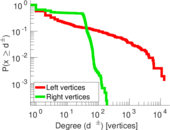
| Maximum left degree | d1max = | 13,255
|
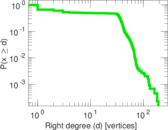
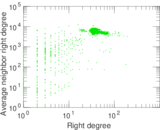
| Maximum right degree | d2max = | 192
|
| Average degree | d = | 37.331 0
|
| Average left degree | d1 = | 177.684
|
| Average right degree | d2 = | 20.856 5
|
| Fill | p = | 0.019 460 1
|
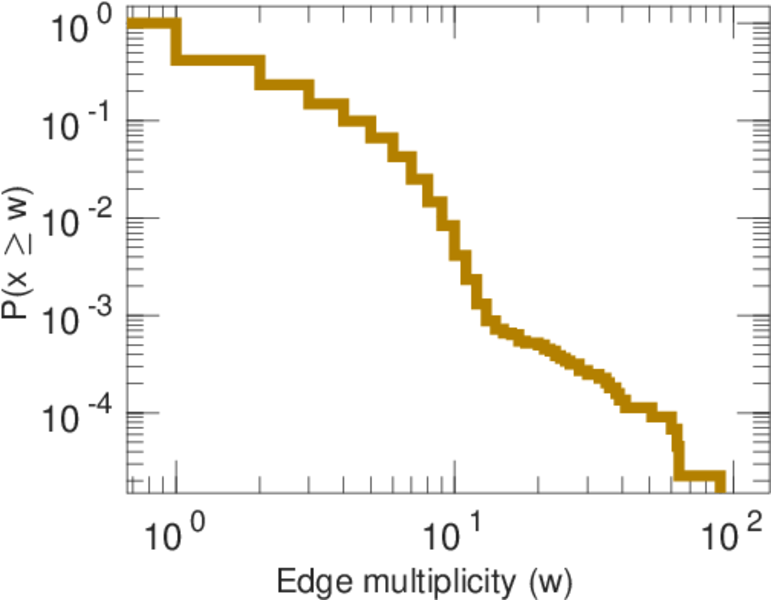
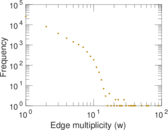
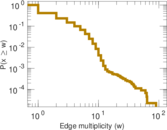
| Average edge multiplicity | m̃ = | 2.077 05
|
| Size of LCC | N = | 4,366
|
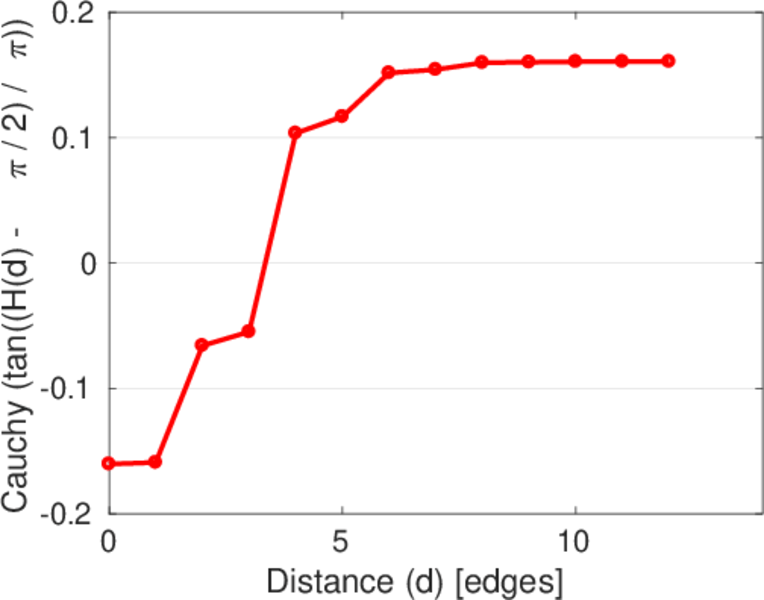
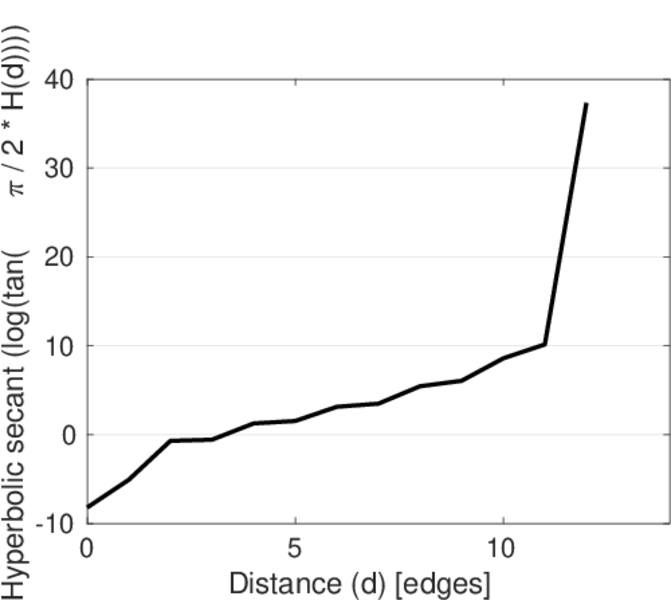
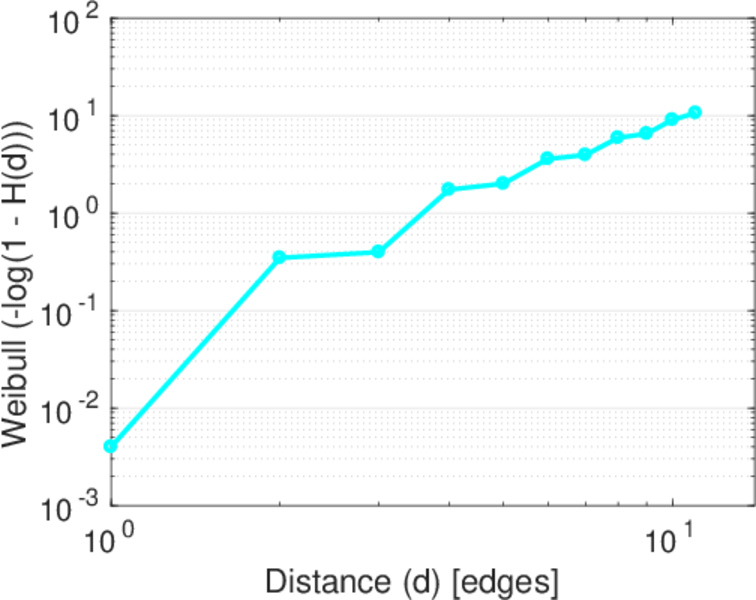
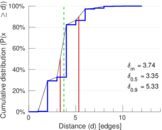
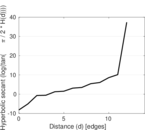
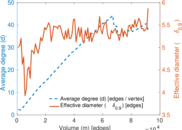
| Diameter | δ = | 13
|
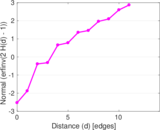
| 50-Percentile effective diameter | δ0.5 = | 3.347 91
|
| 90-Percentile effective diameter | δ0.9 = | 5.328 23
|
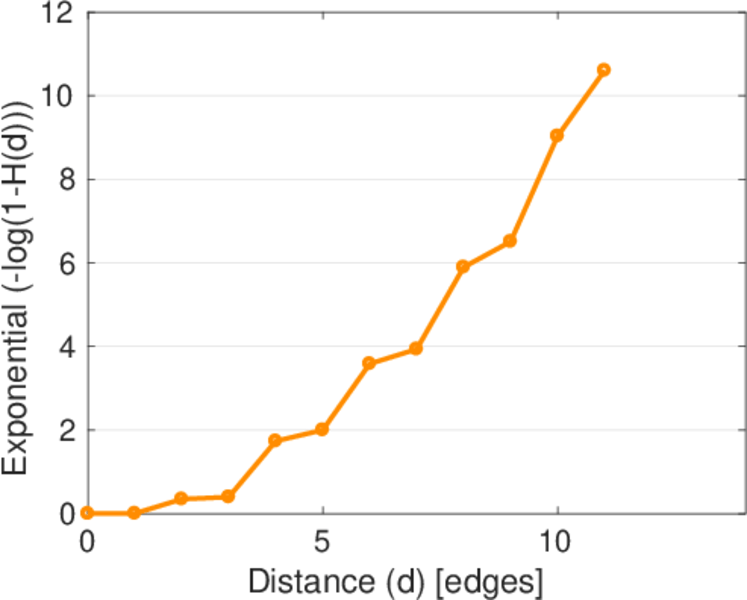
| Median distance | δM = | 4
|
| Mean distance | δm = | 3.739 03
|
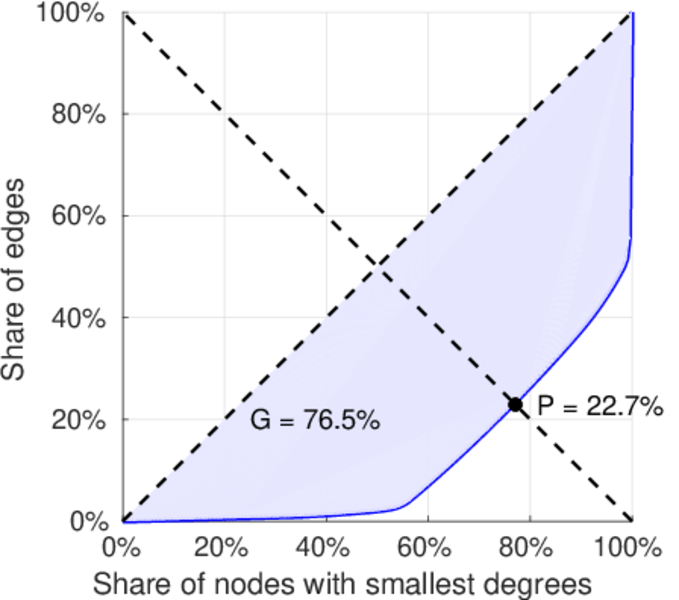
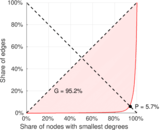
| Gini coefficient | G = | 0.747 600
|
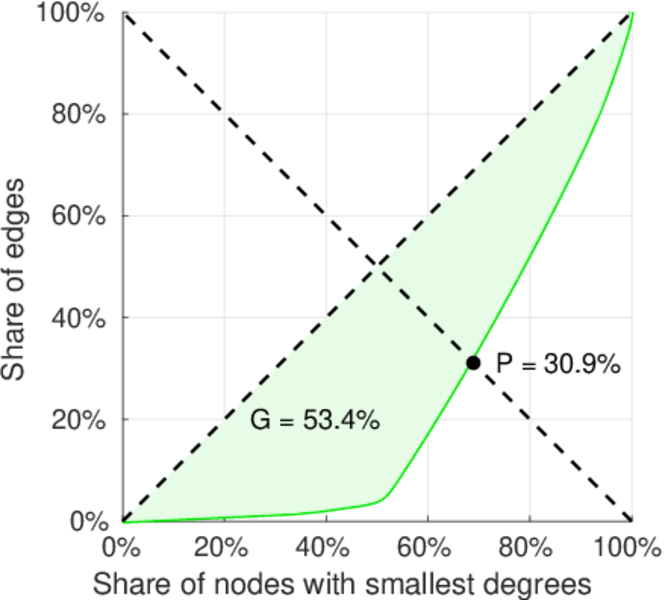
| Balanced inequality ratio | P = | 0.236 309
|
| Left balanced inequality ratio | P1 = | 0.057 108 6
|
| Right balanced inequality ratio | P2 = | 0.309 342
|
| Relative edge distribution entropy | Her = | 0.771 071
|
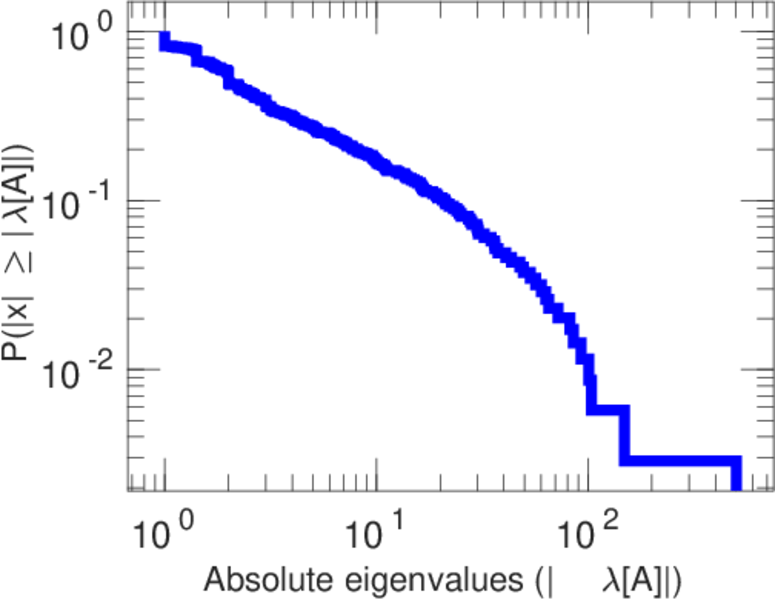
| Power law exponent | γ = | 1.658 43
|
| Tail power law exponent | γt = | 1.551 00
|
| Tail power law exponent with p | γ3 = | 1.551 00
|
| p-value | p = | 0.007 000 00
|
| Left tail power law exponent with p | γ3,1 = | 1.601 00
|
| Left p-value | p1 = | 0.000 00
|
| Right tail power law exponent with p | γ3,2 = | 8.981 00
|
| Right p-value | p2 = | 0.035 000 0
|
| Degree assortativity | ρ = | +0.172 012
|
| Degree assortativity p-value | pρ = | 2.917 20 × 10−290
|
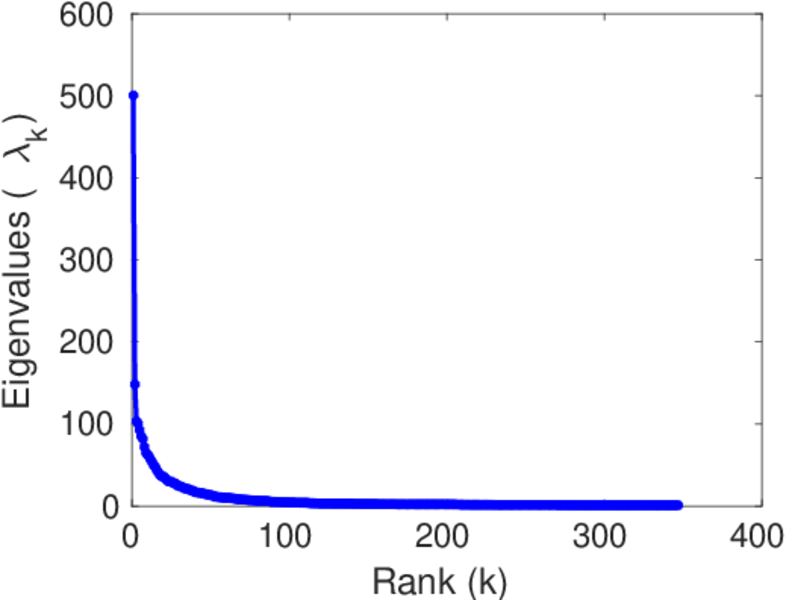
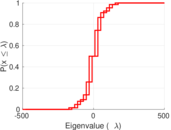
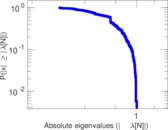
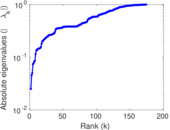
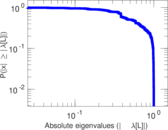
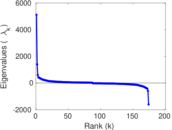
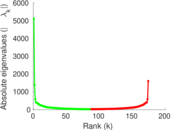
| Spectral norm | α = | 500.381
|
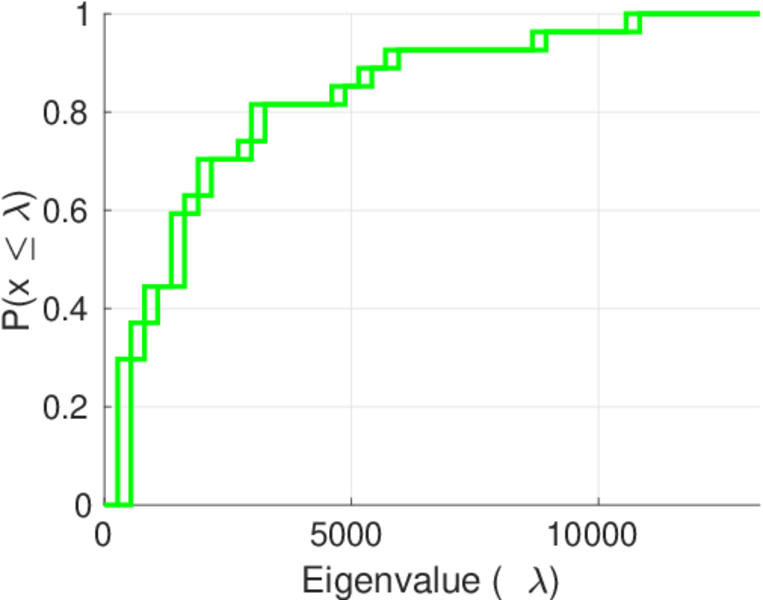
| Algebraic connectivity | a = | 0.025 021 2
|
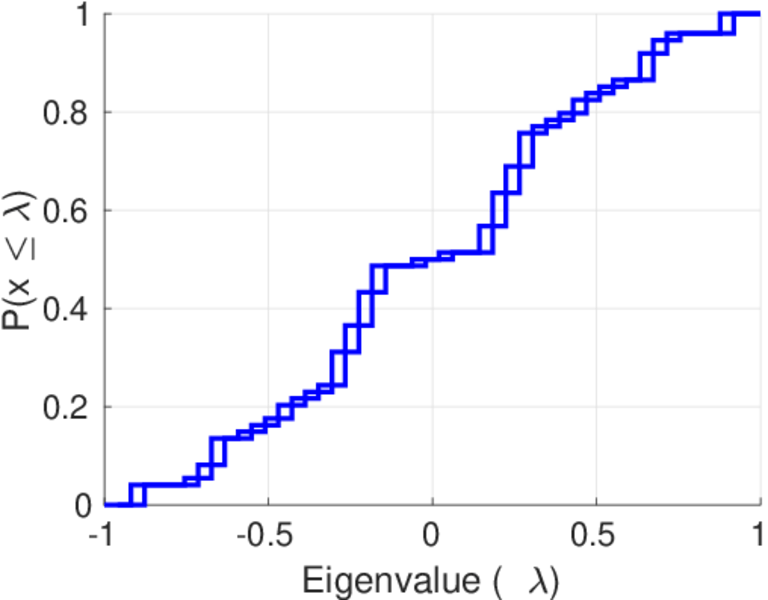
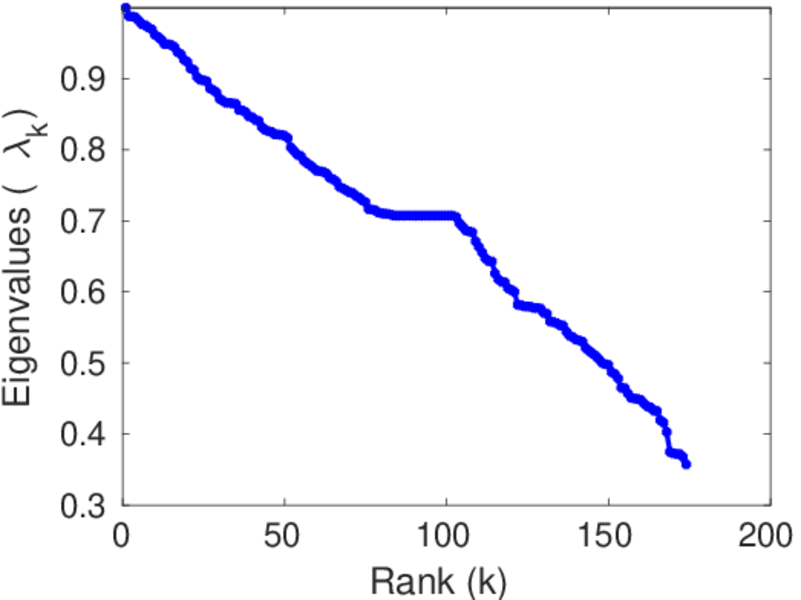
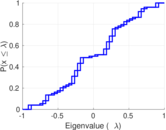
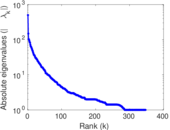
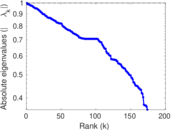
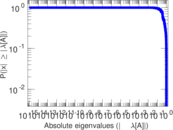
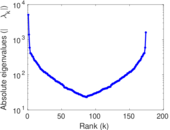
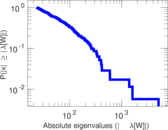
| Spectral separation | |λ1[A] / λ2[A]| = | 3.374 99
|
| Controllability | C = | 3,937
|
| Relative controllability | Cr = | 0.805 277
|
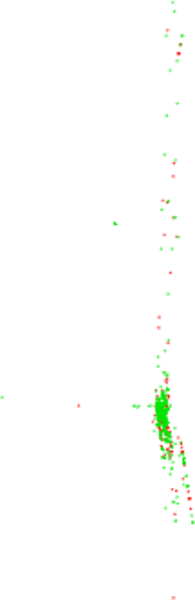
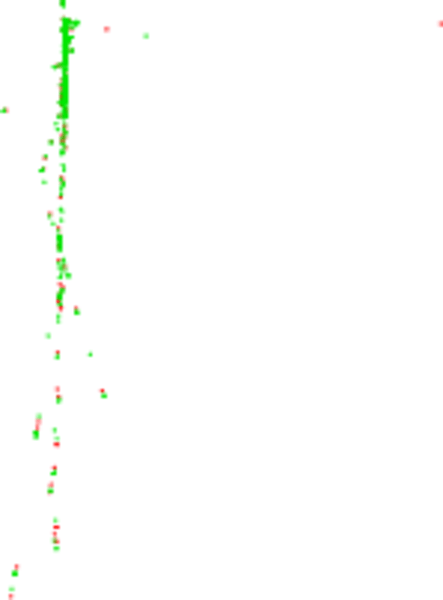
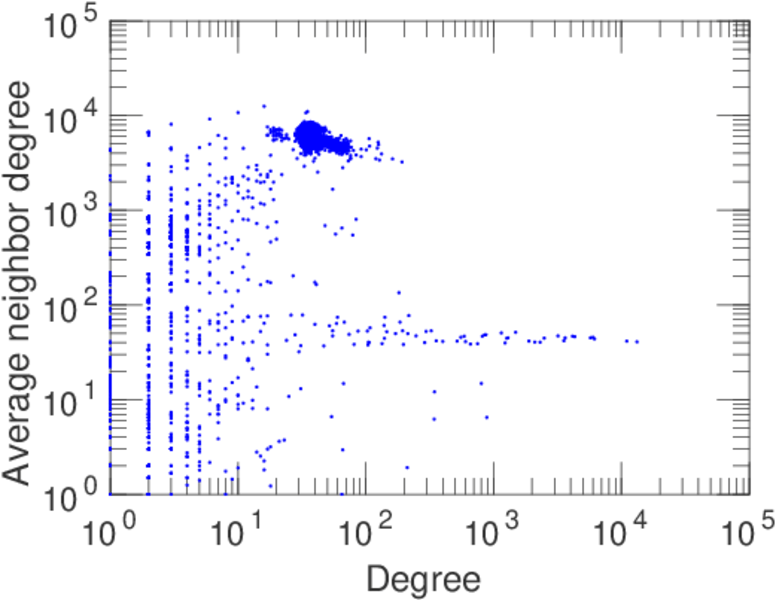
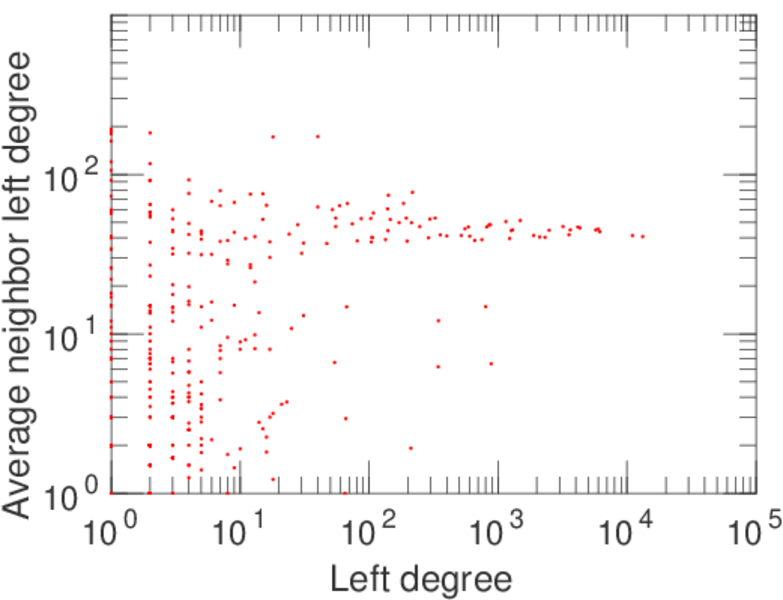
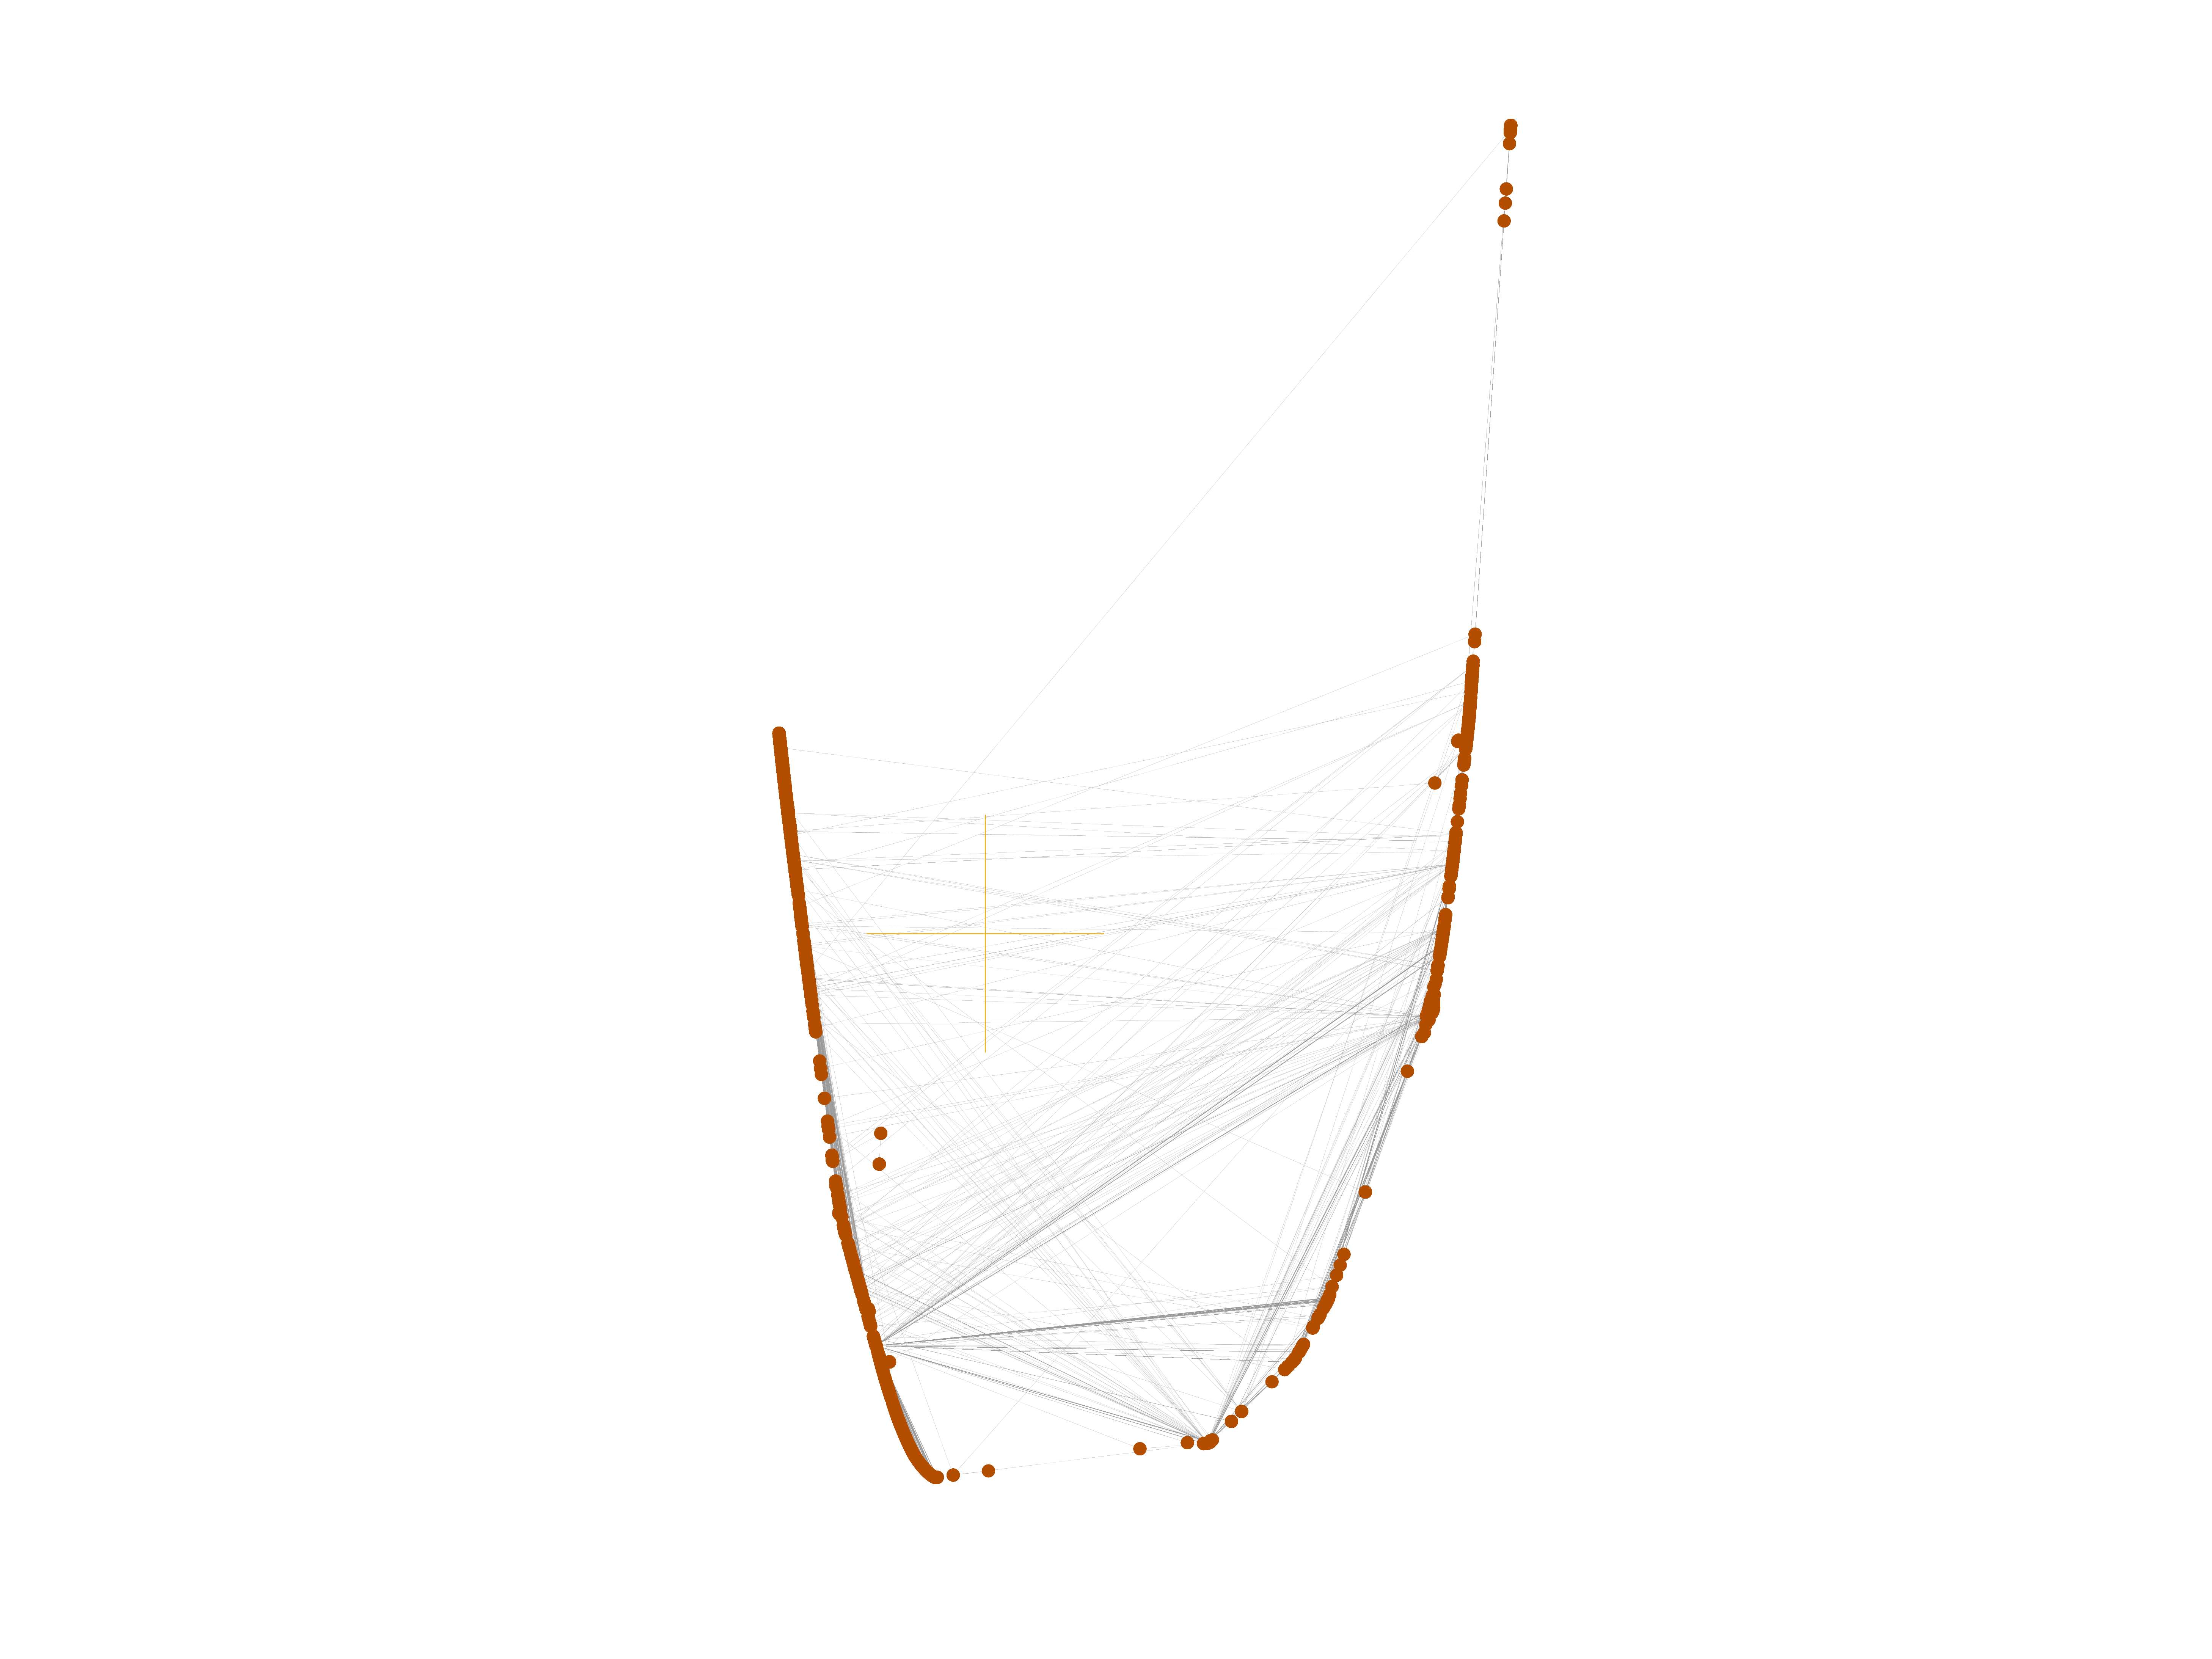
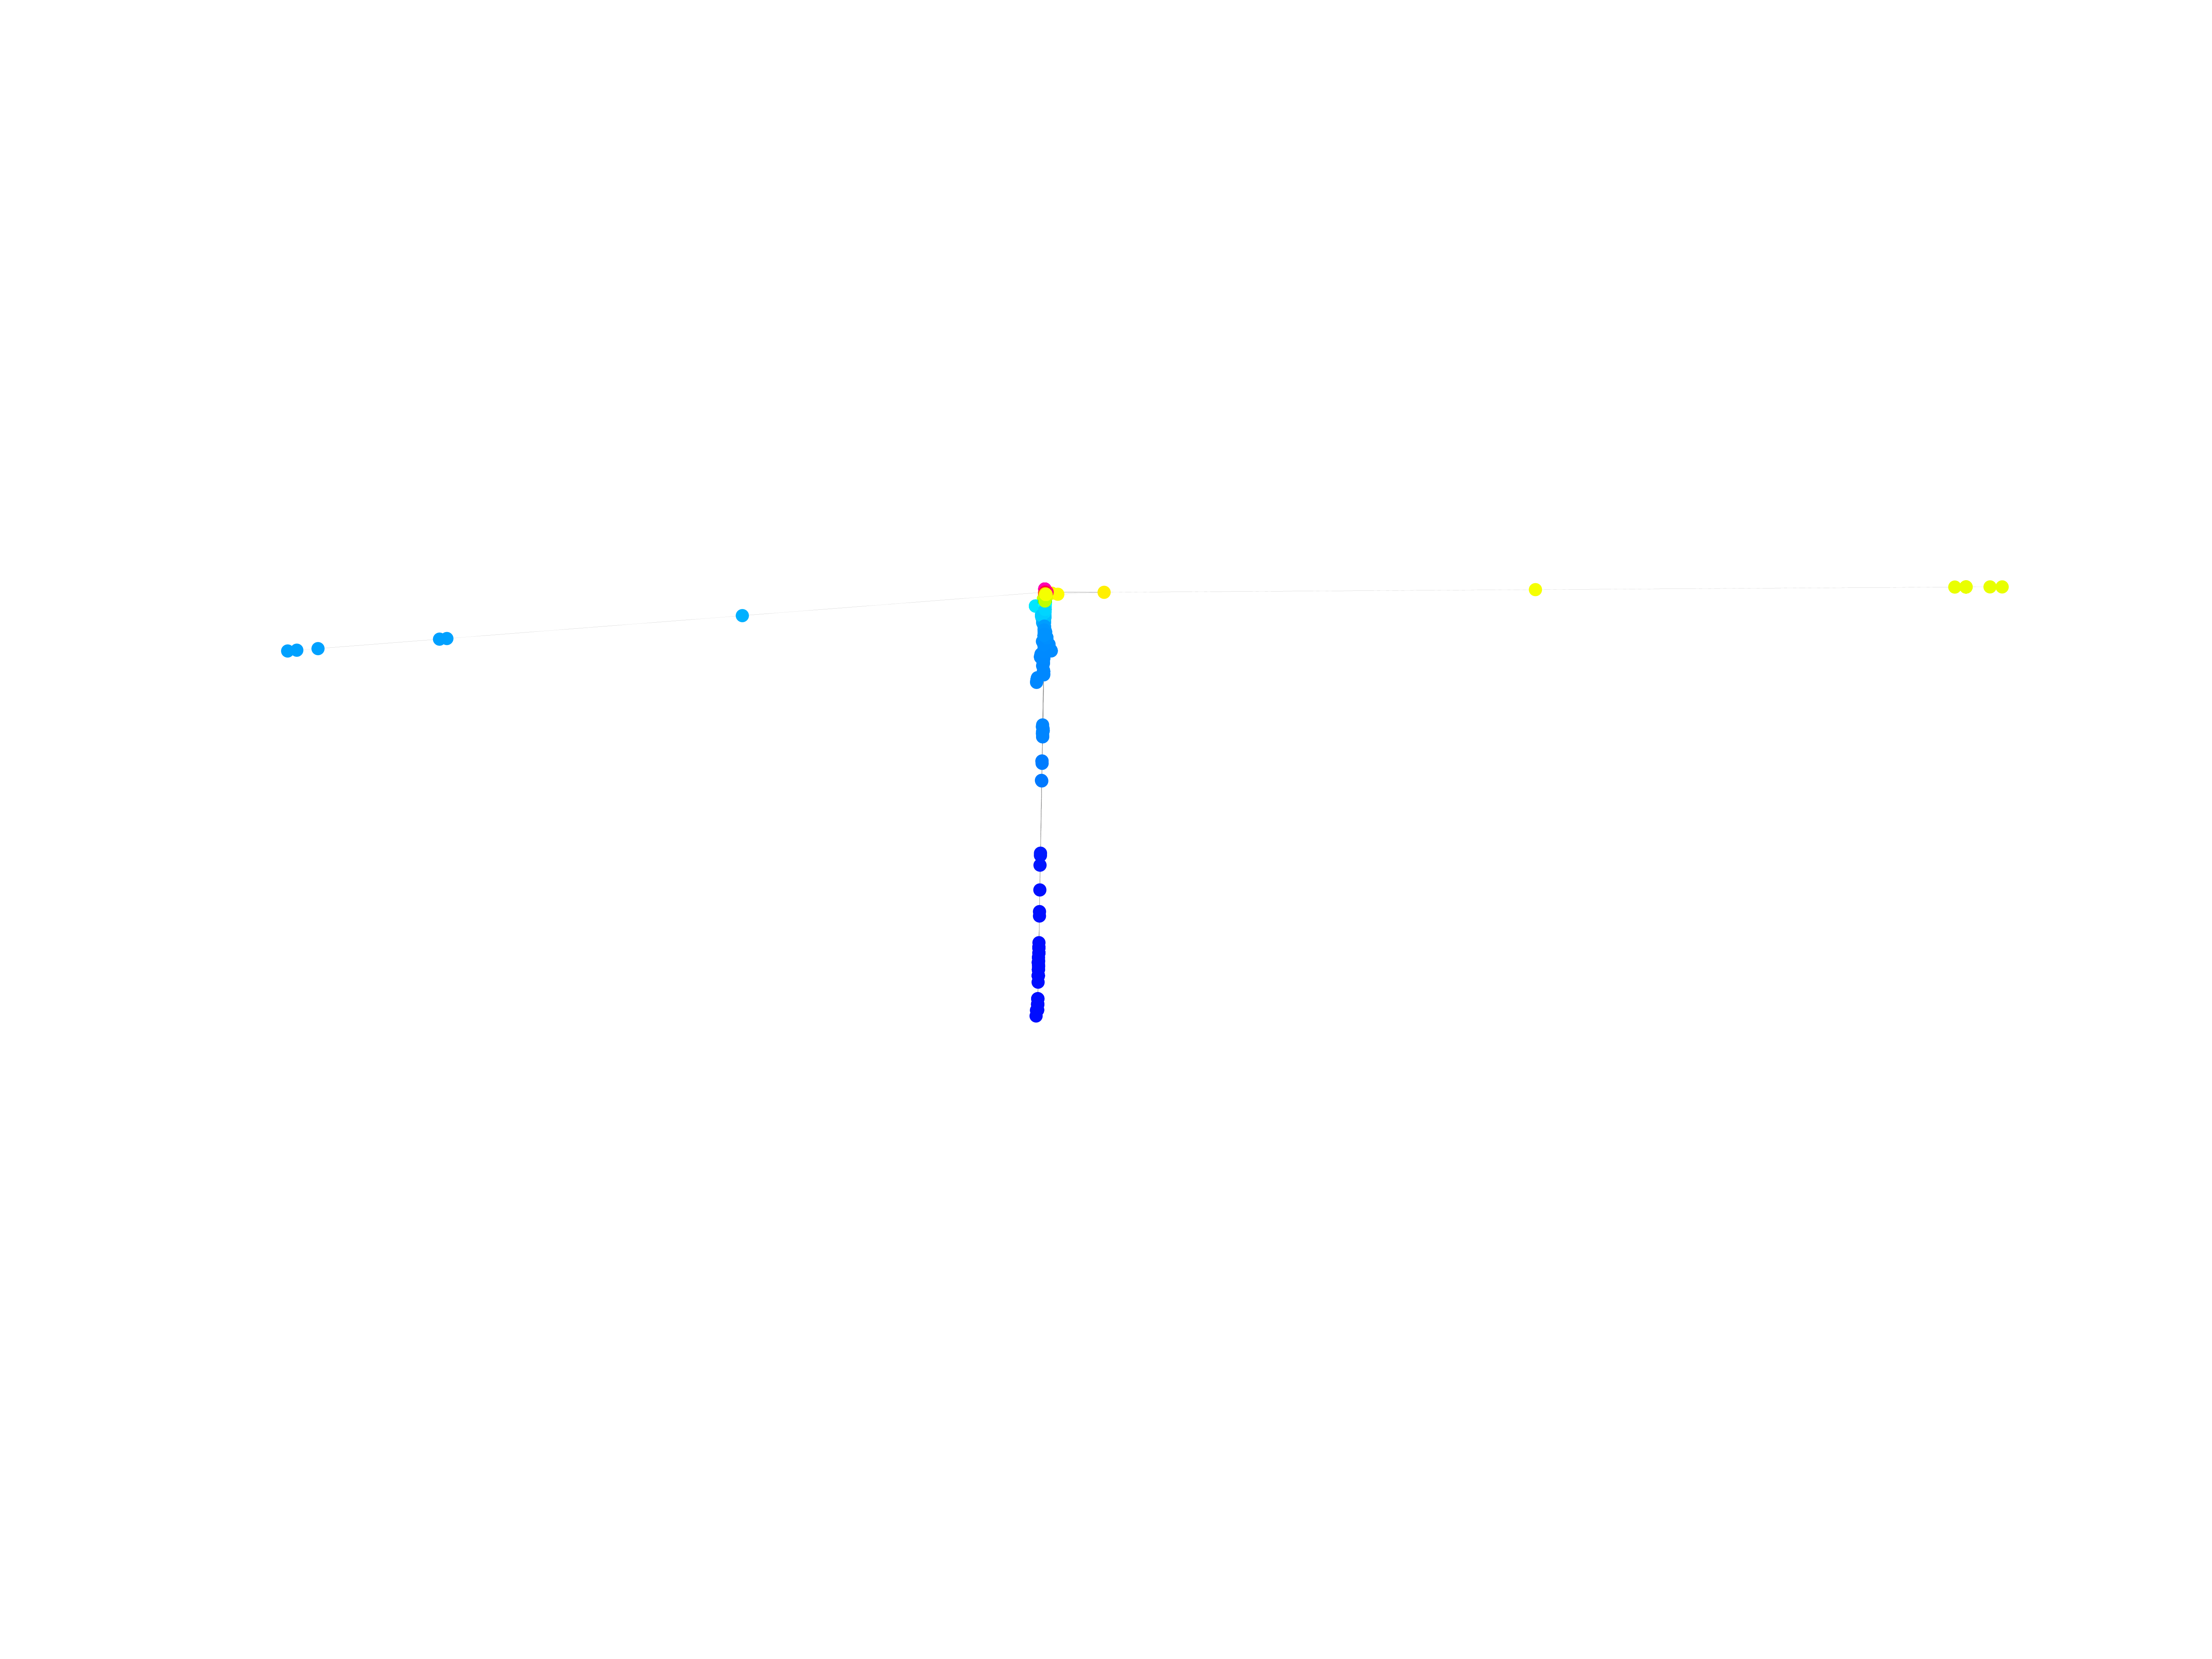
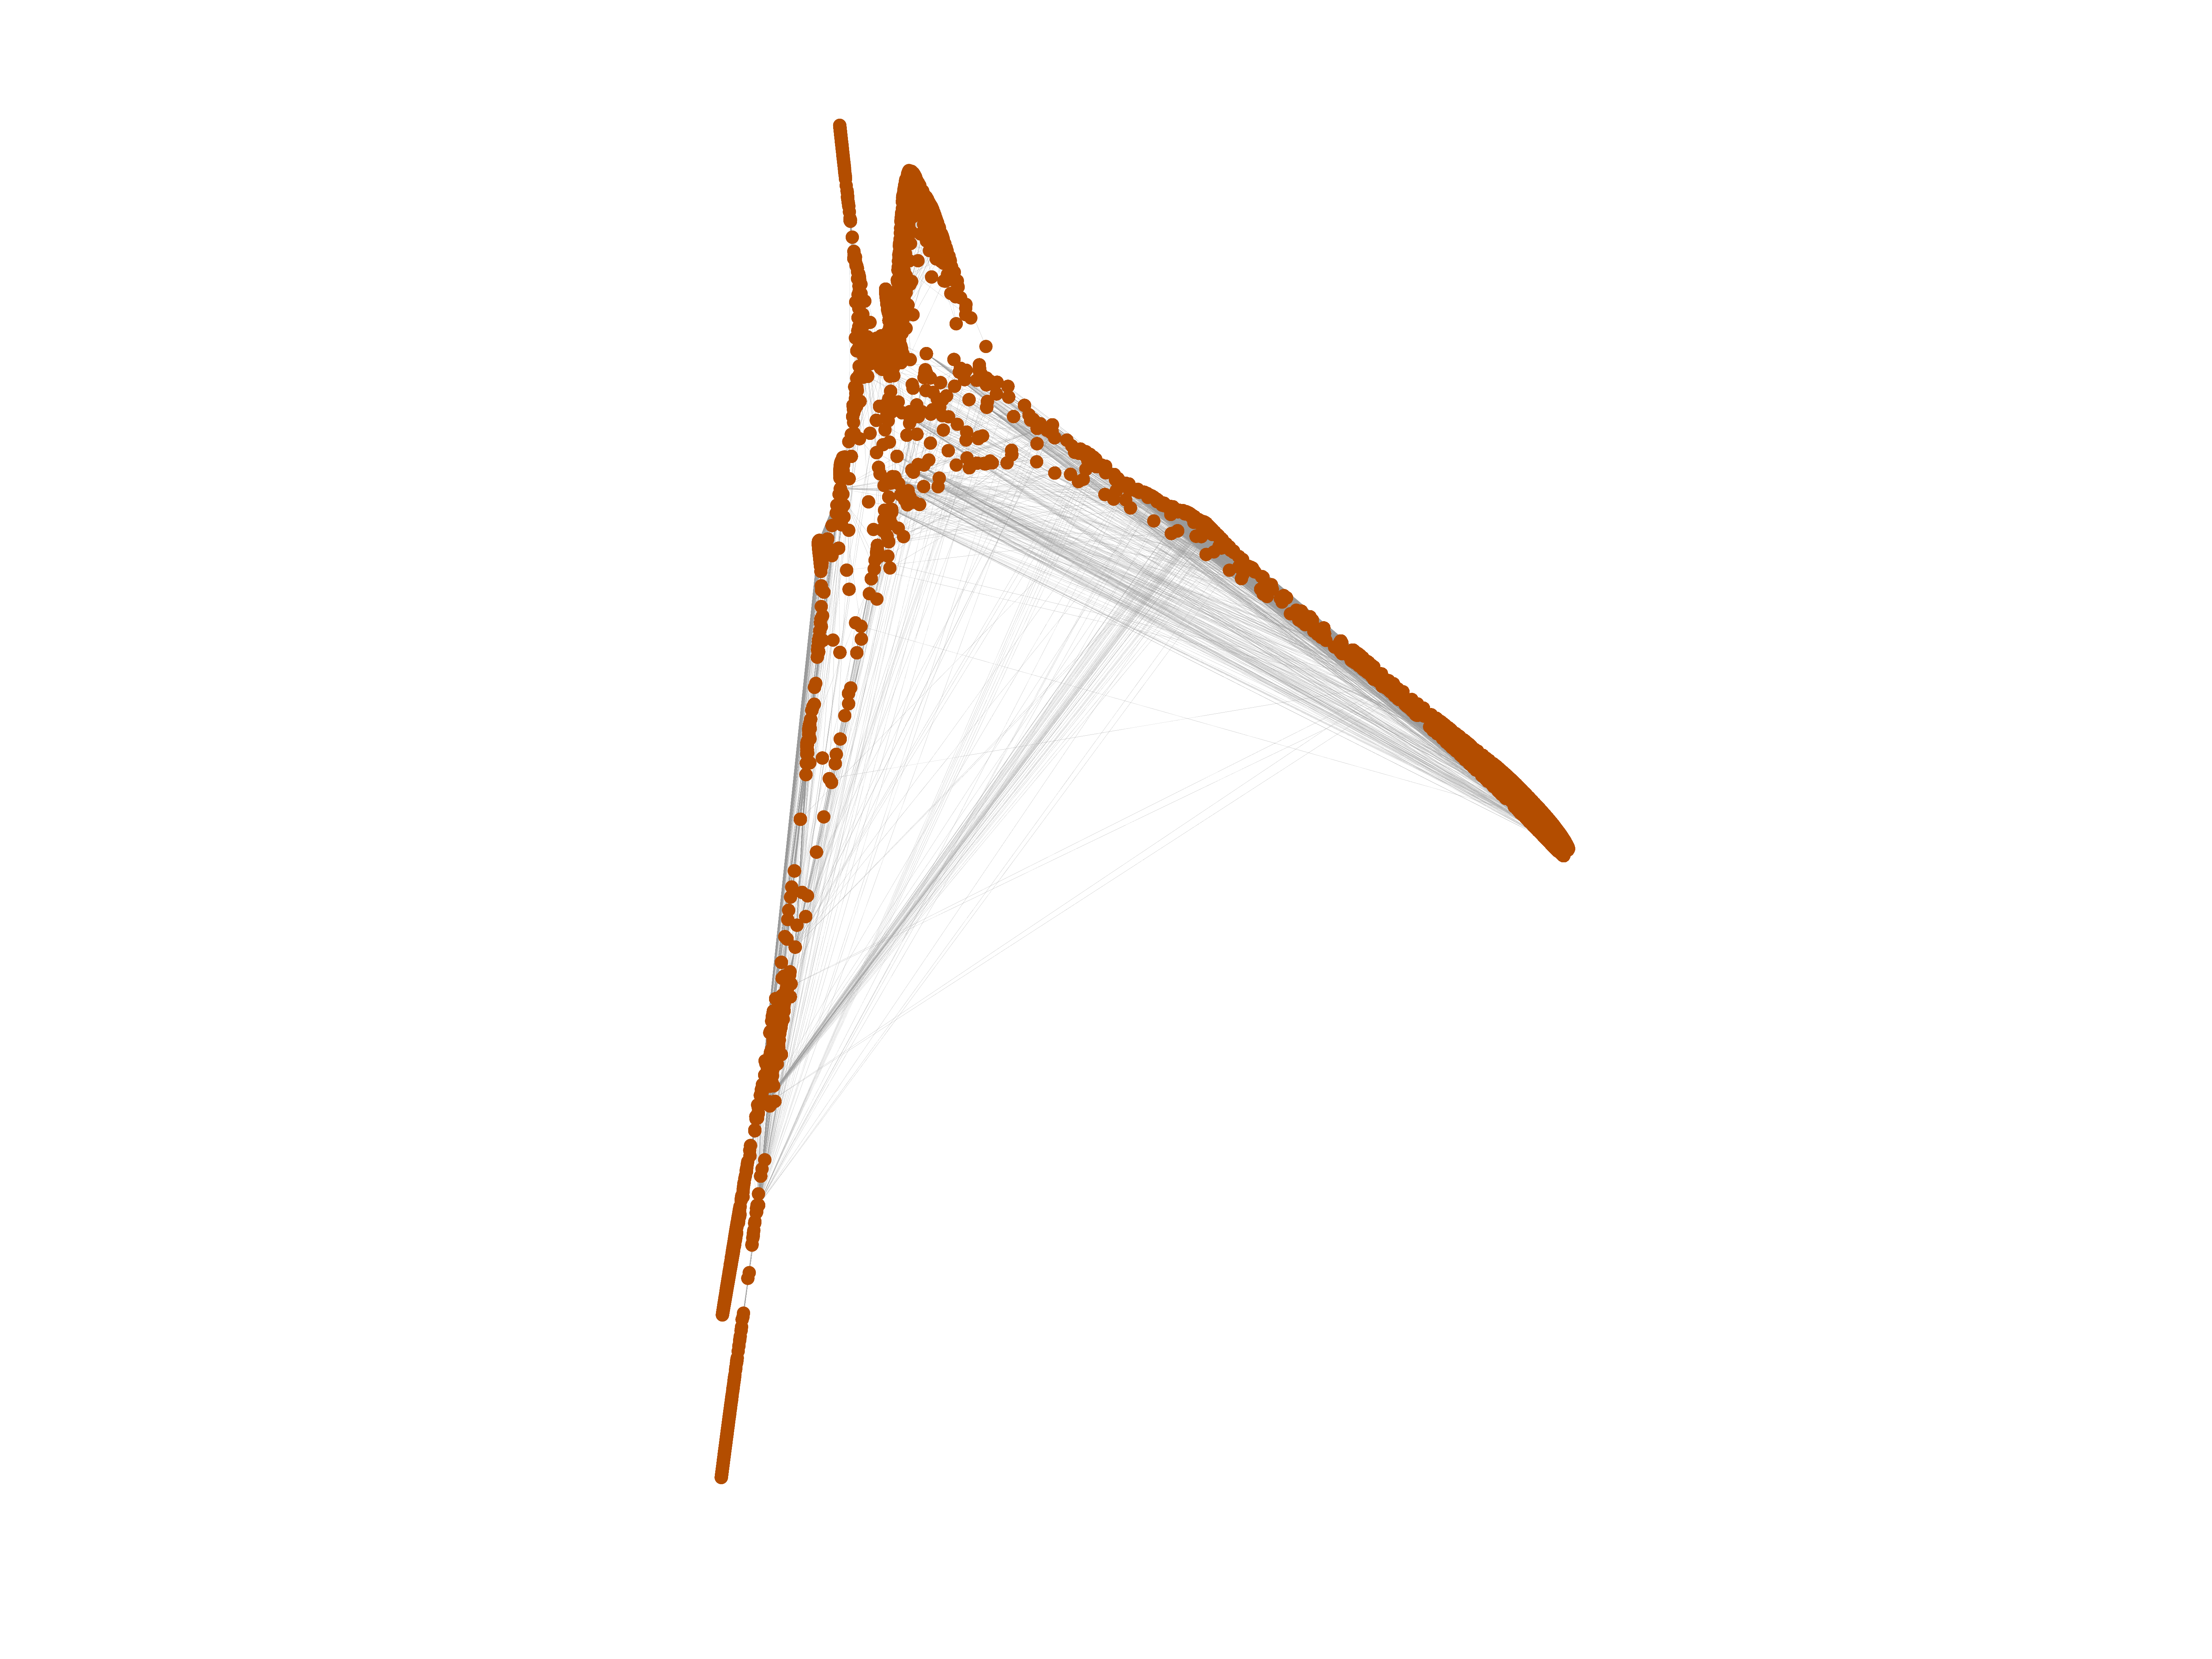
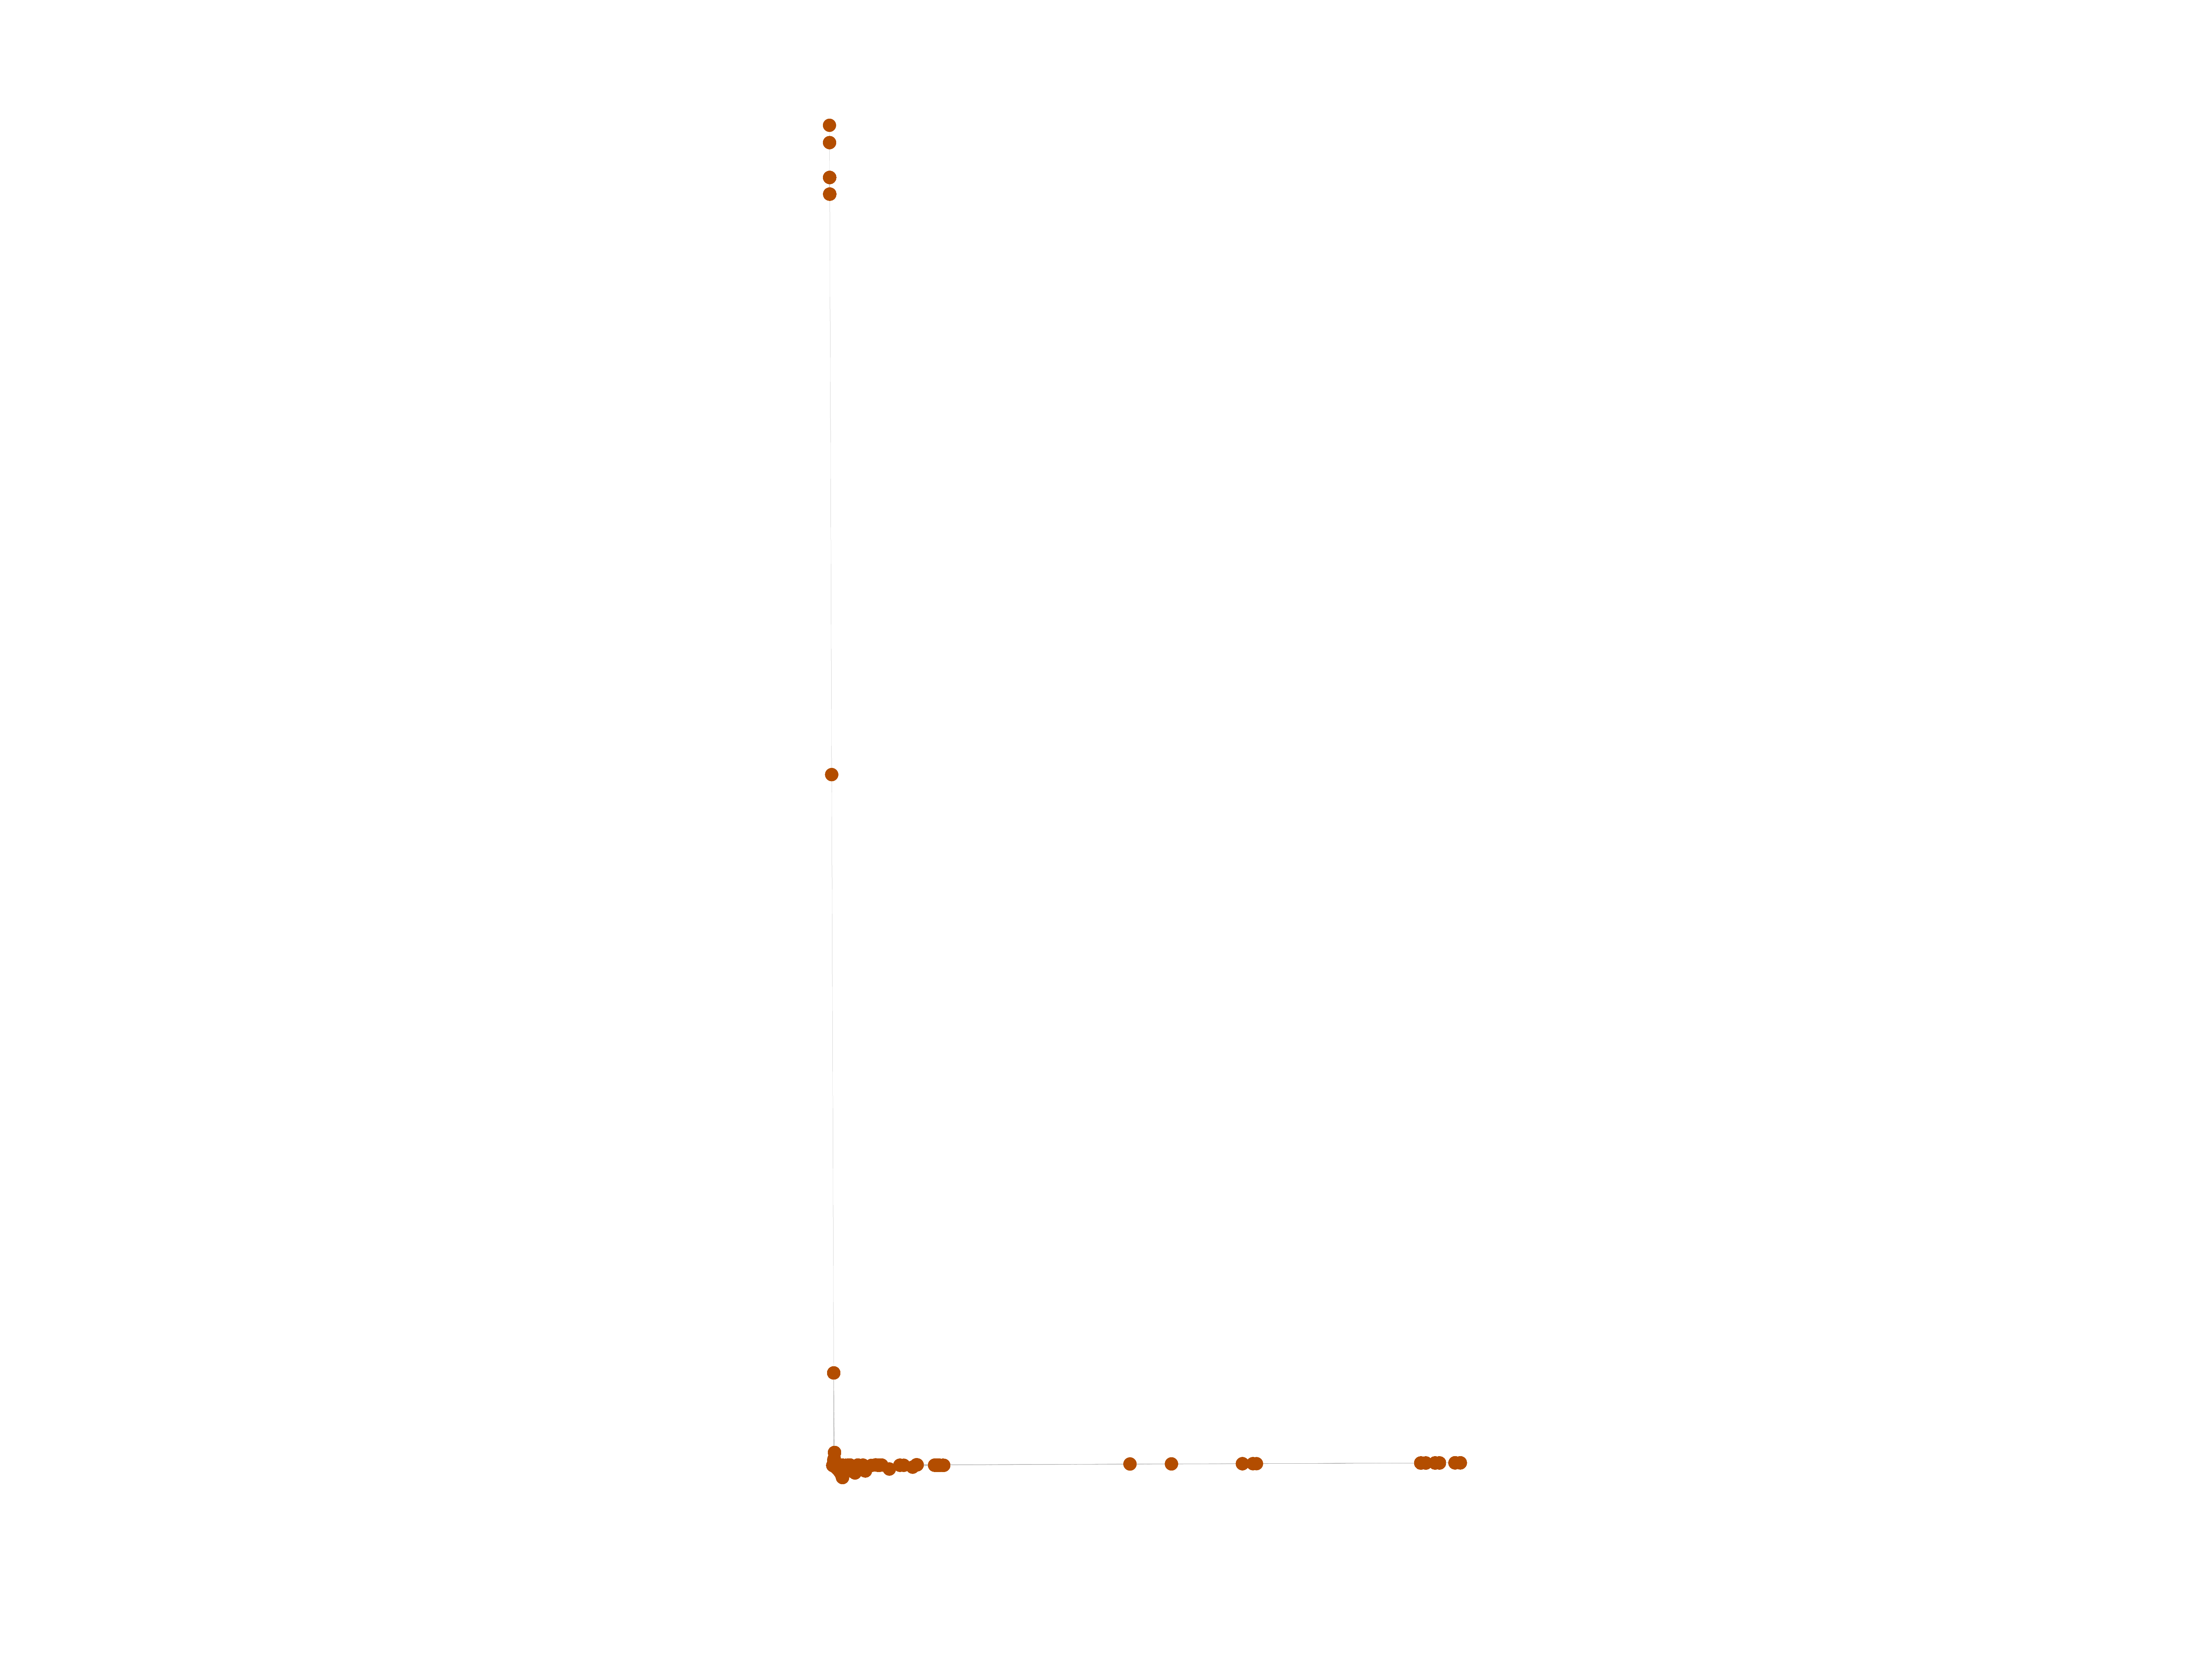
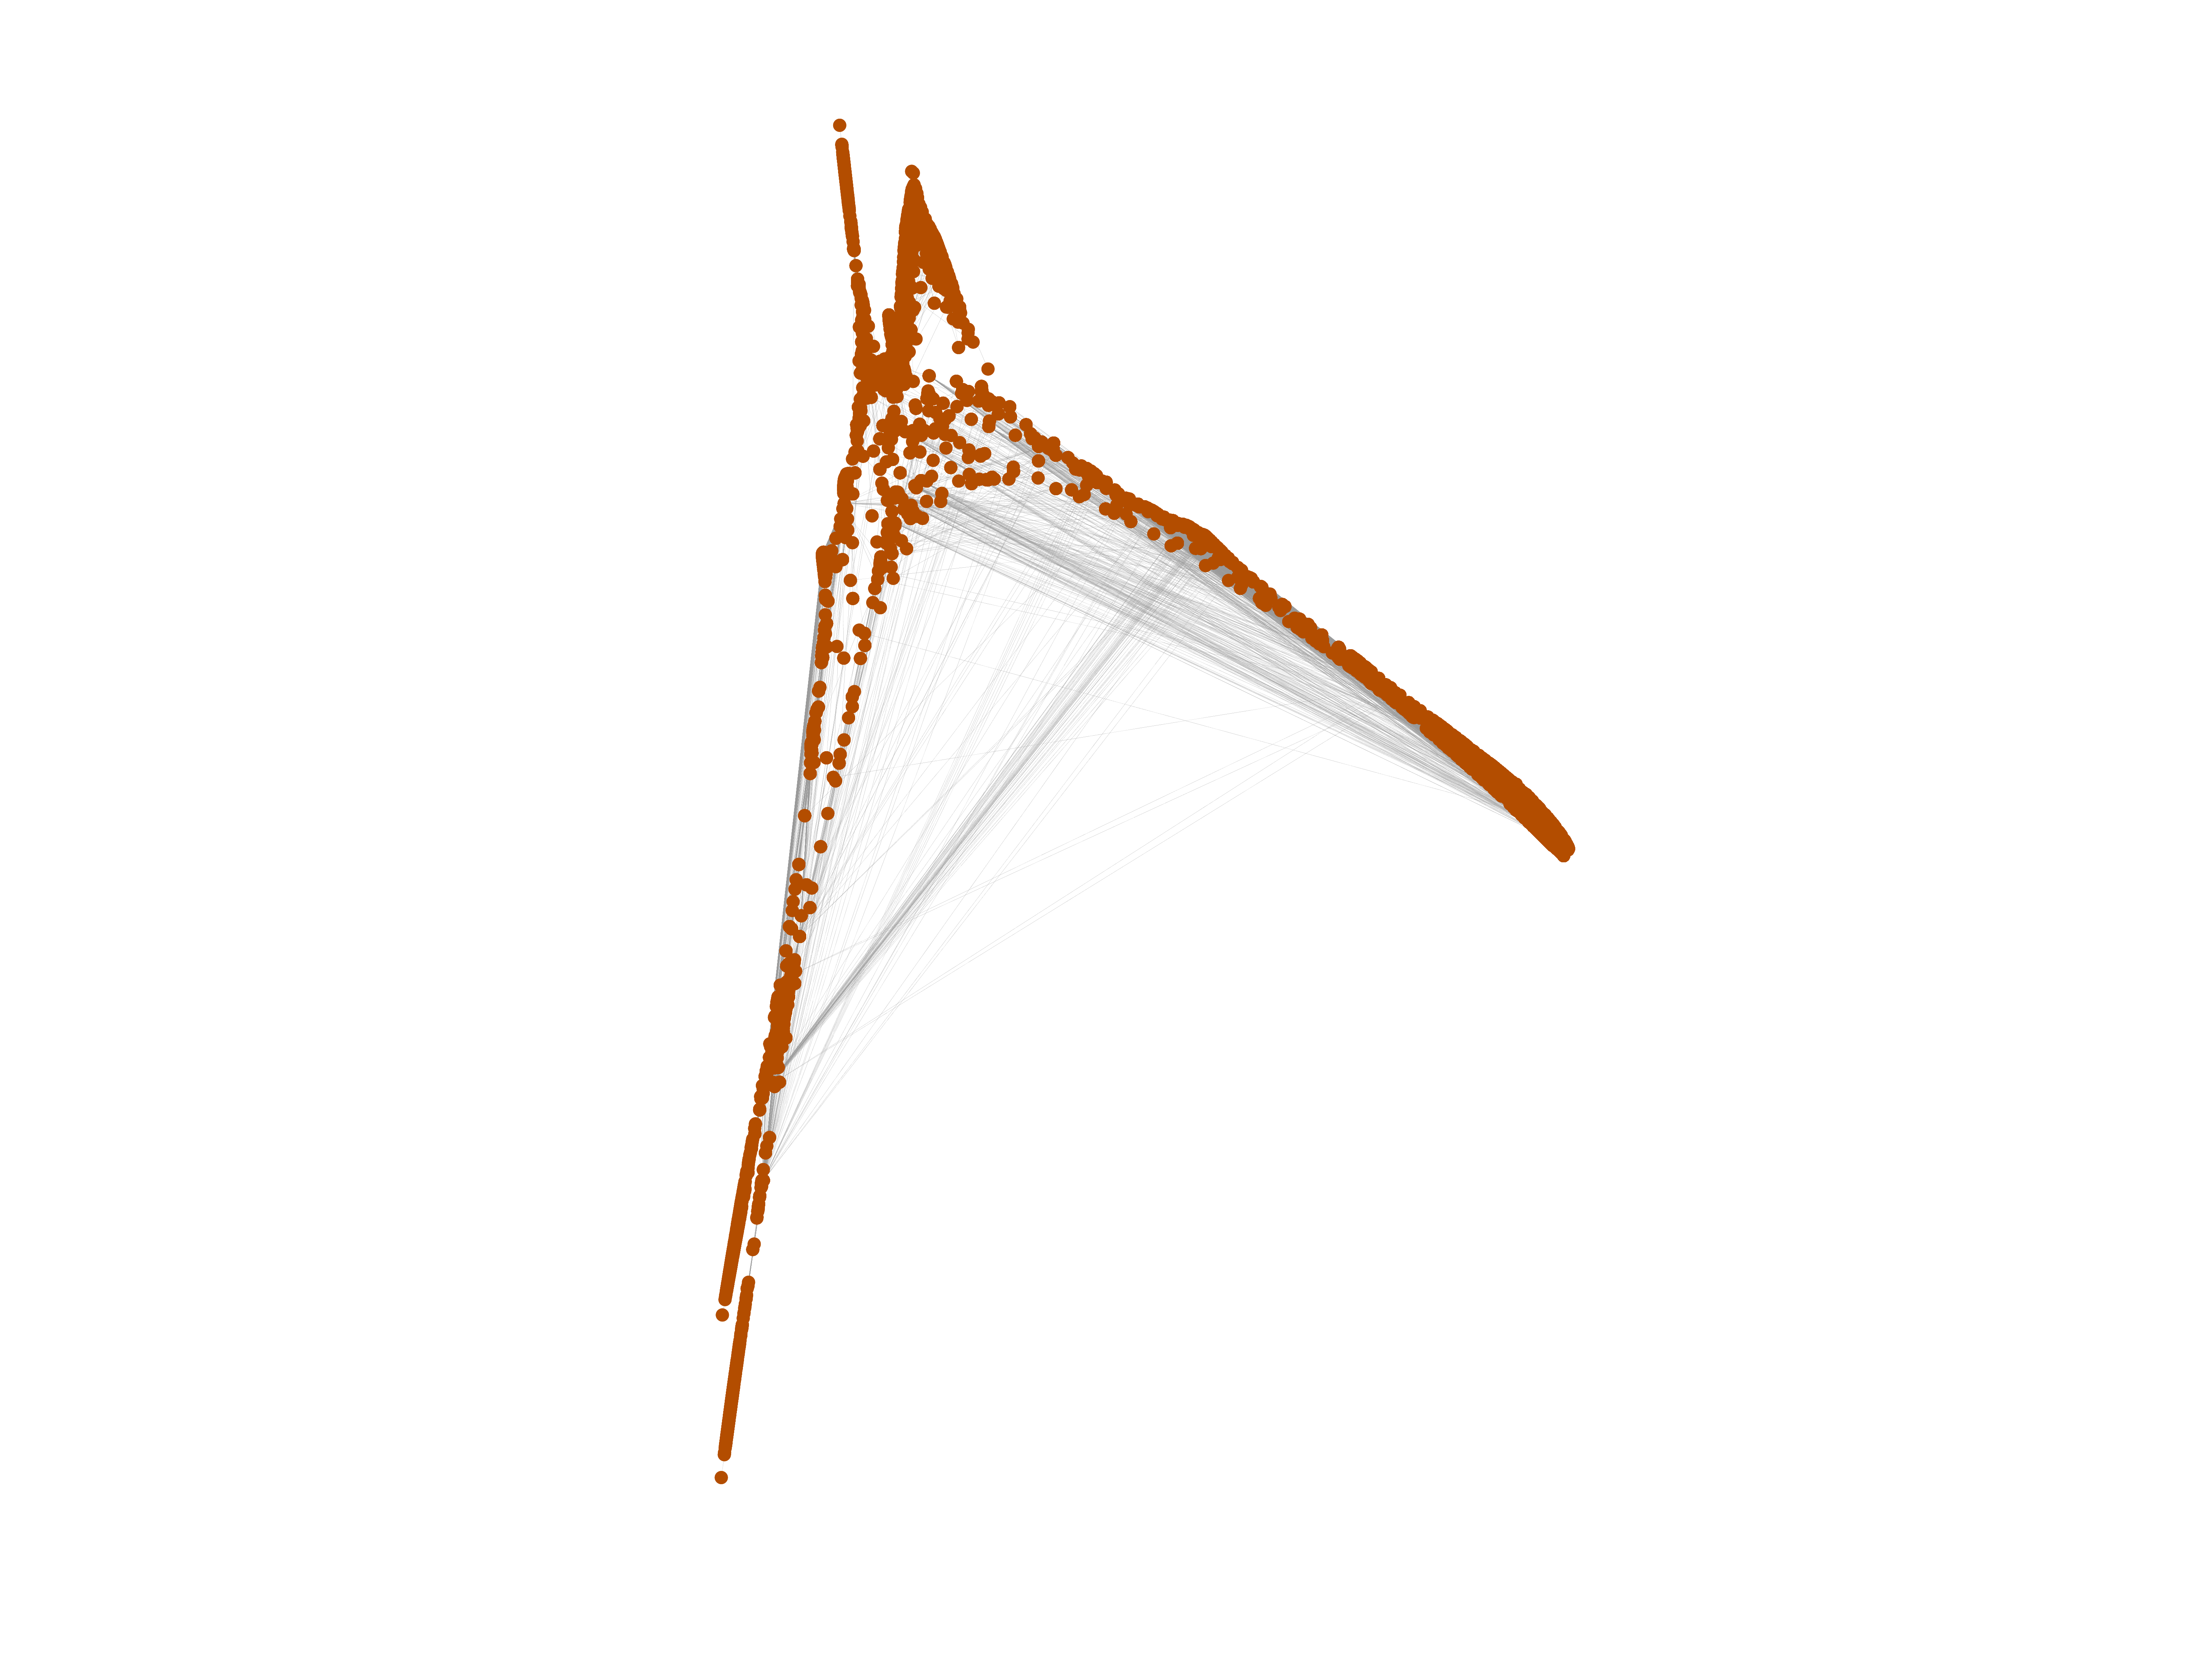
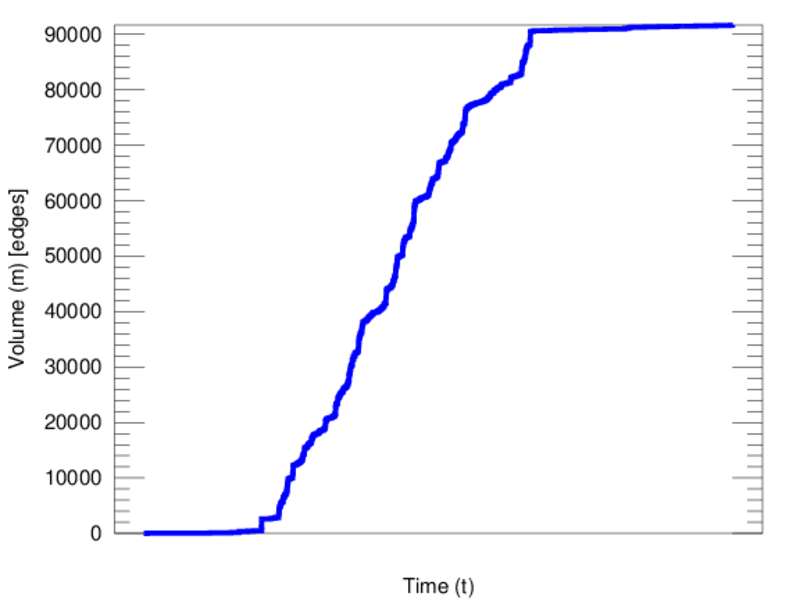
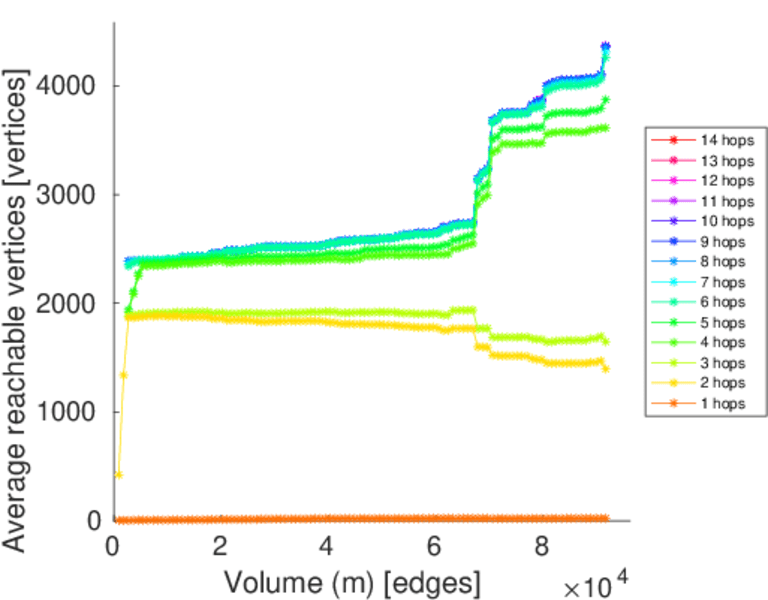
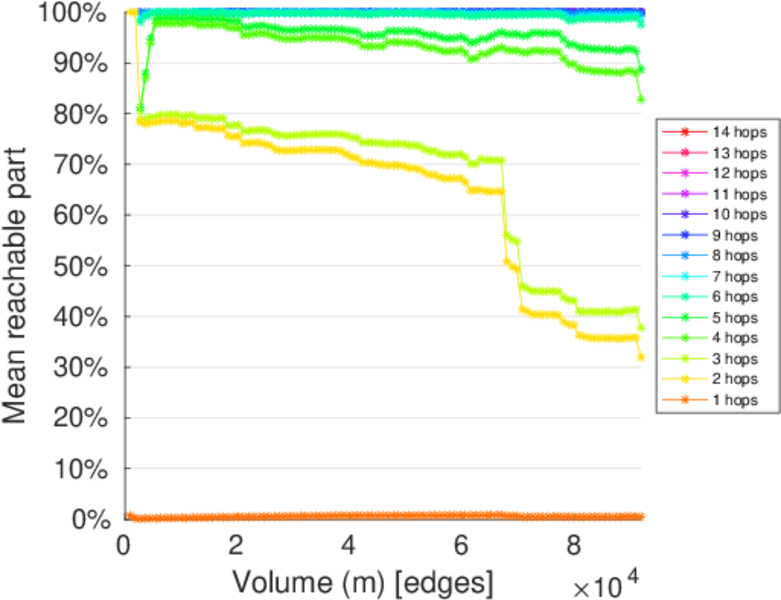
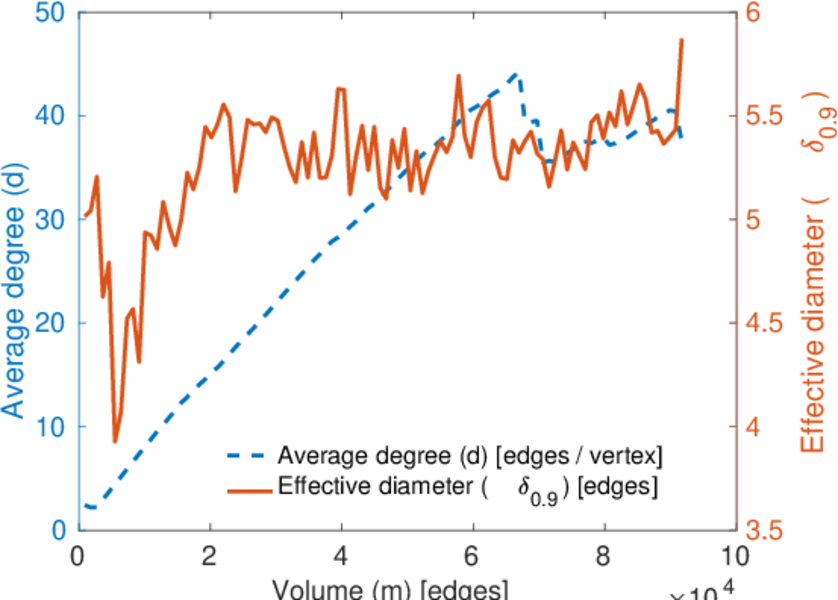
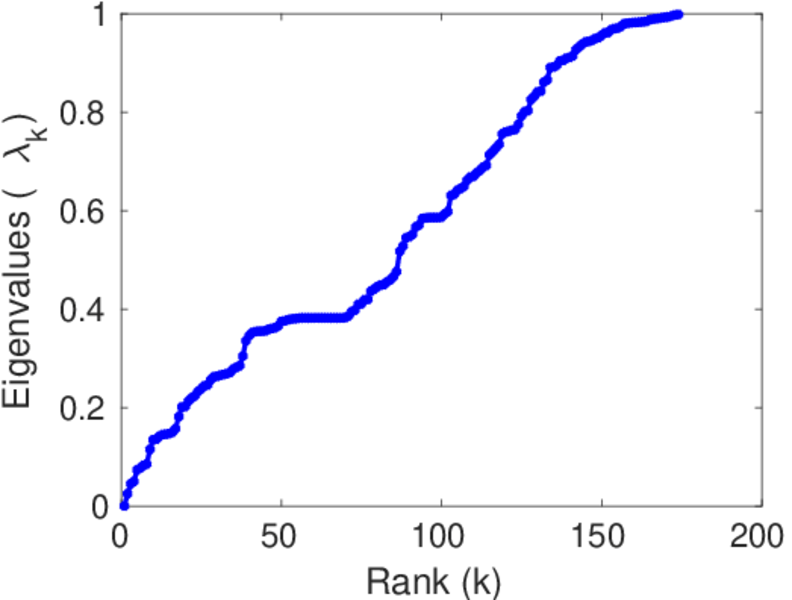
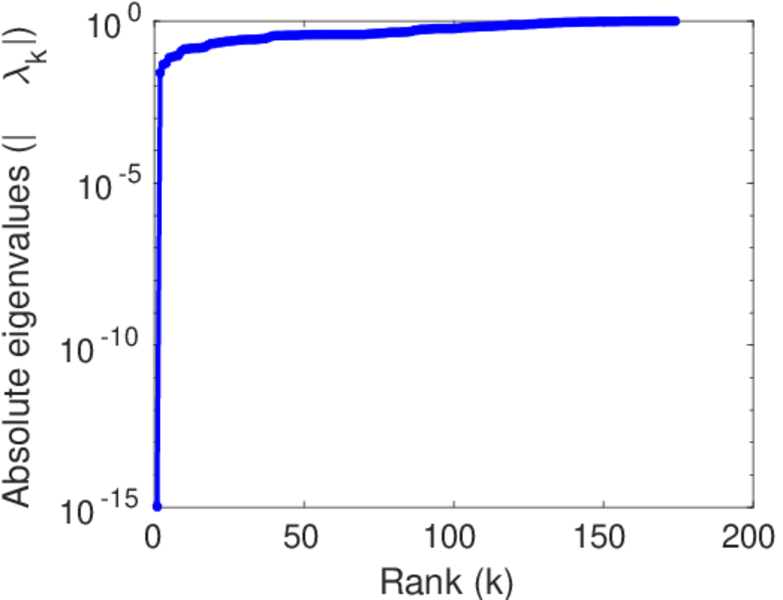
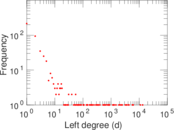
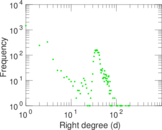
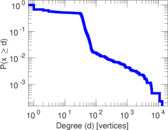
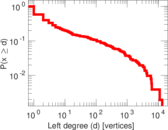
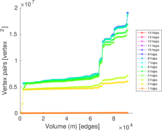
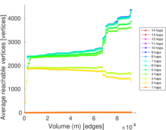
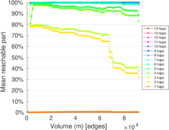
Plots


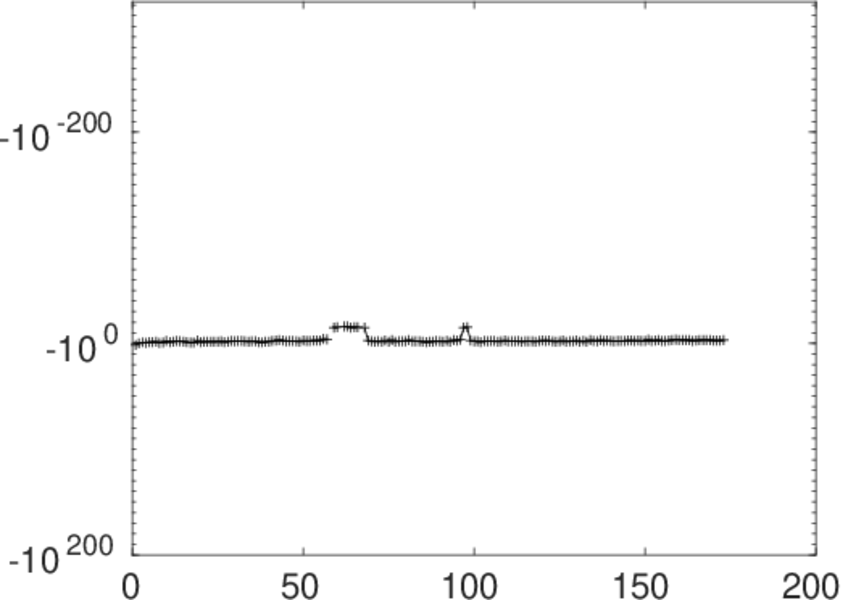
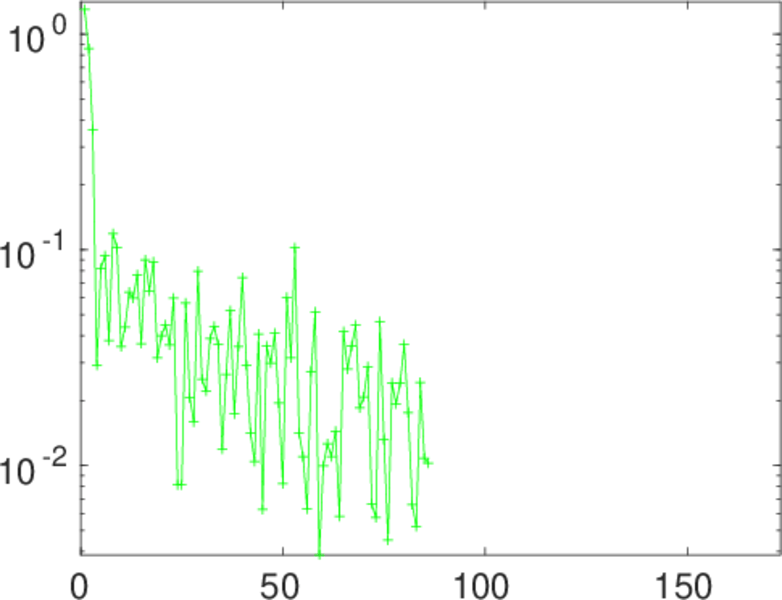
Matrix decompositions plots


Downloads
References
|
[1]
|
Jérôme Kunegis.
KONECT – The Koblenz Network Collection.
In Proc. Int. Conf. on World Wide Web Companion, pages
1343–1350, 2013.
[ http ]
|
|
[2]
|
Wikimedia Foundation.
Wikimedia downloads.
http://dumps.wikimedia.org/, January 2010.
|
 KONECT ‣ Networks ‣
Buy Me a Coffee
KONECT ‣ Networks ‣
Buy Me a Coffee