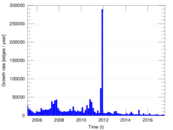
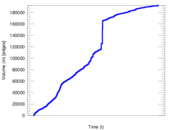
Wikinews edits (pl)
This is the bipartite edit network of the Polish Wikinews. It contains users
and pages from the Polish Wikinews, connected by edit events. Each edge
represents an edit. The dataset includes the timestamp of each edit.
Metadata
Statistics
| Size | n = | 43,407
|
| Left size | n1 = | 1,572
|
| Right size | n2 = | 41,835
|
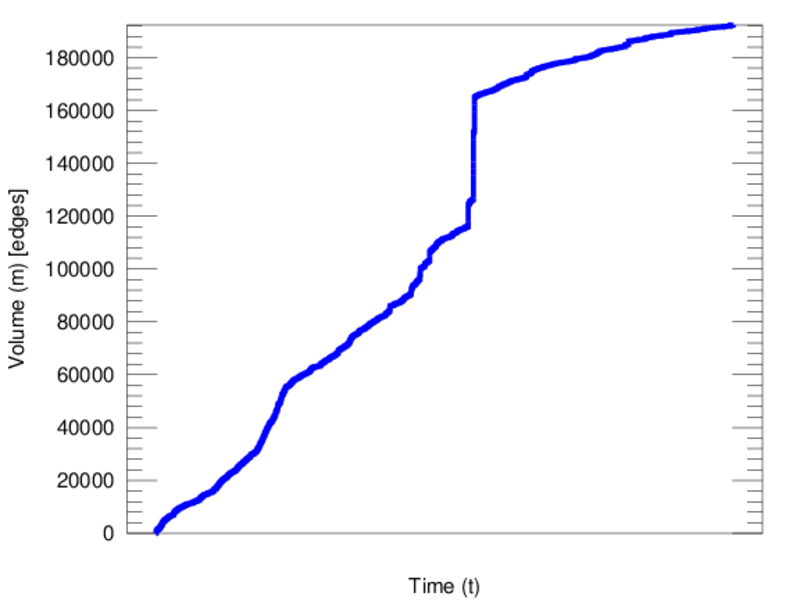
| Volume | m = | 192,332
|
| Unique edge count | m̿ = | 109,218
|
| Wedge count | s = | 417,806,646
|
| Claw count | z = | 2,745,638,288,273
|
| Cross count | x = | 16,224,827,432,729,264
|
| Square count | q = | 86,897,339
|
| 4-Tour count | T4 = | 2,366,646,836
|
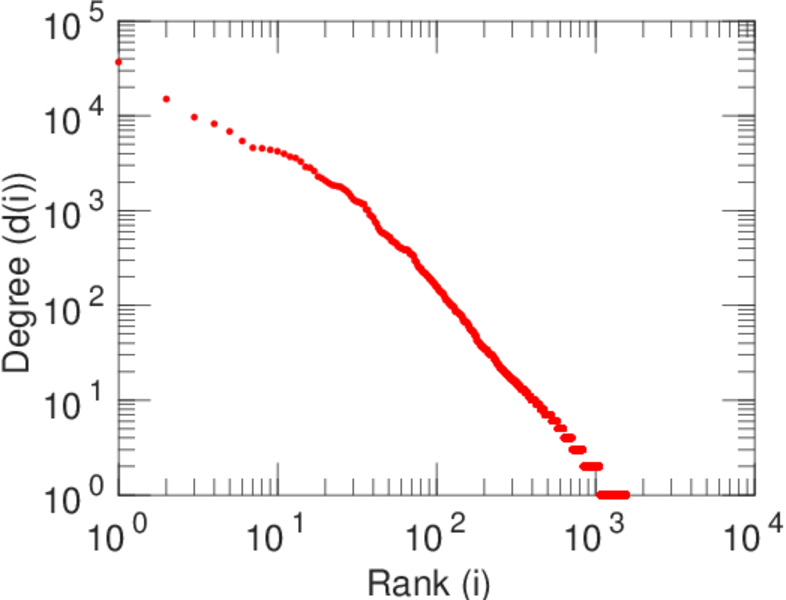
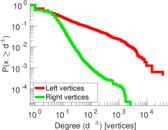
| Maximum degree | dmax = | 36,840
|
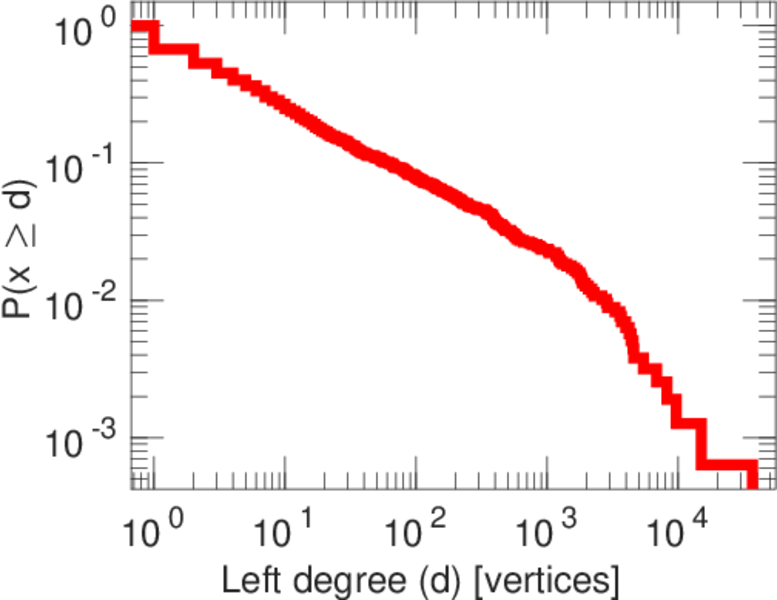
| Maximum left degree | d1max = | 36,840
|
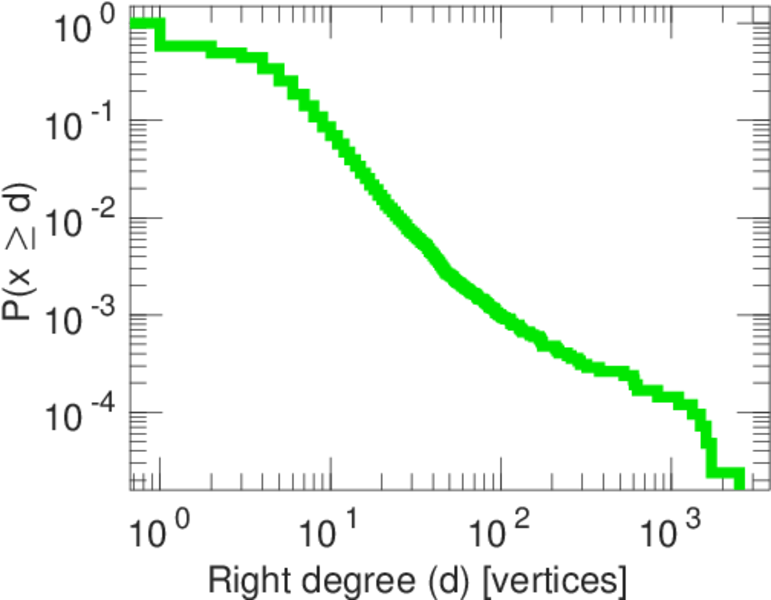
| Maximum right degree | d2max = | 2,510
|
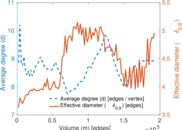
| Average degree | d = | 8.861 80
|
| Average left degree | d1 = | 122.349
|
| Average right degree | d2 = | 4.597 39
|
| Fill | p = | 0.001 660 74
|
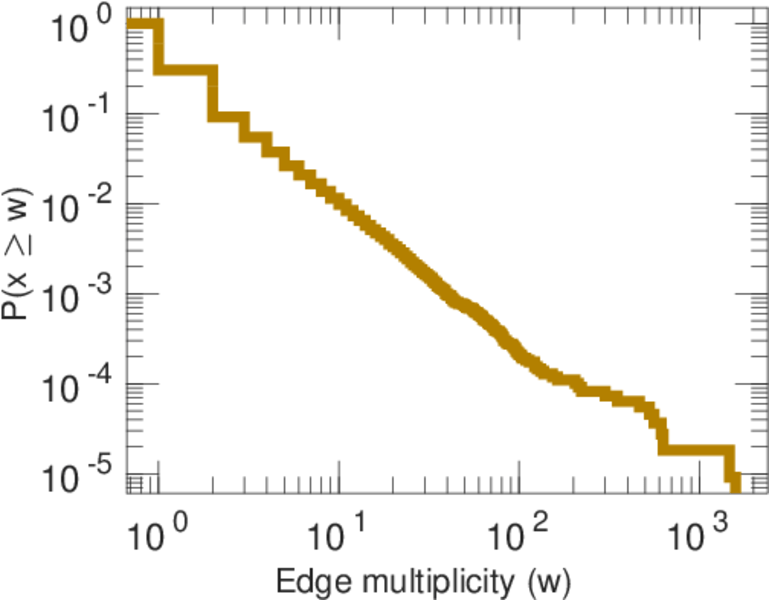
| Average edge multiplicity | m̃ = | 1.760 99
|
| Size of LCC | N = | 42,931
|
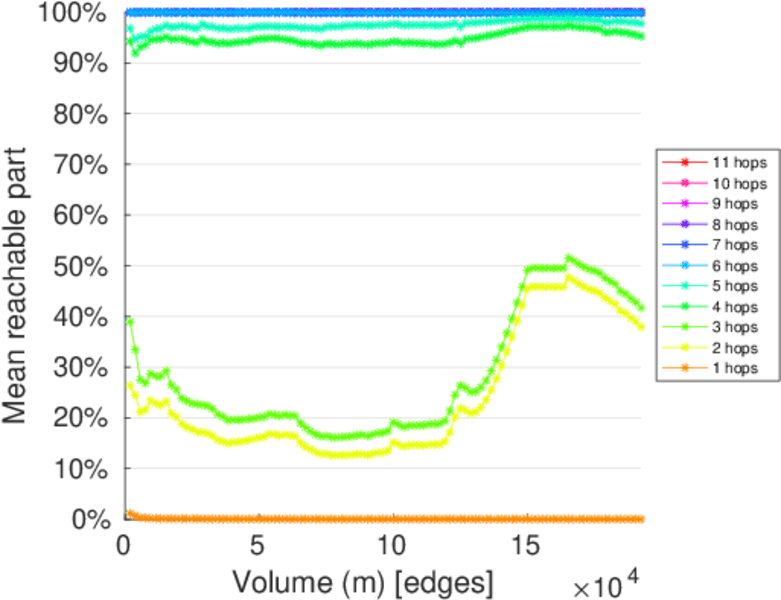
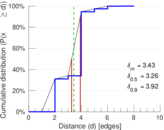
| Diameter | δ = | 10
|
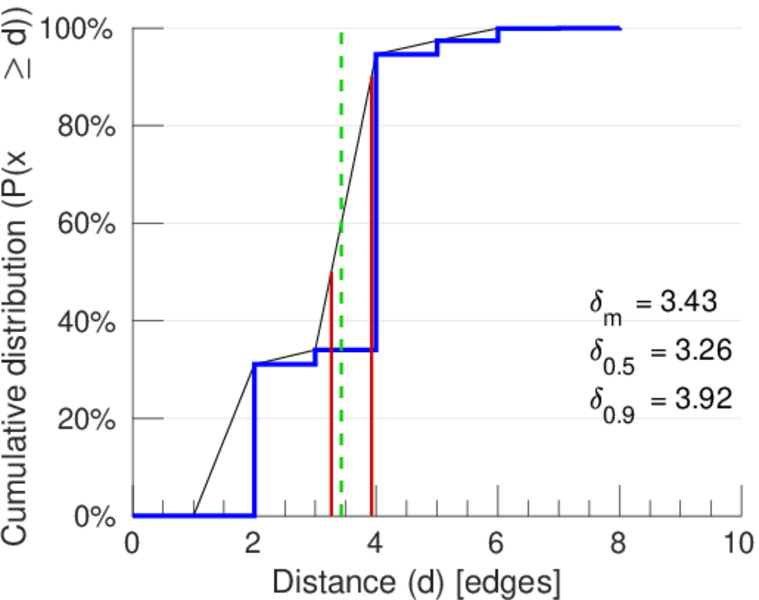
| 50-Percentile effective diameter | δ0.5 = | 3.263 88
|
| 90-Percentile effective diameter | δ0.9 = | 3.924 18
|
| Median distance | δM = | 4
|
| Mean distance | δm = | 3.430 64
|
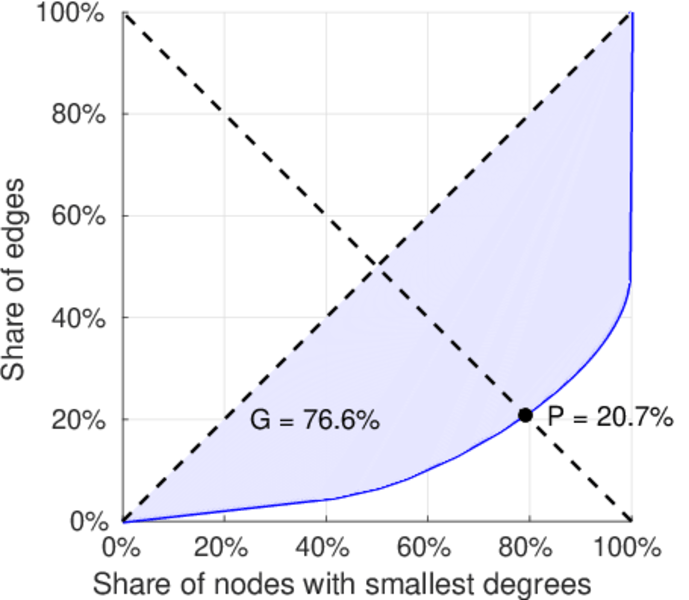
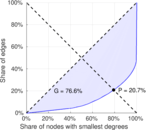
| Gini coefficient | G = | 0.772 371
|
| Balanced inequality ratio | P = | 0.203 840
|
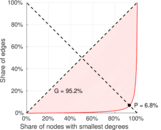
| Left balanced inequality ratio | P1 = | 0.067 648 6
|
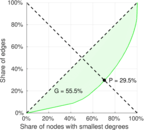
| Right balanced inequality ratio | P2 = | 0.295 006
|
| Relative edge distribution entropy | Her = | 0.733 291
|
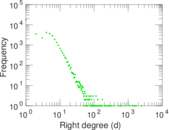
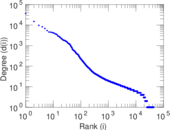
| Power law exponent | γ = | 2.390 54
|
| Tail power law exponent | γt = | 3.621 00
|
| Tail power law exponent with p | γ3 = | 3.621 00
|
| p-value | p = | 0.000 00
|
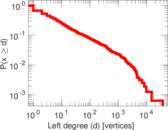
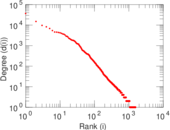
| Left tail power law exponent with p | γ3,1 = | 1.591 00
|
| Left p-value | p1 = | 0.731 000
|
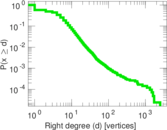
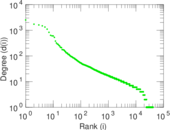
| Right tail power law exponent with p | γ3,2 = | 4.821 00
|
| Right p-value | p2 = | 0.000 00
|
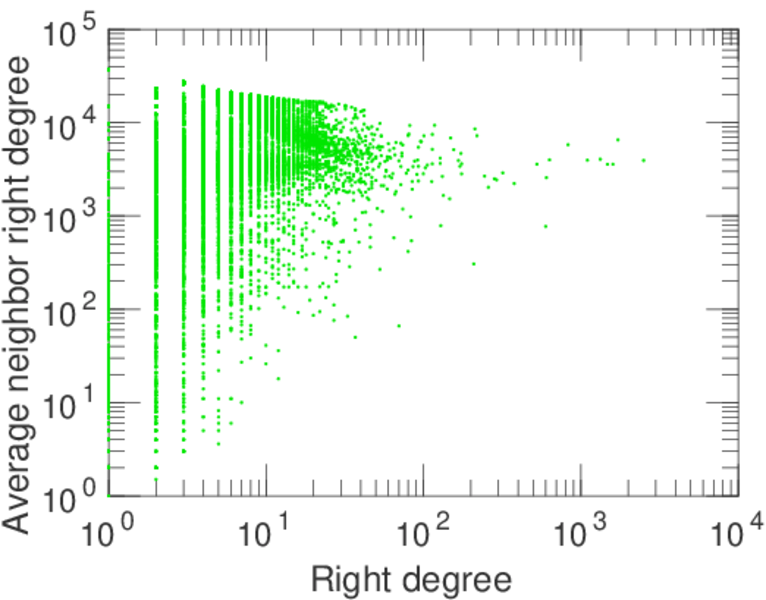
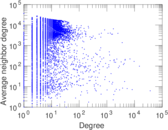
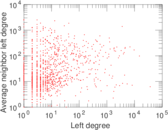
| Degree assortativity | ρ = | −0.153 878
|
| Degree assortativity p-value | pρ = | 0.000 00
|
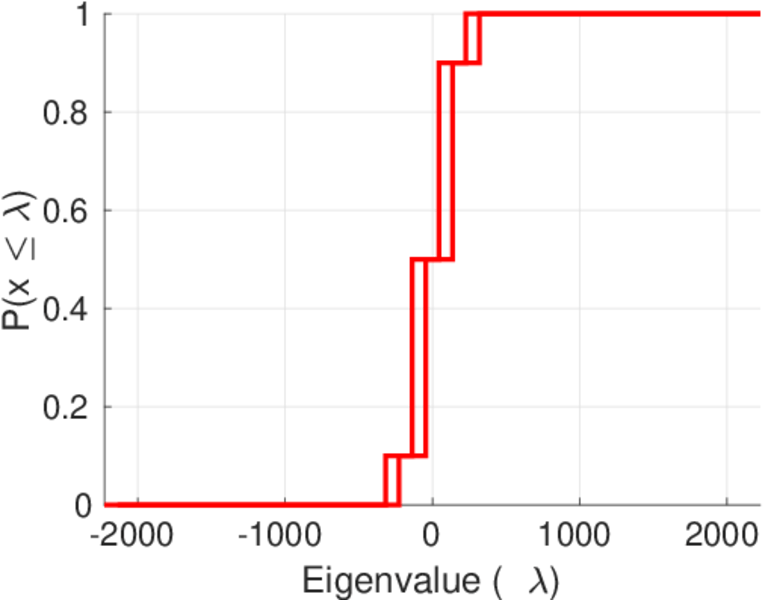
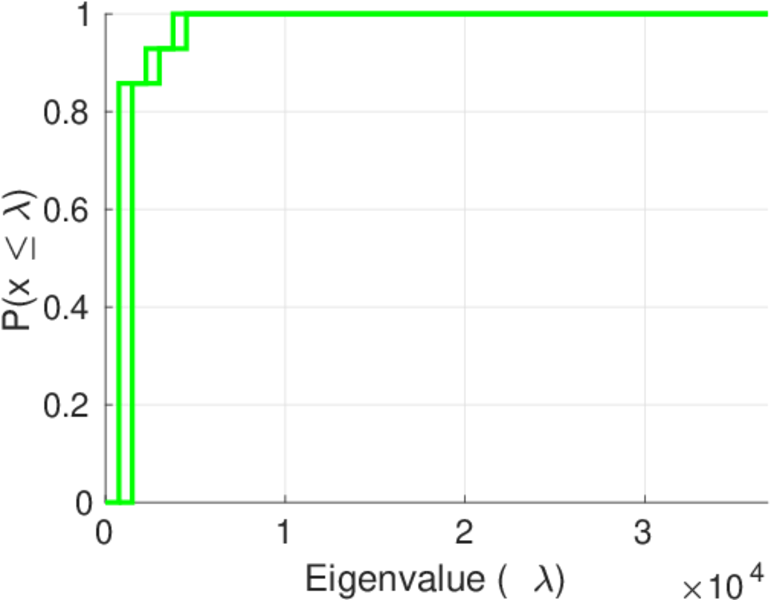
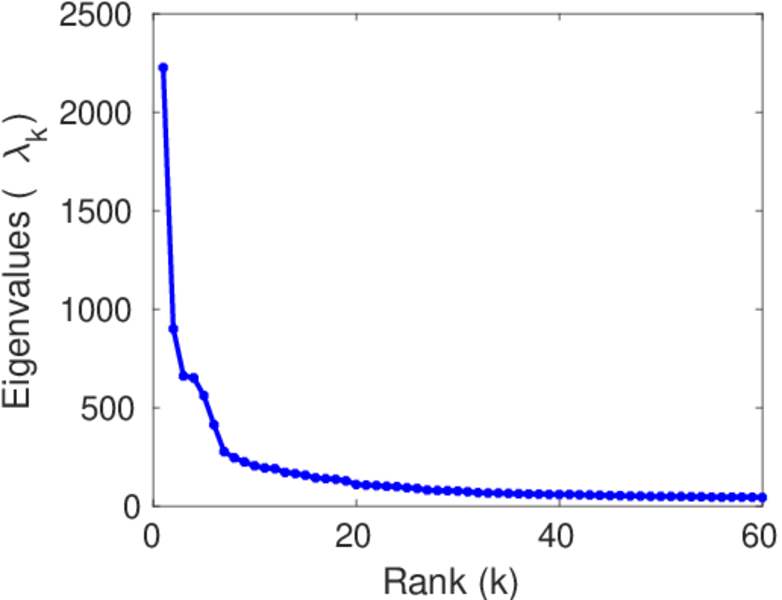
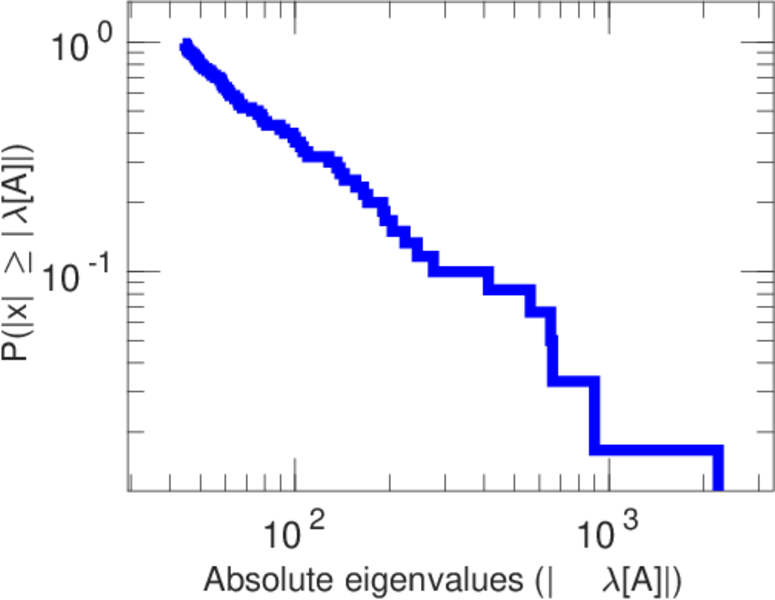
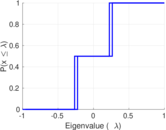
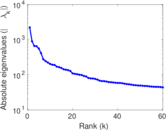
| Spectral norm | α = | 2,225.95
|
| Algebraic connectivity | a = | 0.040 858 7
|
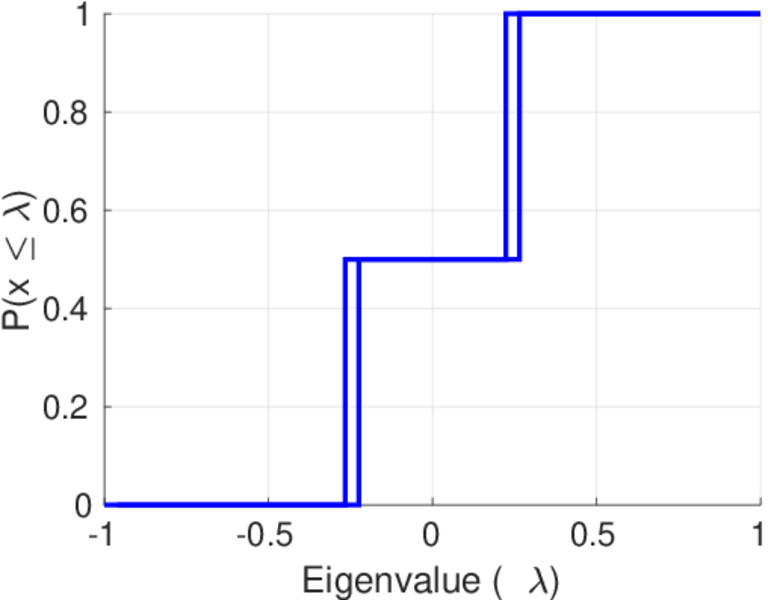
| Spectral separation | |λ1[A] / λ2[A]| = | 2.473 96
|
| Controllability | C = | 40,355
|
| Relative controllability | Cr = | 0.931 577
|
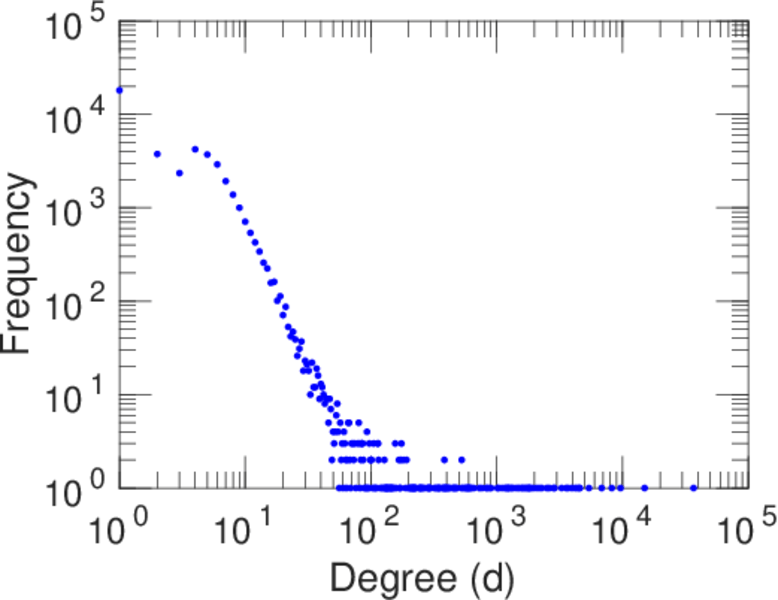
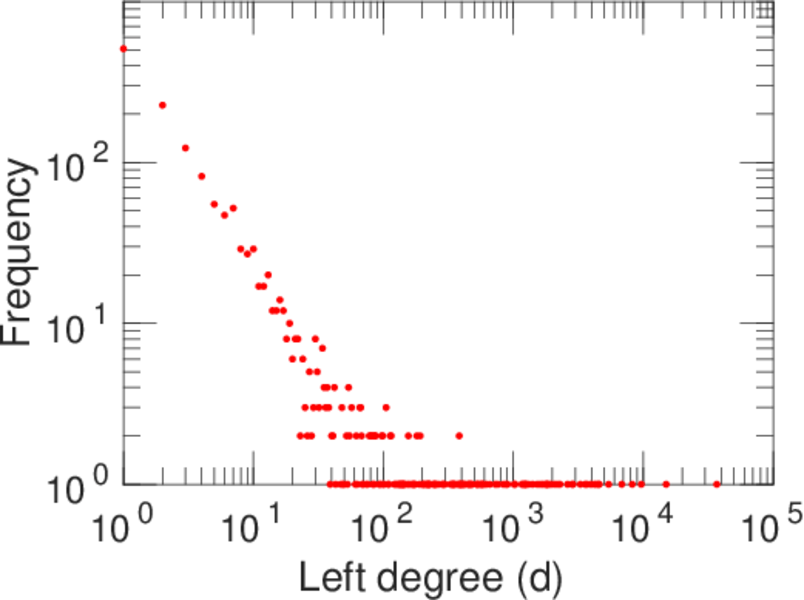
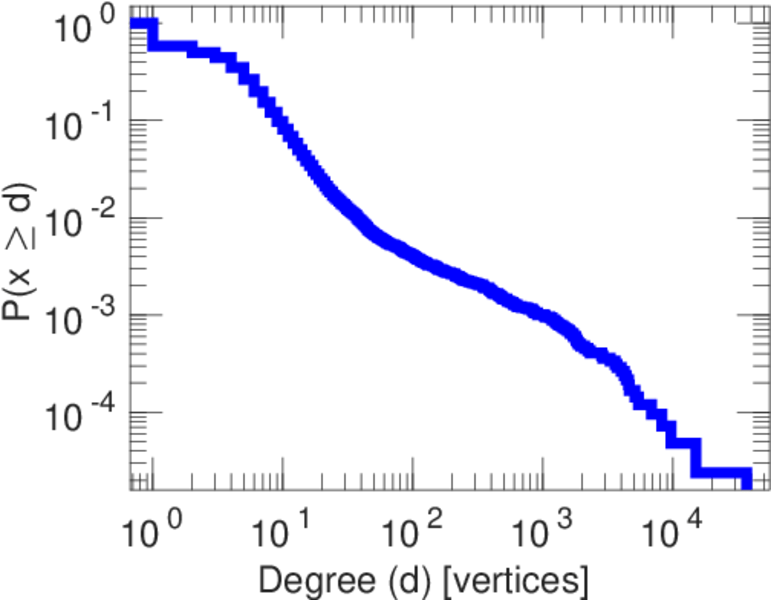
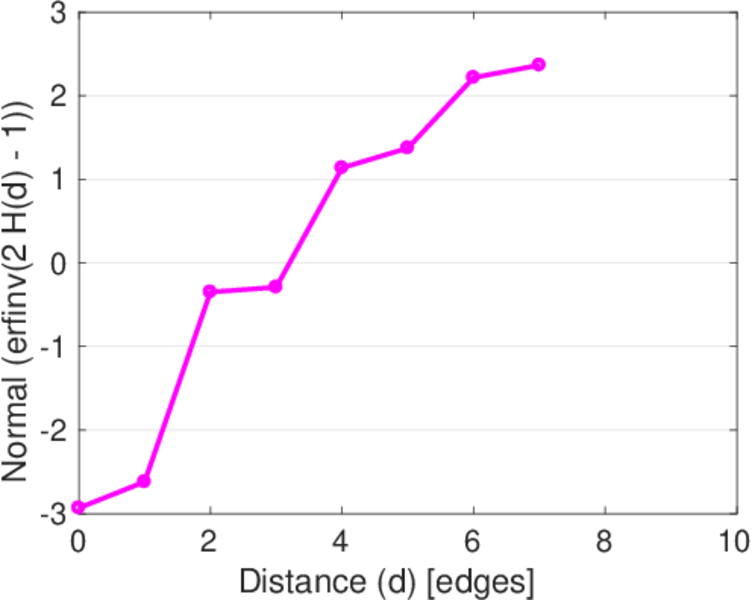
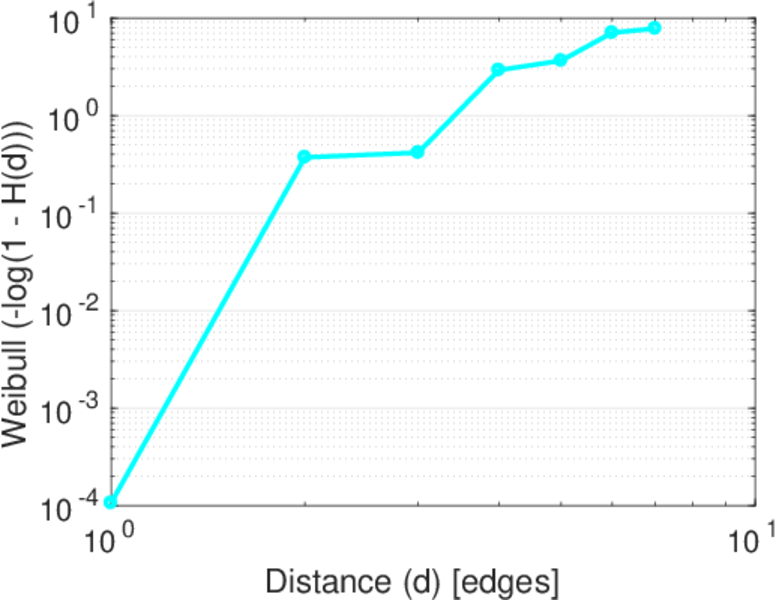
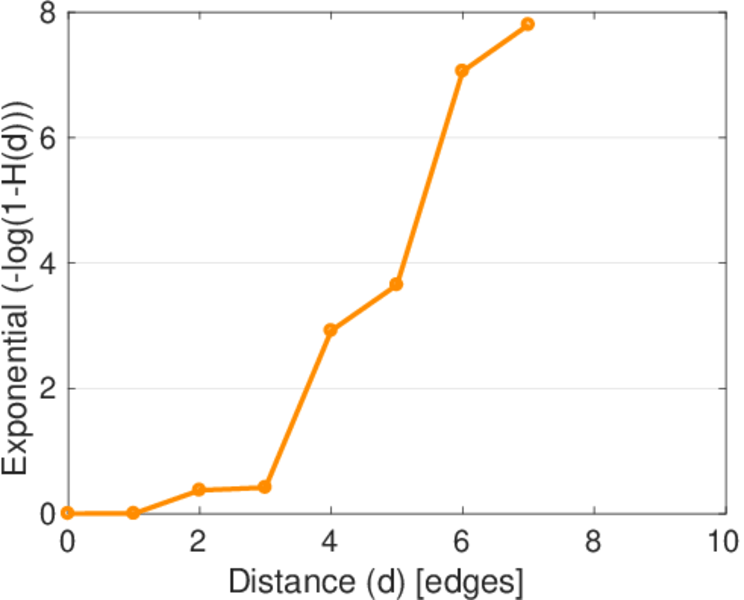
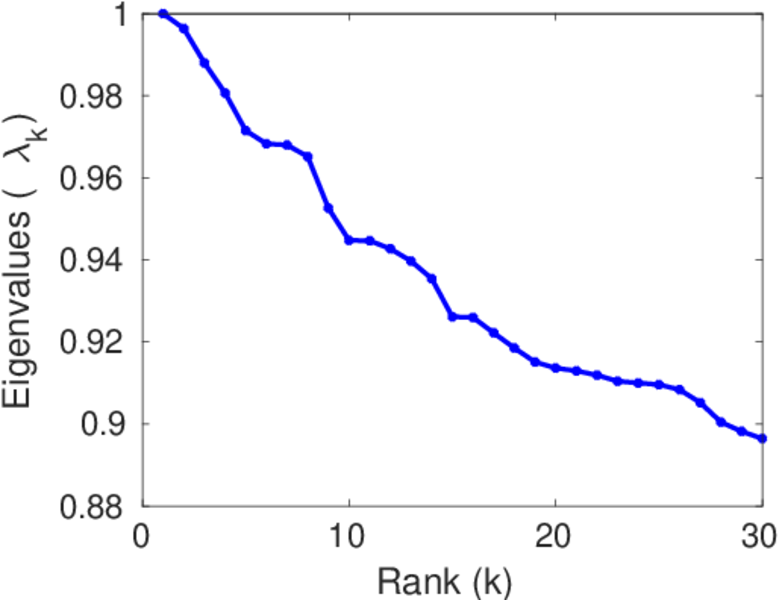
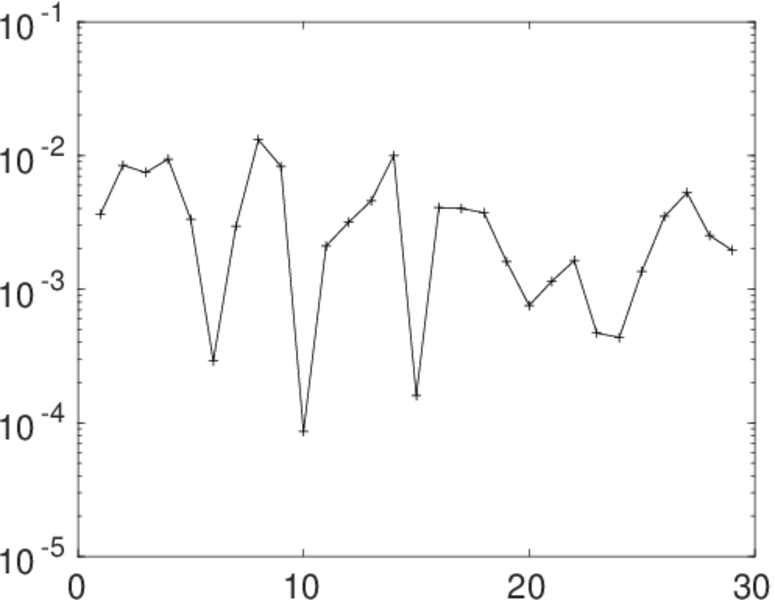
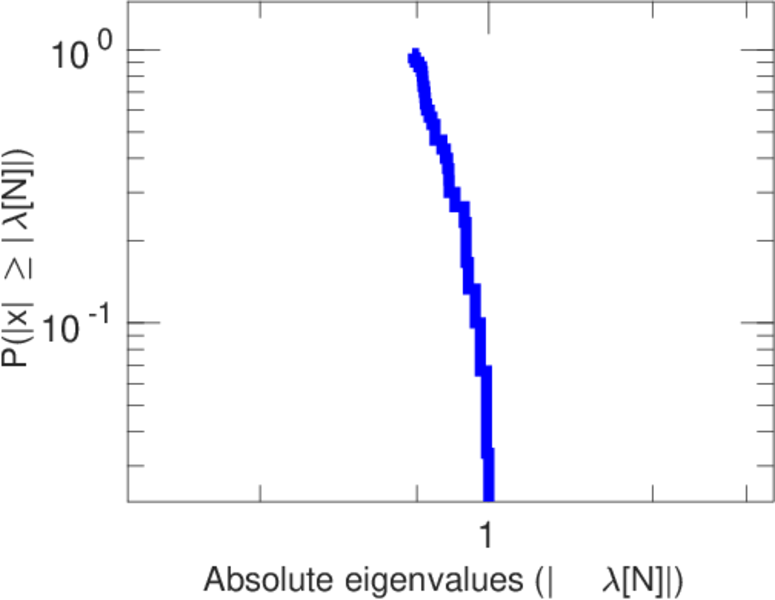
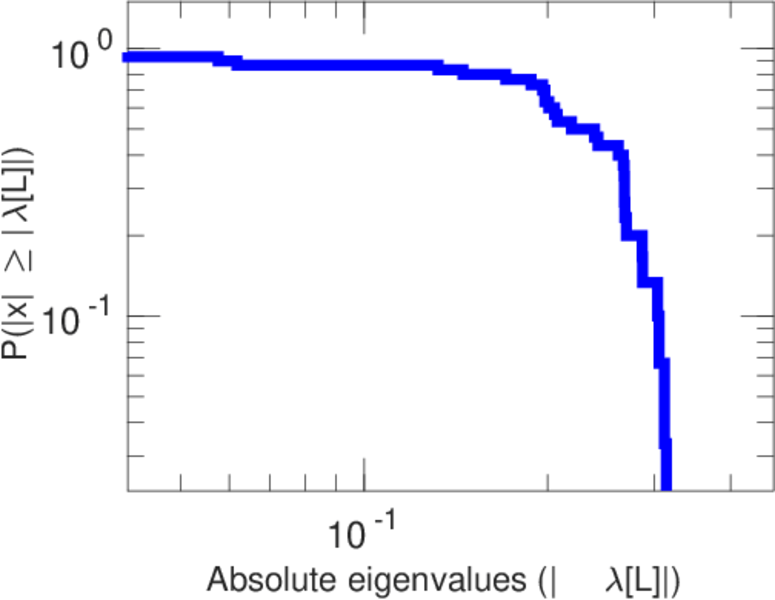
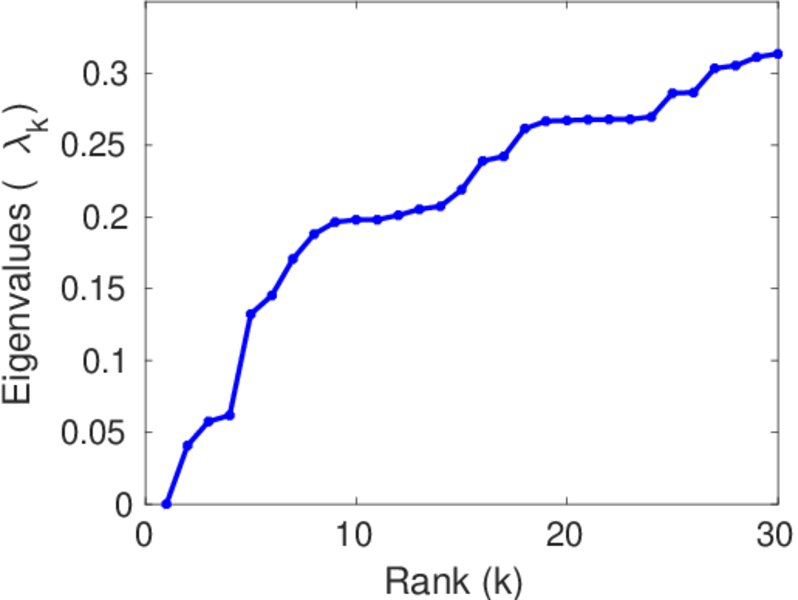
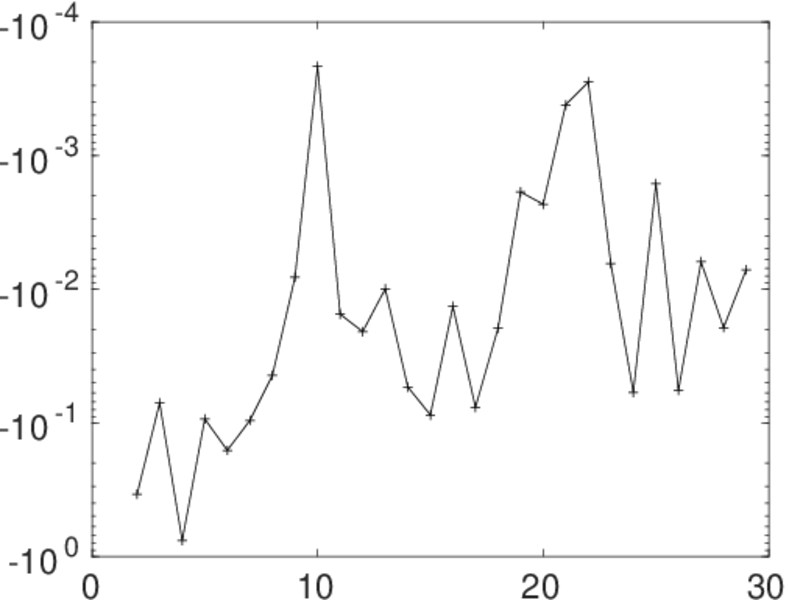
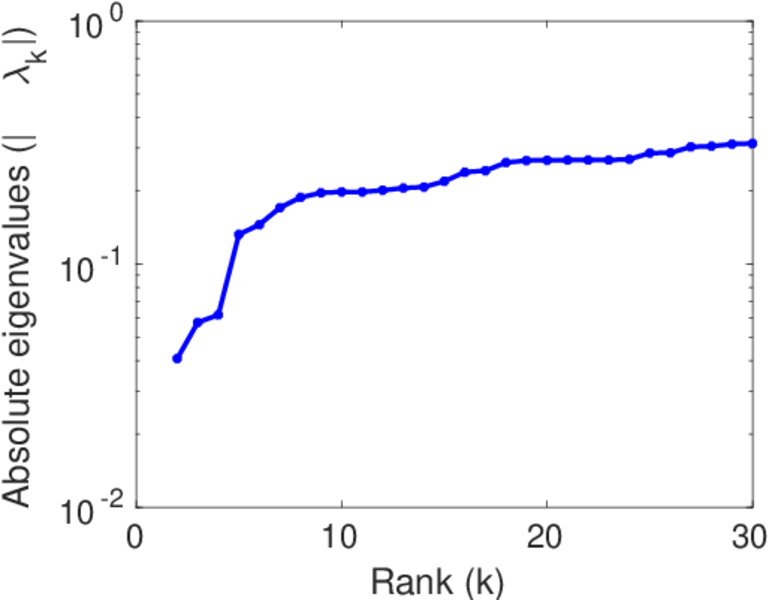
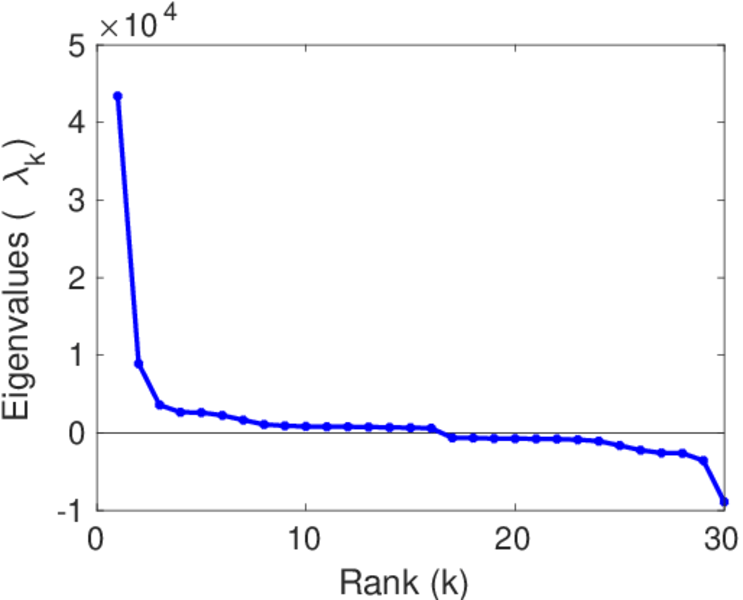
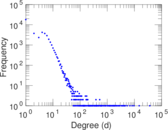
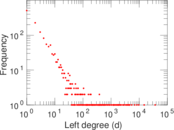
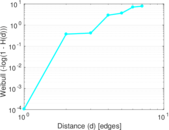
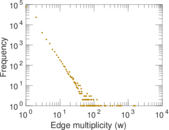
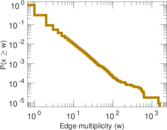
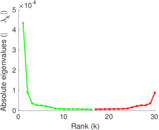
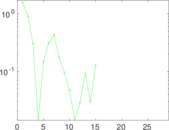
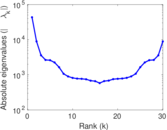
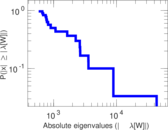
Plots


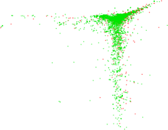
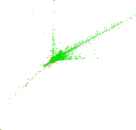


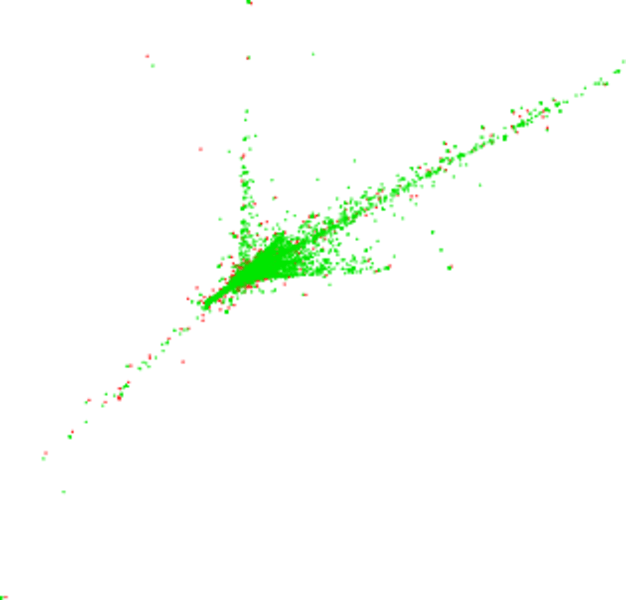
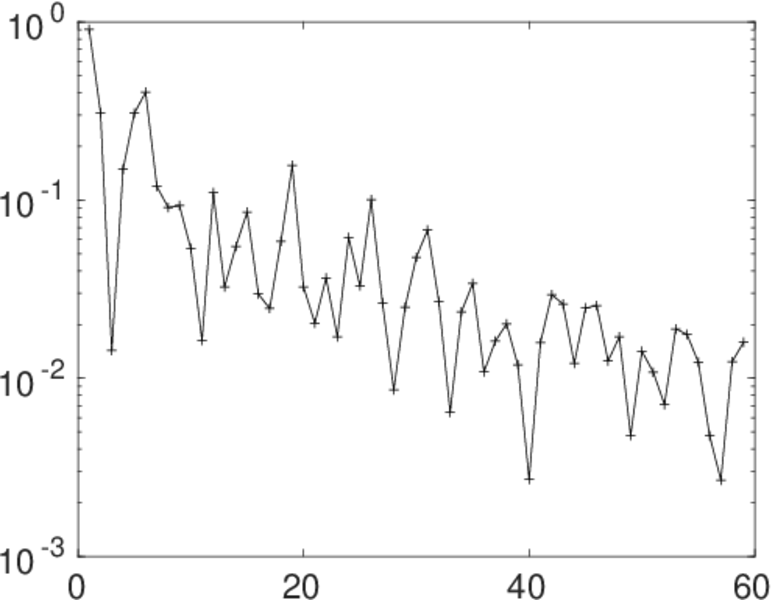
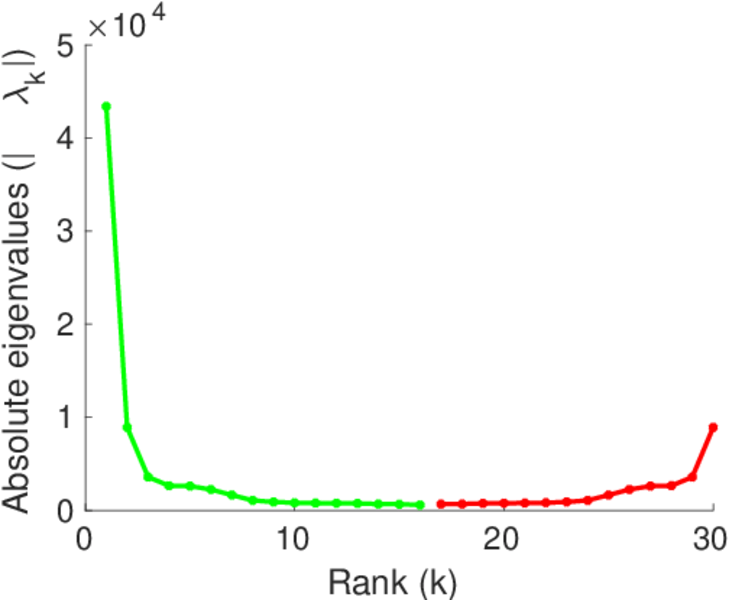
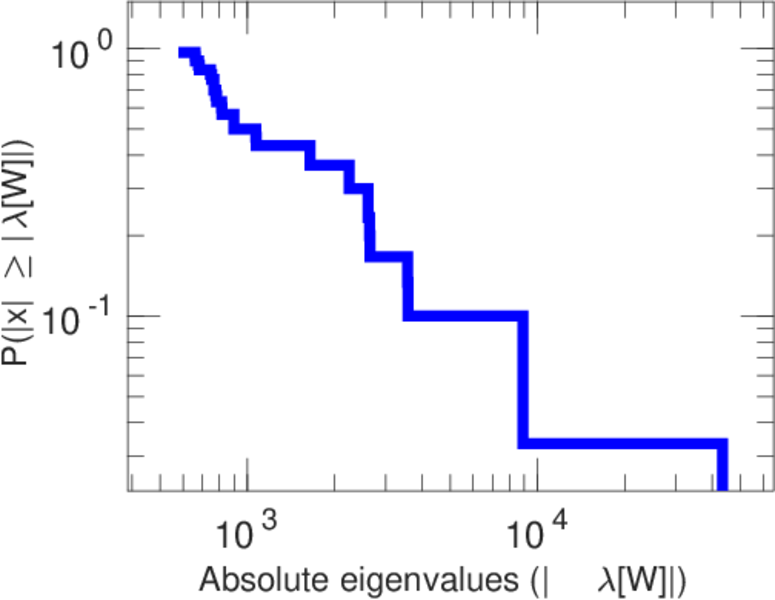
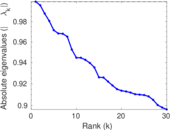
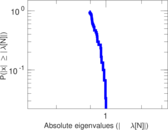
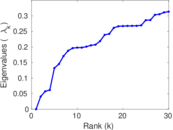
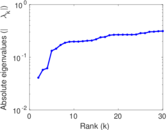
Matrix decompositions plots


Downloads
References
|
[1]
|
Jérôme Kunegis.
KONECT – The Koblenz Network Collection.
In Proc. Int. Conf. on World Wide Web Companion, pages
1343–1350, 2013.
[ http ]
|
|
[2]
|
Wikimedia Foundation.
Wikimedia downloads.
http://dumps.wikimedia.org/, January 2010.
|
 KONECT ‣ Networks ‣
Buy Me a Coffee
KONECT ‣ Networks ‣
Buy Me a Coffee