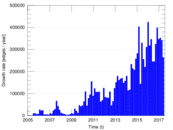
Wikiquote edits (pl)
This is the bipartite edit network of the Polish Wikisource. It contains users
and pages from the Polish Wikisource, connected by edit events. Each edge
represents an edit. The dataset includes the timestamp of each edit.
Metadata
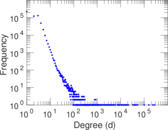
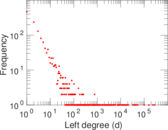
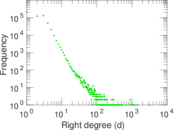
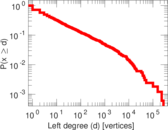
Statistics
| Size | n = | 581,646
|
| Left size | n1 = | 1,656
|
| Right size | n2 = | 579,990
|
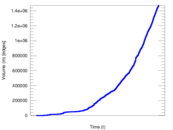
| Volume | m = | 1,472,273
|
| Unique edge count | m̿ = | 1,152,974
|
| Wedge count | s = | 48,615,330,897
|
| Cross count | x = | 9.473 25 × 1019
|
| Square count | q = | 4,060,083,527
|
| 4-Tour count | T4 = | 226,944,586,212
|
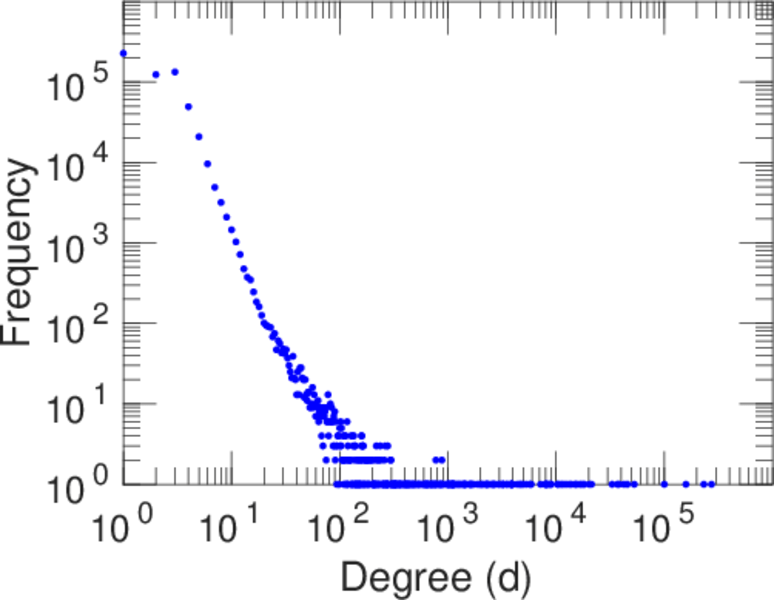
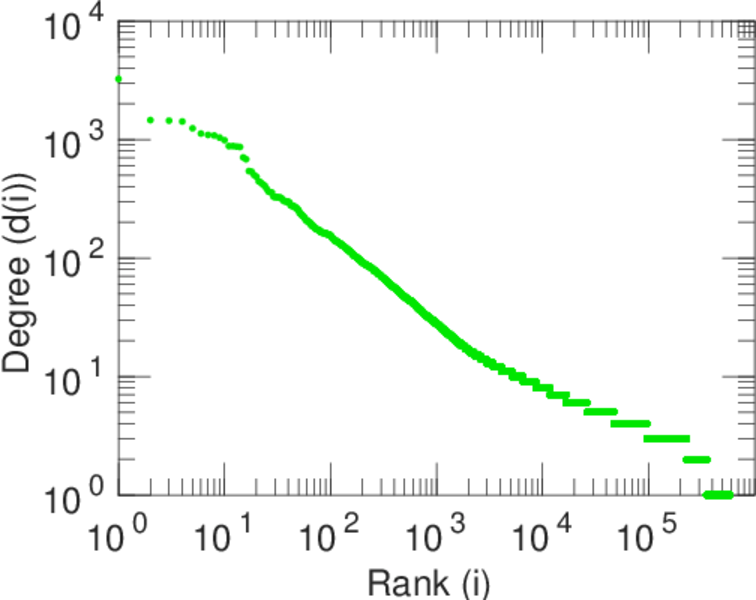
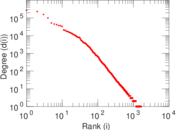
| Maximum degree | dmax = | 273,359
|
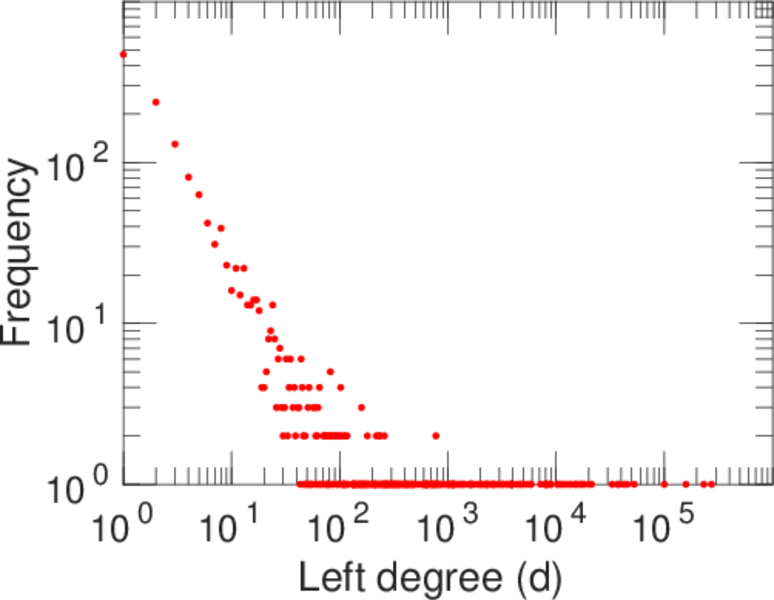
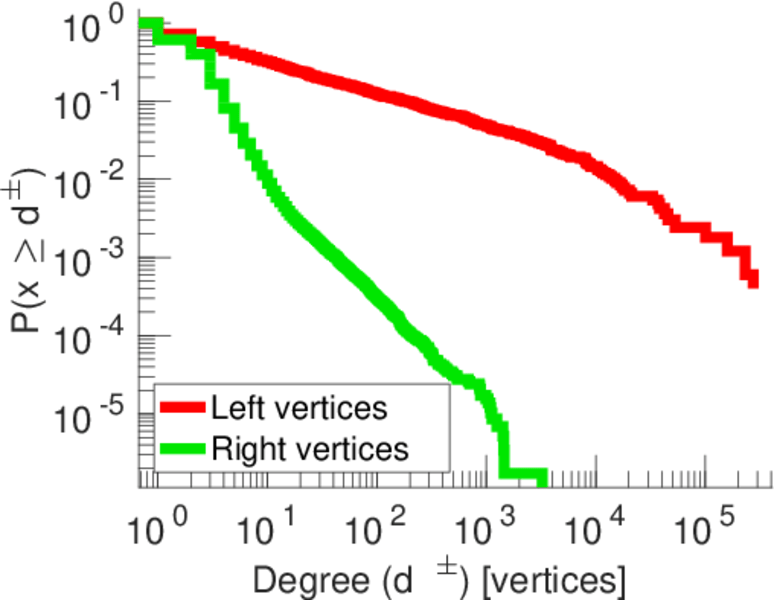
| Maximum left degree | d1max = | 273,359
|
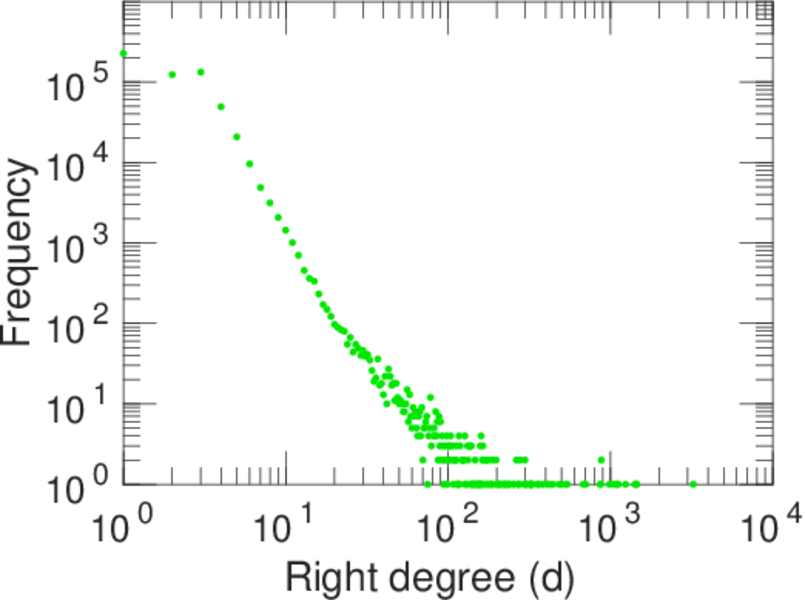
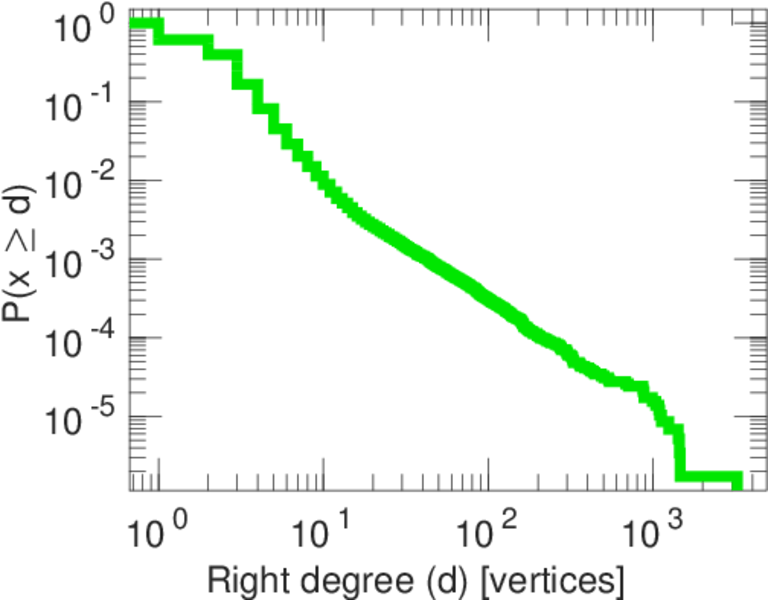
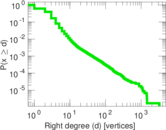
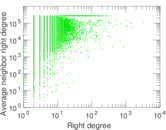
| Maximum right degree | d2max = | 3,245
|
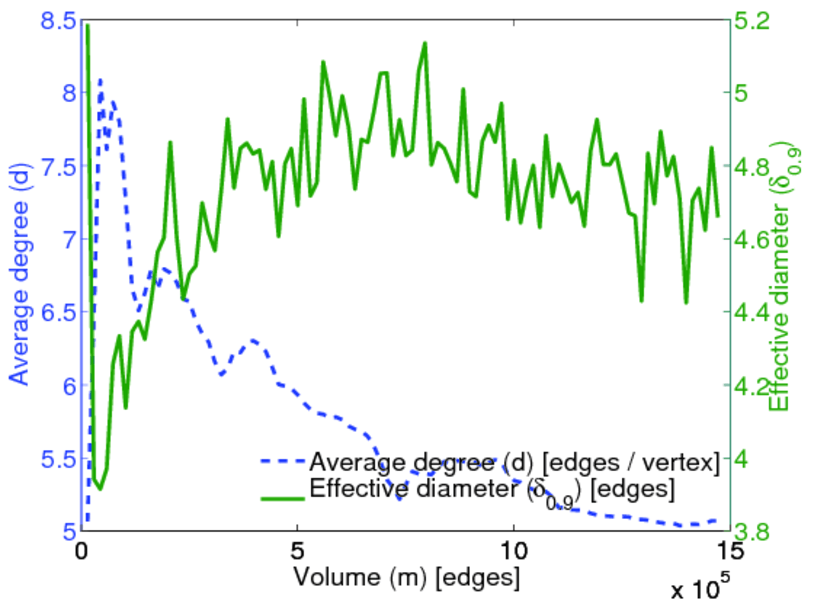
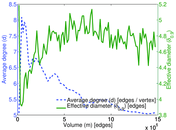
| Average degree | d = | 5.062 44
|
| Average left degree | d1 = | 889.054
|
| Average right degree | d2 = | 2.538 45
|
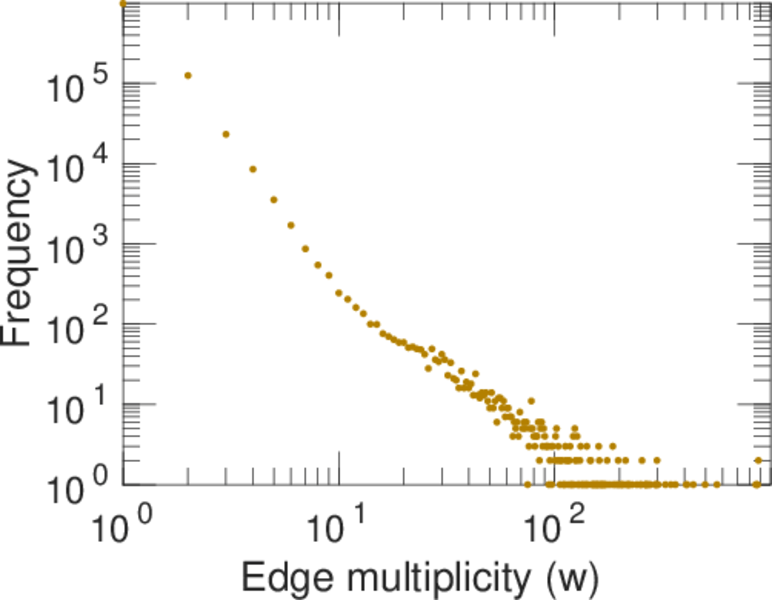
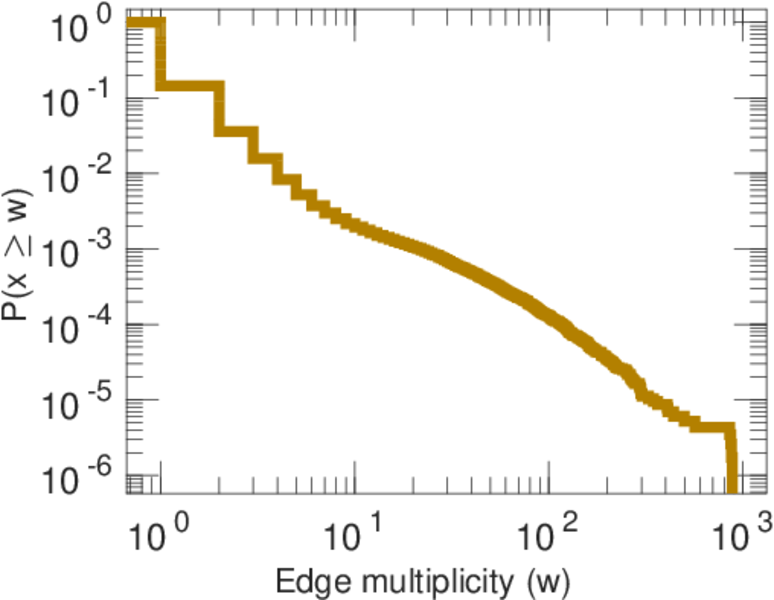
| Average edge multiplicity | m̃ = | 1.276 94
|
| Size of LCC | N = | 580,399
|
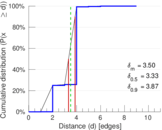
| Diameter | δ = | 11
|
| 50-Percentile effective diameter | δ0.5 = | 3.329 23
|
| 90-Percentile effective diameter | δ0.9 = | 3.873 42
|
| Median distance | δM = | 4
|
| Mean distance | δm = | 3.503 13
|
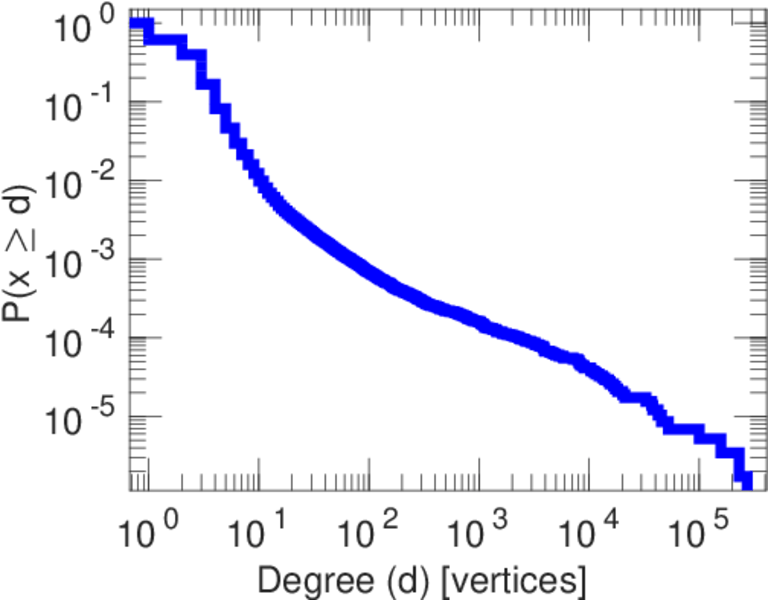
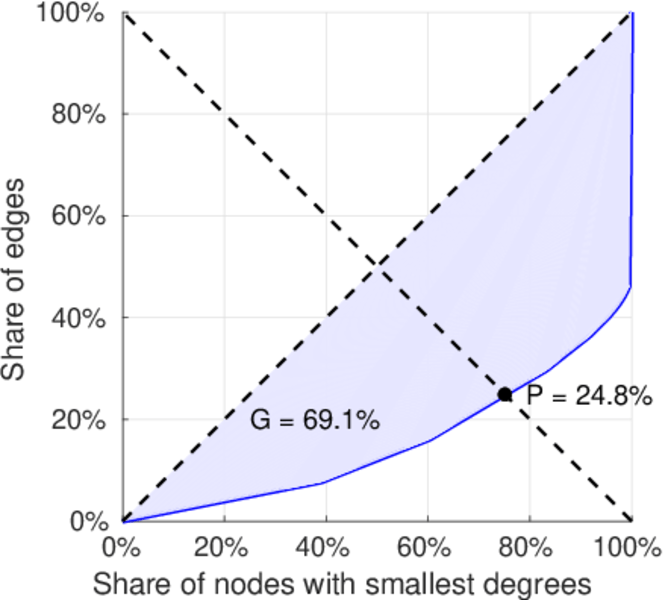
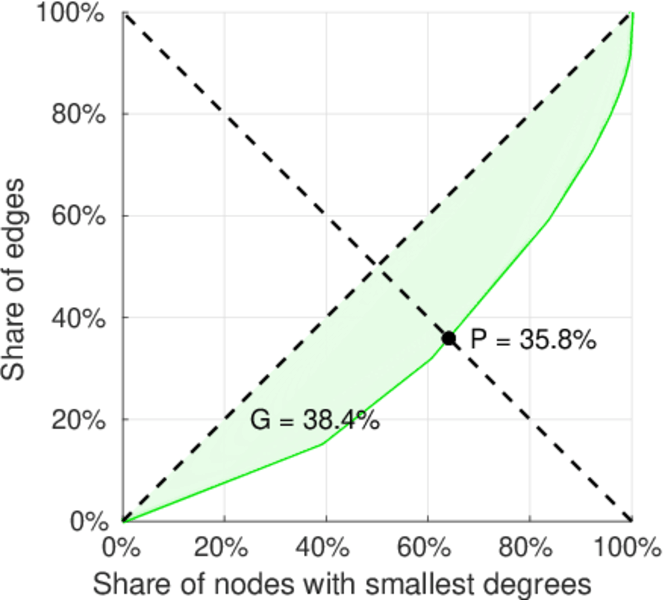
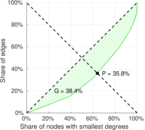
| Gini coefficient | G = | 0.692 007
|
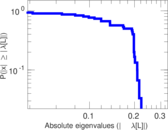
| Balanced inequality ratio | P = | 0.246 717
|
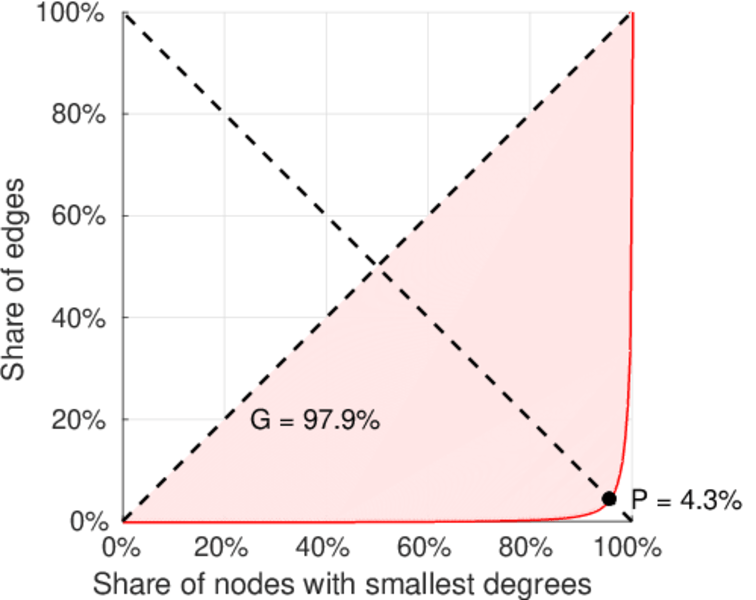
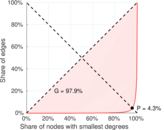
| Left balanced inequality ratio | P1 = | 0.042 750 2
|
| Right balanced inequality ratio | P2 = | 0.357 690
|
| Relative edge distribution entropy | Her = | 0.674 622
|
| Power law exponent | γ = | 2.898 17
|
| Tail power law exponent | γt = | 4.941 00
|
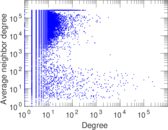
| Degree assortativity | ρ = | −0.168 742
|
| Degree assortativity p-value | pρ = | 0.000 00
|
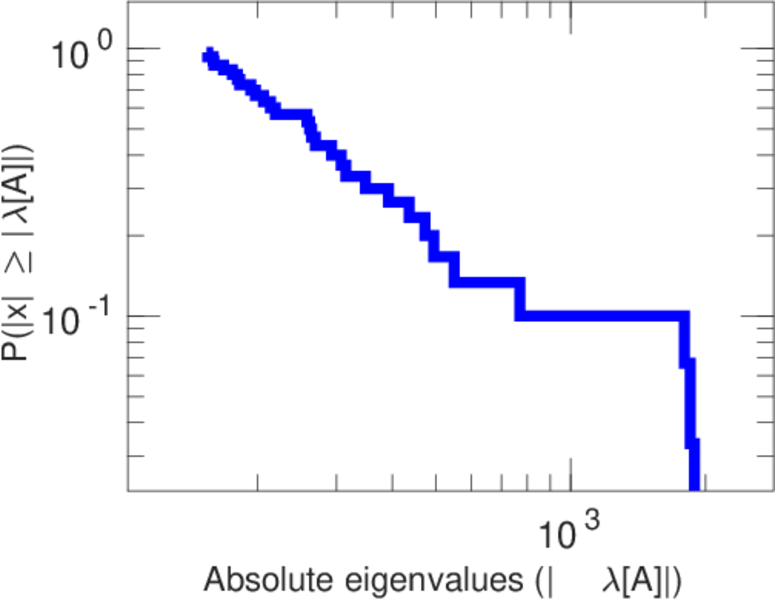
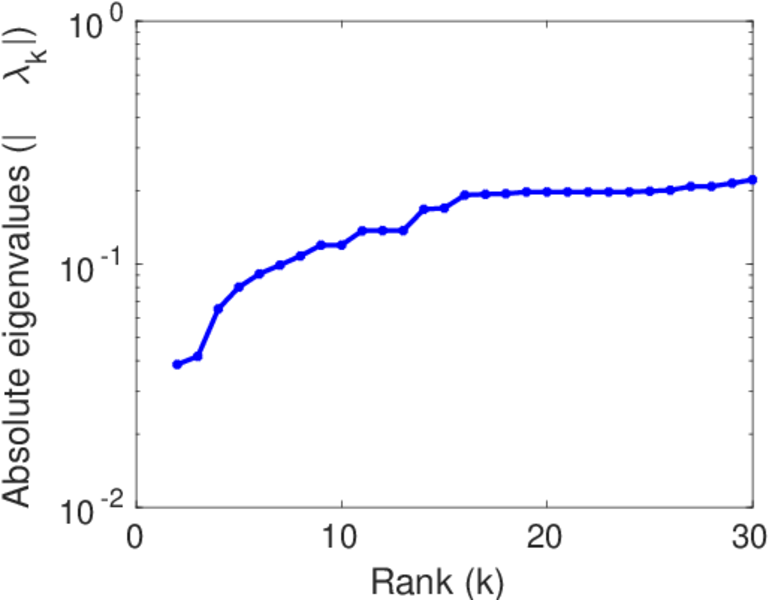
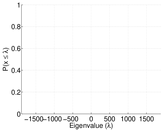
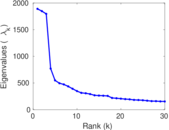
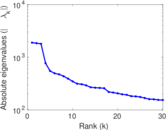
| Spectral norm | α = | 1,889.55
|
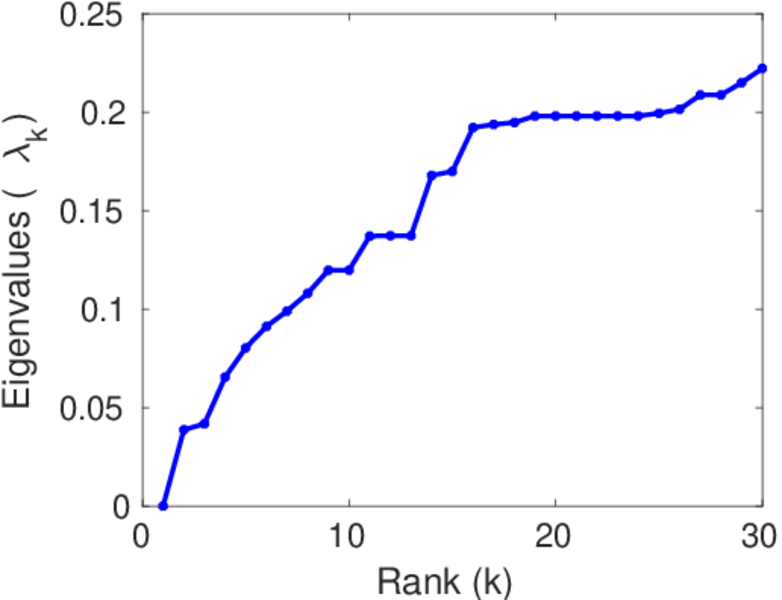
| Algebraic connectivity | a = | 0.038 664 8
|
| Spectral separation | |λ1[A] / λ2[A]| = | 1.023 22
|
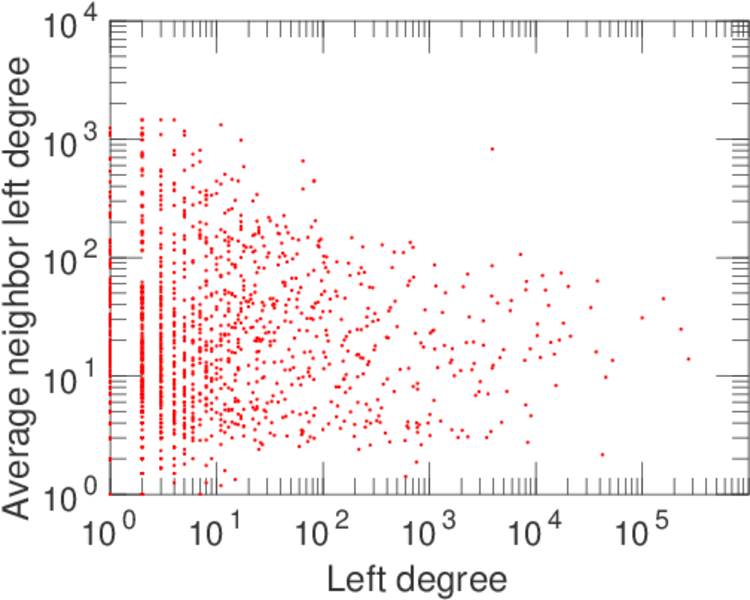
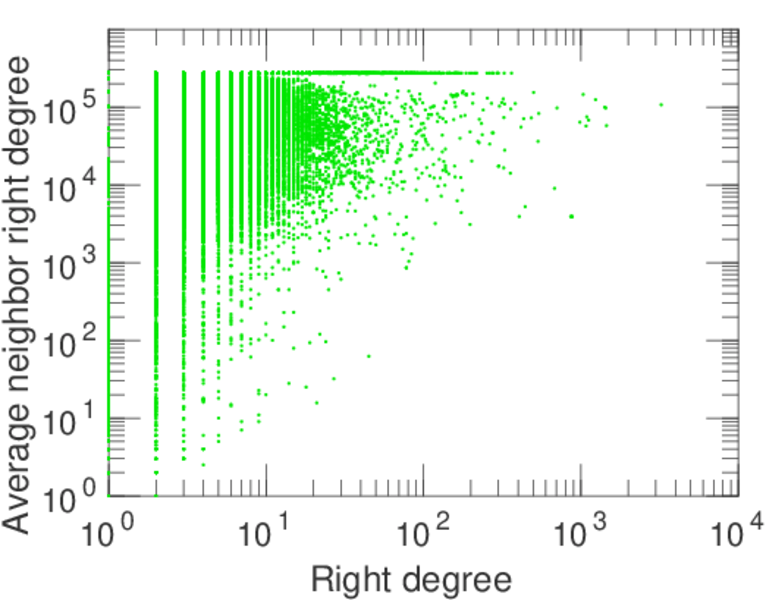
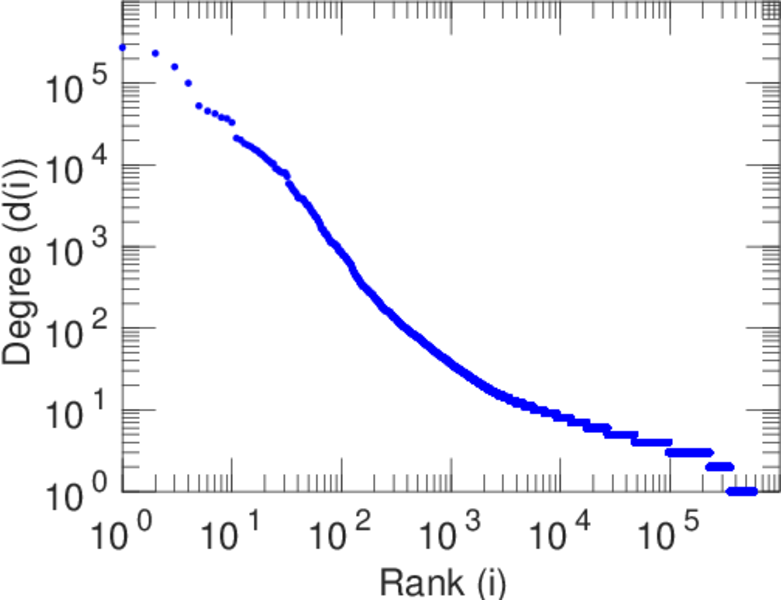
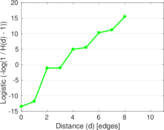
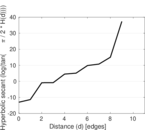
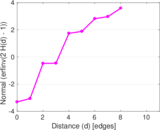
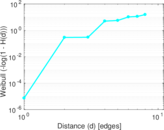
Plots


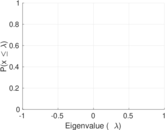
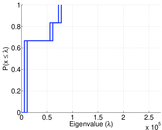

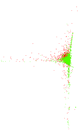
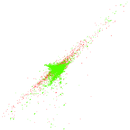


Matrix decompositions plots


Downloads
References
|
[1]
|
Jérôme Kunegis.
KONECT – The Koblenz Network Collection.
In Proc. Int. Conf. on World Wide Web Companion, pages
1343–1350, 2013.
[ http ]
|
|
[2]
|
Wikimedia Foundation.
Wikimedia downloads.
http://dumps.wikimedia.org/, January 2010.
|
 KONECT ‣ Networks ‣
Buy Me a Coffee
KONECT ‣ Networks ‣
Buy Me a Coffee