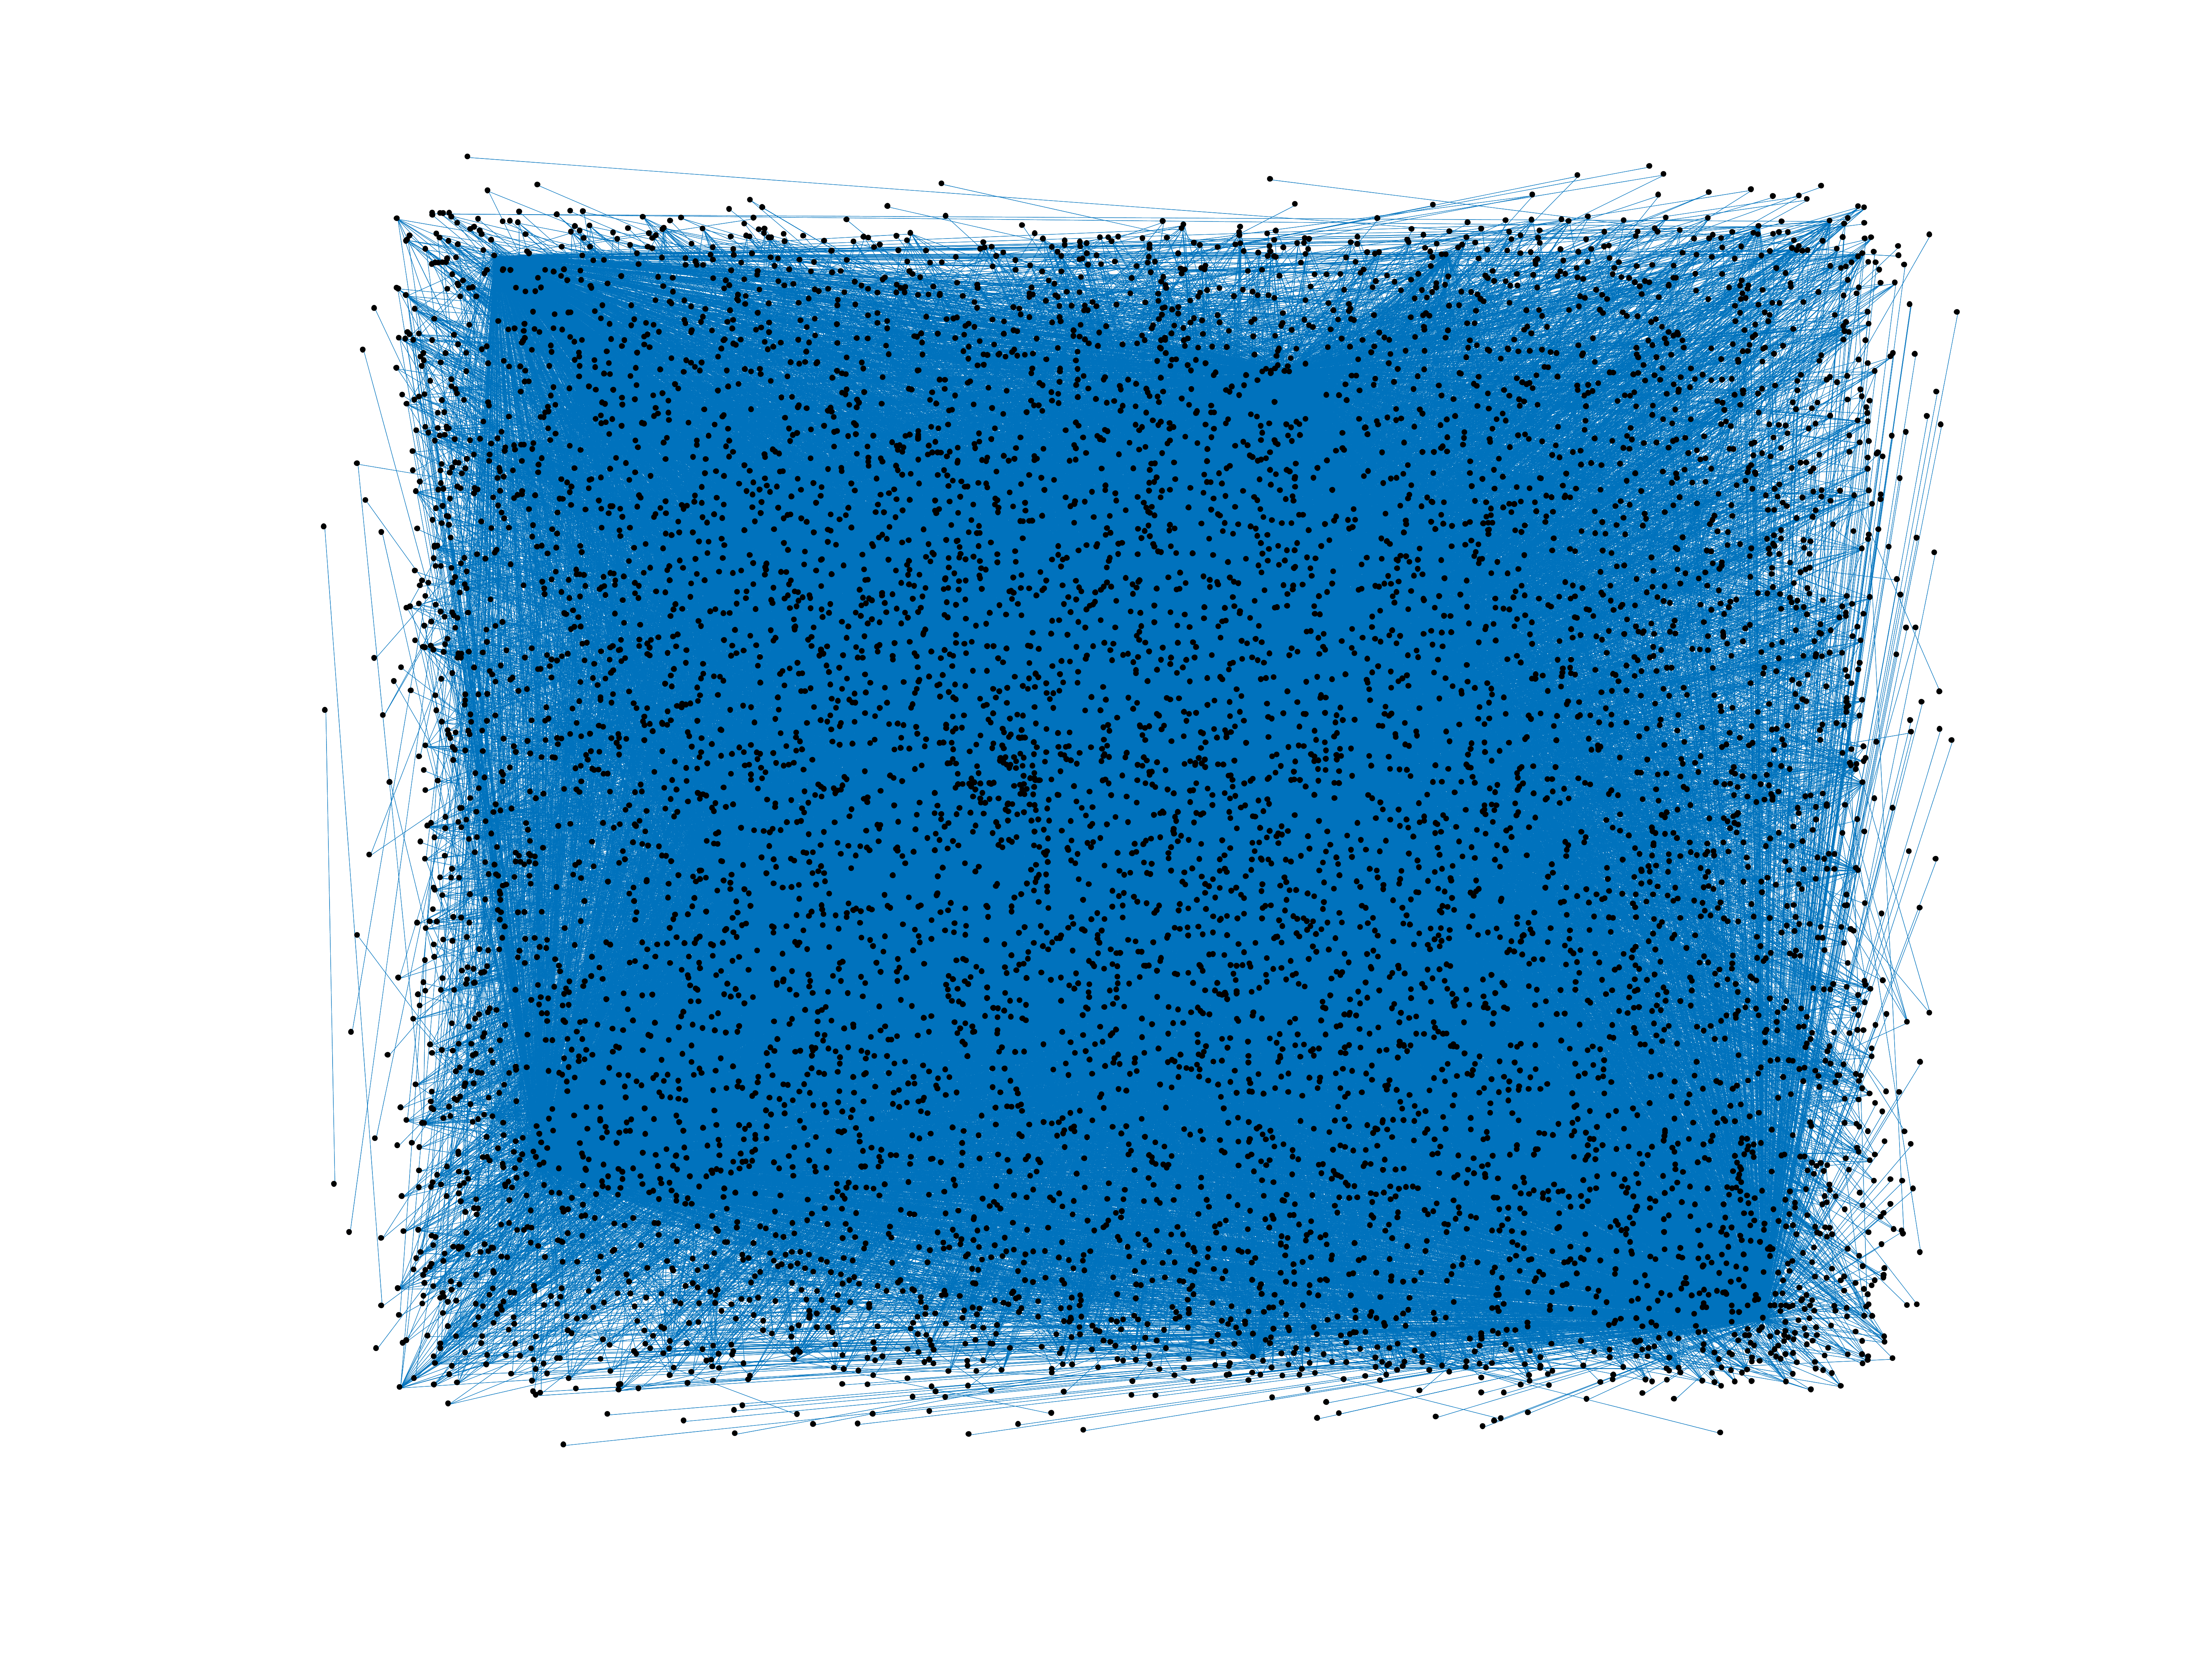
Wikivoyage edits (pl)
This is the bipartite edit network of the Polish Wikivoyage. It contains users
and pages from the Polish Wikivoyage, connected by edit events. Each edge
represents an edit. The dataset includes the timestamp of each edit.
Metadata
Statistics
| Size | n = | 7,735
|
| Left size | n1 = | 935
|
| Right size | n2 = | 6,800
|
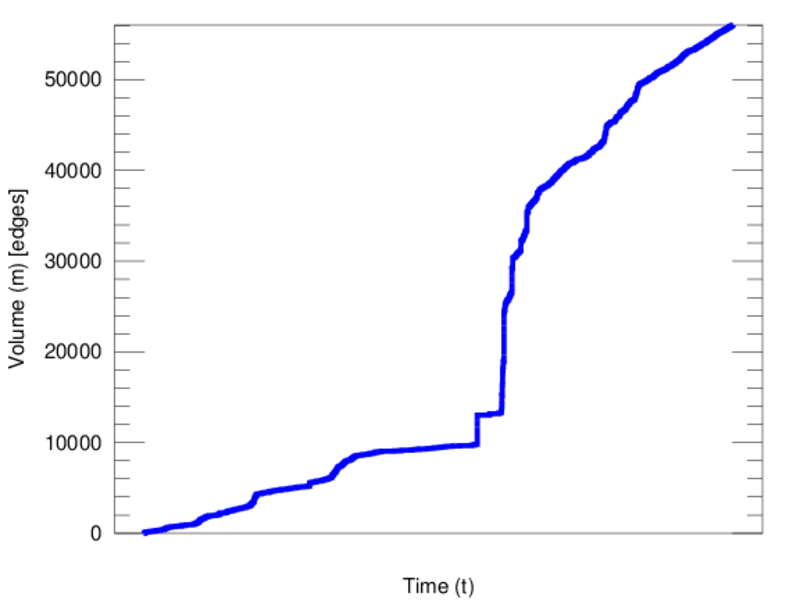
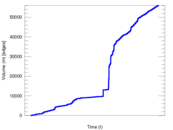
| Volume | m = | 56,019
|
| Unique edge count | m̿ = | 28,839
|
| Wedge count | s = | 22,175,834
|
| Claw count | z = | 16,187,437,596
|
| Cross count | x = | 9,588,297,882,218
|
| Square count | q = | 34,878,711
|
| 4-Tour count | T4 = | 367,826,814
|
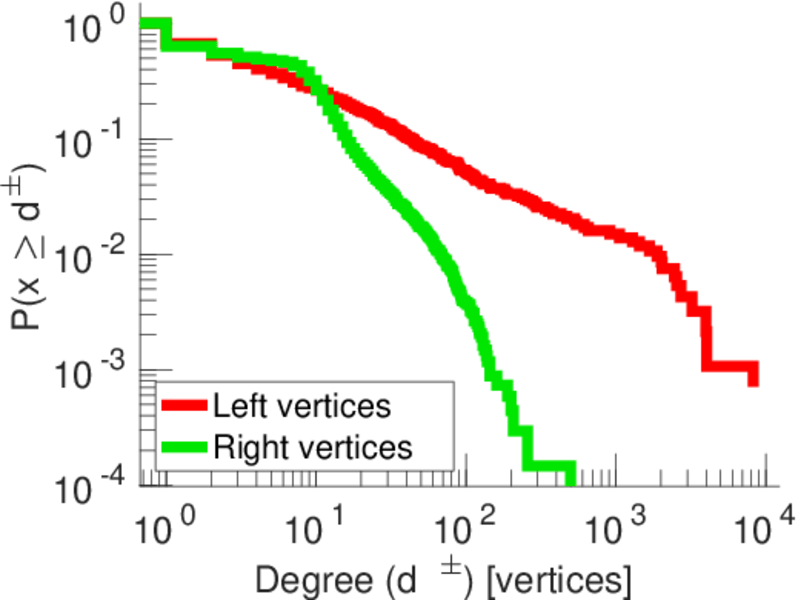
| Maximum degree | dmax = | 8,231
|
| Maximum left degree | d1max = | 8,231
|
| Maximum right degree | d2max = | 498
|
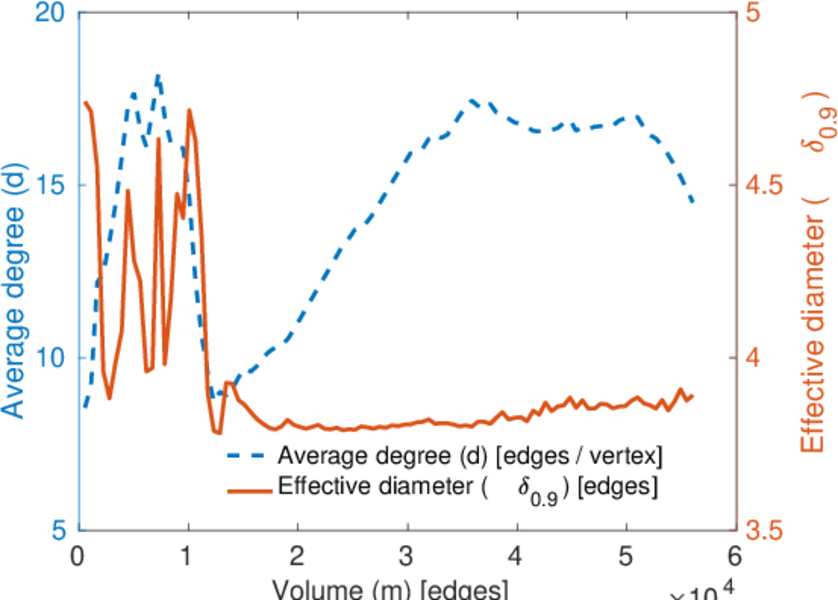
| Average degree | d = | 14.484 6
|
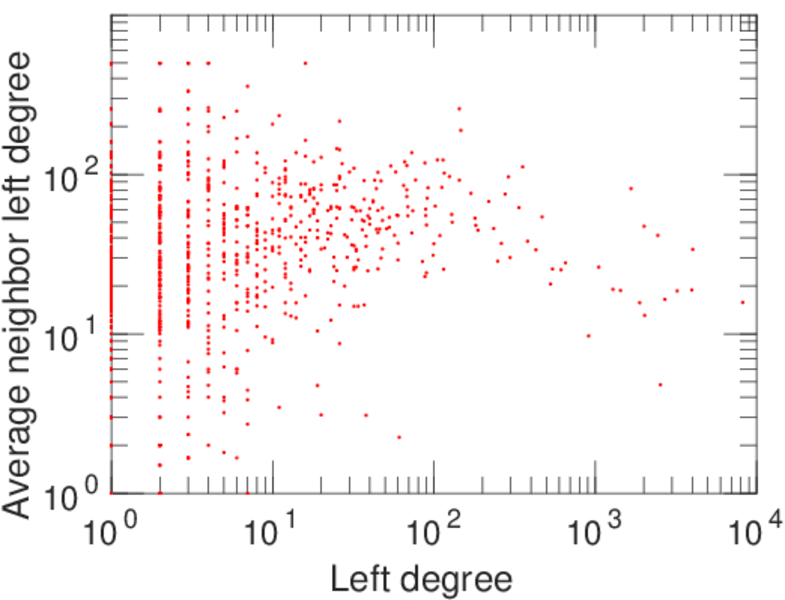
| Average left degree | d1 = | 59.913 4
|
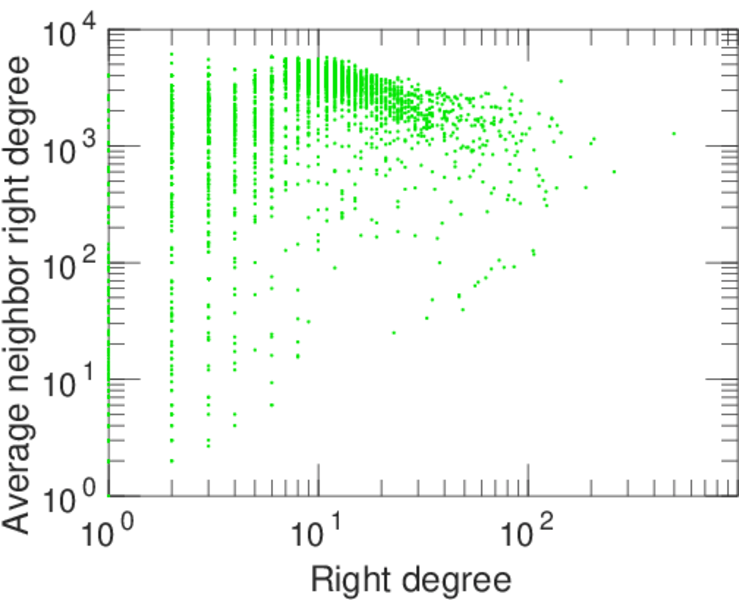
| Average right degree | d2 = | 8.238 09
|
| Fill | p = | 0.004 535 86
|
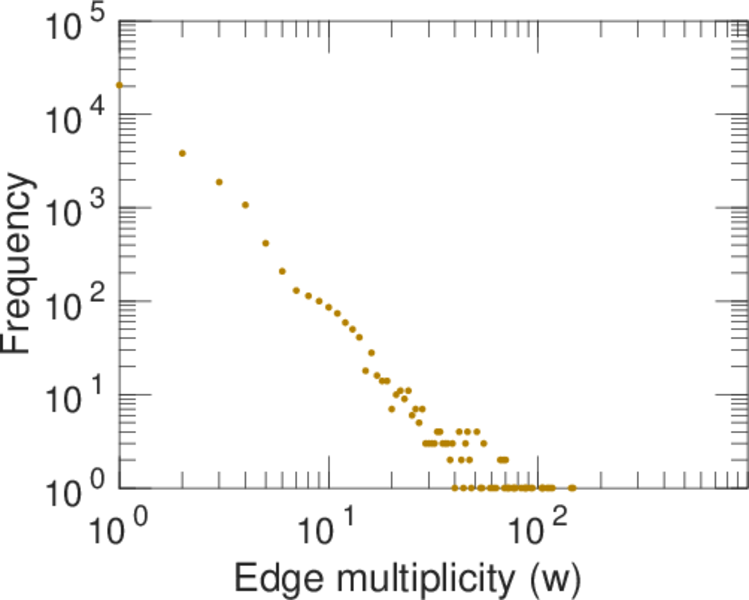
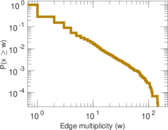
| Average edge multiplicity | m̃ = | 1.942 47
|
| Size of LCC | N = | 7,551
|
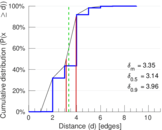
| Diameter | δ = | 11
|
| 50-Percentile effective diameter | δ0.5 = | 3.135 36
|
| 90-Percentile effective diameter | δ0.9 = | 3.961 72
|
| Median distance | δM = | 4
|
| Mean distance | δm = | 3.346 24
|
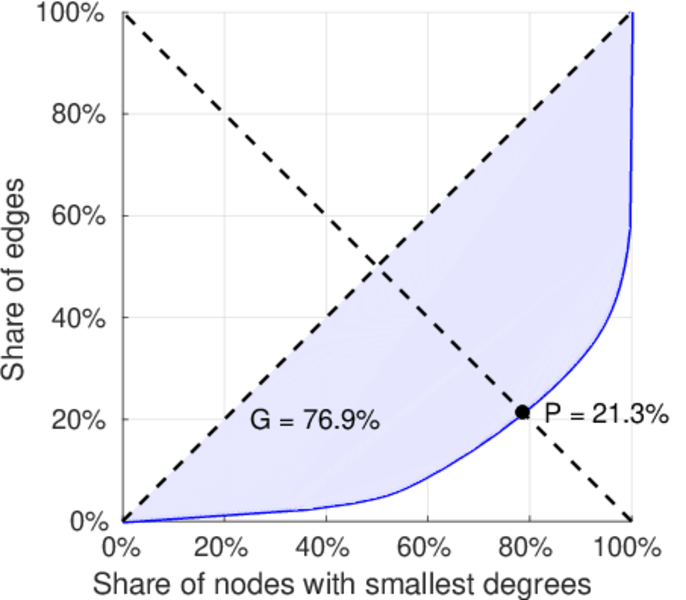
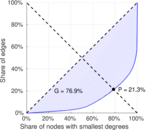
| Gini coefficient | G = | 0.775 876
|
| Balanced inequality ratio | P = | 0.209 242
|
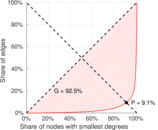
| Left balanced inequality ratio | P1 = | 0.091 469 0
|
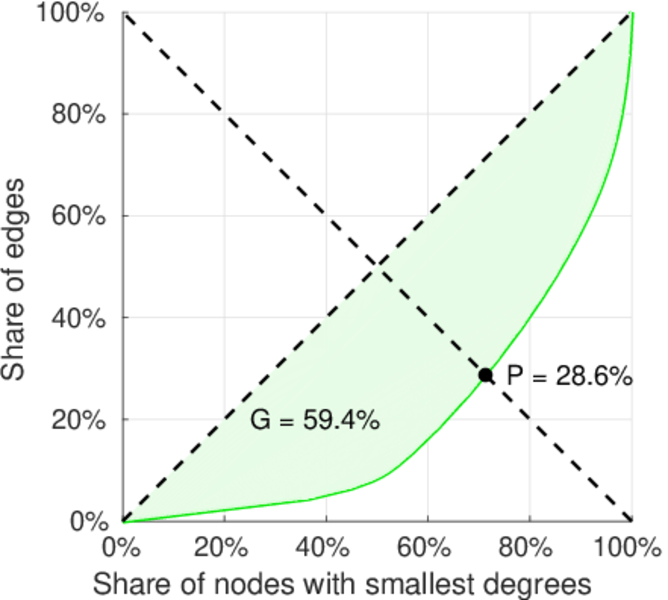
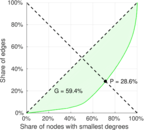
| Right balanced inequality ratio | P2 = | 0.285 742
|
| Relative edge distribution entropy | Her = | 0.751 368
|
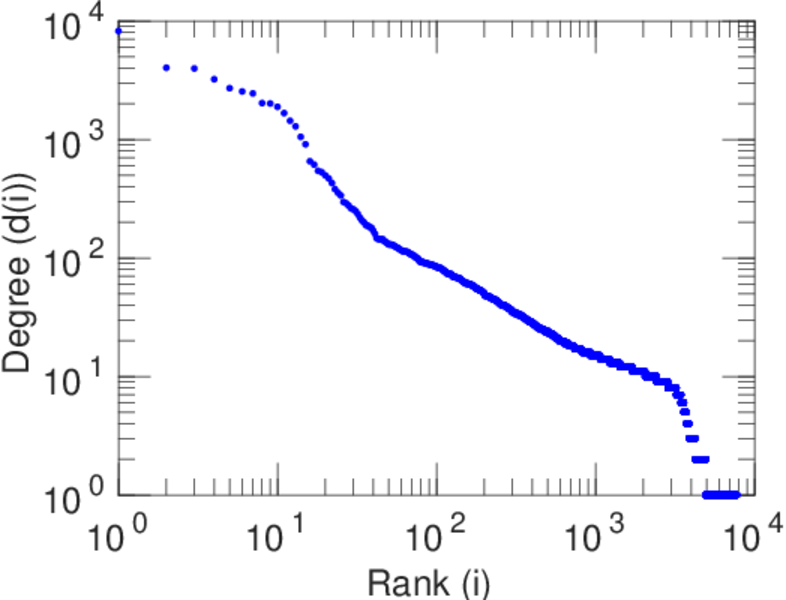
| Power law exponent | γ = | 2.040 85
|
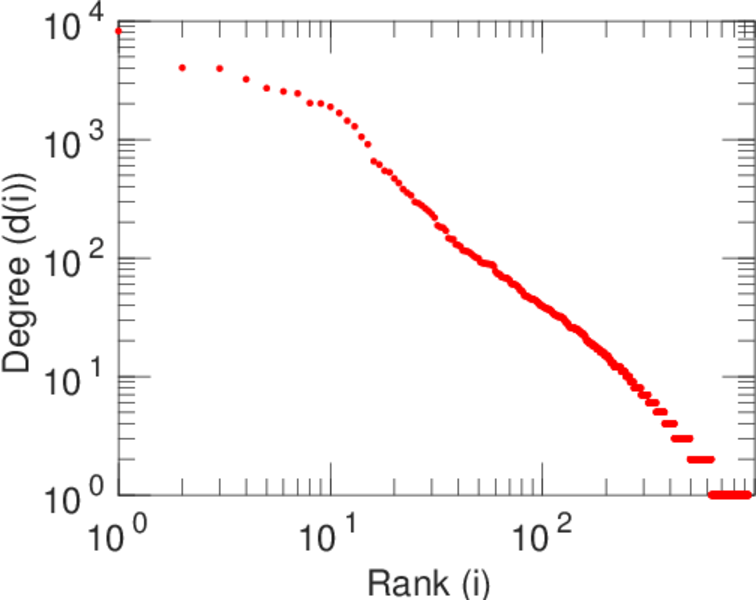
| Tail power law exponent | γt = | 3.461 00
|
| Tail power law exponent with p | γ3 = | 3.461 00
|
| p-value | p = | 0.000 00
|
| Left tail power law exponent with p | γ3,1 = | 1.761 00
|
| Left p-value | p1 = | 0.157 000
|
| Right tail power law exponent with p | γ3,2 = | 4.421 00
|
| Right p-value | p2 = | 0.118 000
|
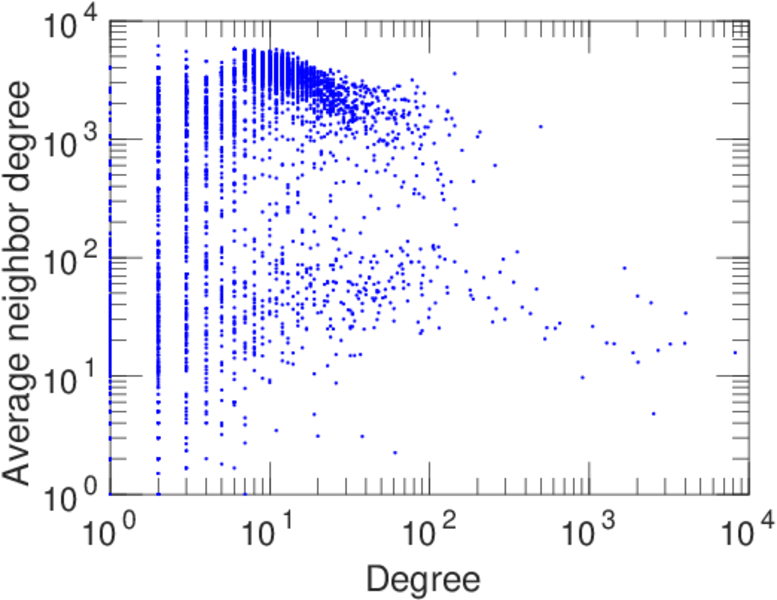
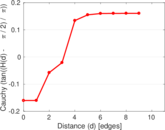
| Degree assortativity | ρ = | −0.218 200
|
| Degree assortativity p-value | pρ = | 7.368 93 × 10−308
|
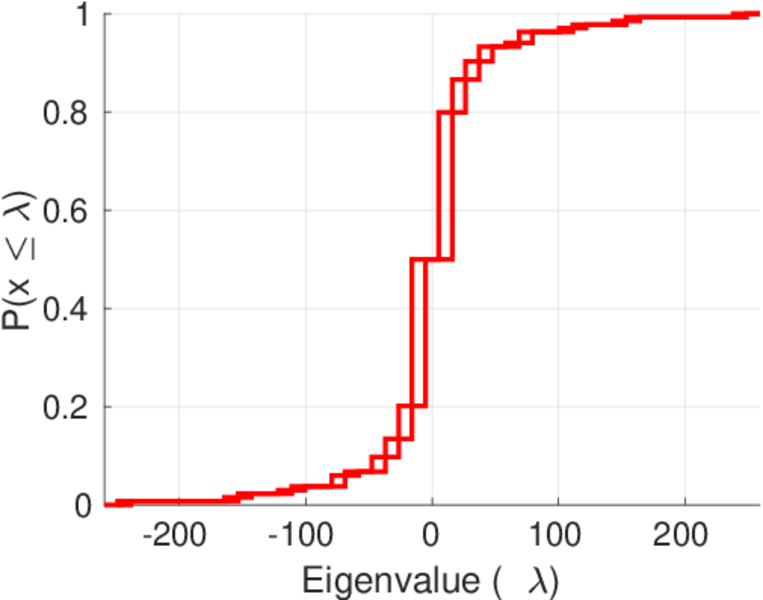
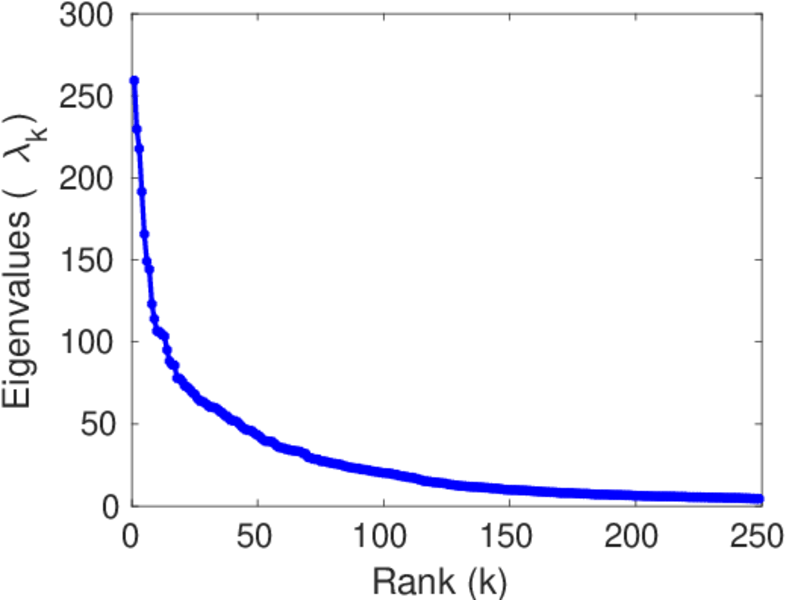
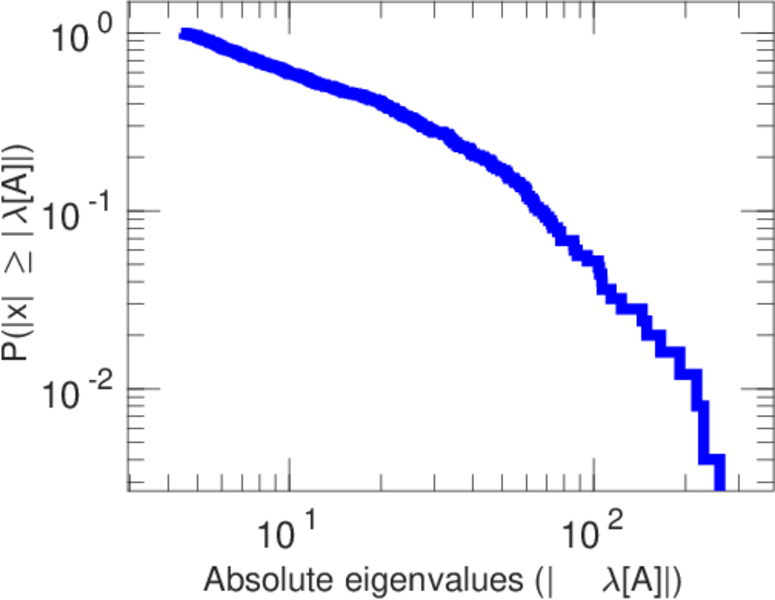
| Spectral norm | α = | 259.290
|
| Algebraic connectivity | a = | 0.079 827 9
|
| Spectral separation | |λ1[A] / λ2[A]| = | 1.128 93
|
| Controllability | C = | 6,225
|
| Relative controllability | Cr = | 0.805 200
|
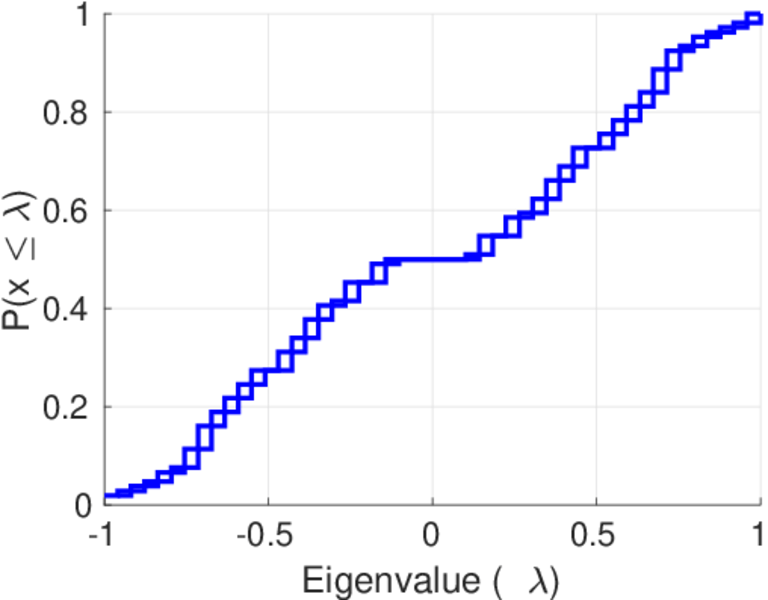
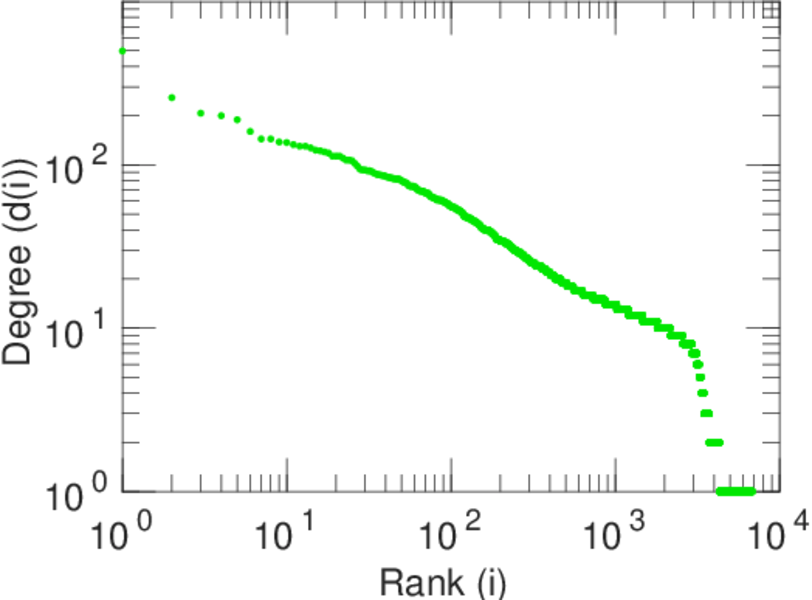
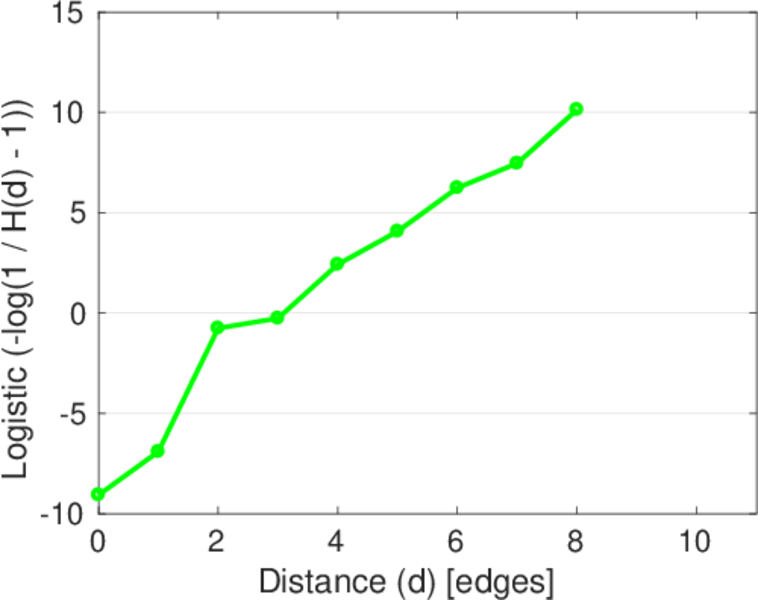
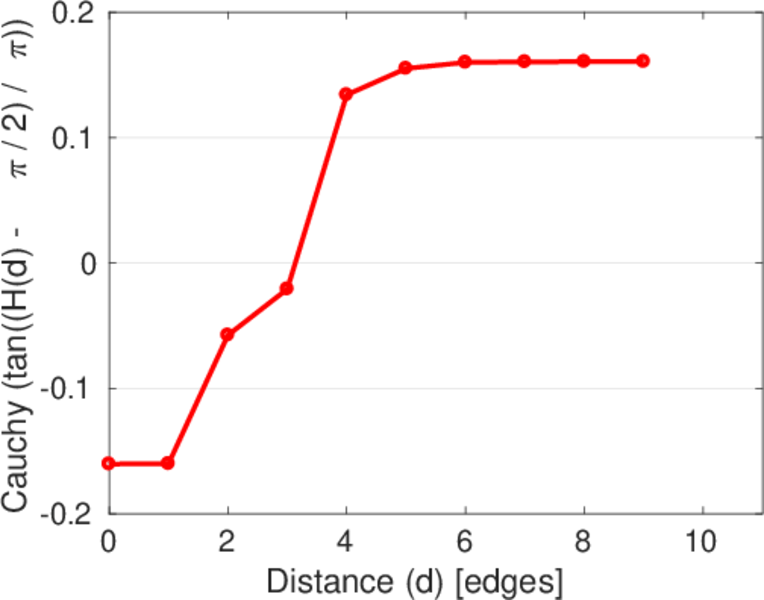
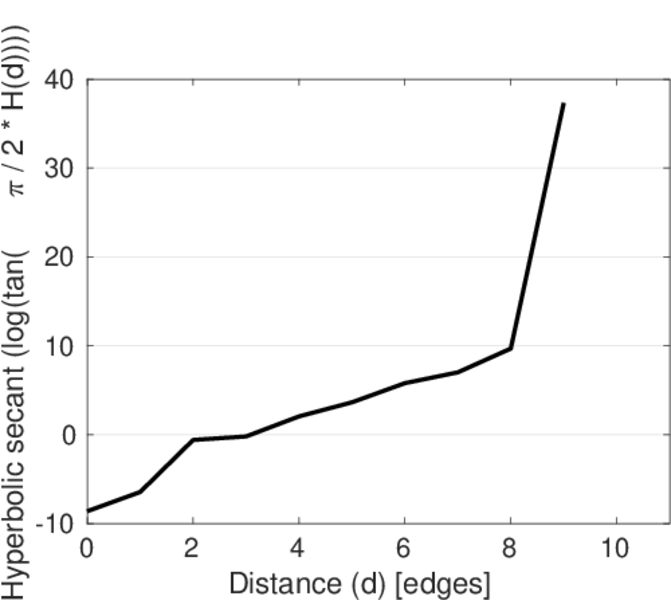
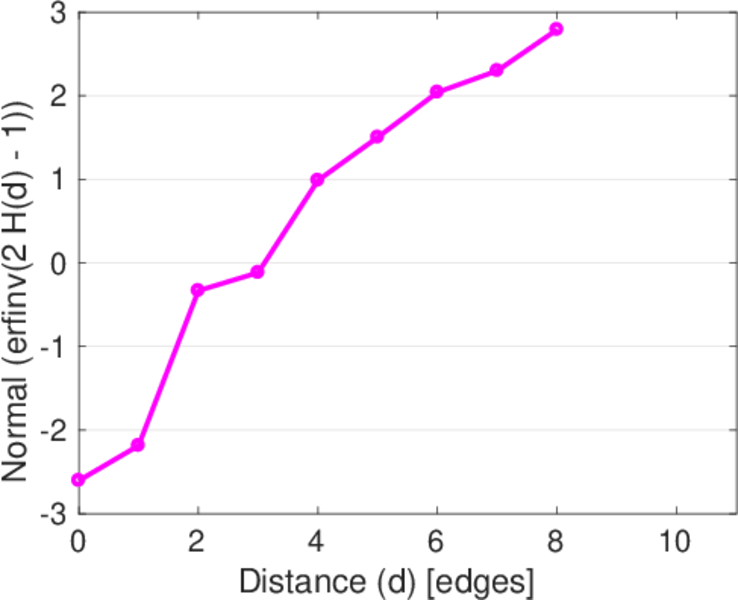
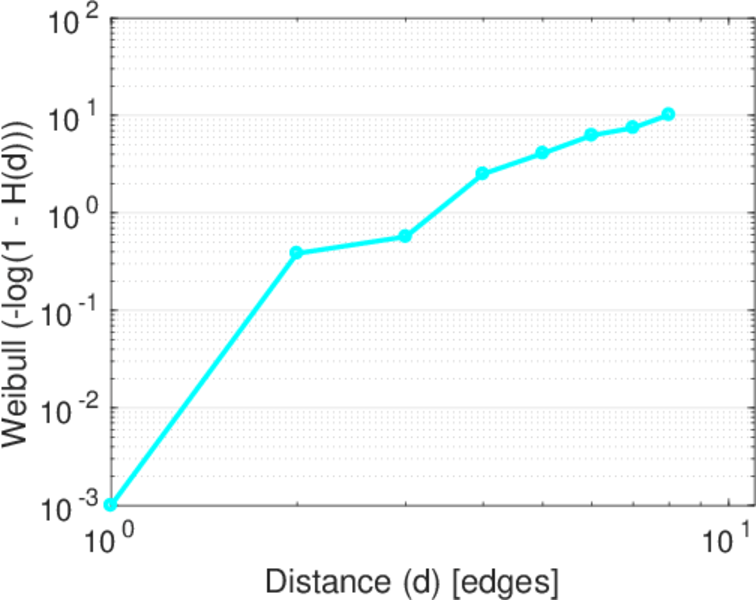
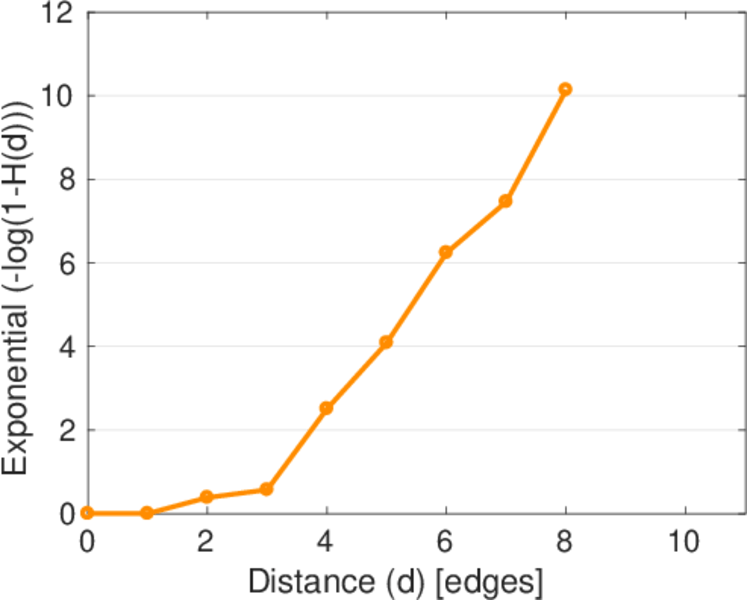
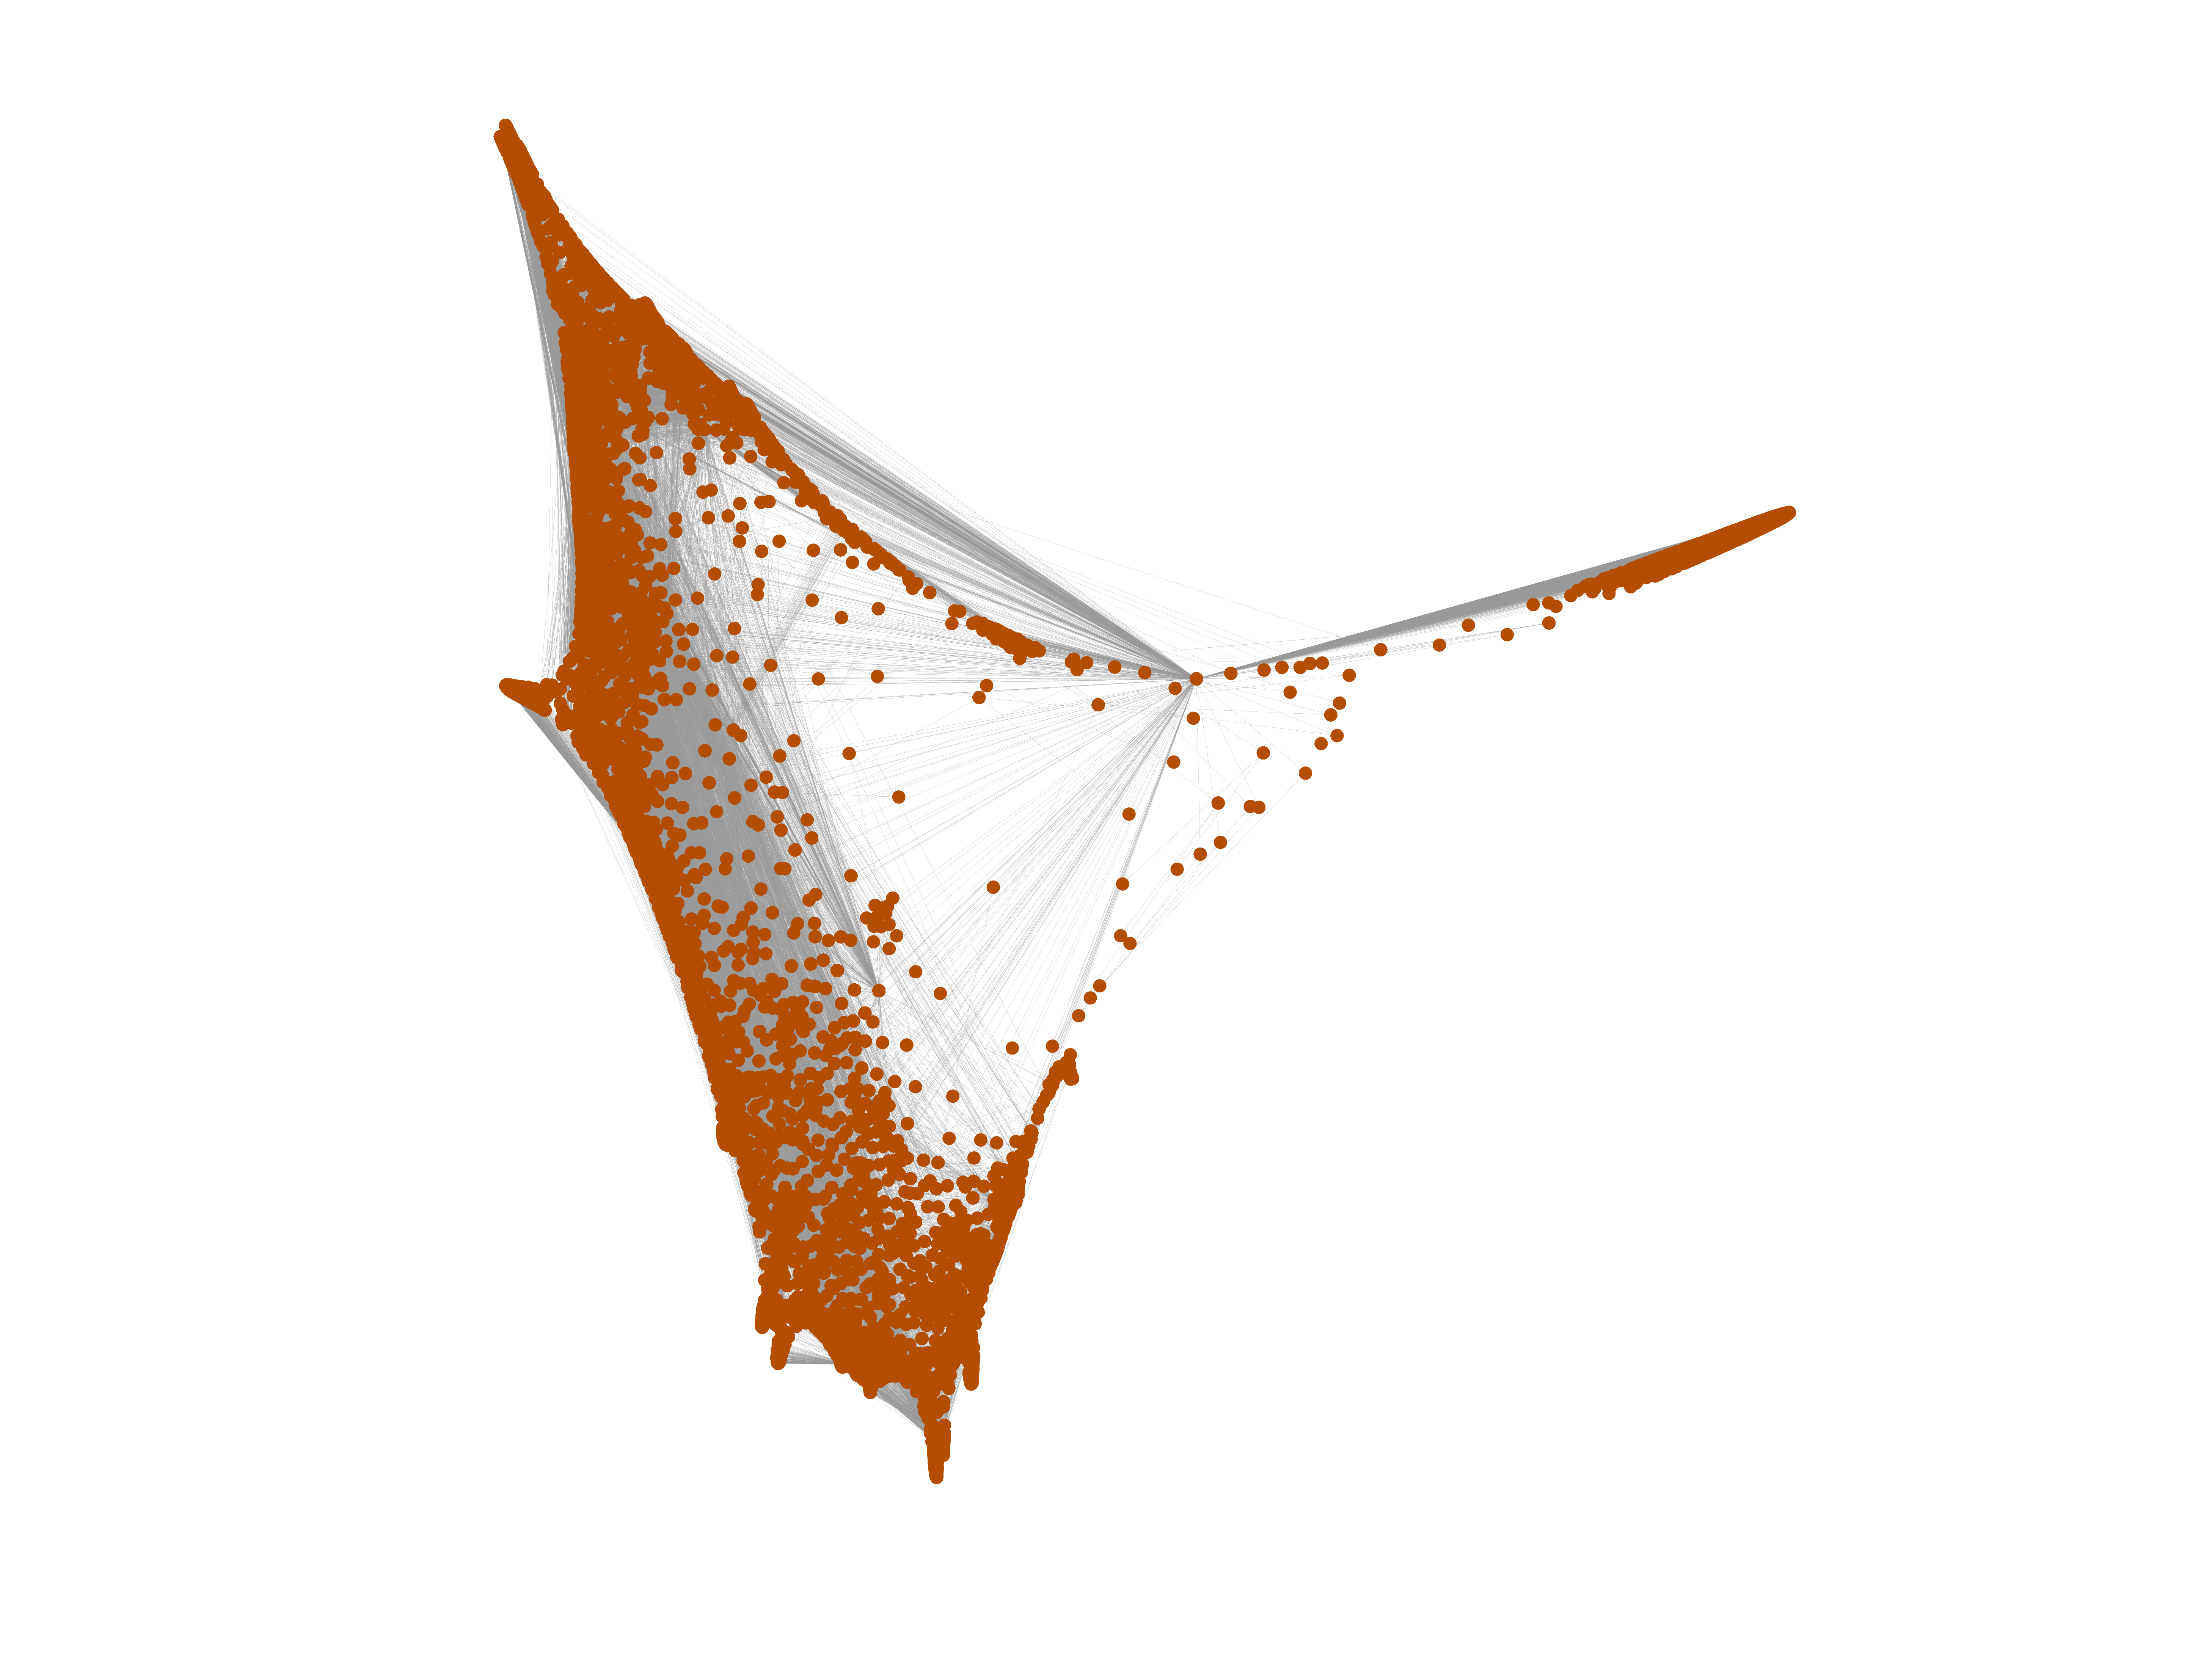
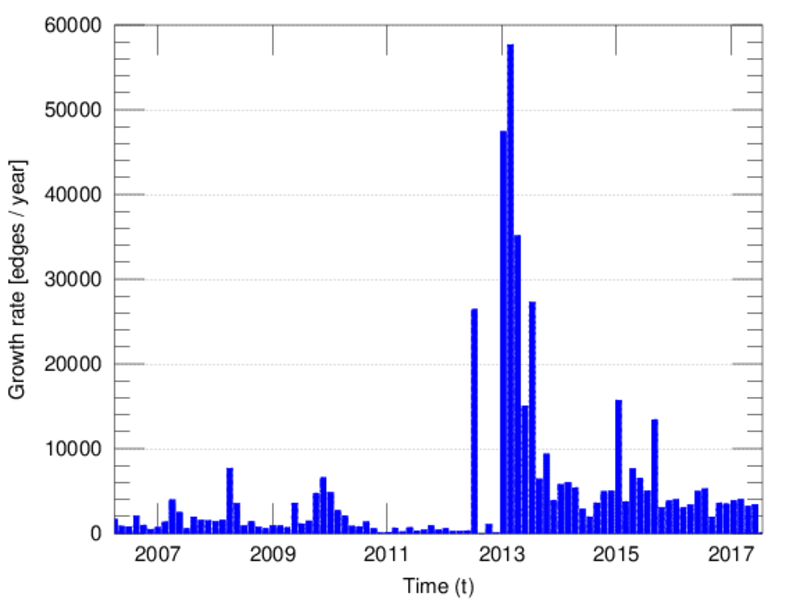
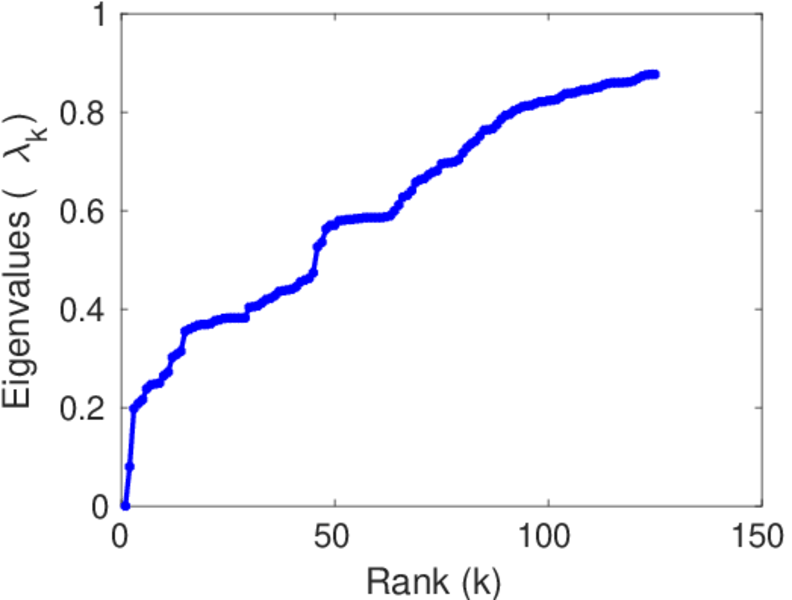
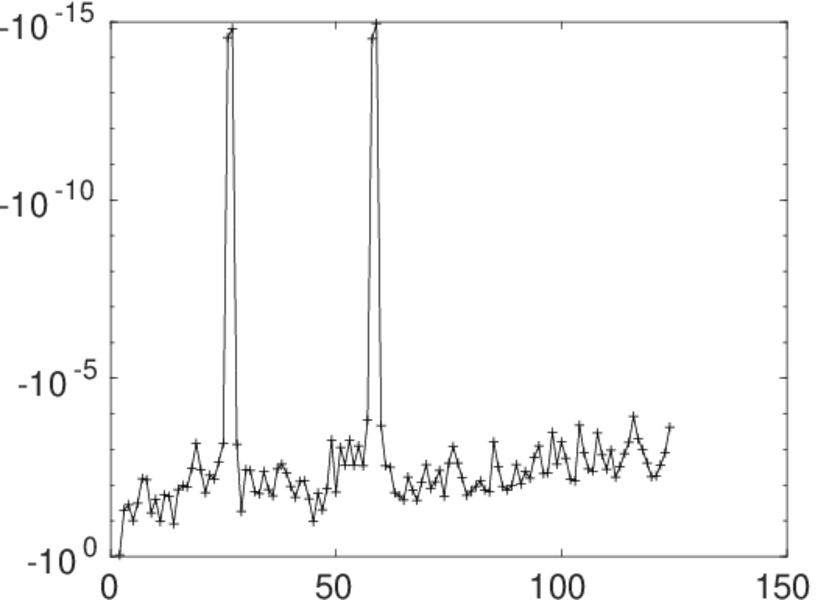
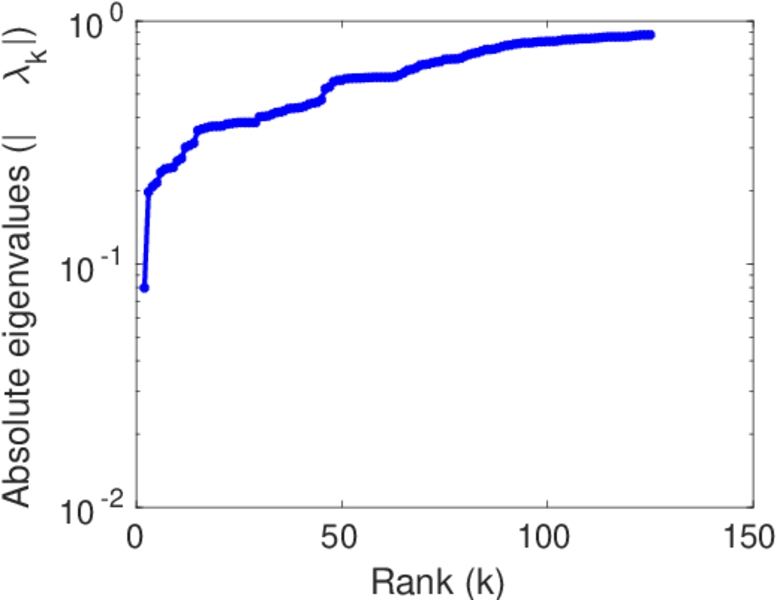
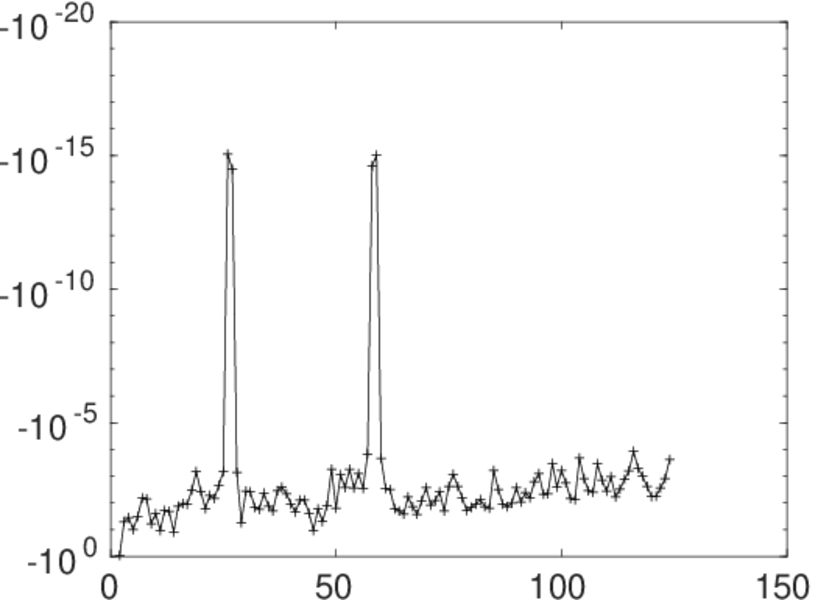
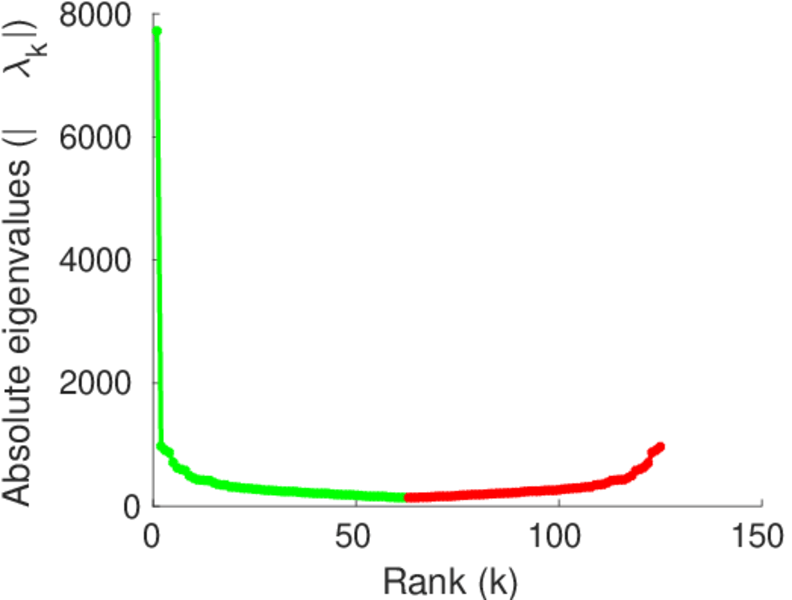
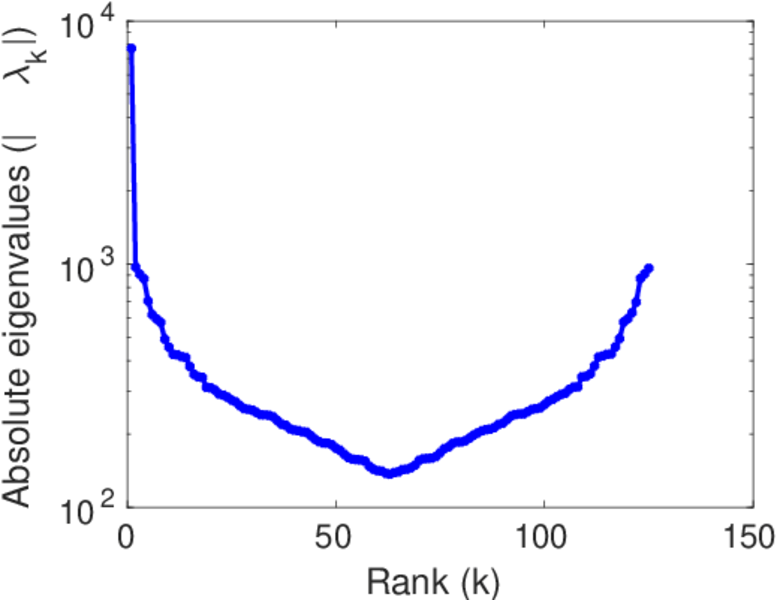
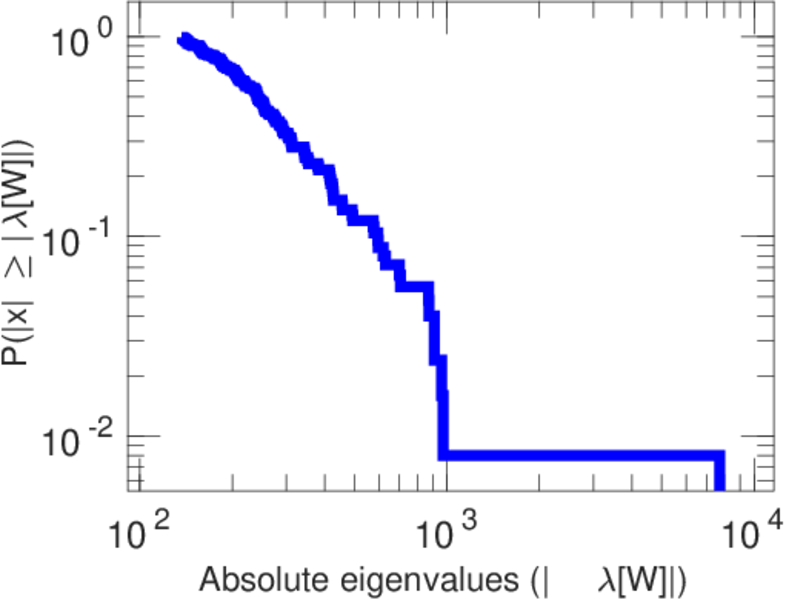
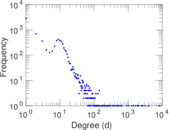
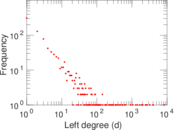
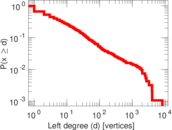
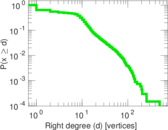
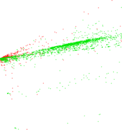
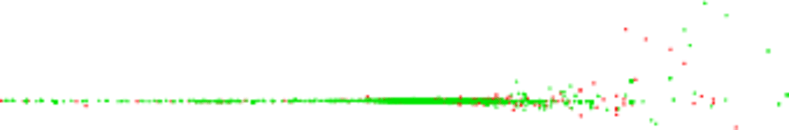
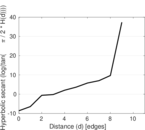
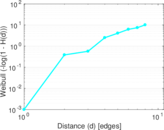
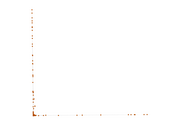
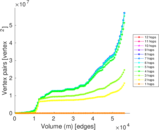
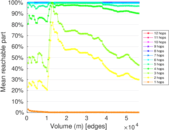
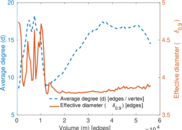
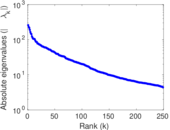
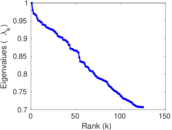
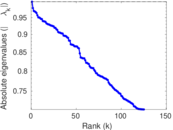
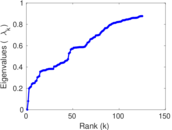
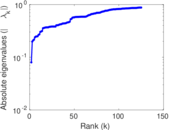
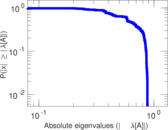
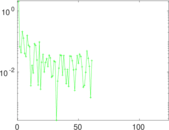
Plots


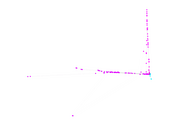

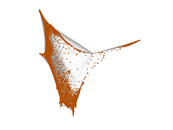


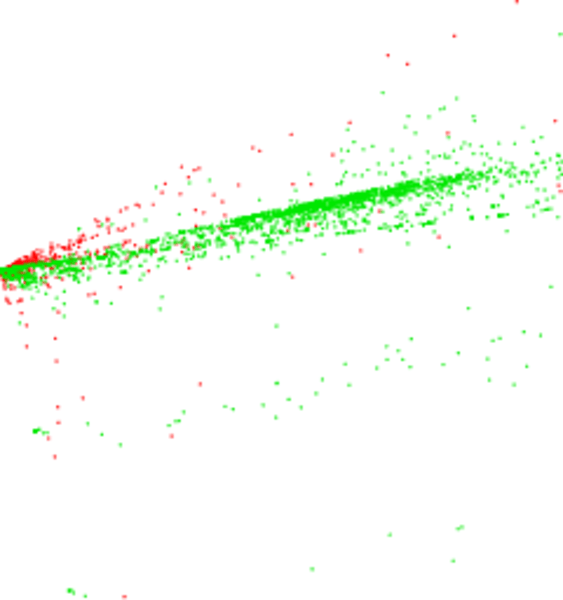
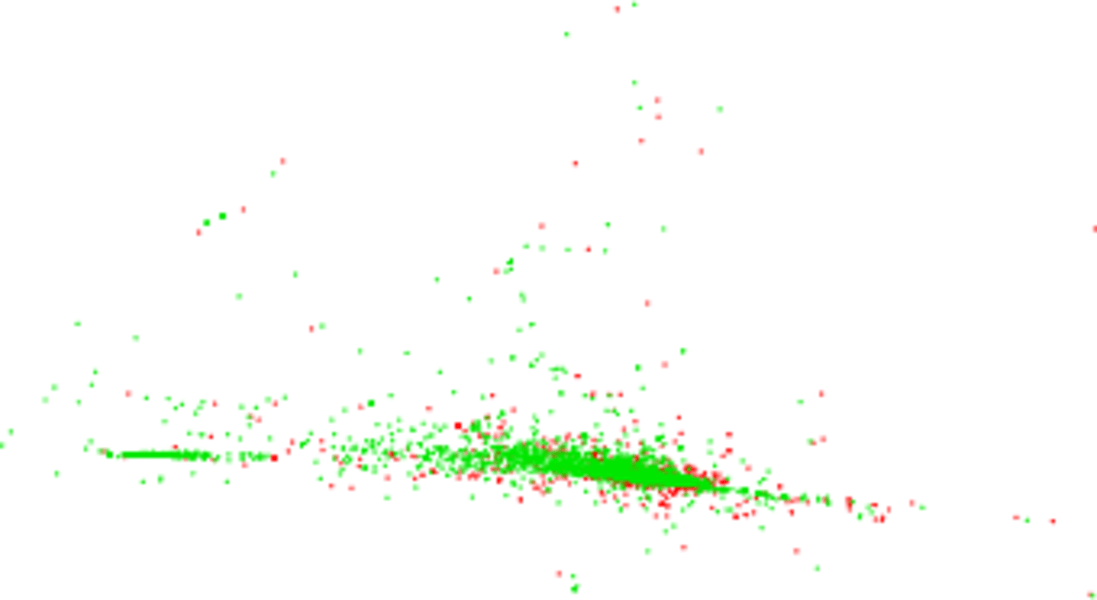
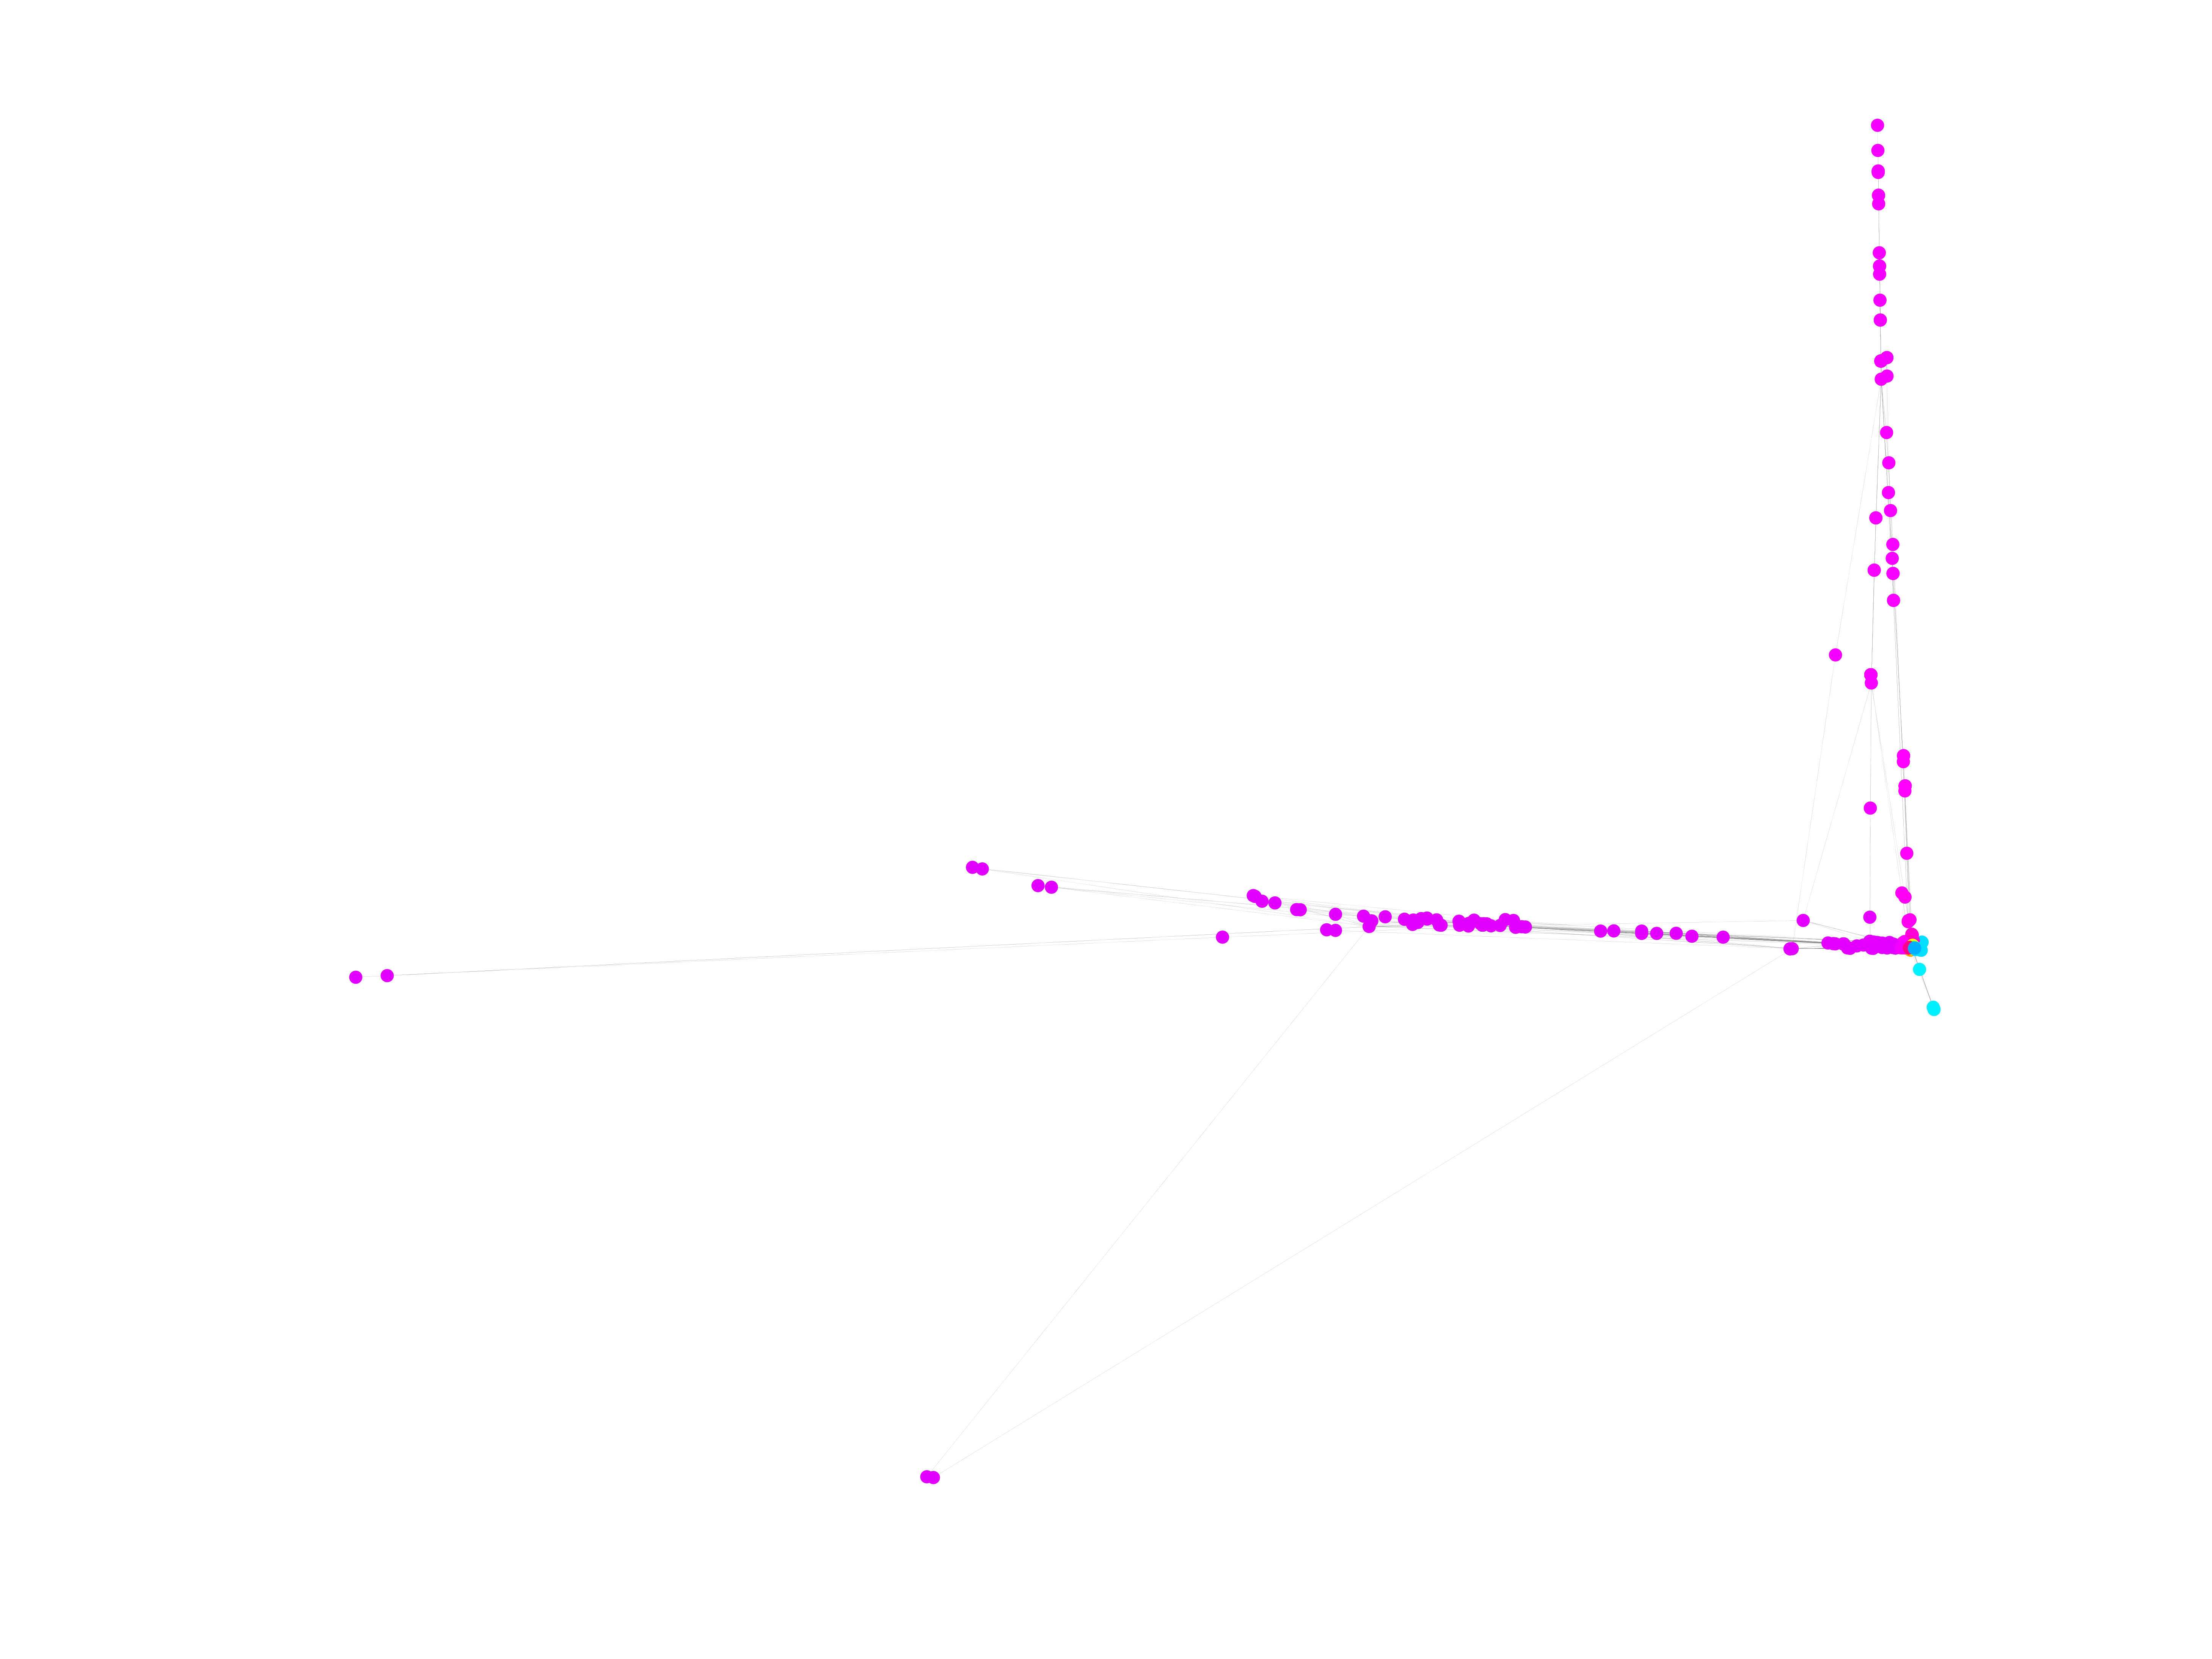
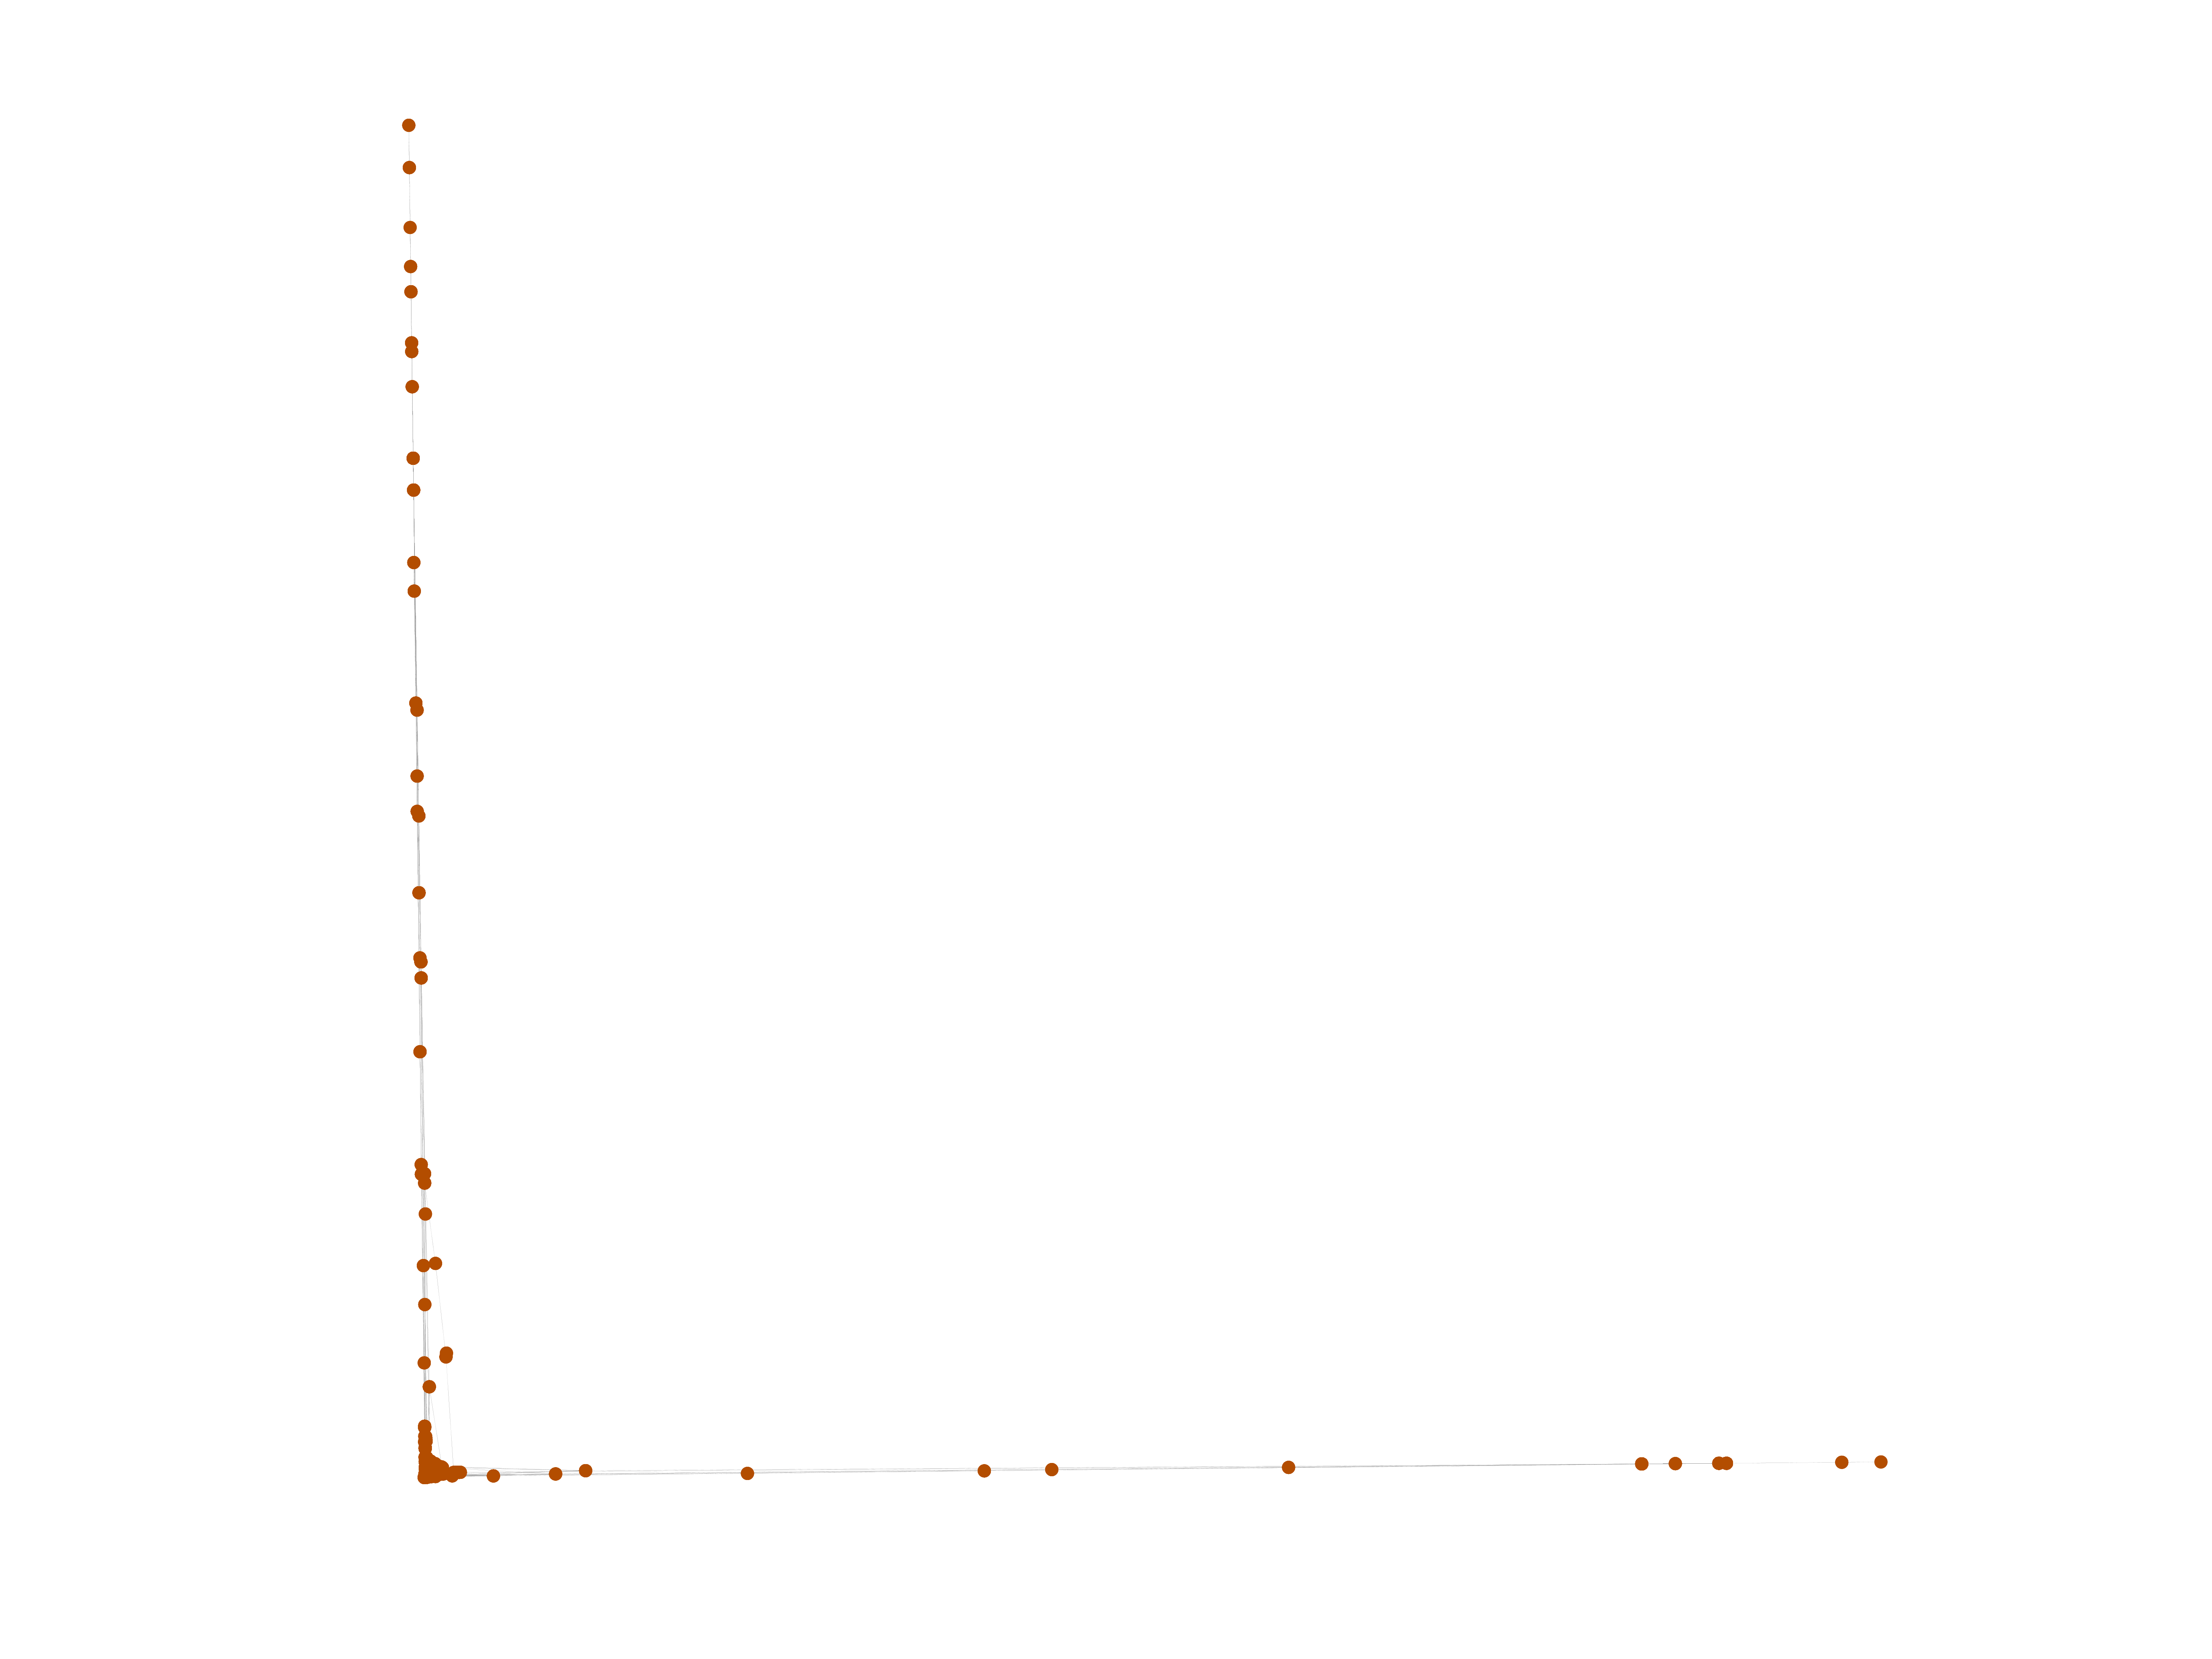
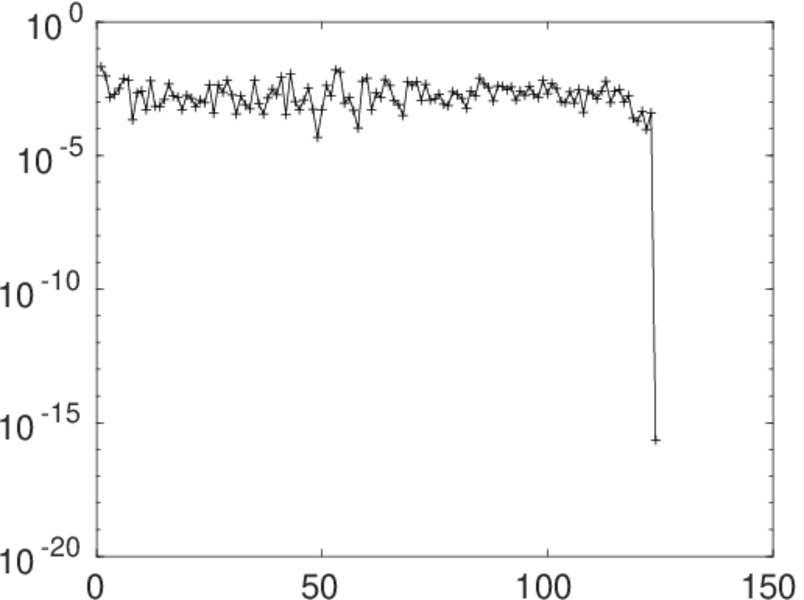
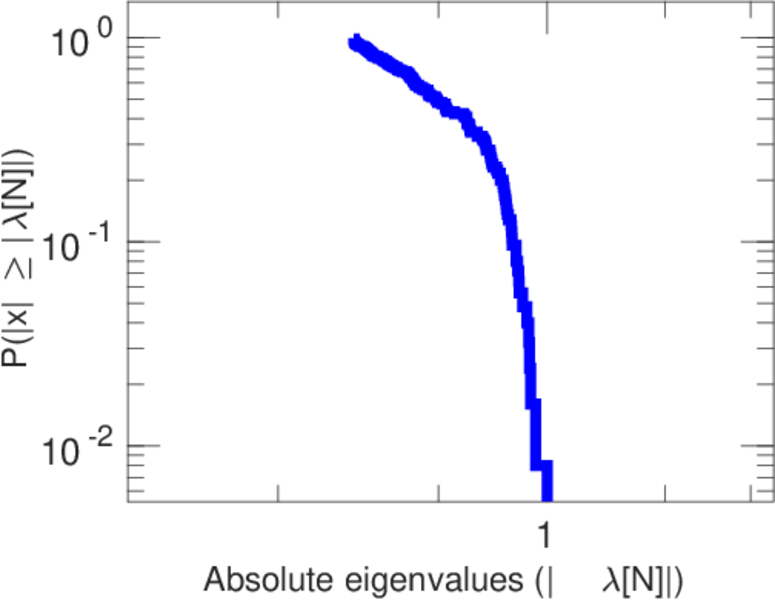
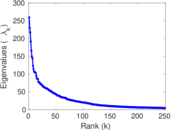
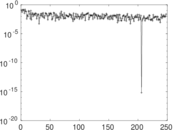
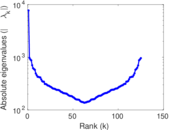
Matrix decompositions plots


Downloads
References
|
[1]
|
Jérôme Kunegis.
KONECT – The Koblenz Network Collection.
In Proc. Int. Conf. on World Wide Web Companion, pages
1343–1350, 2013.
[ http ]
|
|
[2]
|
Wikimedia Foundation.
Wikimedia downloads.
http://dumps.wikimedia.org/, January 2010.
|
 KONECT ‣ Networks ‣
Buy Me a Coffee
KONECT ‣ Networks ‣
Buy Me a Coffee