Wikipedia edits (pms)
This is the bipartite edit network of the Piedmontese Wikipedia. It contains
users and pages from the Piedmontese Wikipedia, connected by edit events. Each
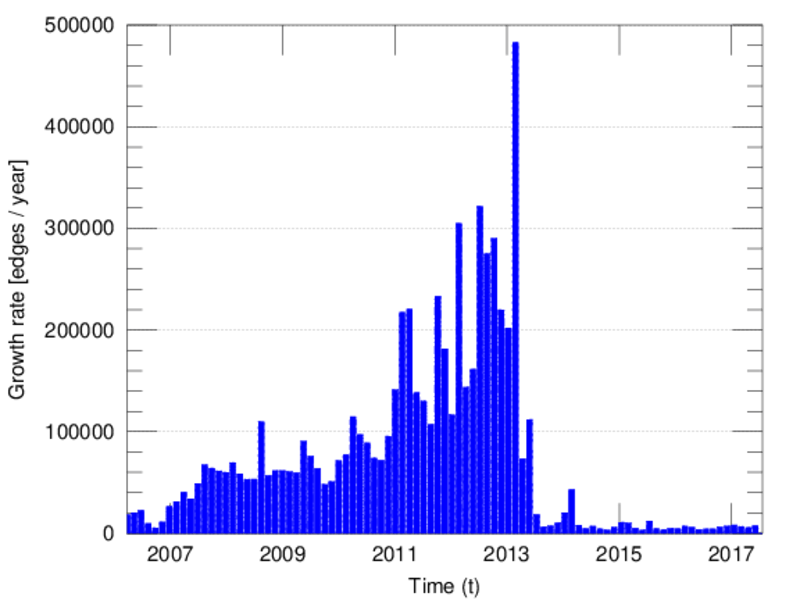
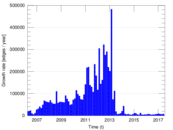
edge represents an edit. The dataset includes the timestamp of each edit.
Metadata
Statistics
| Size | n = | 100,224
|
| Left size | n1 = | 2,206
|
| Right size | n2 = | 98,018
|
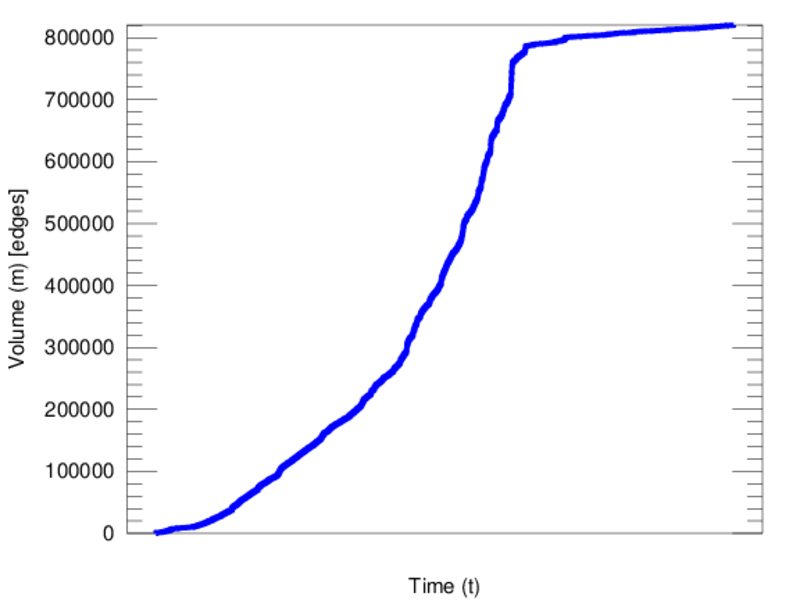
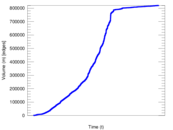
| Volume | m = | 820,463
|
| Unique edge count | m̿ = | 516,674
|
| Wedge count | s = | 6,161,512,530
|
| Claw count | z = | 77,095,266,439,718
|
| Square count | q = | 8,747,089,216
|
| 4-Tour count | T4 = | 94,623,827,888
|
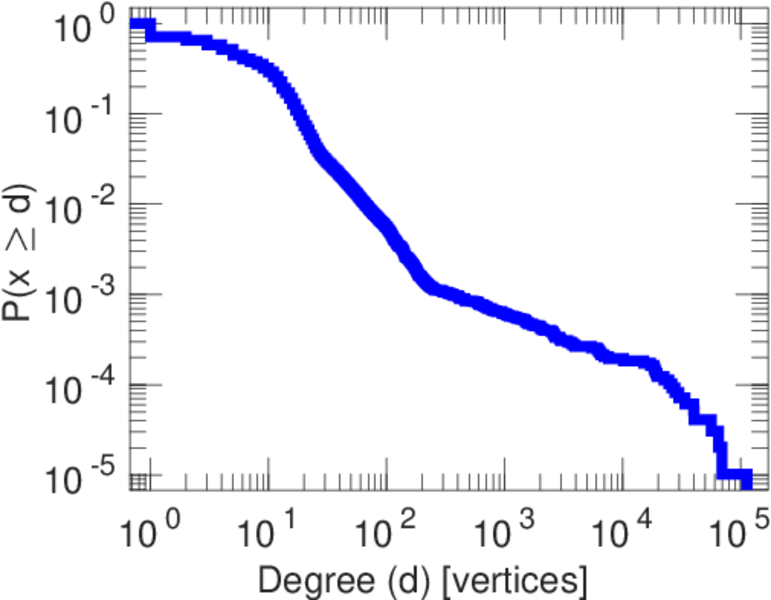
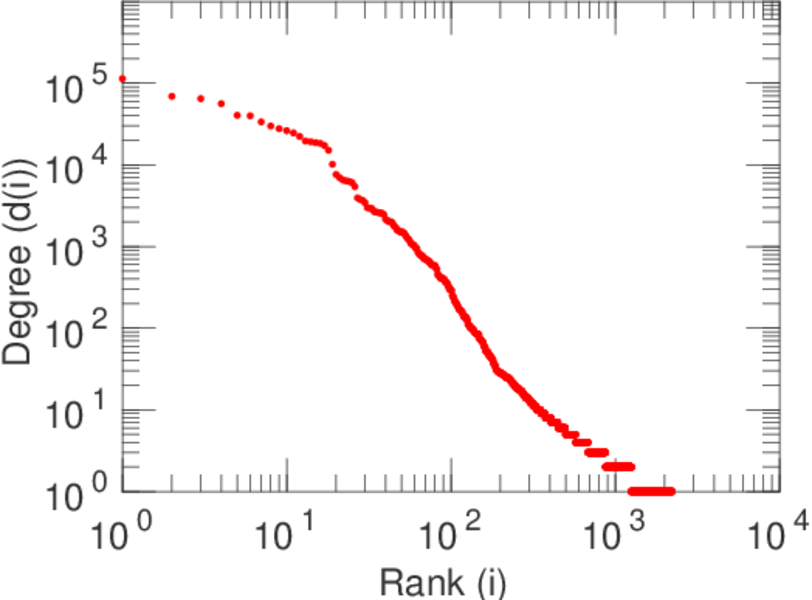
| Maximum degree | dmax = | 113,361
|
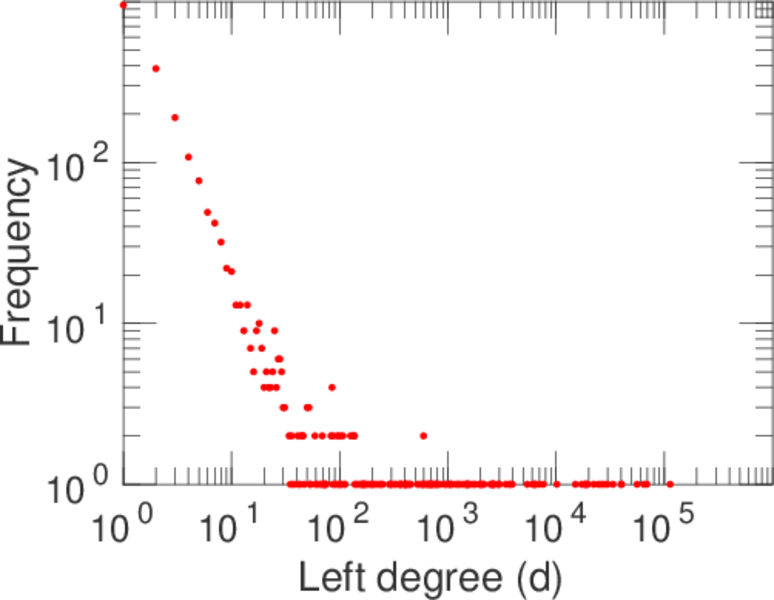
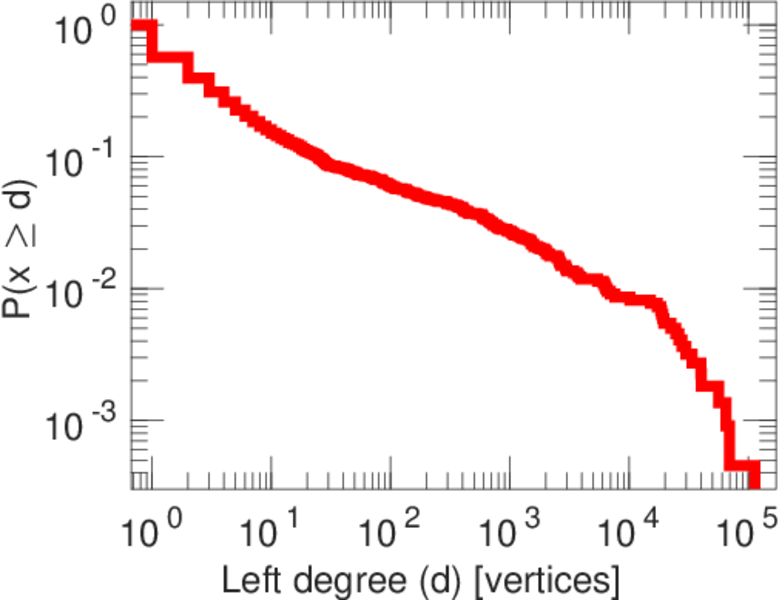
| Maximum left degree | d1max = | 113,361
|
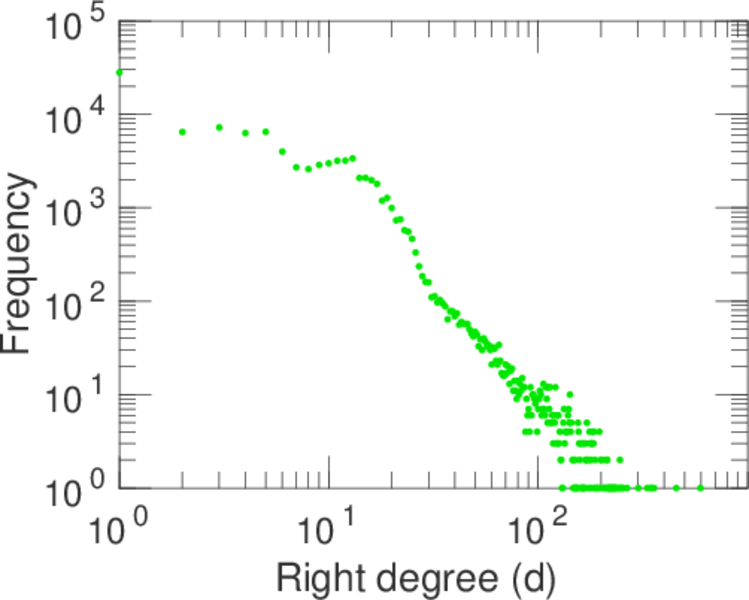
| Maximum right degree | d2max = | 596
|
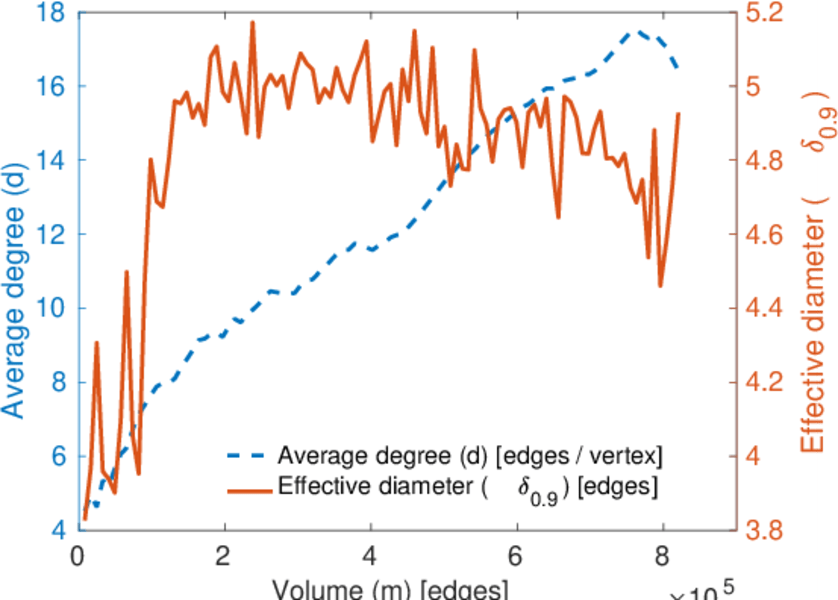
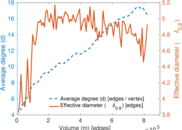
| Average degree | d = | 16.372 6
|
| Average left degree | d1 = | 371.923
|
| Average right degree | d2 = | 8.370 53
|
| Fill | p = | 0.002 389 49
|
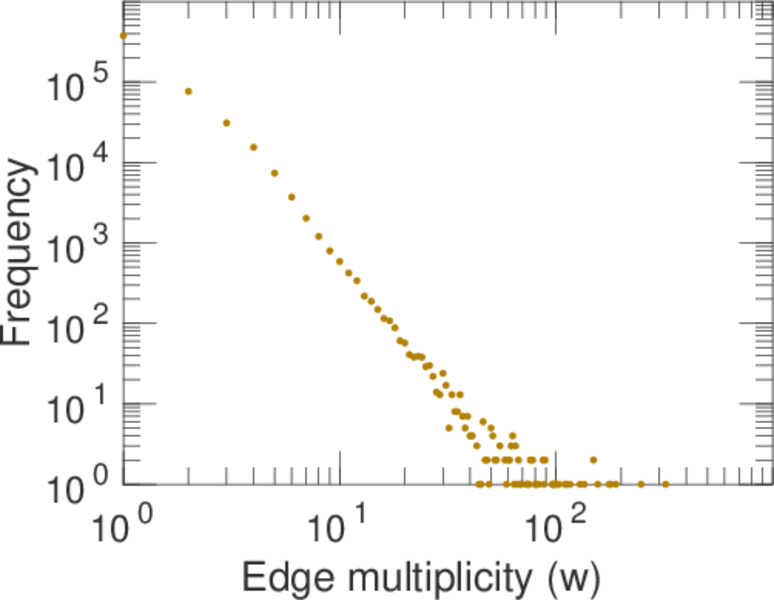
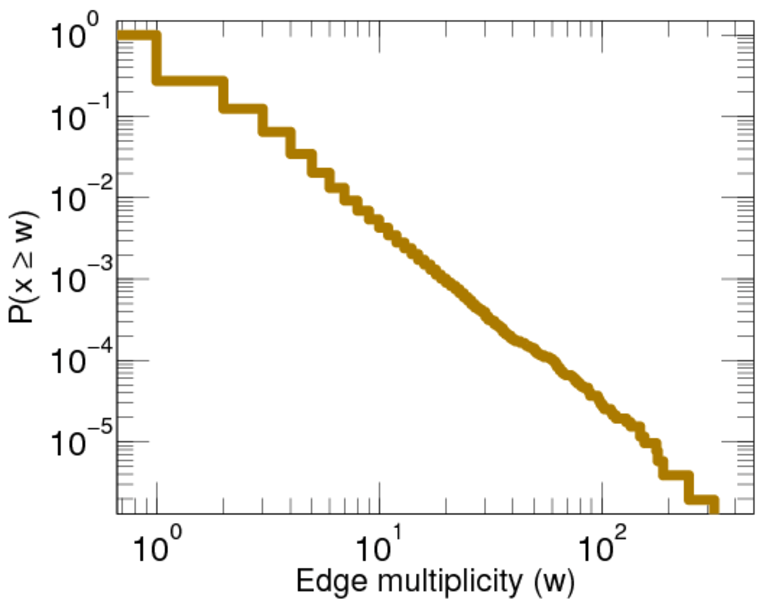
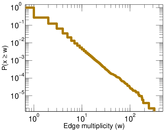
| Average edge multiplicity | m̃ = | 1.587 97
|
| Size of LCC | N = | 99,346
|
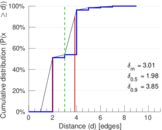
| Diameter | δ = | 11
|
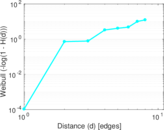
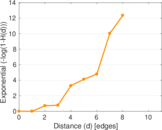
| 50-Percentile effective diameter | δ0.5 = | 1.975 04
|
| 90-Percentile effective diameter | δ0.9 = | 3.851 00
|
| Median distance | δM = | 2
|
| Mean distance | δm = | 3.008 41
|
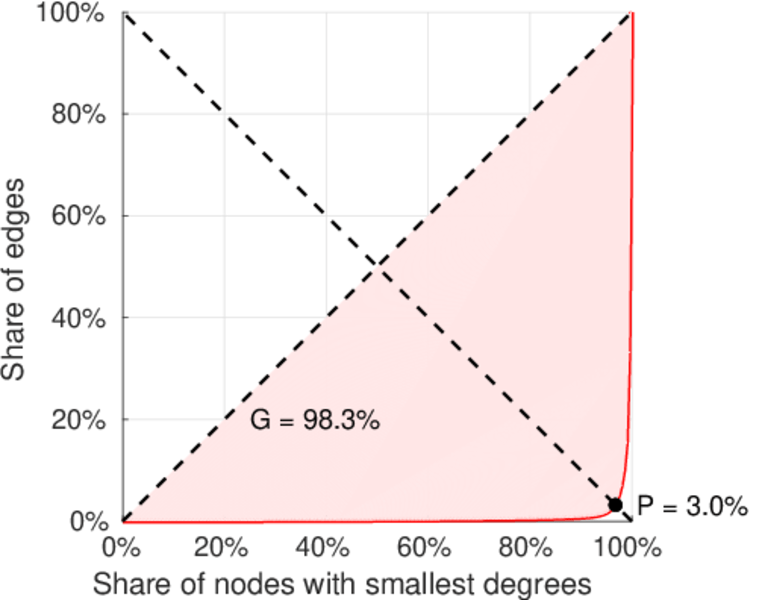
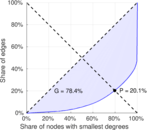
| Gini coefficient | G = | 0.782 449
|
| Balanced inequality ratio | P = | 0.203 428
|
| Left balanced inequality ratio | P1 = | 0.030 248 8
|
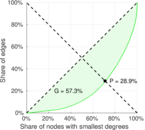
| Right balanced inequality ratio | P2 = | 0.288 654
|
| Relative edge distribution entropy | Her = | 0.703 030
|
| Power law exponent | γ = | 1.818 28
|
| Tail power law exponent | γt = | 3.751 00
|
| Tail power law exponent with p | γ3 = | 3.751 00
|
| p-value | p = | 0.000 00
|
| Left tail power law exponent with p | γ3,1 = | 1.681 00
|
| Left p-value | p1 = | 0.000 00
|
| Right tail power law exponent with p | γ3,2 = | 4.231 00
|
| Right p-value | p2 = | 0.000 00
|
| Degree assortativity | ρ = | −0.289 440
|
| Degree assortativity p-value | pρ = | 0.000 00
|
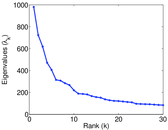
| Algebraic connectivity | a = | 0.108 046
|
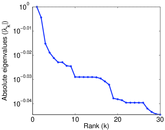
| Spectral separation | |λ1[A] / λ2[A]| = | 1.355 07
|
| Controllability | C = | 95,724
|
| Relative controllability | Cr = | 0.958 045
|
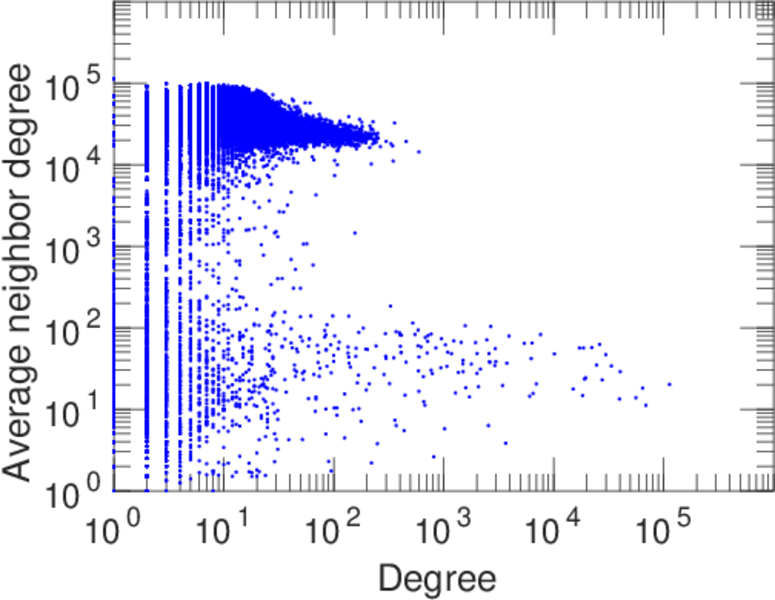
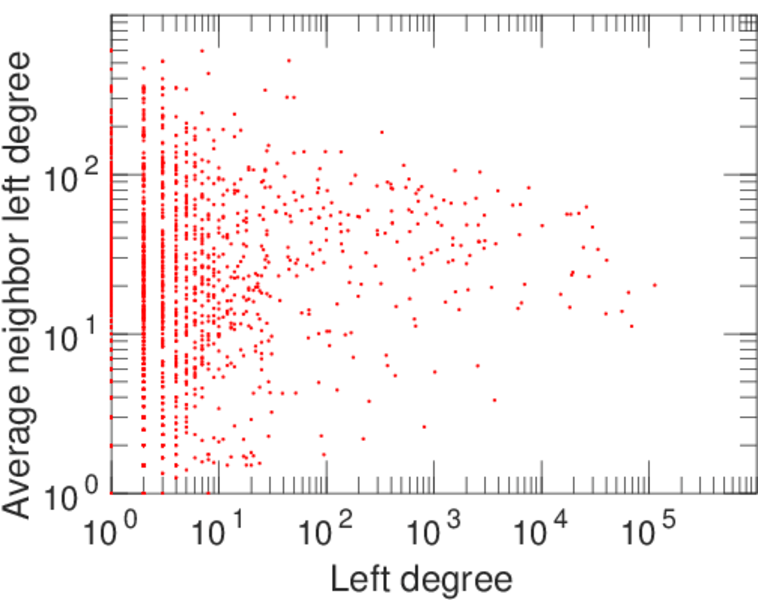
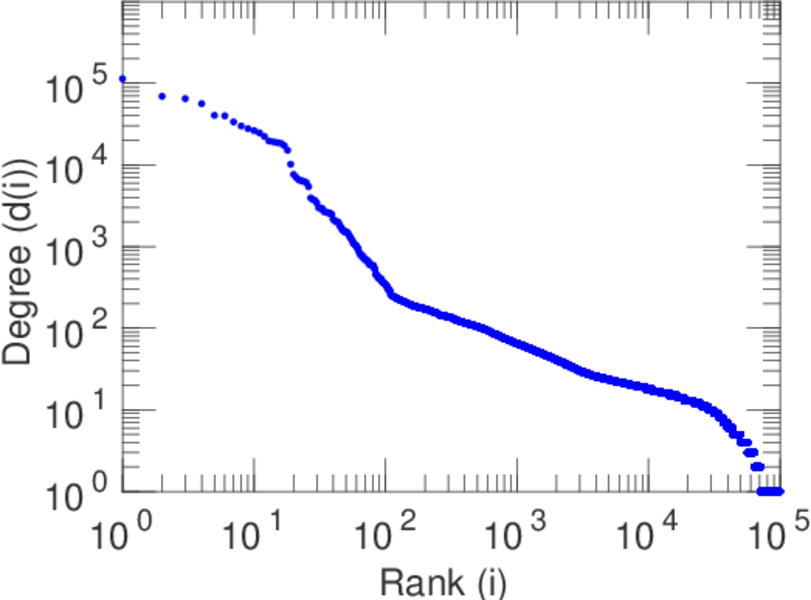
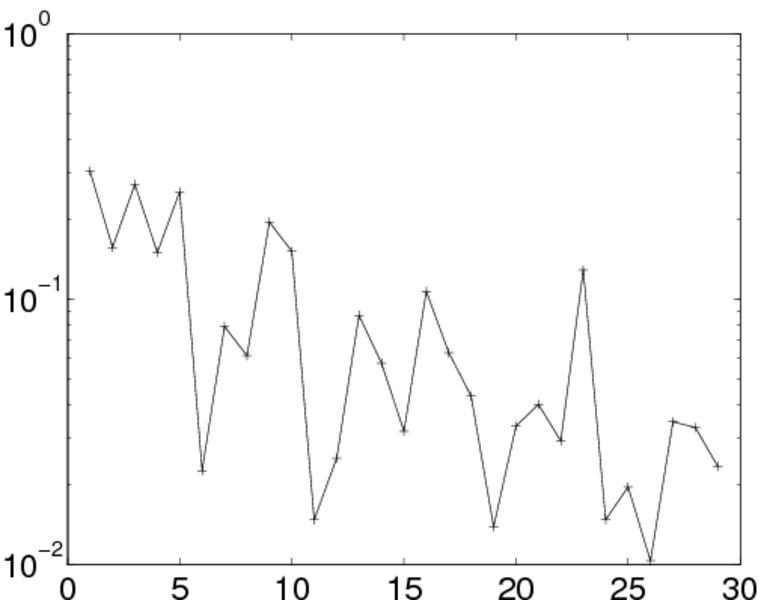
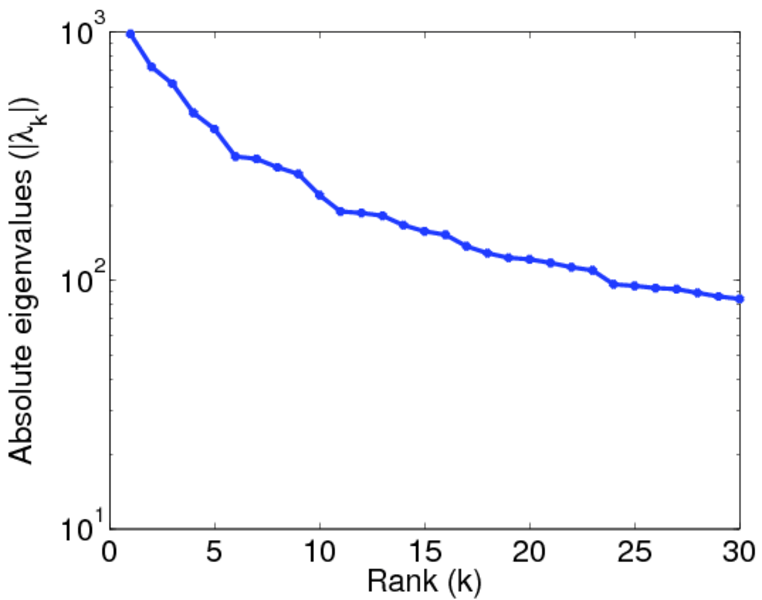
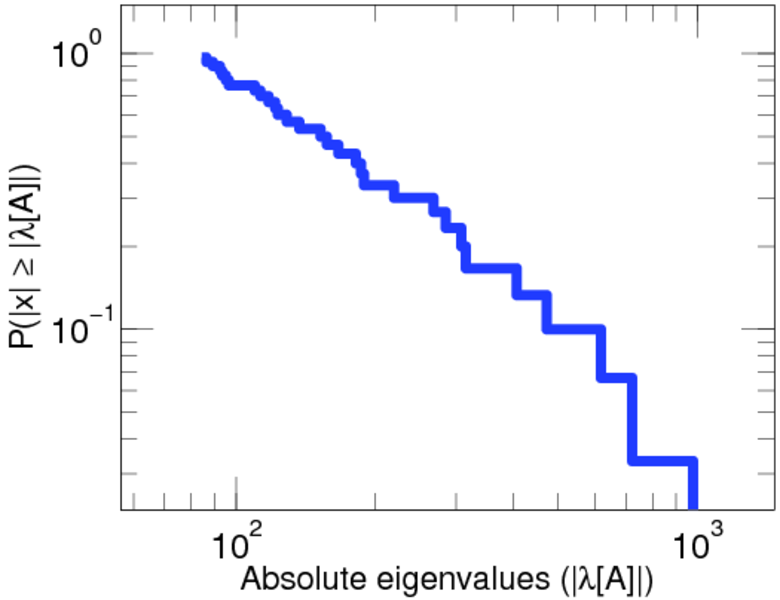
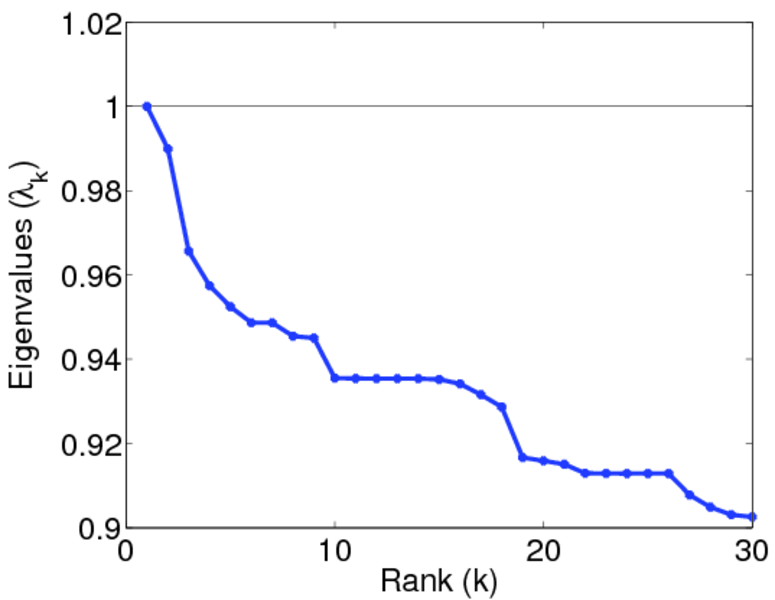
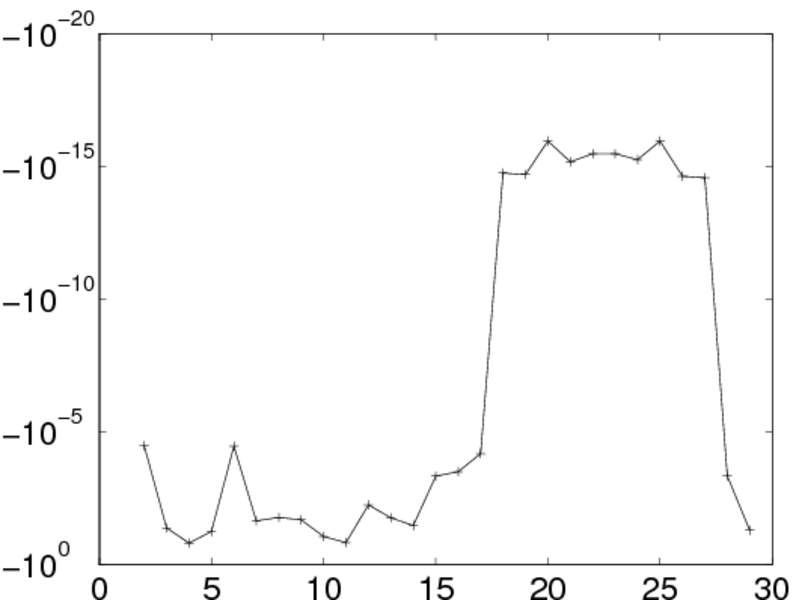
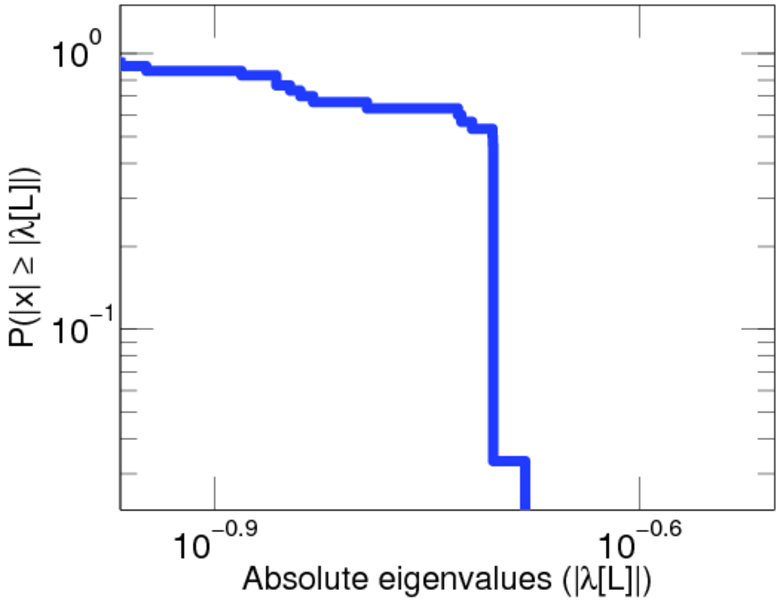
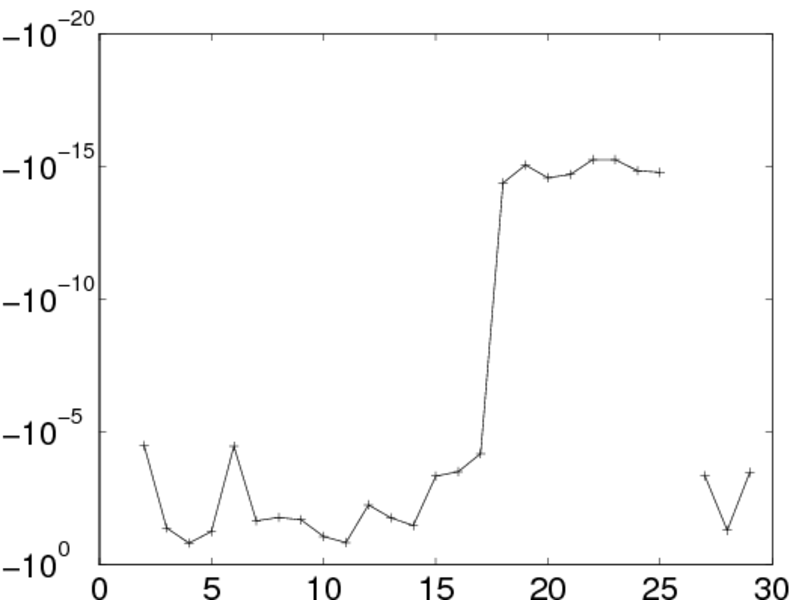
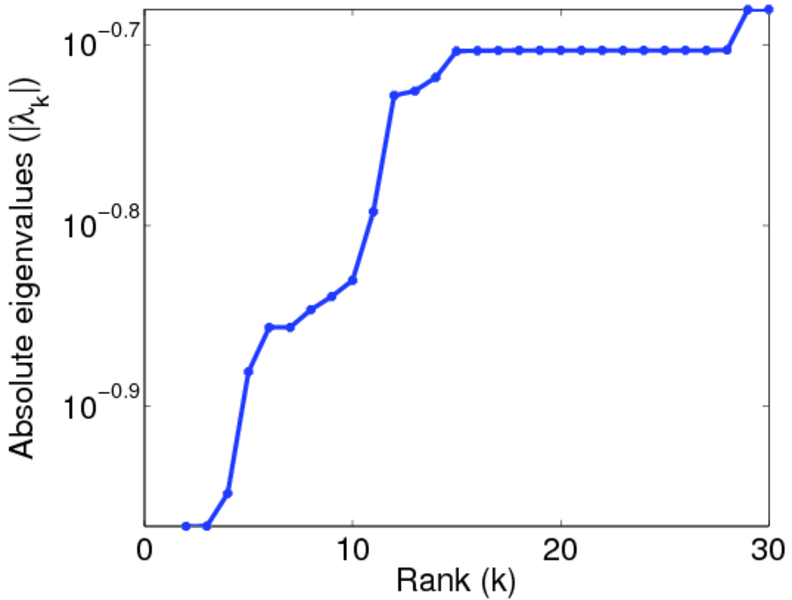
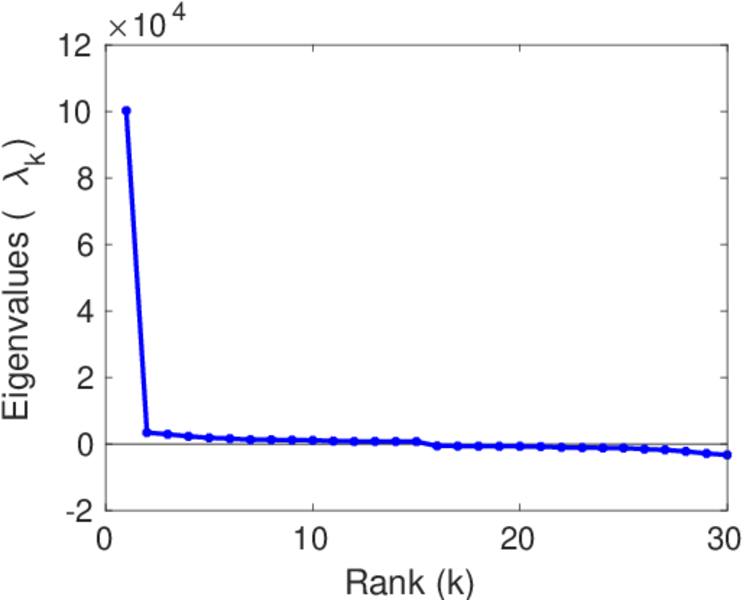
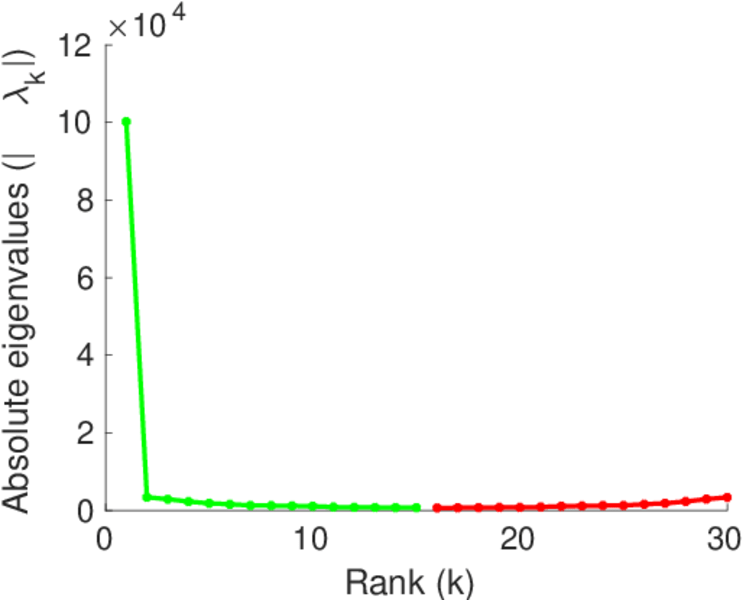
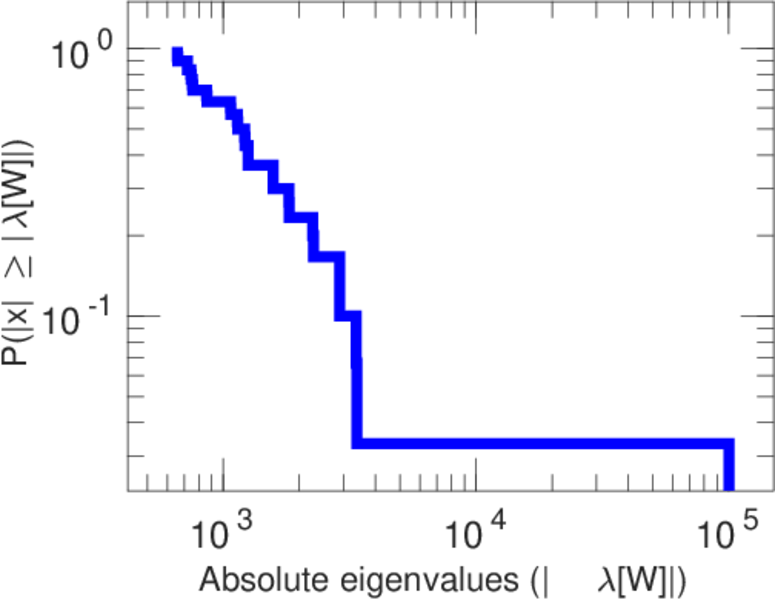
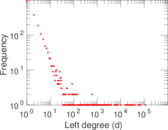
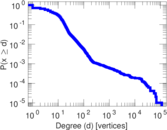
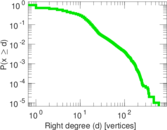
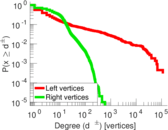
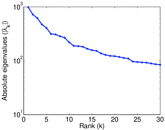
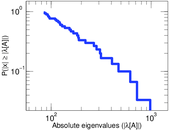
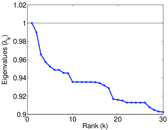
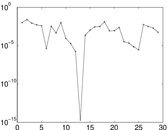
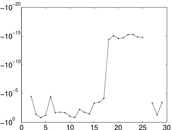
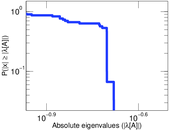
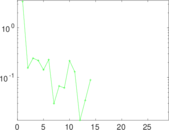
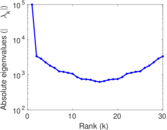
Plots


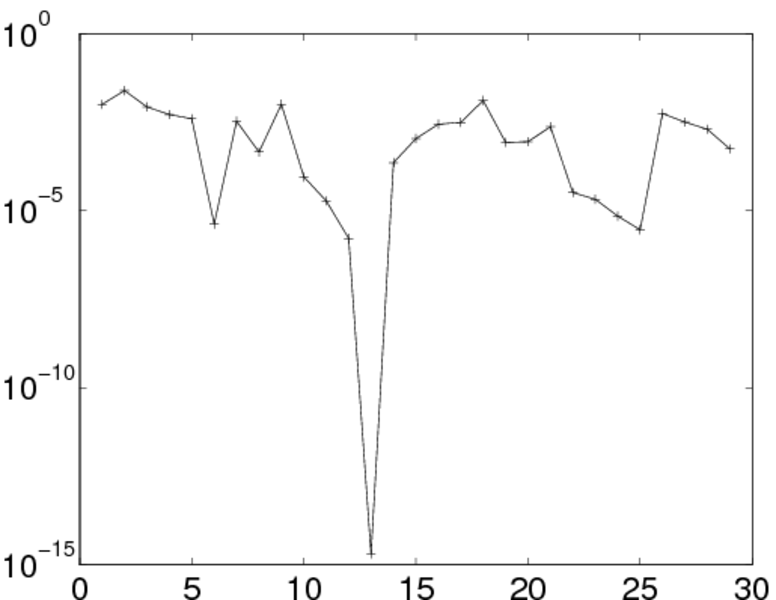
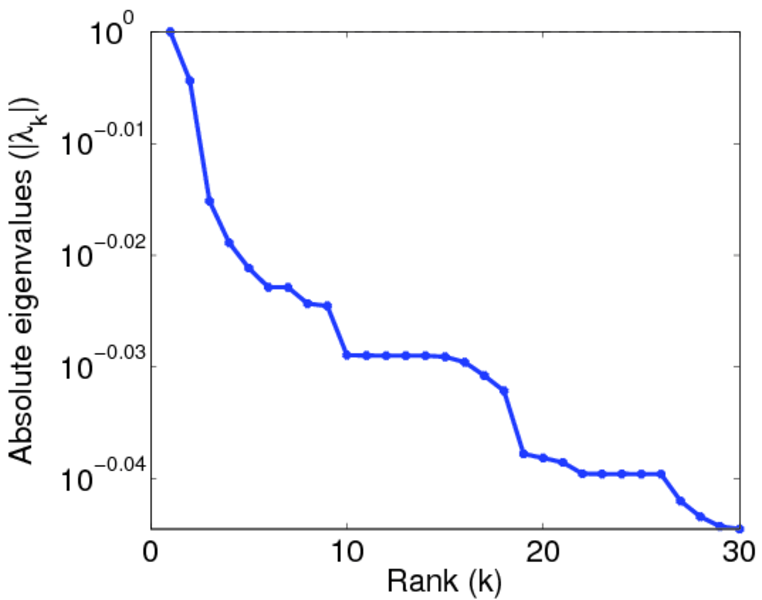
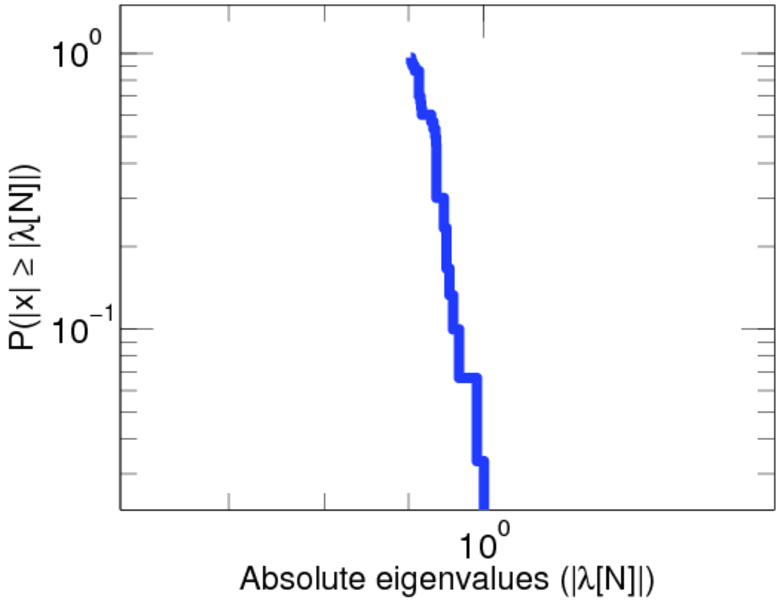
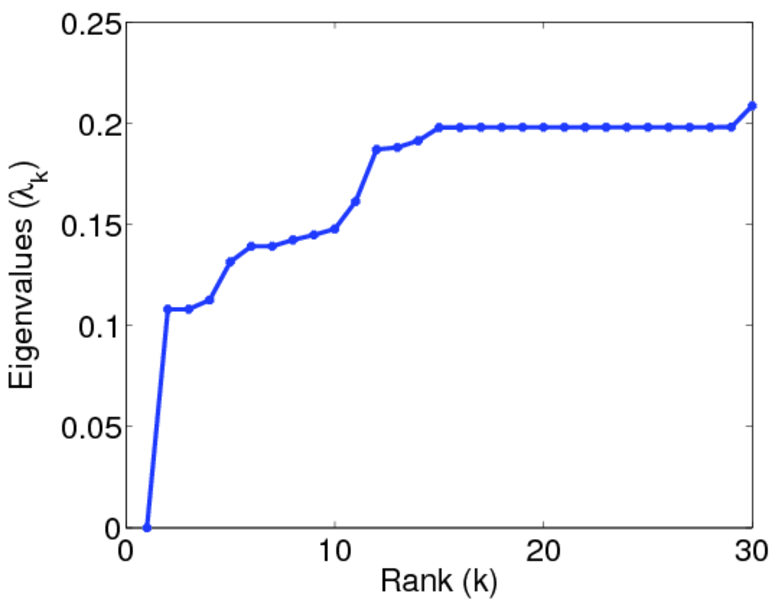
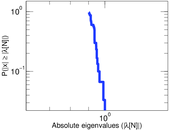
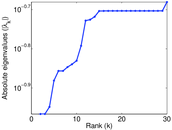
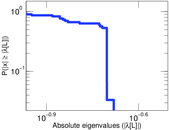
Matrix decompositions plots


Downloads
References
|
[1]
|
Jérôme Kunegis.
KONECT – The Koblenz Network Collection.
In Proc. Int. Conf. on World Wide Web Companion, pages
1343–1350, 2013.
[ http ]
|
|
[2]
|
Wikimedia Foundation.
Wikimedia downloads.
http://dumps.wikimedia.org/, January 2010.
|
 KONECT ‣ Networks ‣
Buy Me a Coffee
KONECT ‣ Networks ‣
Buy Me a Coffee