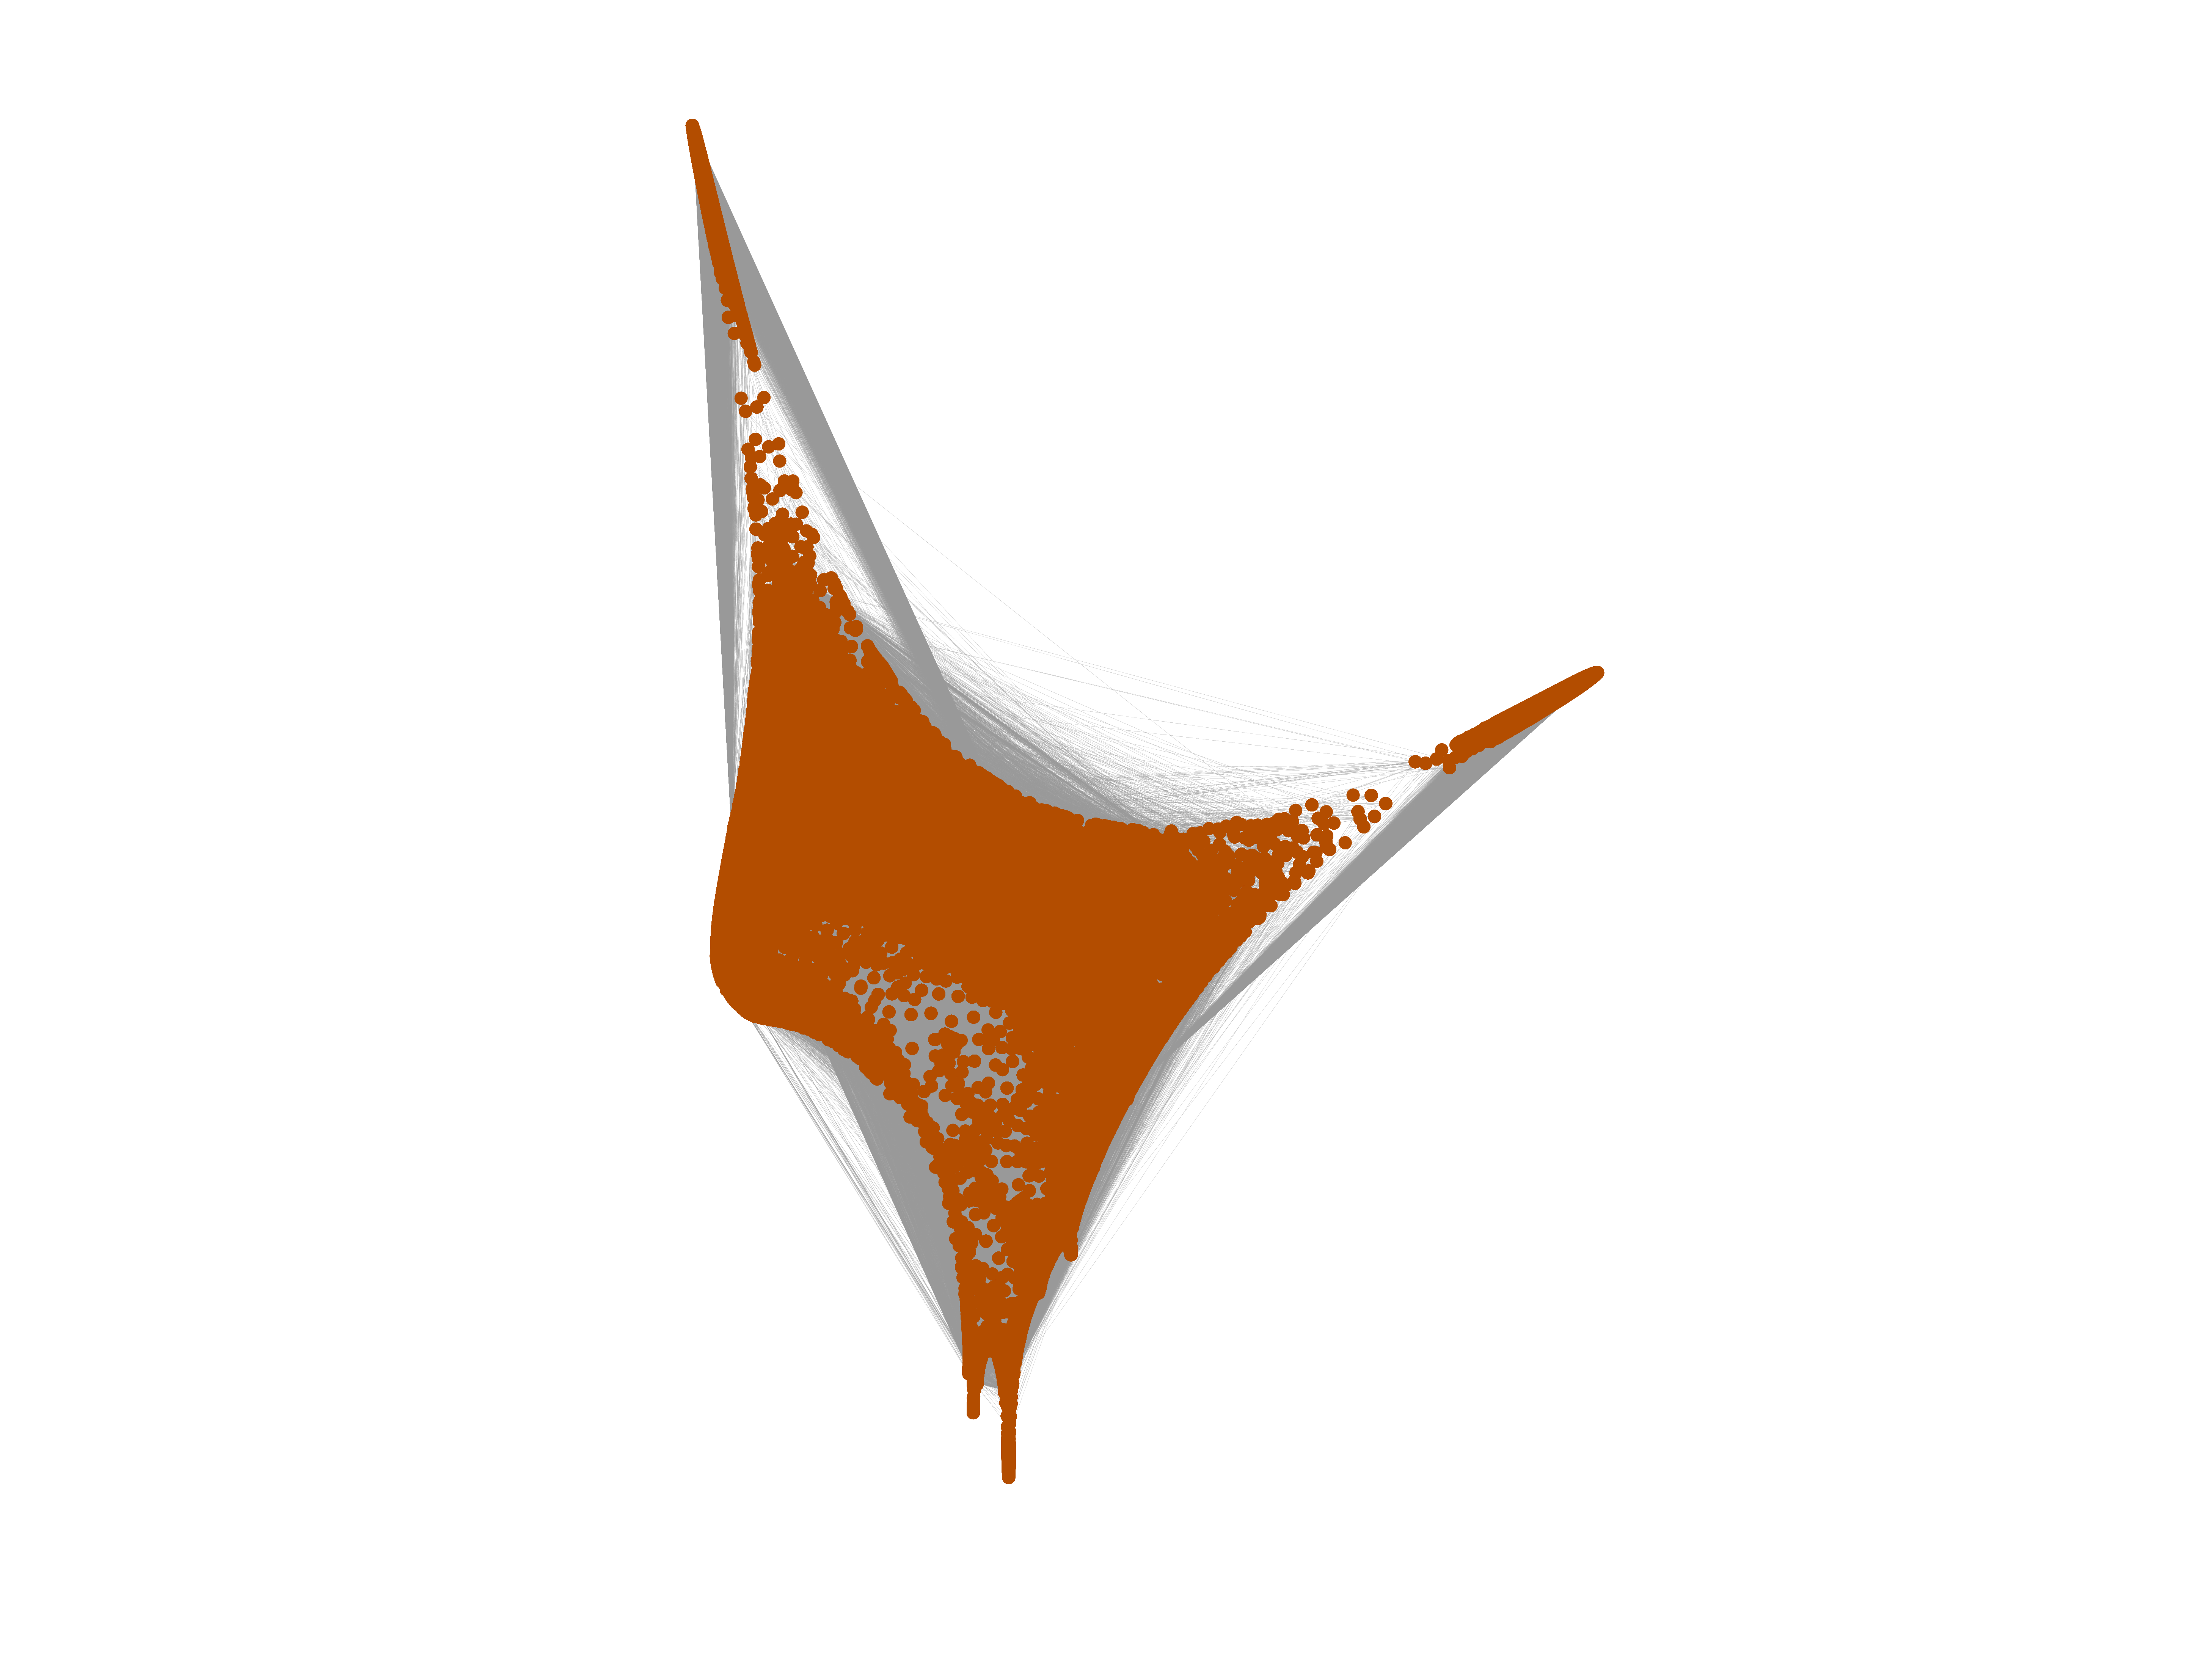
Wikipedia edits (pnb)
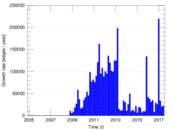
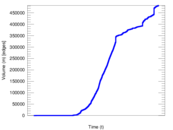
This is the bipartite edit network of the Western Punjabi Wikipedia. It
contains users and pages from the Western Punjabi Wikipedia, connected by edit
events. Each edge represents an edit. The dataset includes the timestamp of
each edit.
Metadata
Statistics
| Size | n = | 63,190
|
| Left size | n1 = | 1,661
|
| Right size | n2 = | 61,529
|
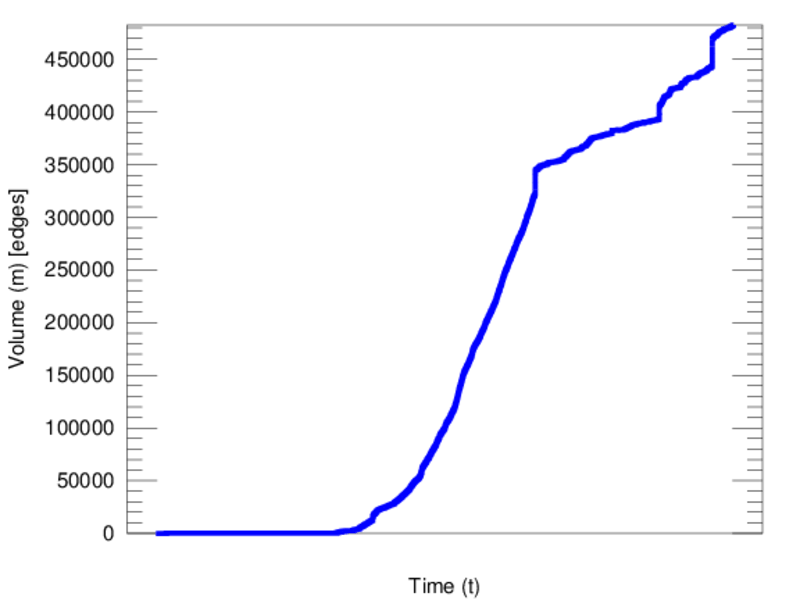
| Volume | m = | 482,583
|
| Unique edge count | m̿ = | 284,036
|
| Wedge count | s = | 1,985,111,322
|
| Claw count | z = | 15,646,109,922,199
|
| Cross count | x = | 109,315,049,805,714,192
|
| Square count | q = | 1,738,074,271
|
| 4-Tour count | T4 = | 21,846,043,112
|
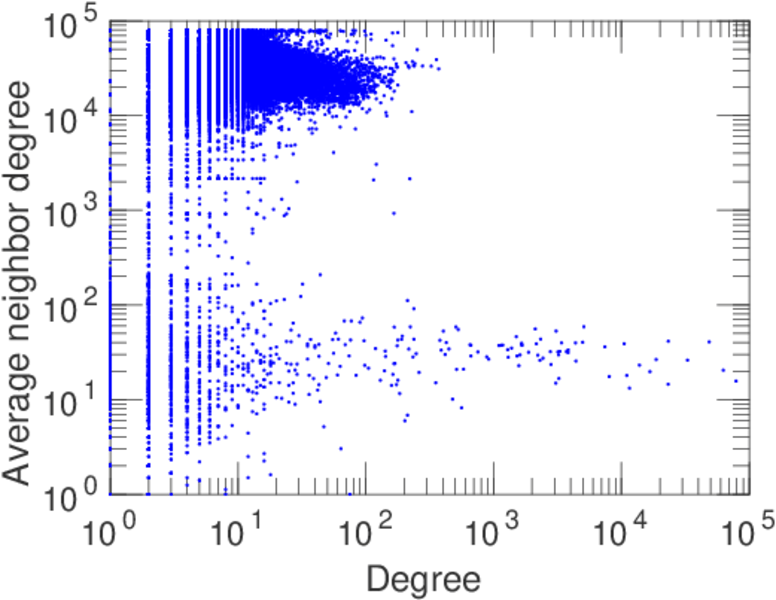
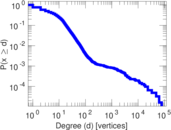
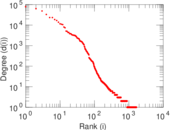
| Maximum degree | dmax = | 78,948
|
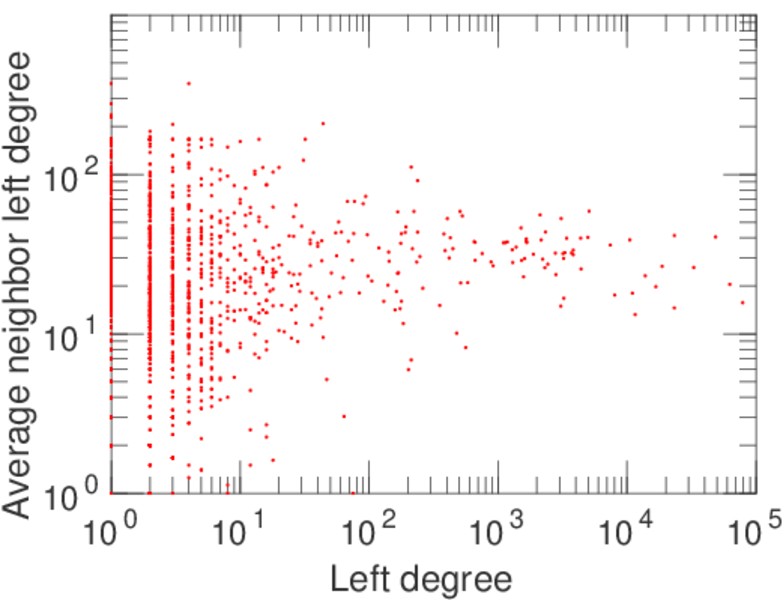
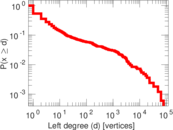
| Maximum left degree | d1max = | 78,948
|
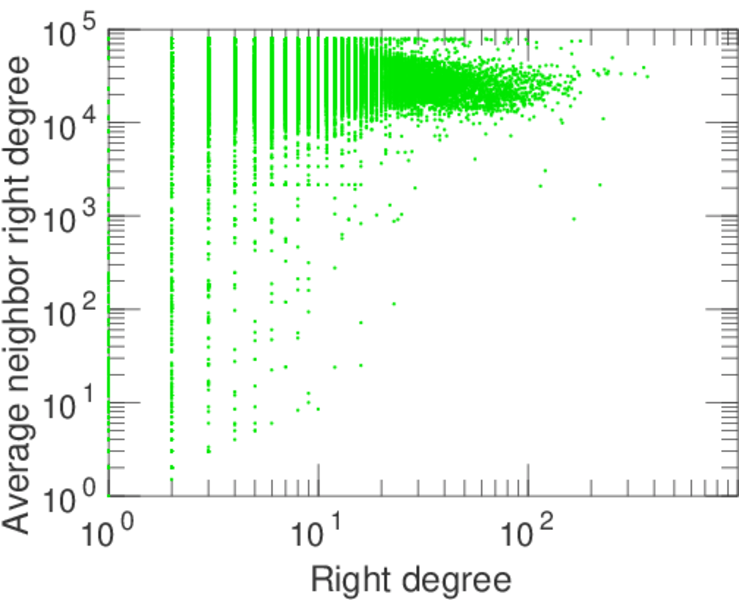
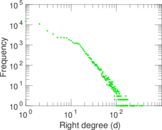
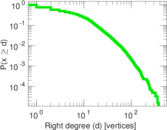
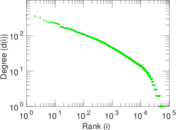
| Maximum right degree | d2max = | 372
|
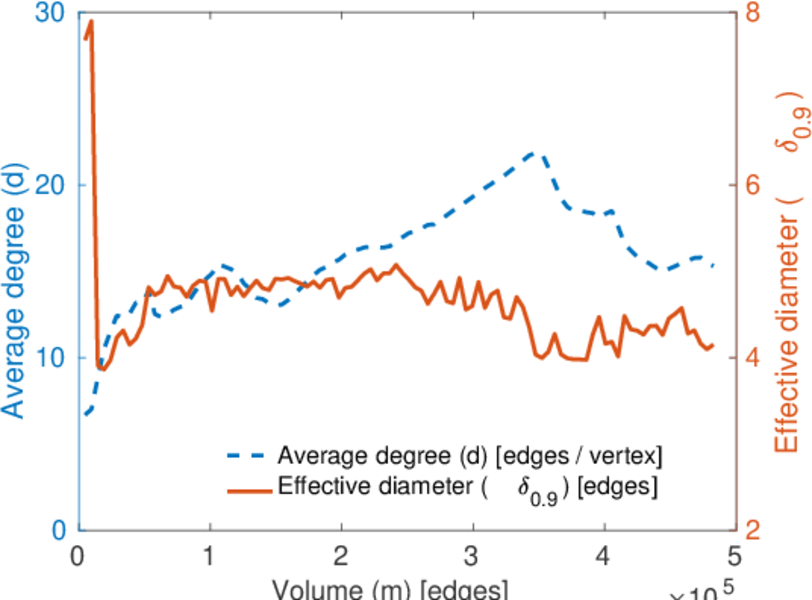
| Average degree | d = | 15.274 0
|
| Average left degree | d1 = | 290.538
|
| Average right degree | d2 = | 7.843 18
|
| Fill | p = | 0.002 779 23
|
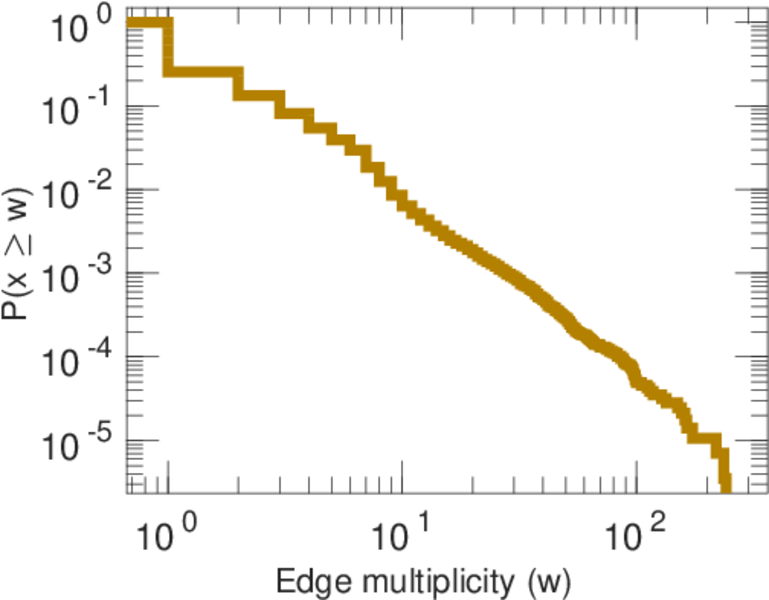
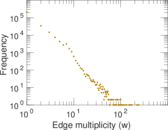
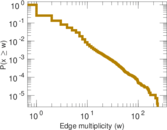
| Average edge multiplicity | m̃ = | 1.699 02
|
| Size of LCC | N = | 62,605
|
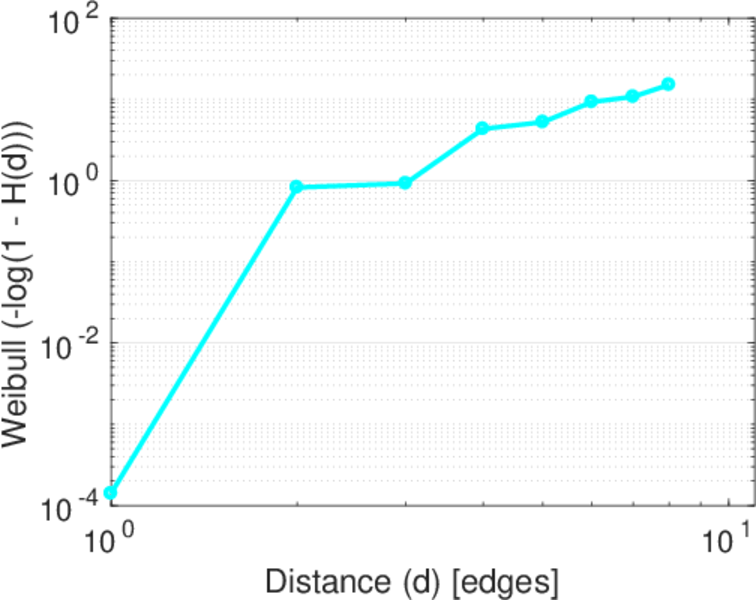
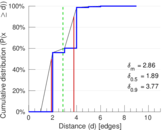
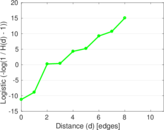
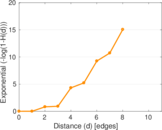
| Diameter | δ = | 10
|
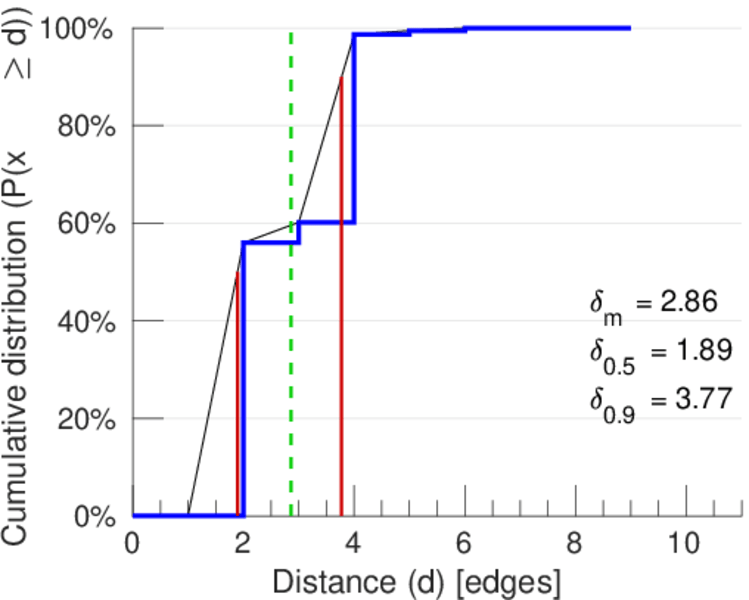
| 50-Percentile effective diameter | δ0.5 = | 1.893 33
|
| 90-Percentile effective diameter | δ0.9 = | 3.774 99
|
| Median distance | δM = | 2
|
| Mean distance | δm = | 2.857 34
|
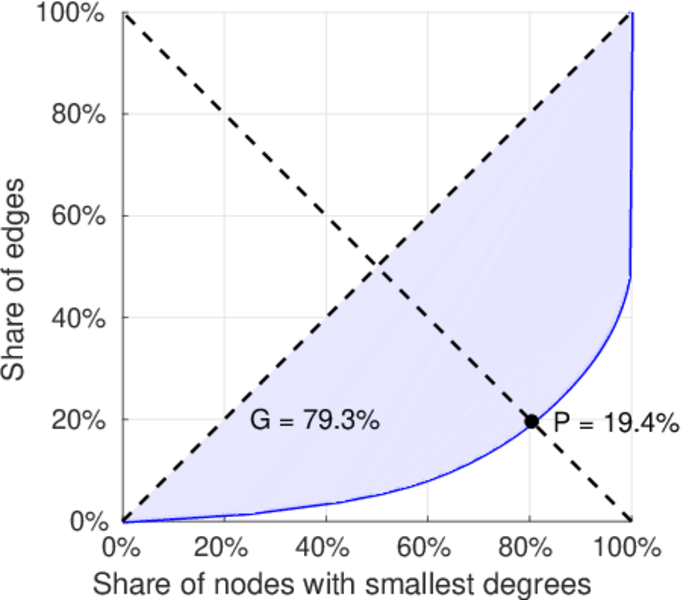
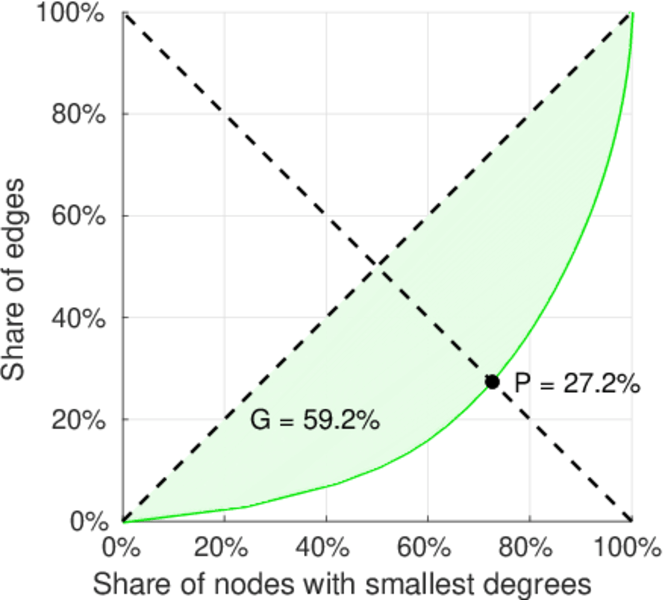
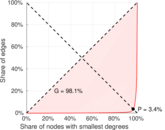
| Gini coefficient | G = | 0.794 347
|
| Balanced inequality ratio | P = | 0.193 726
|
| Left balanced inequality ratio | P1 = | 0.033 712 3
|
| Right balanced inequality ratio | P2 = | 0.272 051
|
| Relative edge distribution entropy | Her = | 0.707 267
|
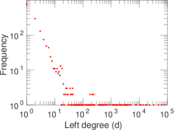
| Power law exponent | γ = | 1.931 92
|
| Tail power law exponent | γt = | 3.421 00
|
| Tail power law exponent with p | γ3 = | 3.421 00
|
| p-value | p = | 0.000 00
|
| Left tail power law exponent with p | γ3,1 = | 1.731 00
|
| Left p-value | p1 = | 0.000 00
|
| Right tail power law exponent with p | γ3,2 = | 4.081 00
|
| Right p-value | p2 = | 0.000 00
|
| Degree assortativity | ρ = | −0.406 260
|
| Degree assortativity p-value | pρ = | 0.000 00
|
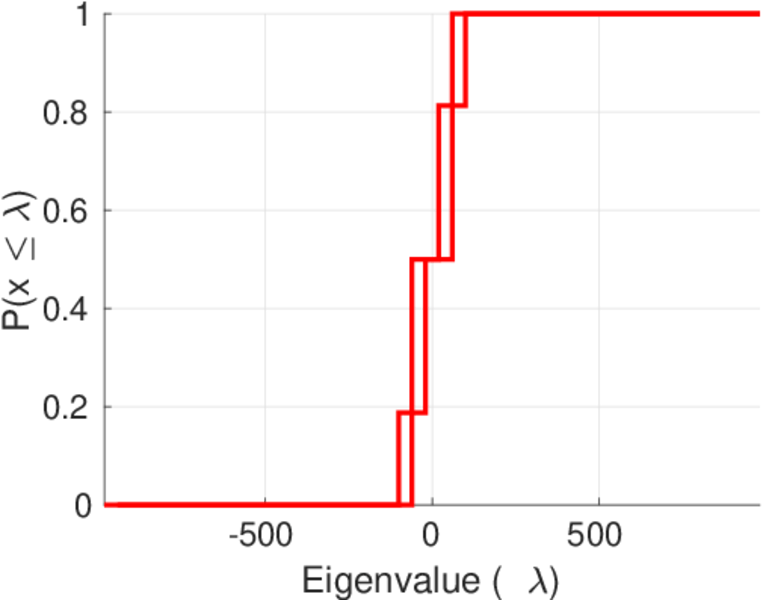
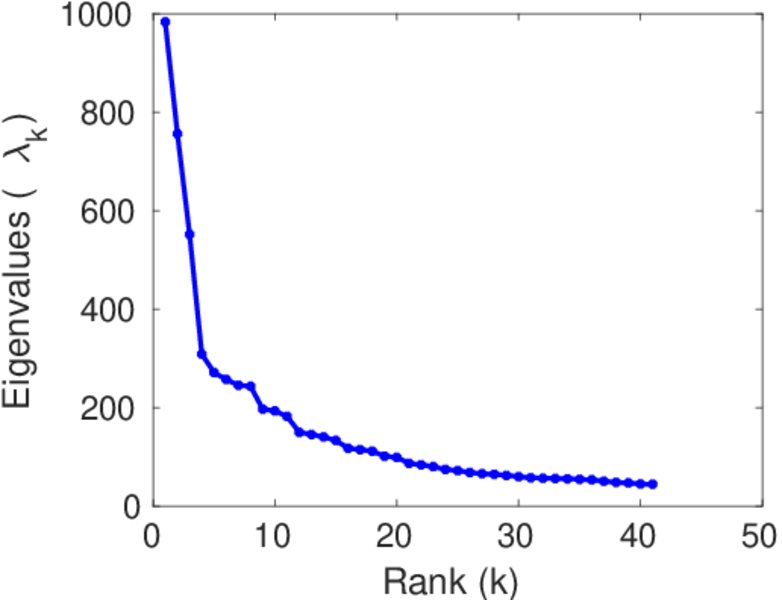
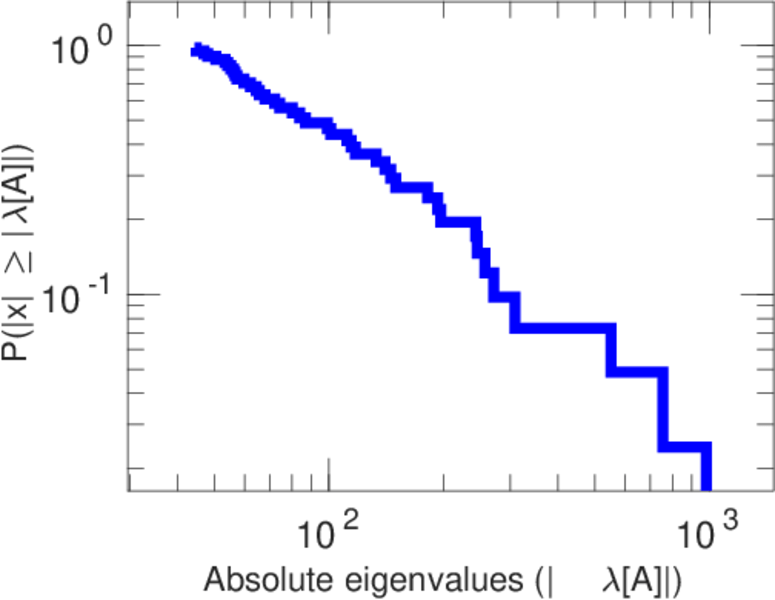
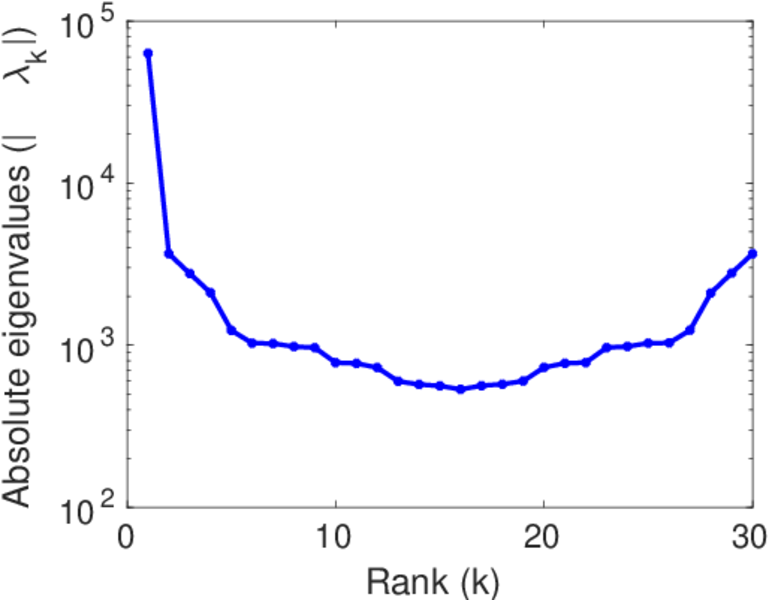
| Spectral norm | α = | 983.126
|
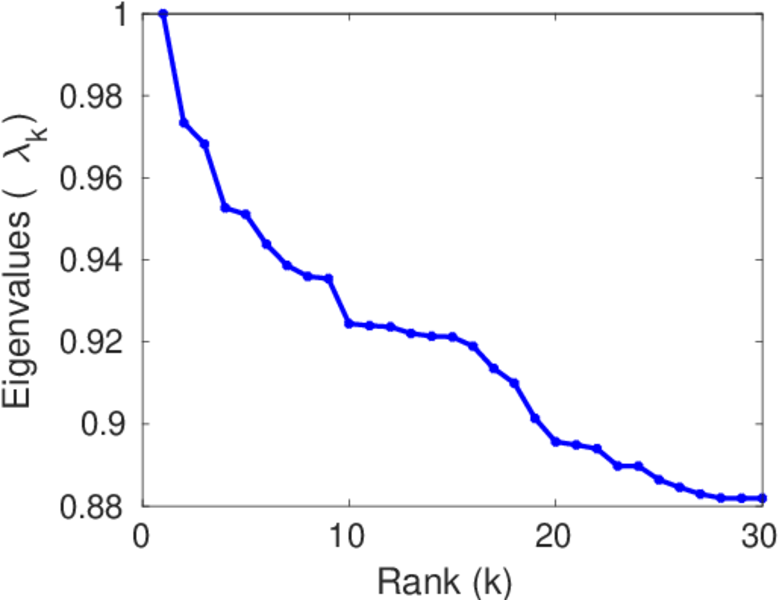
| Algebraic connectivity | a = | 0.057 577 2
|
| Spectral separation | |λ1[A] / λ2[A]| = | 1.300 32
|
| Controllability | C = | 60,052
|
| Relative controllability | Cr = | 0.951 997
|
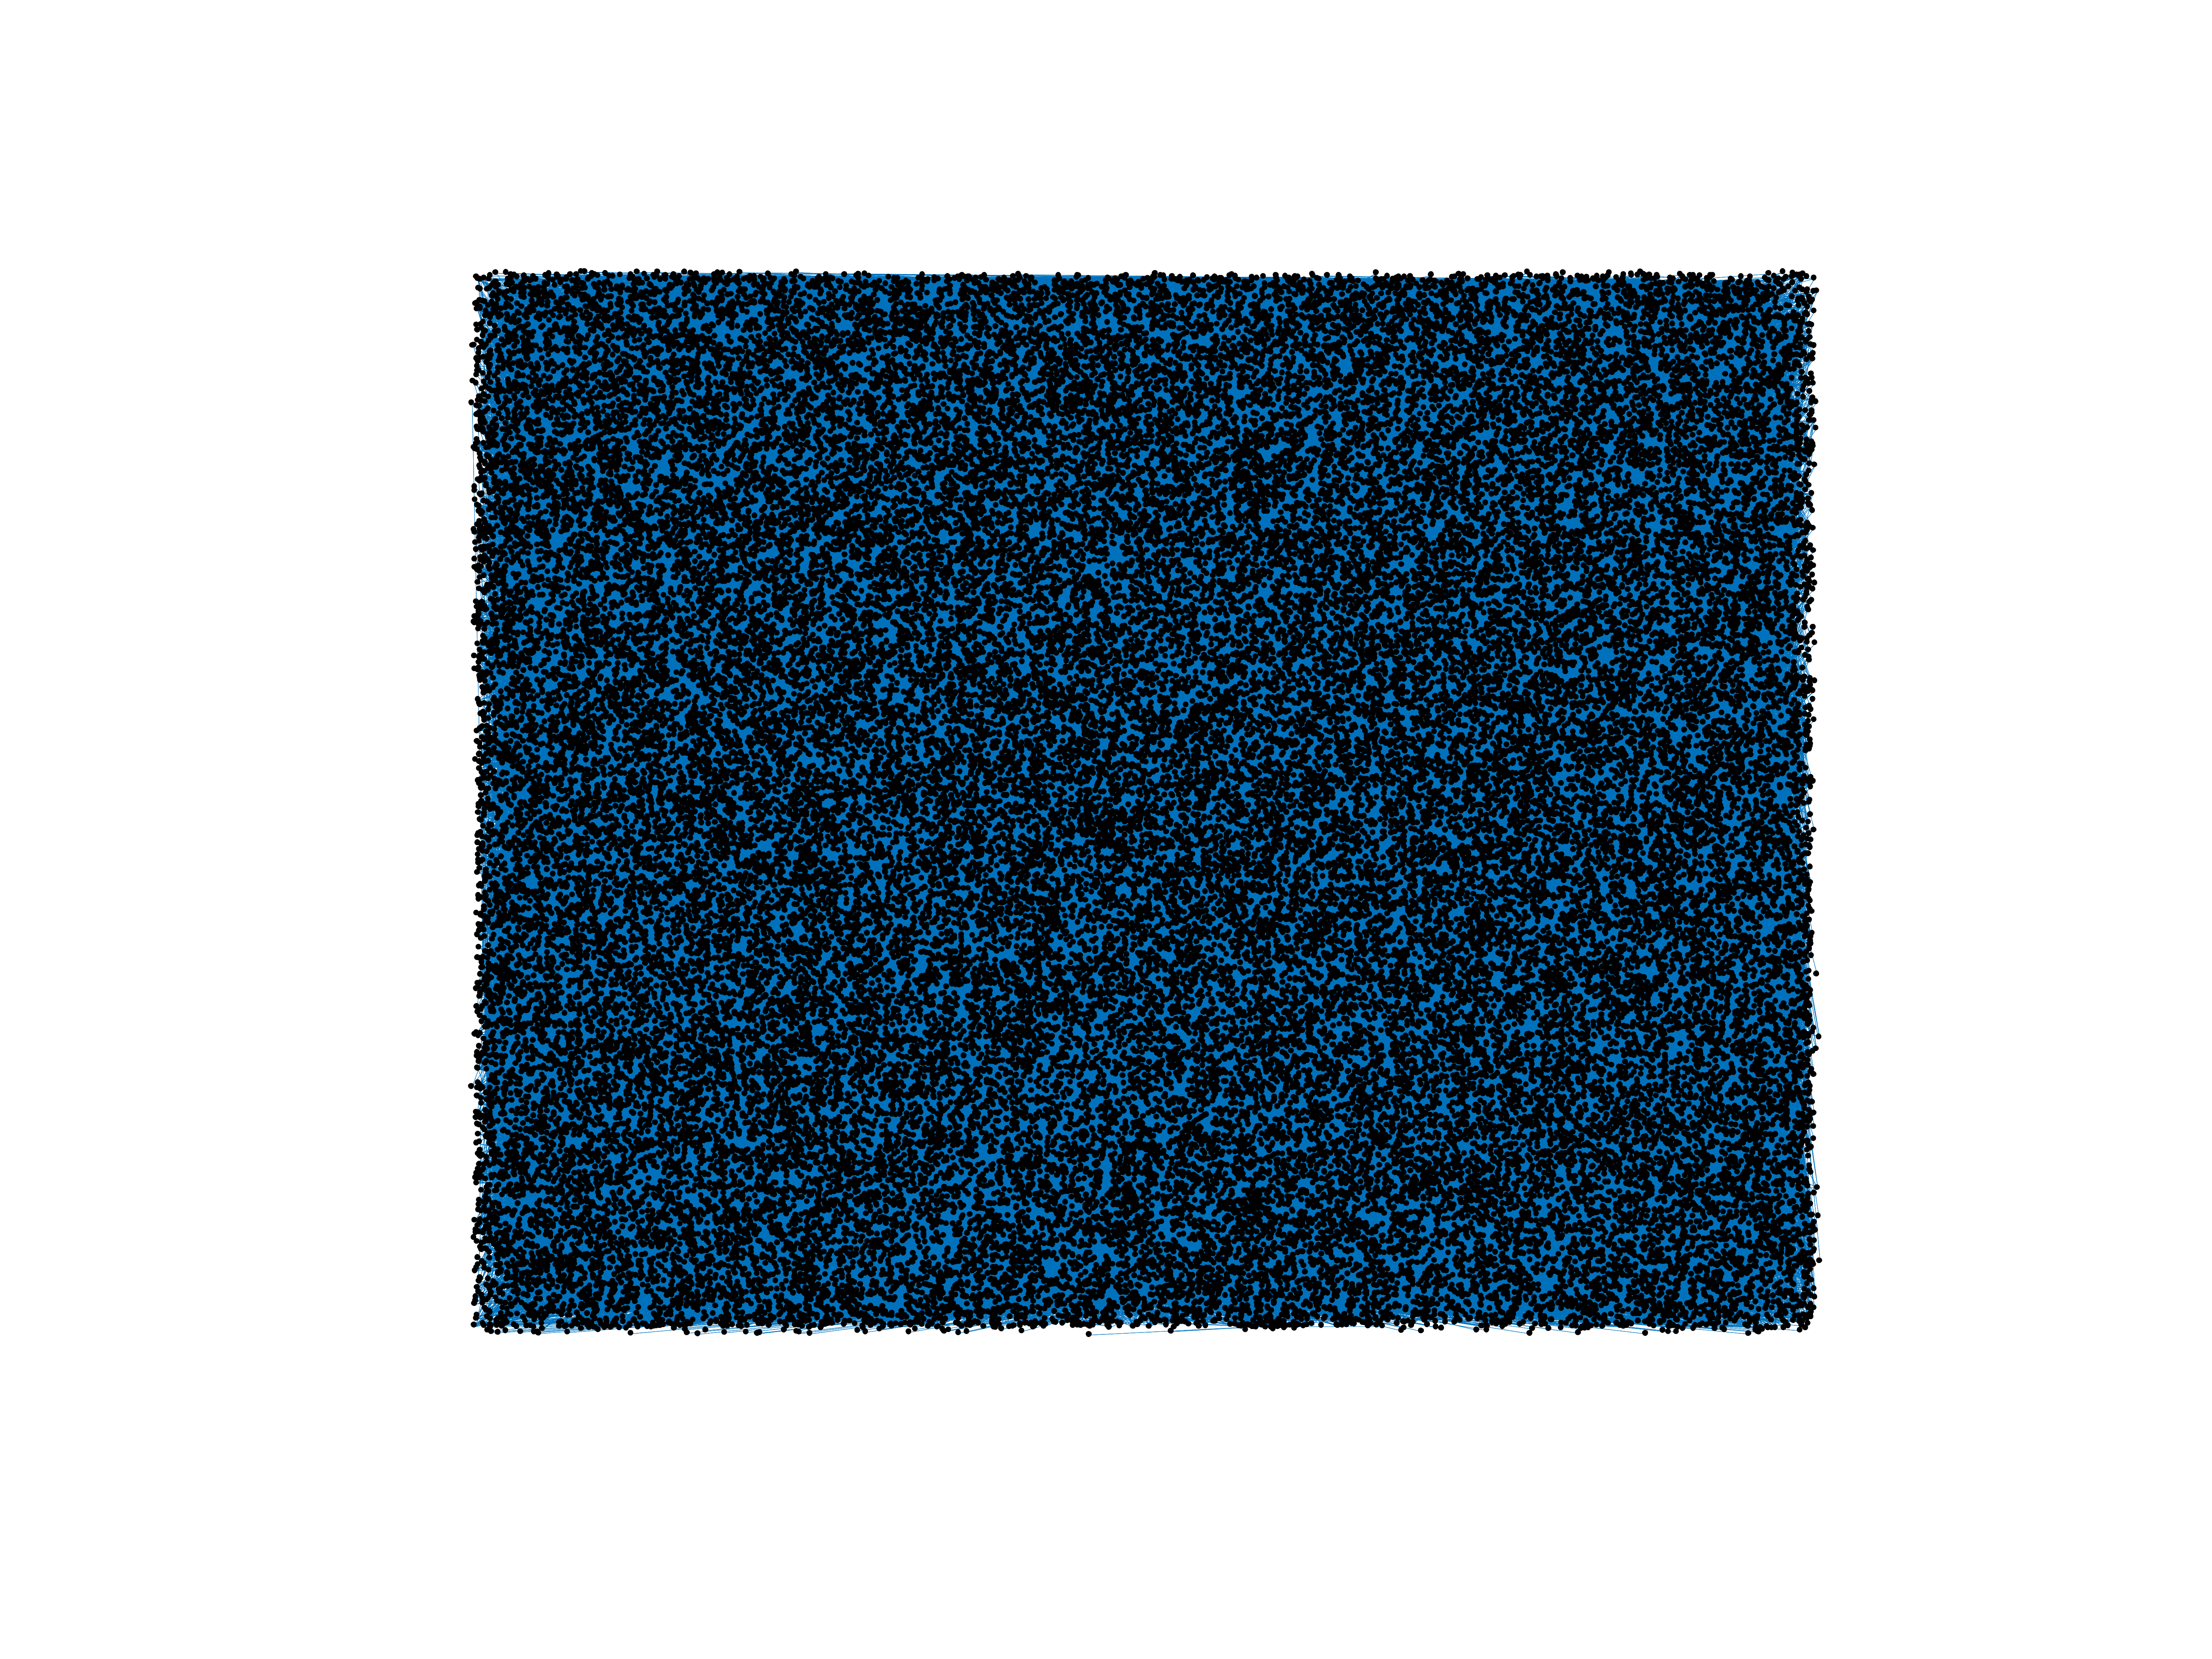
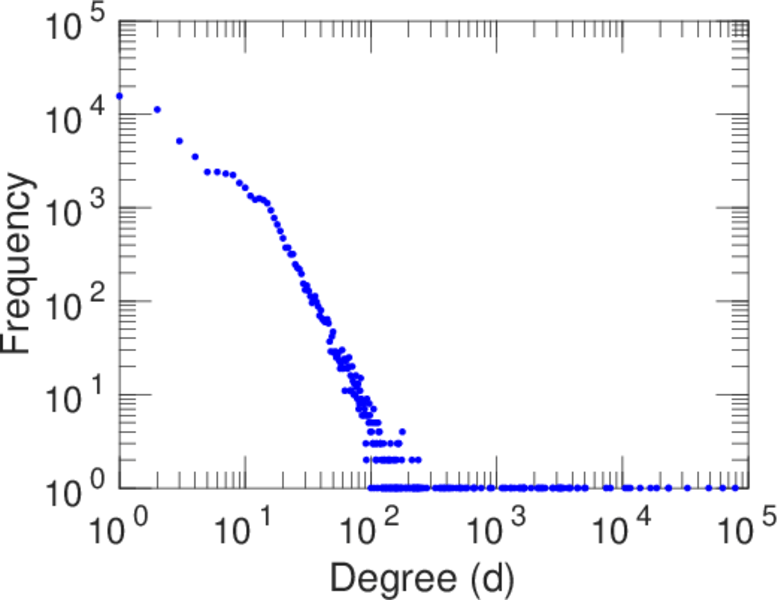
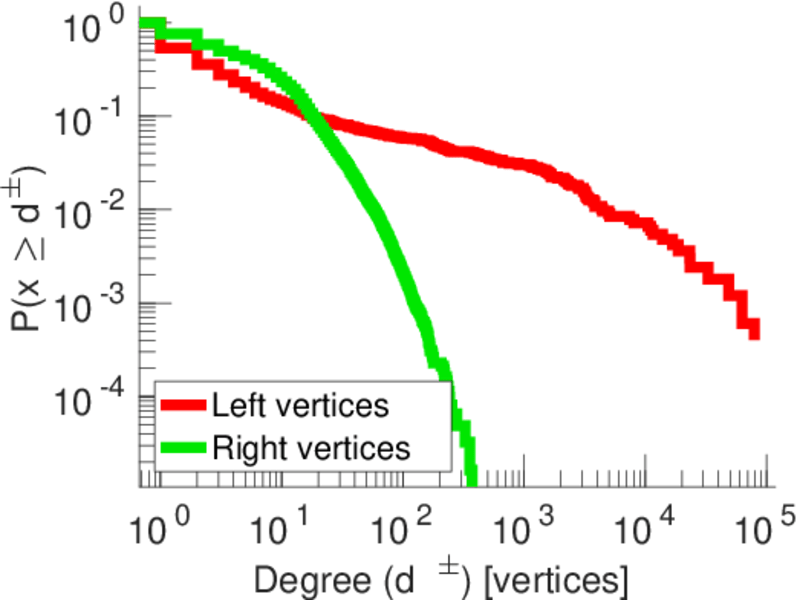
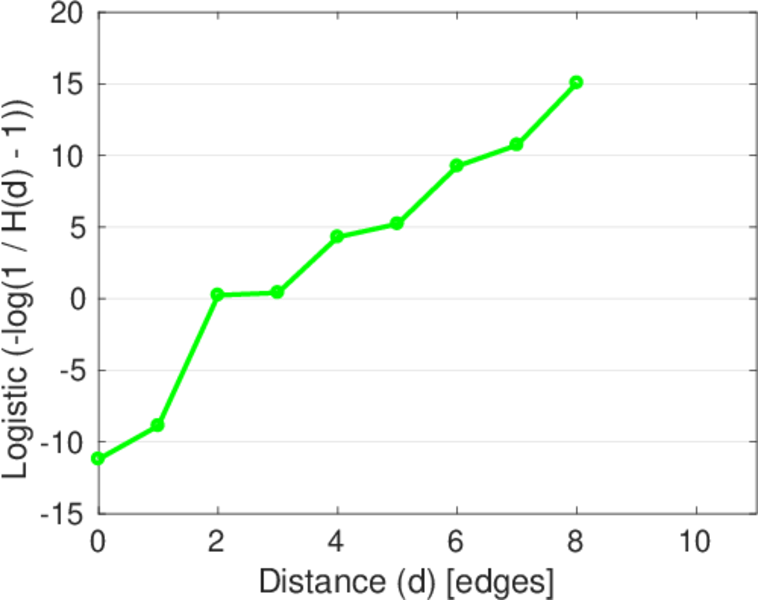
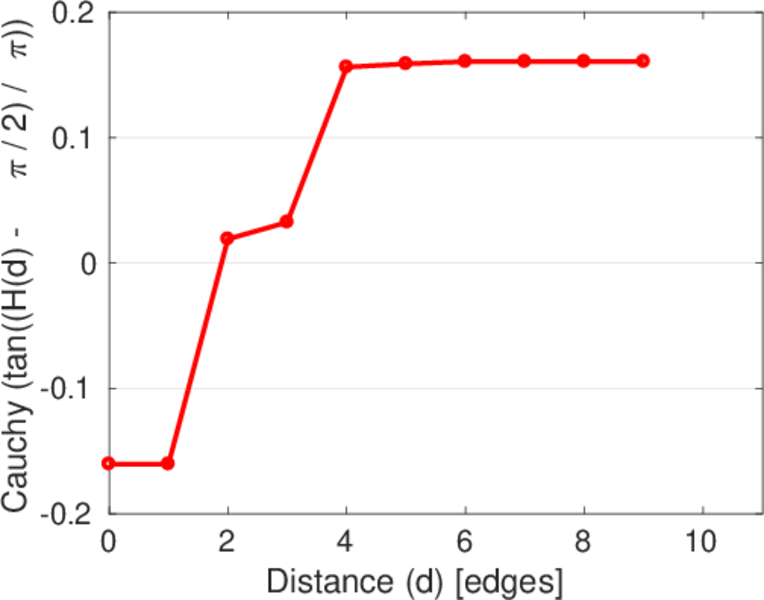
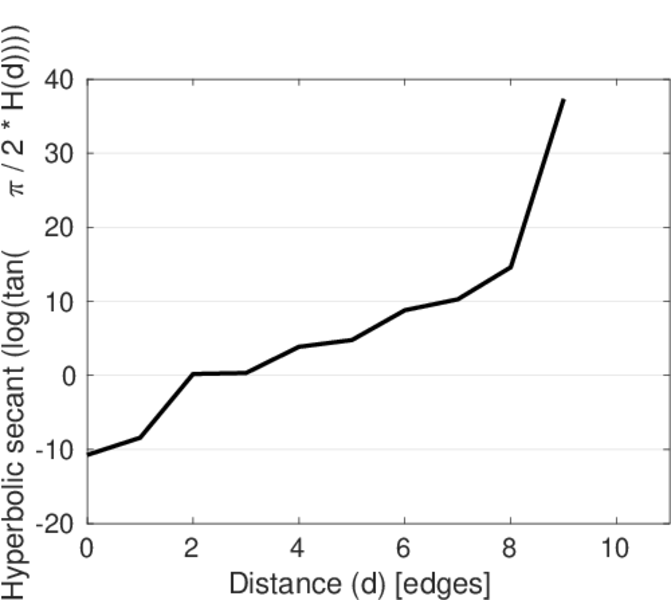
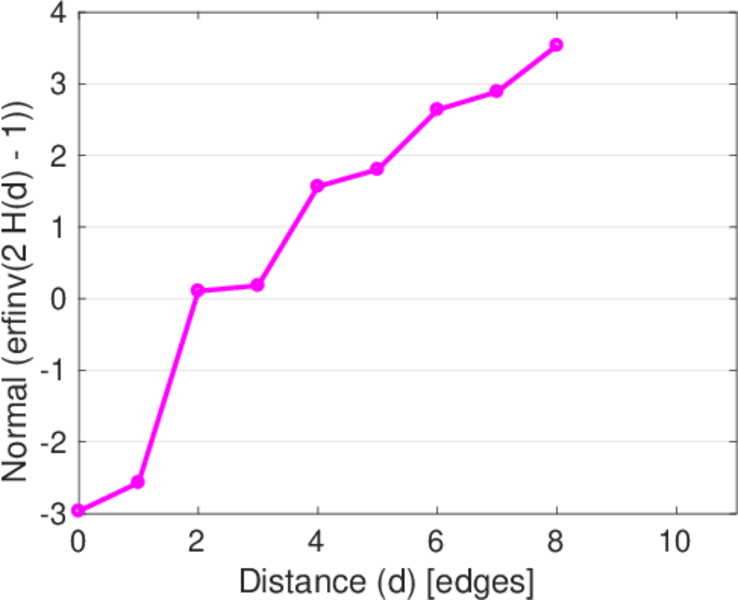
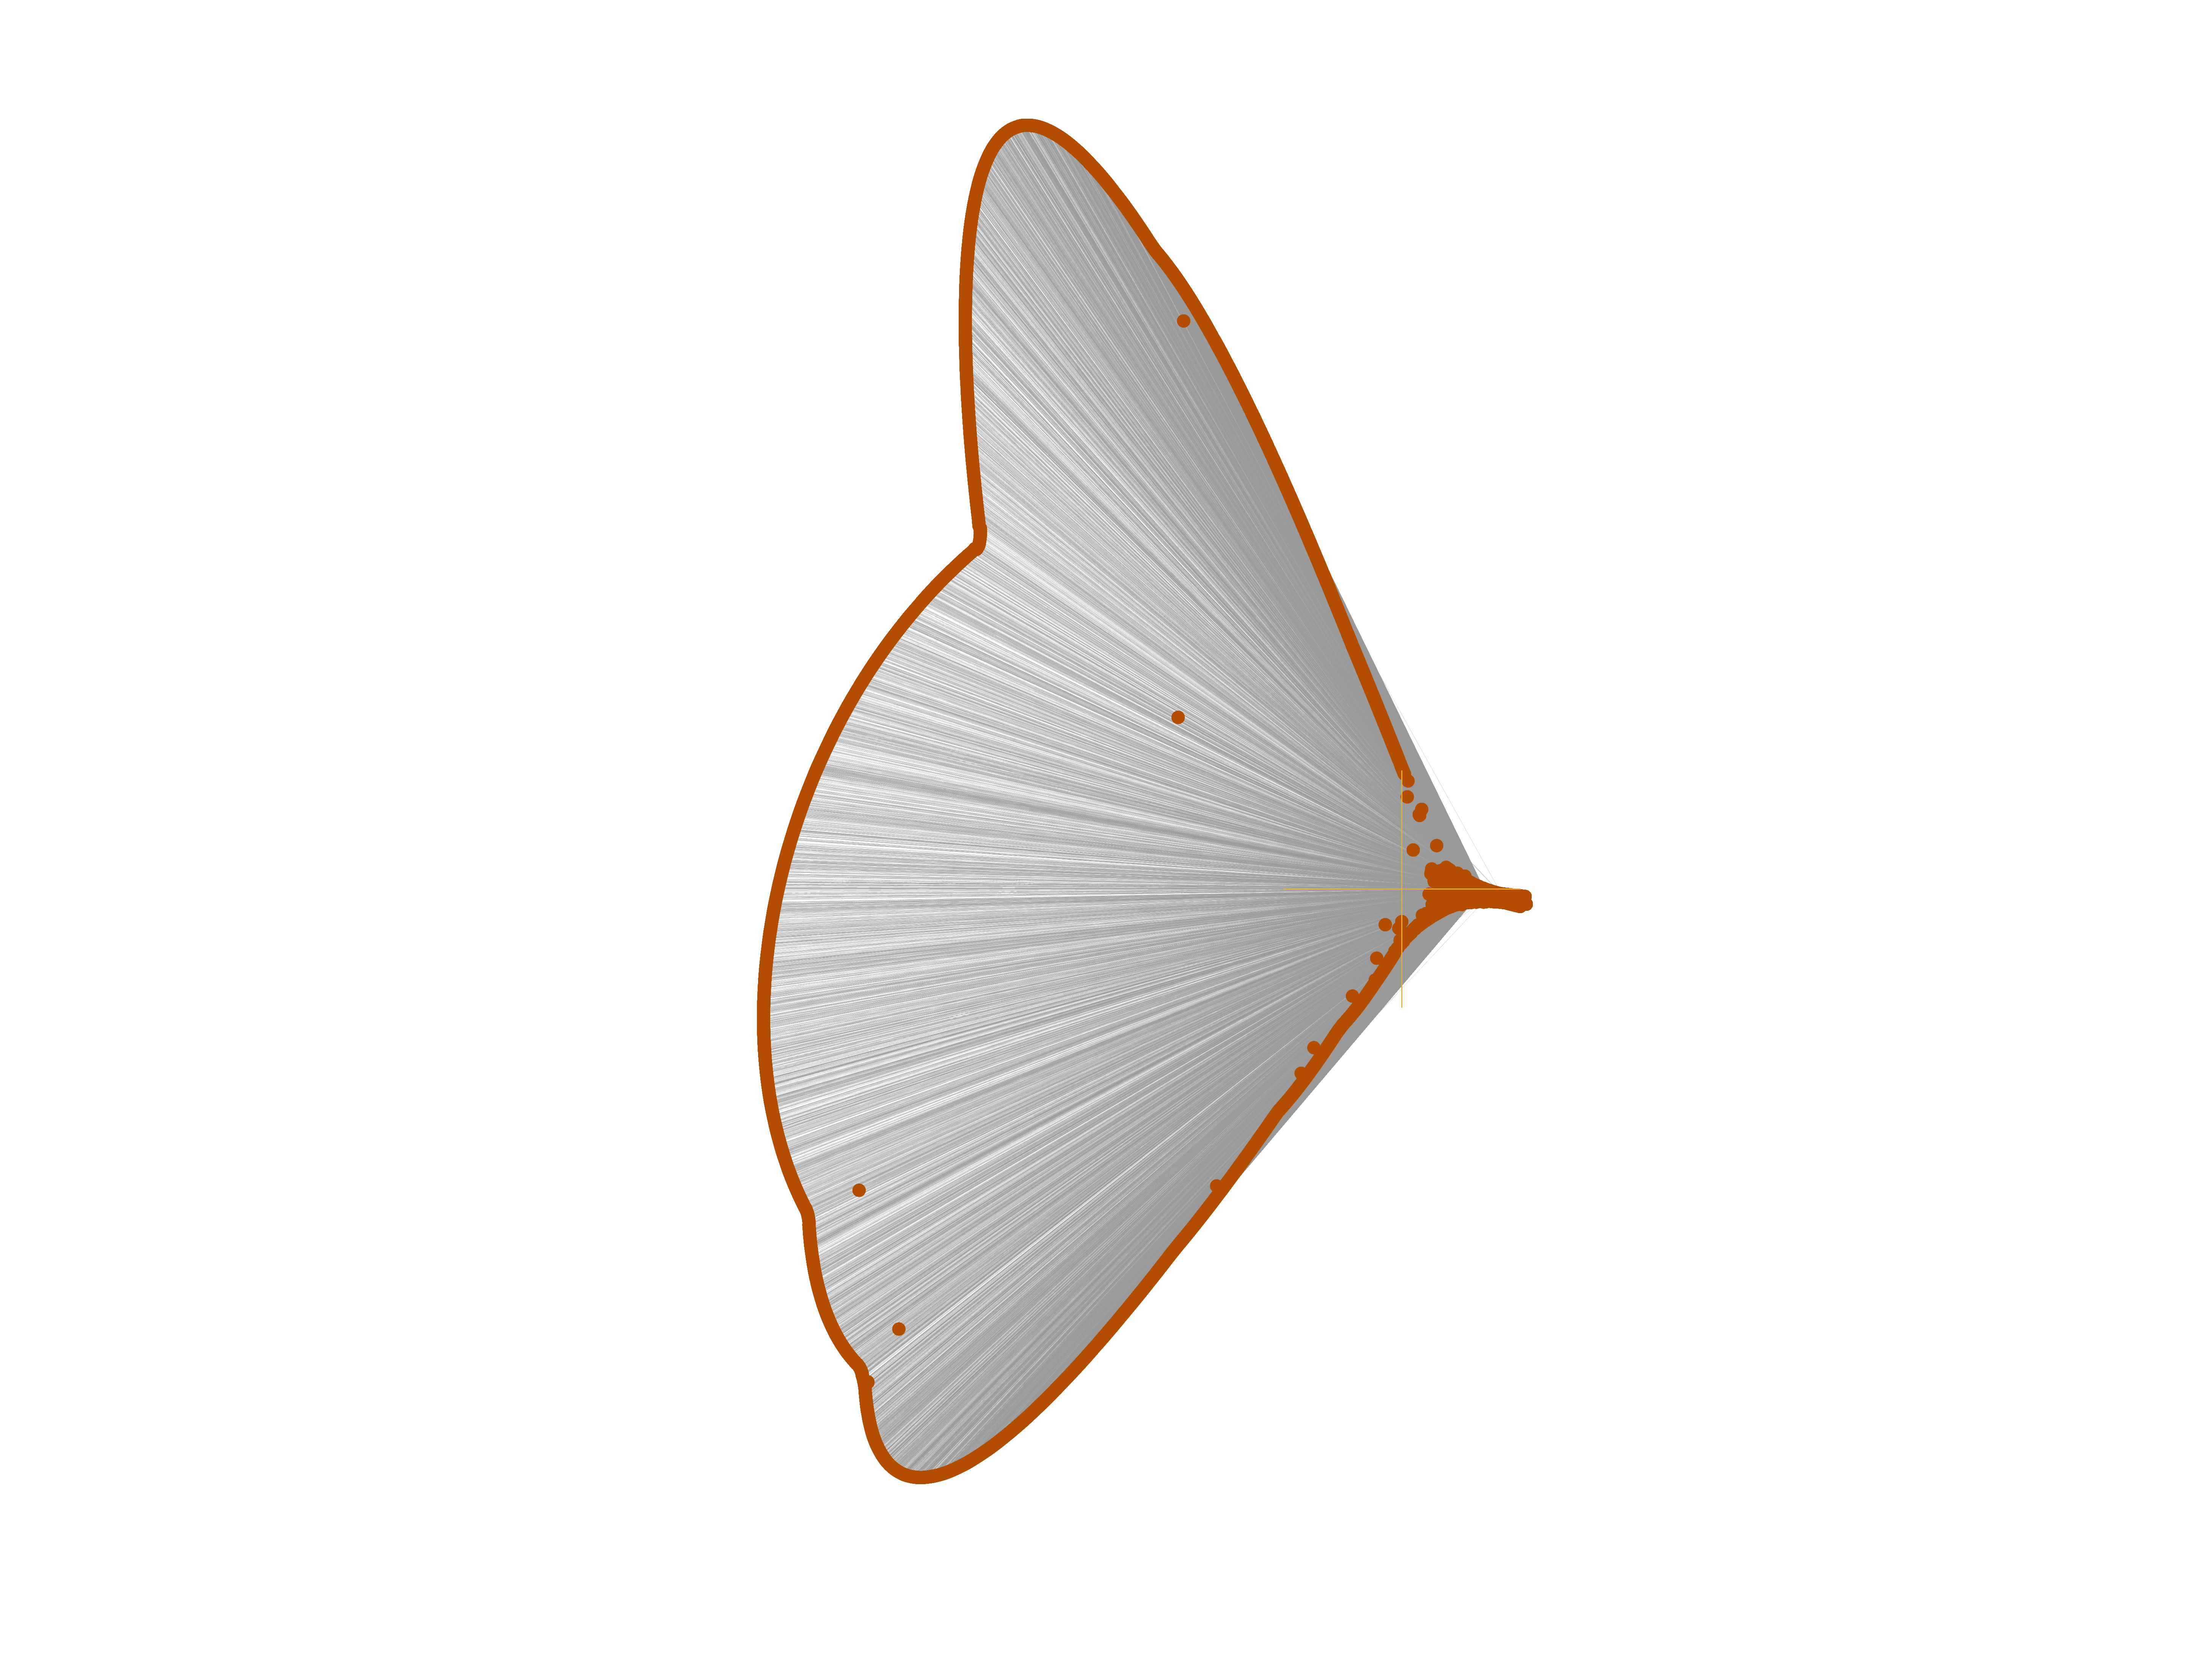
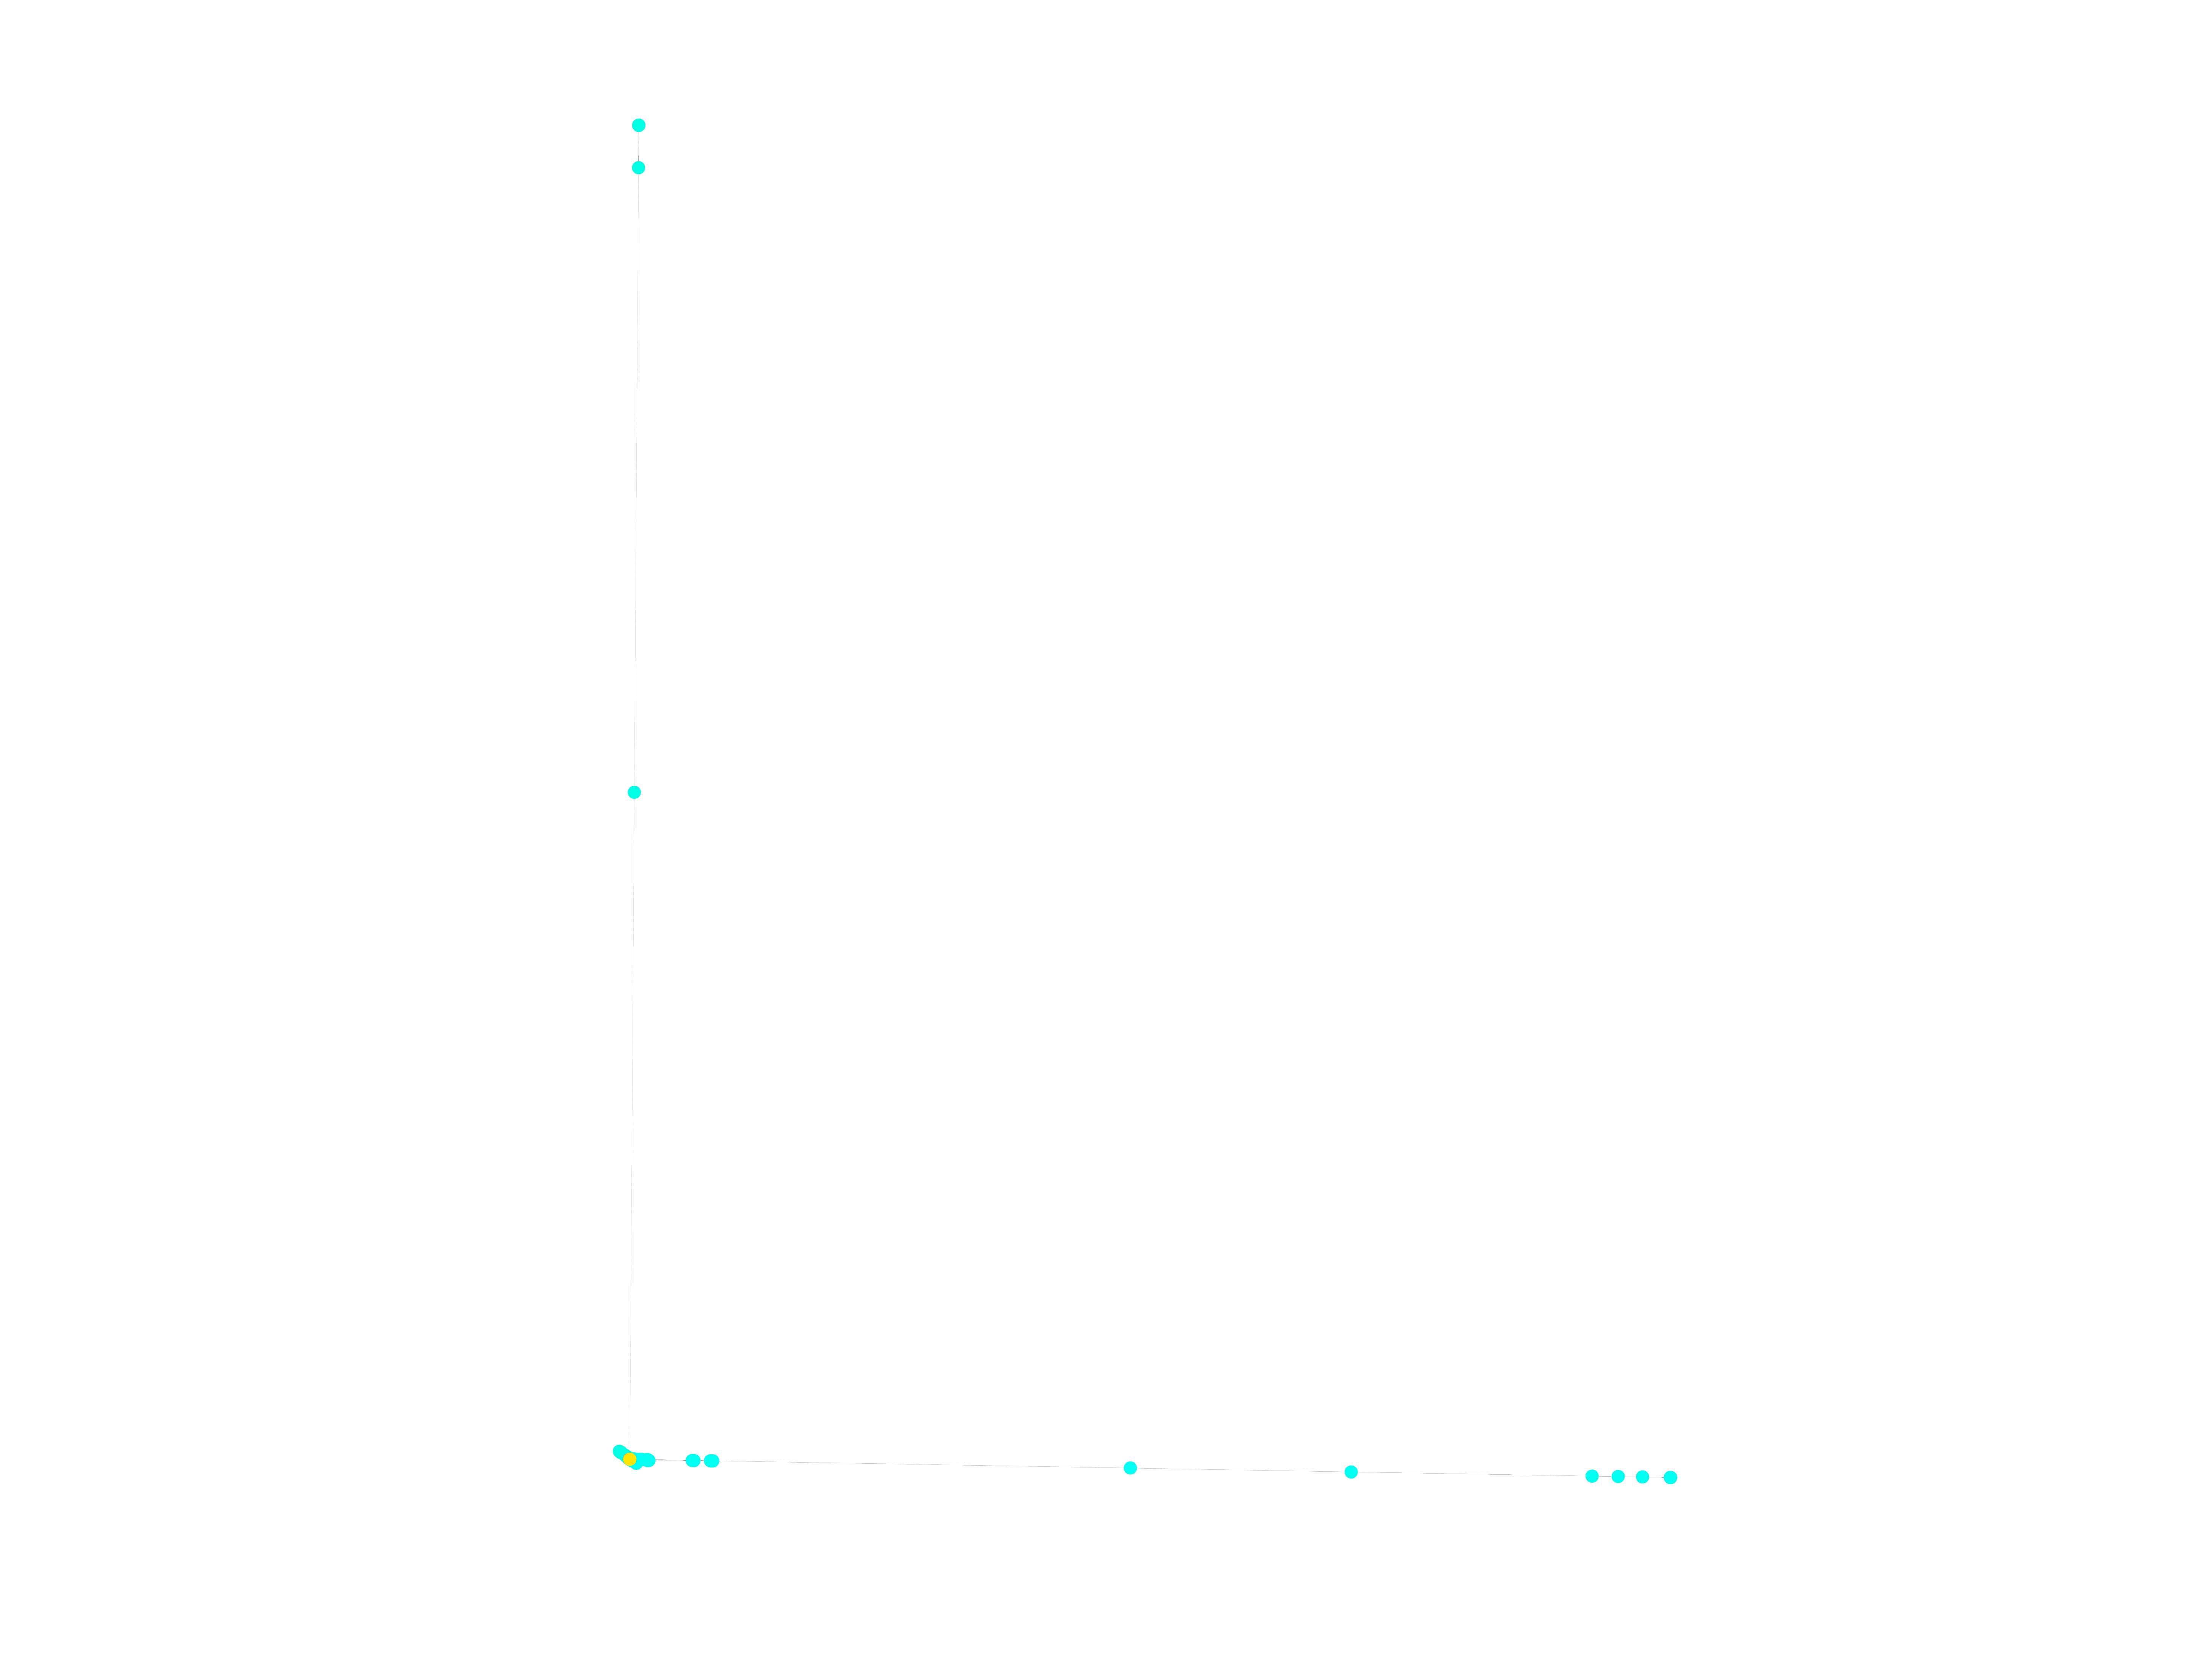
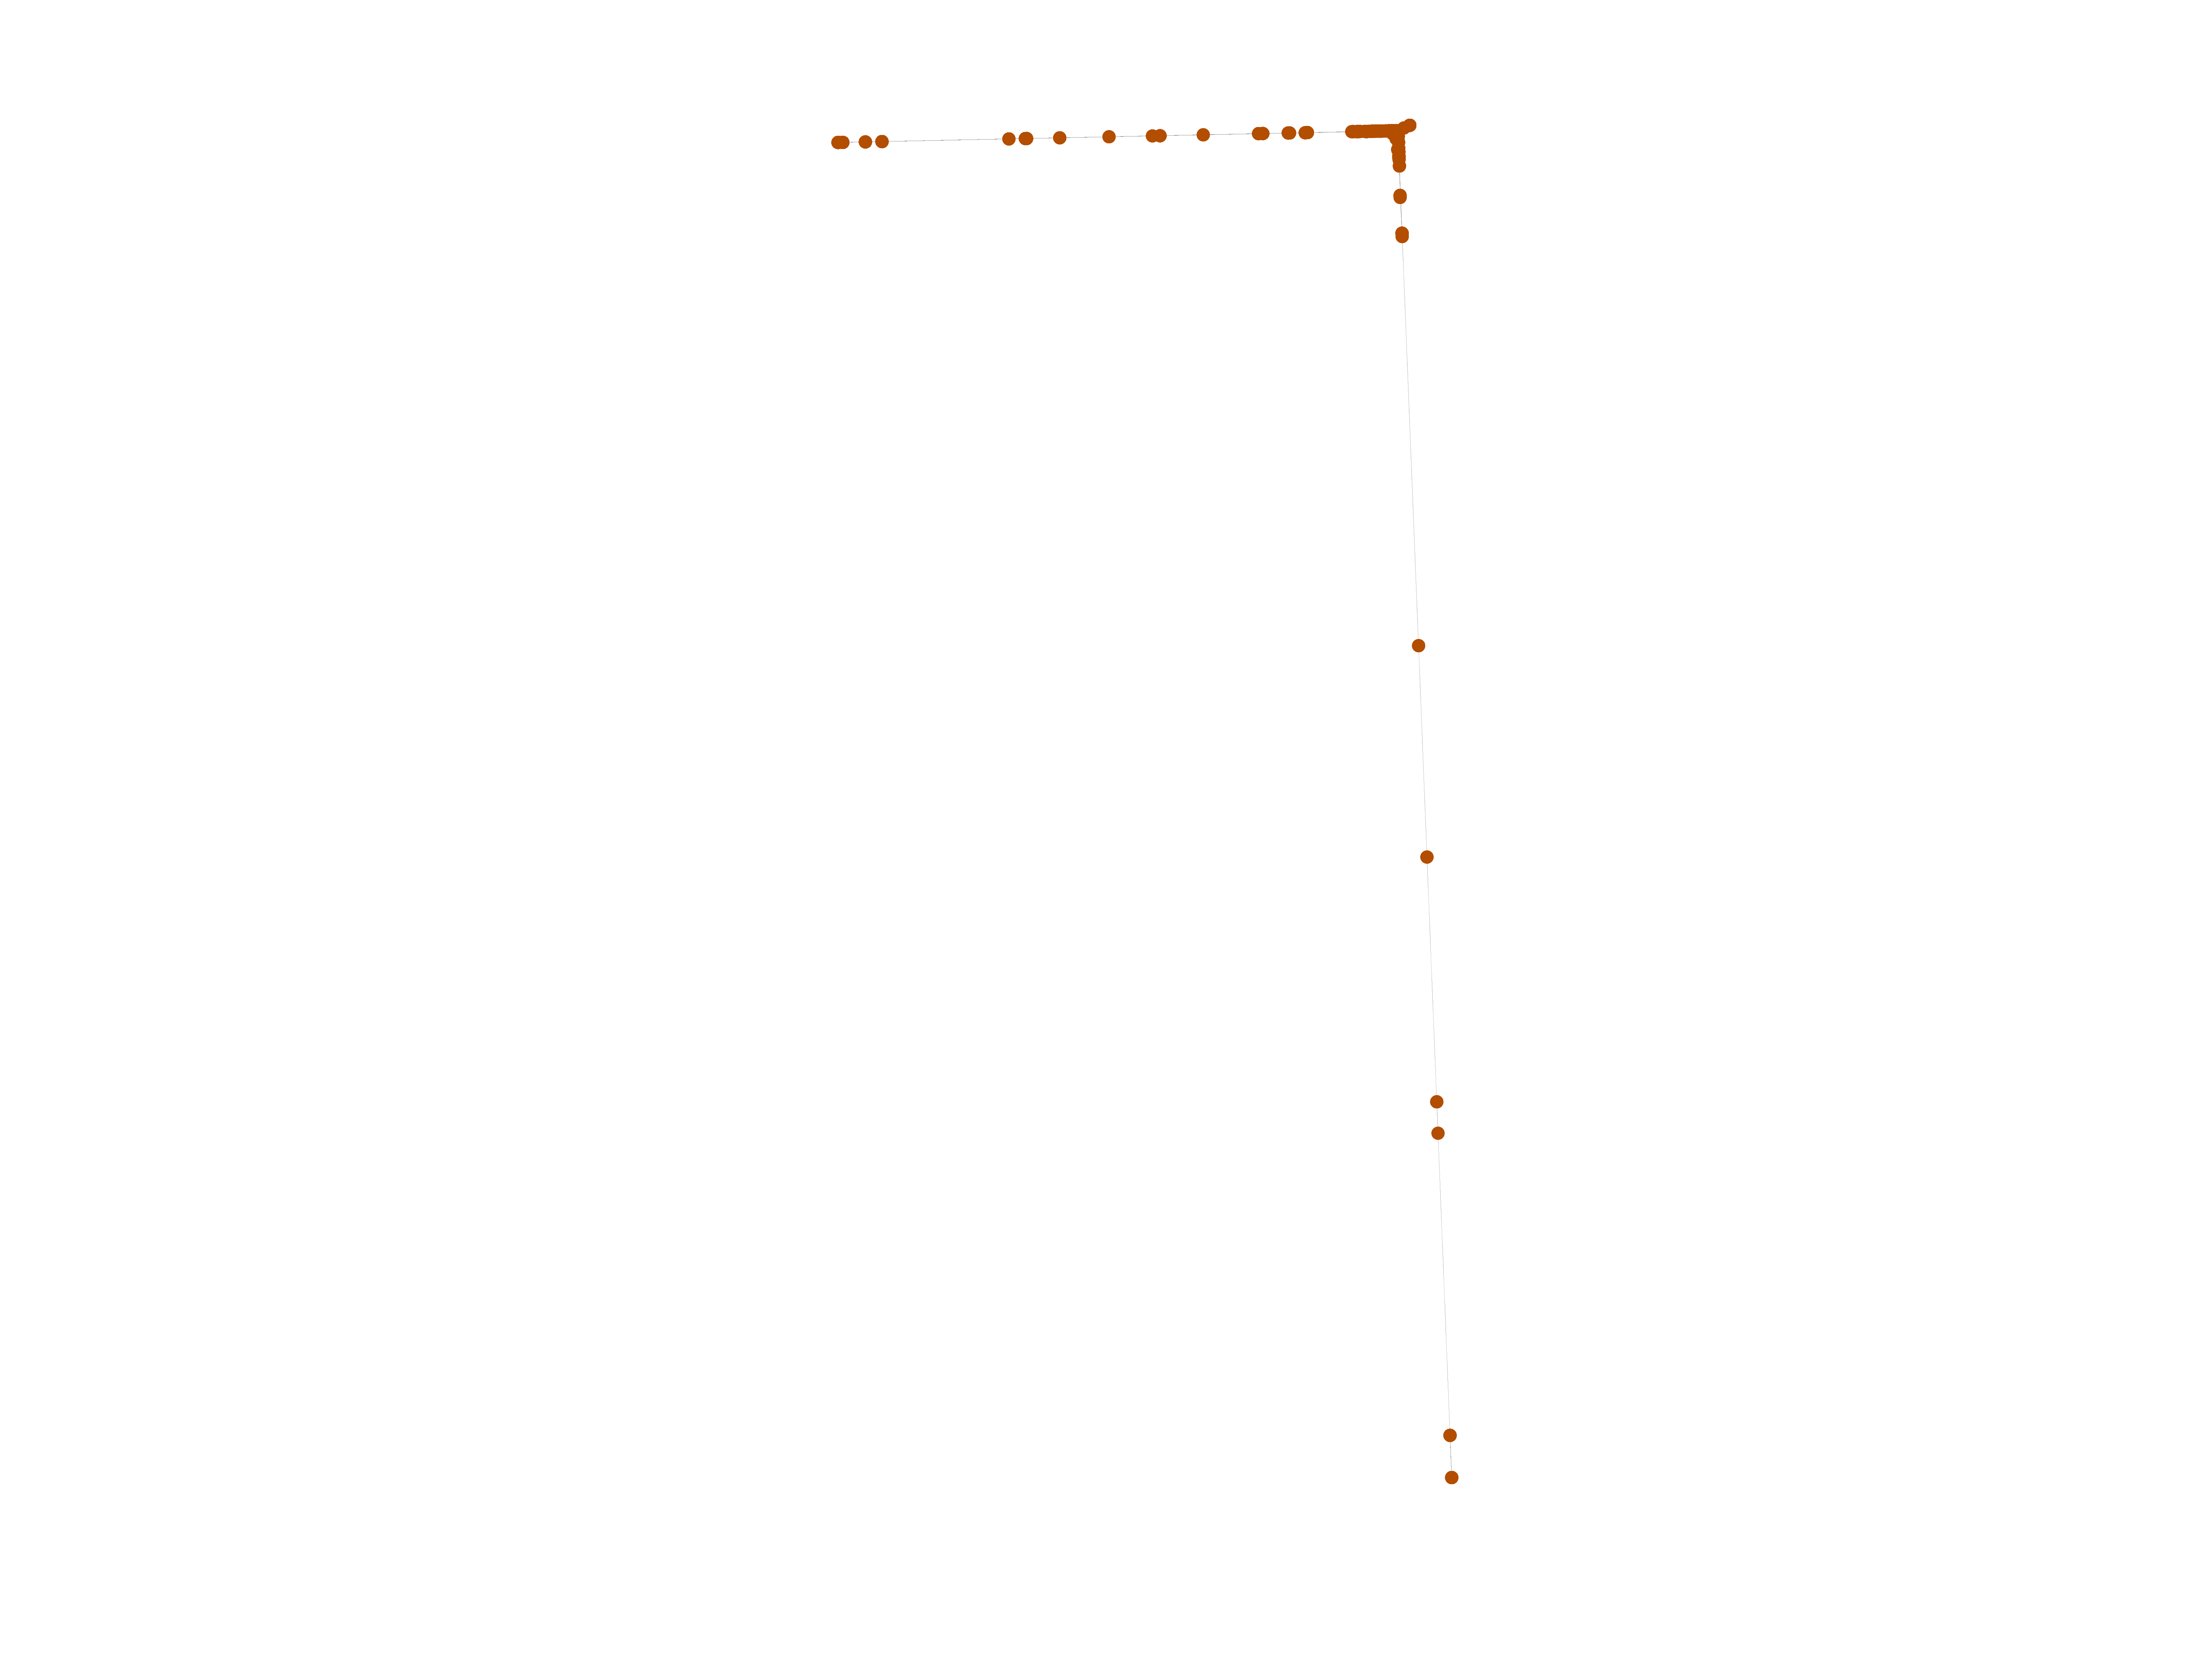
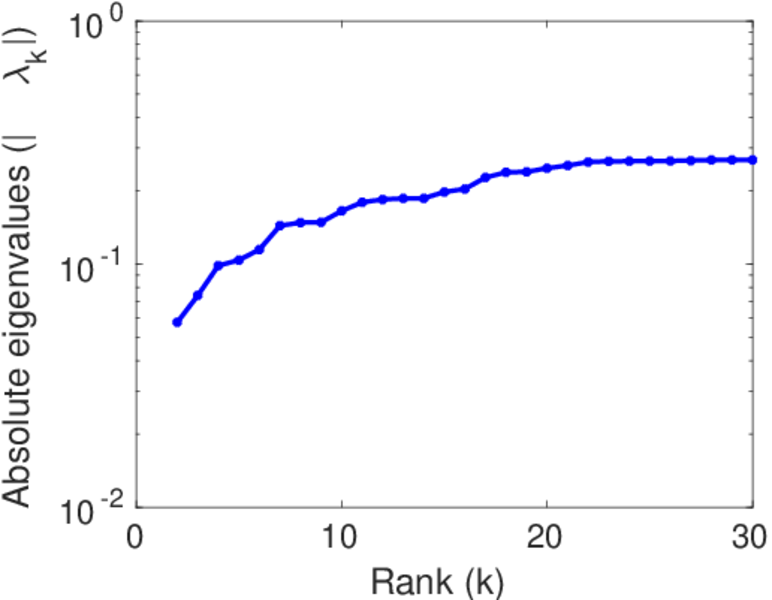
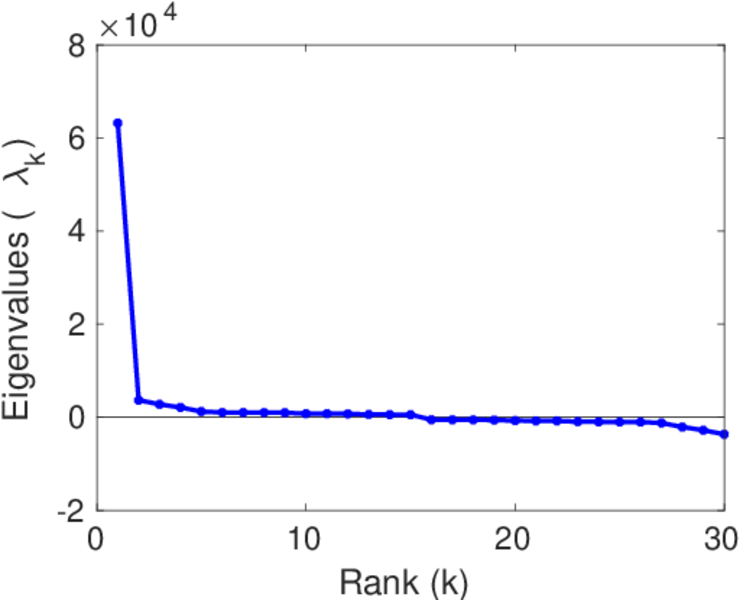
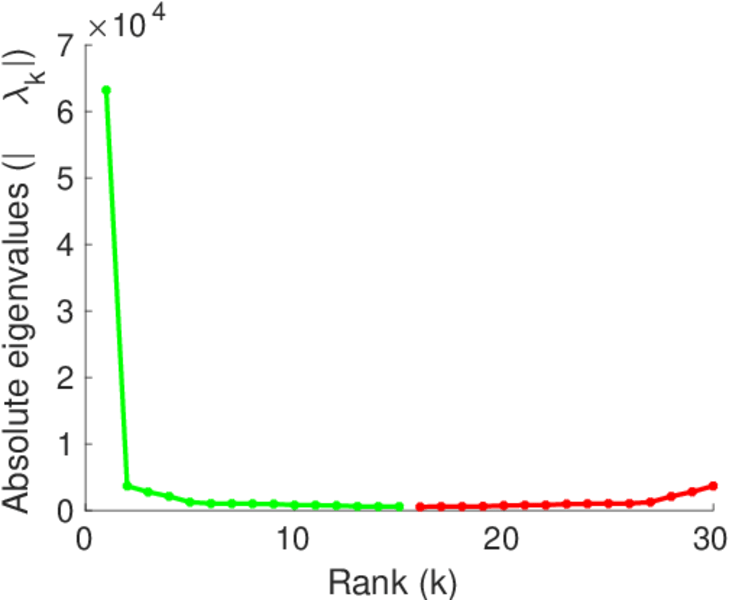
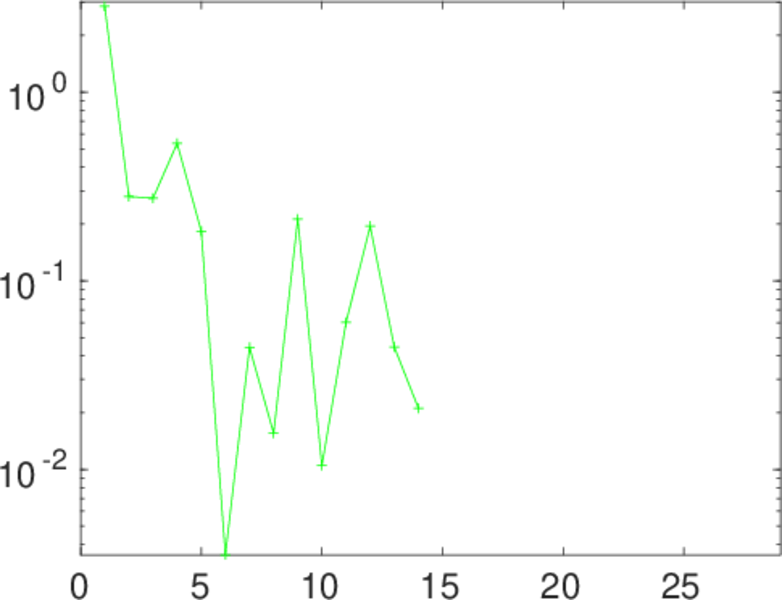
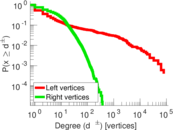
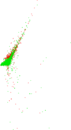
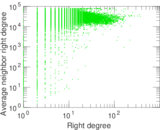
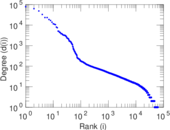
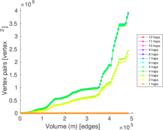
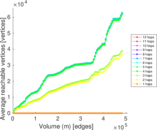
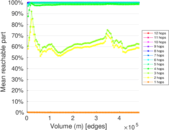
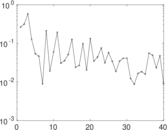
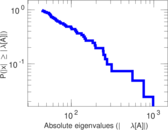
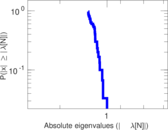
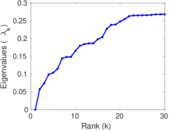
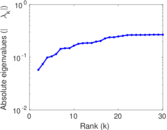
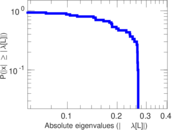
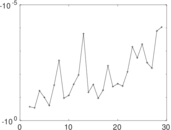
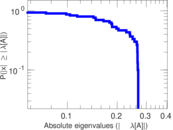
Plots


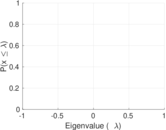
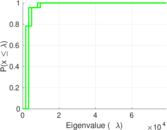

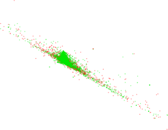


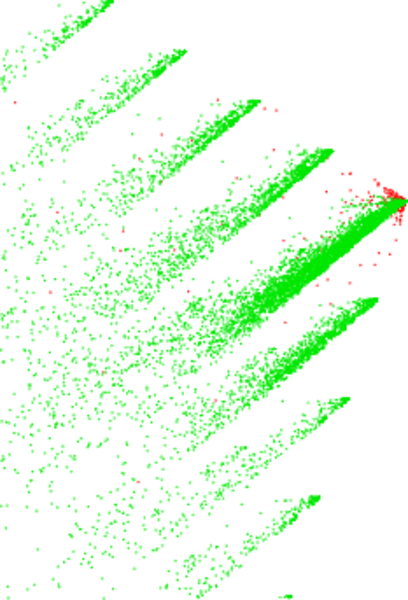
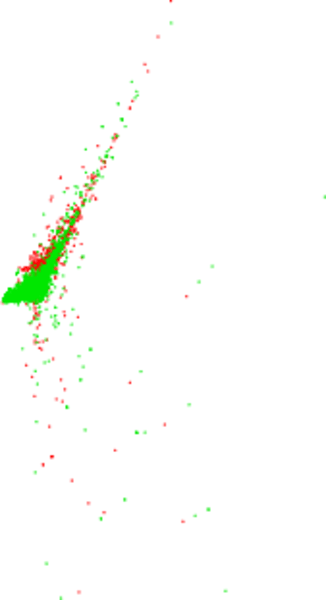
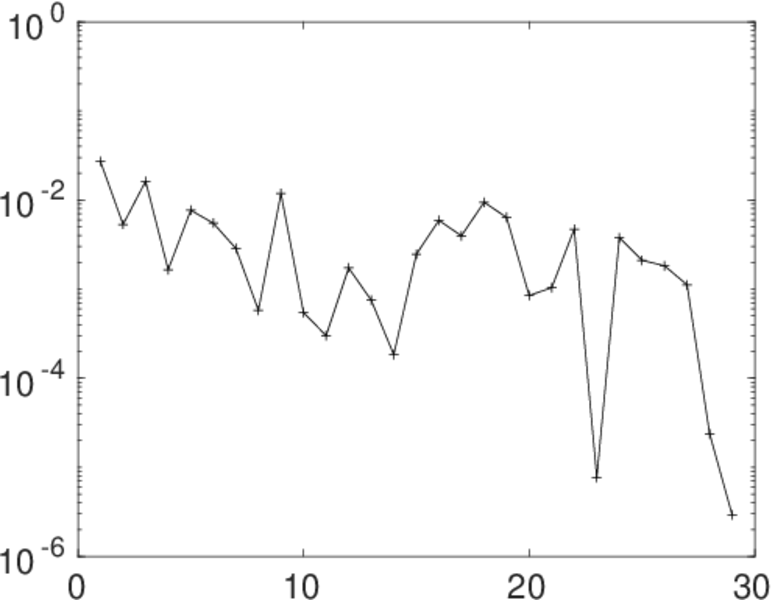
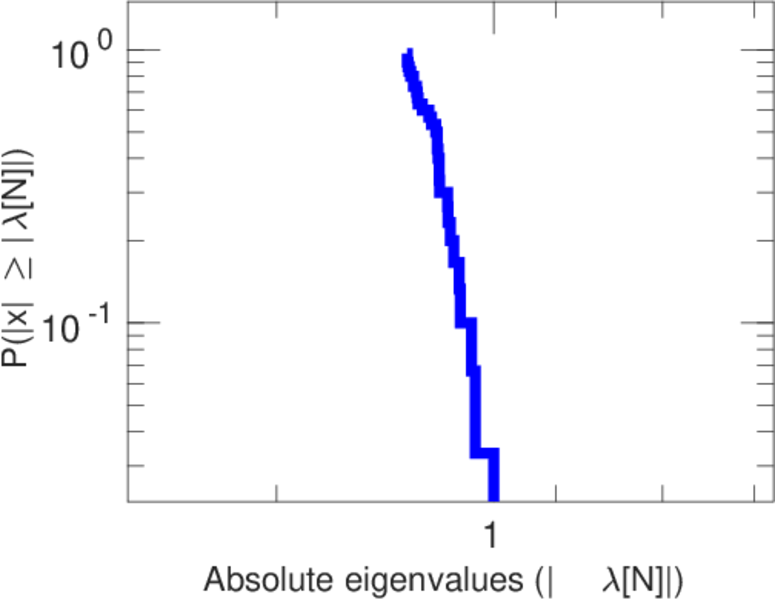
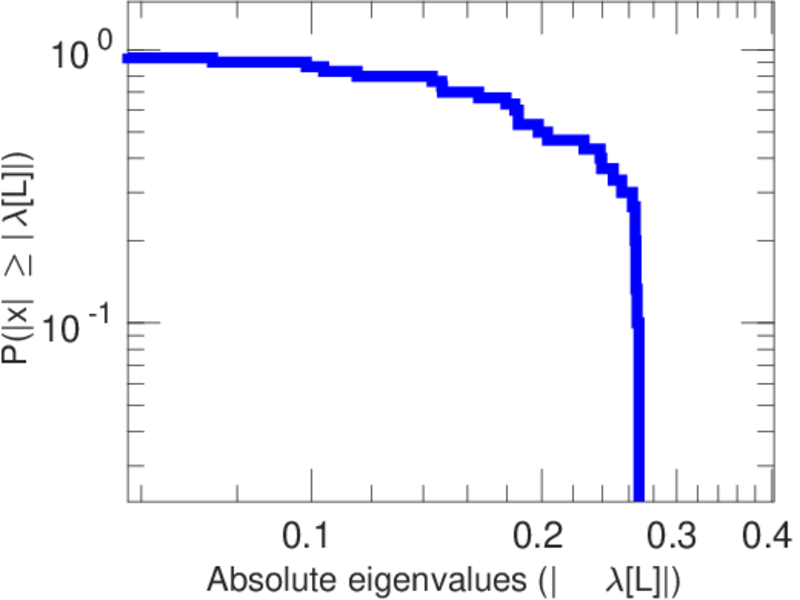
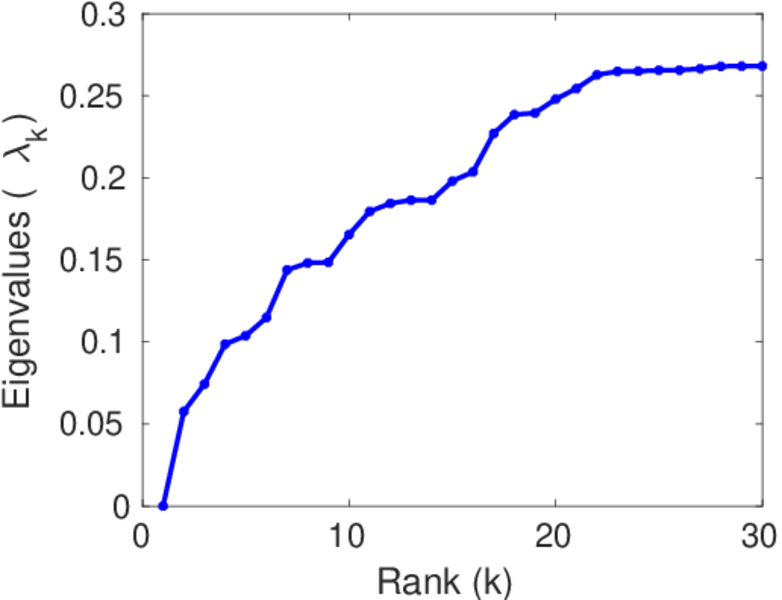
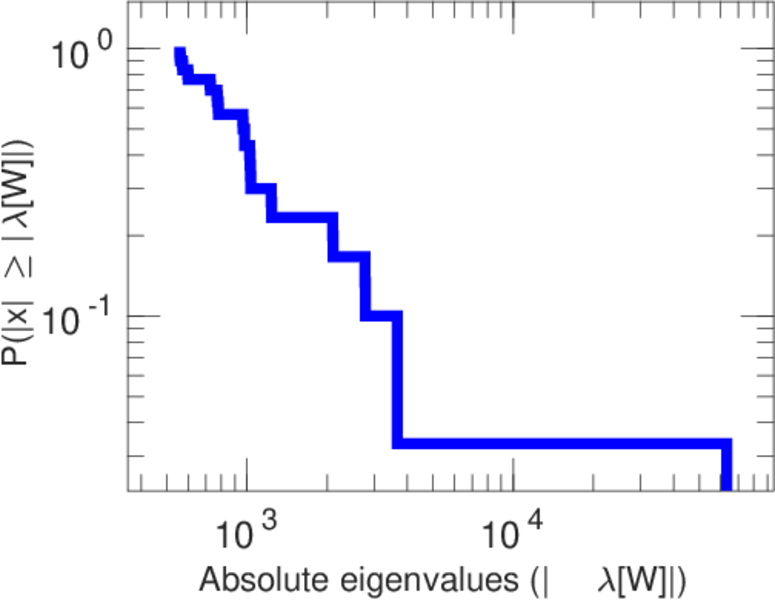
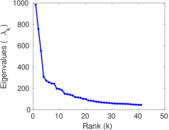
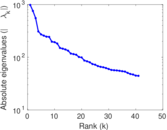
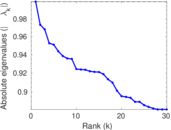
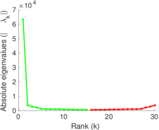
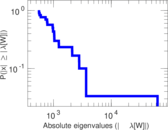
Matrix decompositions plots


Downloads
References
|
[1]
|
Jérôme Kunegis.
KONECT – The Koblenz Network Collection.
In Proc. Int. Conf. on World Wide Web Companion, pages
1343–1350, 2013.
[ http ]
|
|
[2]
|
Wikimedia Foundation.
Wikimedia downloads.
http://dumps.wikimedia.org/, January 2010.
|
 KONECT ‣ Networks ‣
Buy Me a Coffee
KONECT ‣ Networks ‣
Buy Me a Coffee