Wiktionary edits (pnb)
This is the bipartite edit network of the Western Punjabi Wiktionary. It
contains users and pages from the Western Punjabi Wiktionary, connected by edit
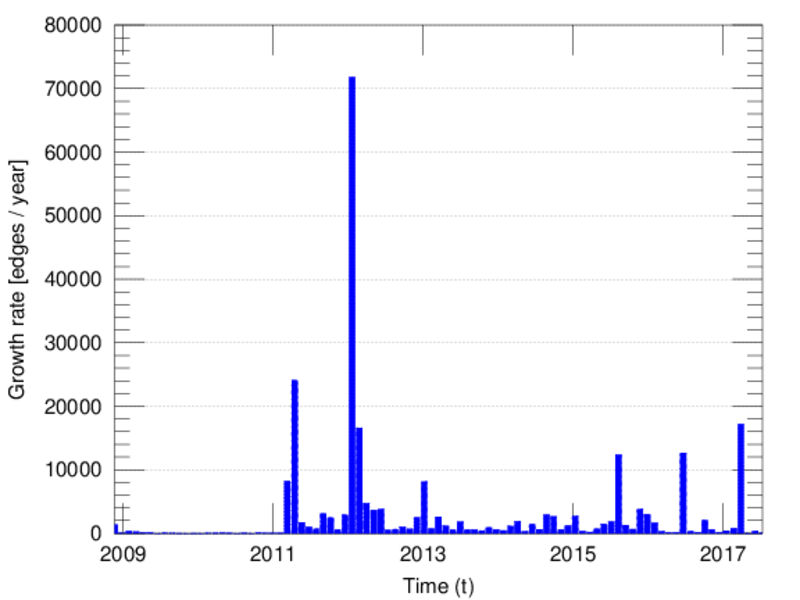
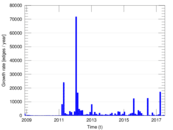
events. Each edge represents an edit. The dataset includes the timestamp of
each edit.
Metadata
Statistics
| Size | n = | 10,310
|
| Left size | n1 = | 138
|
| Right size | n2 = | 10,172
|
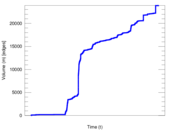
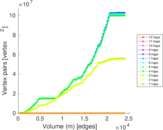
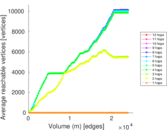
| Volume | m = | 23,901
|
| Unique edge count | m̿ = | 19,244
|
| Wedge count | s = | 34,305,175
|
| Claw count | z = | 57,901,824,033
|
| Cross count | x = | 83,216,563,068,658
|
| Square count | q = | 8,182,168
|
| 4-Tour count | T4 = | 202,728,920
|
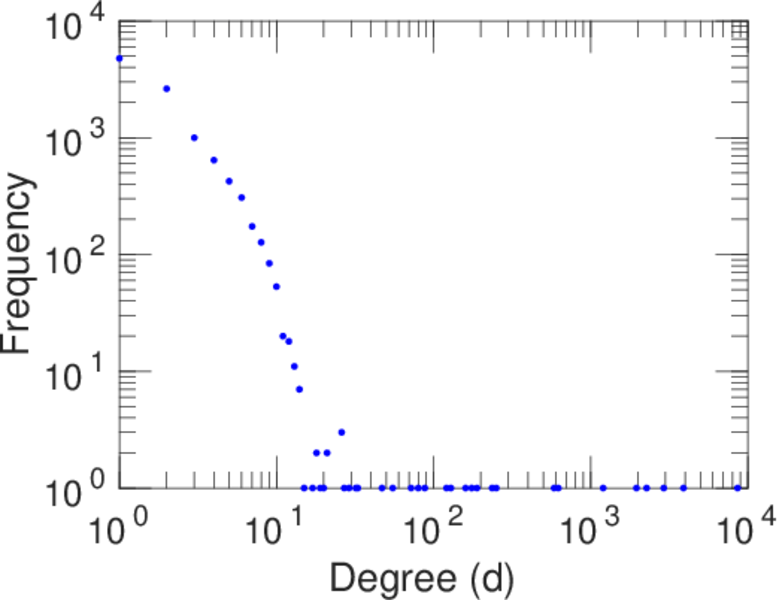
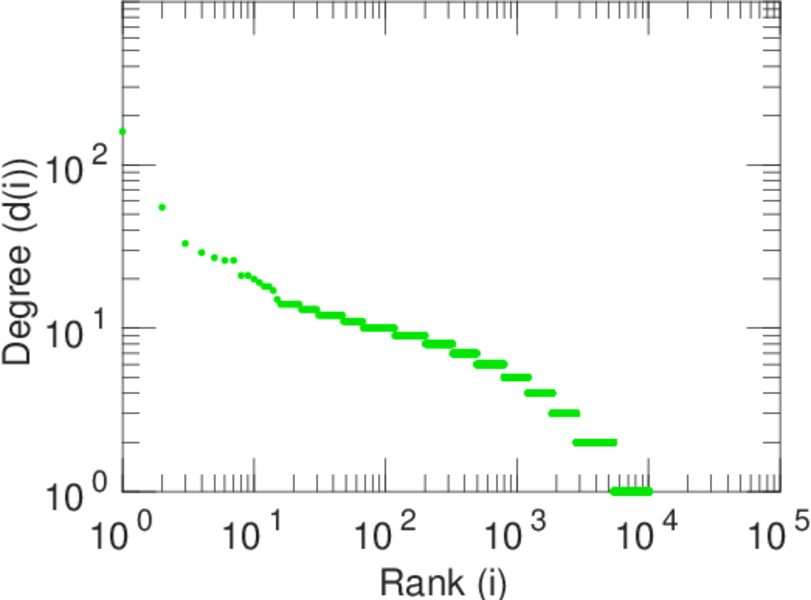
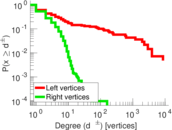
| Maximum degree | dmax = | 8,630
|
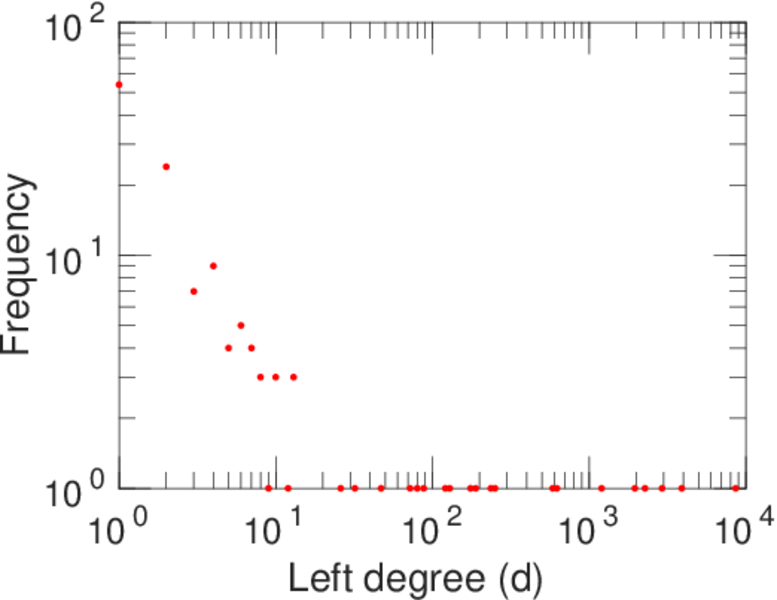
| Maximum left degree | d1max = | 8,630
|
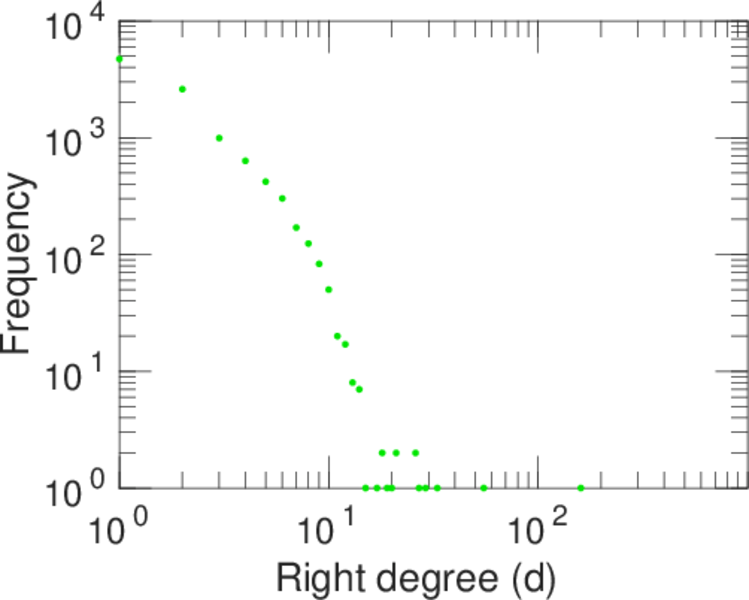
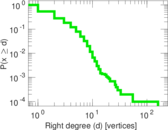
| Maximum right degree | d2max = | 160
|
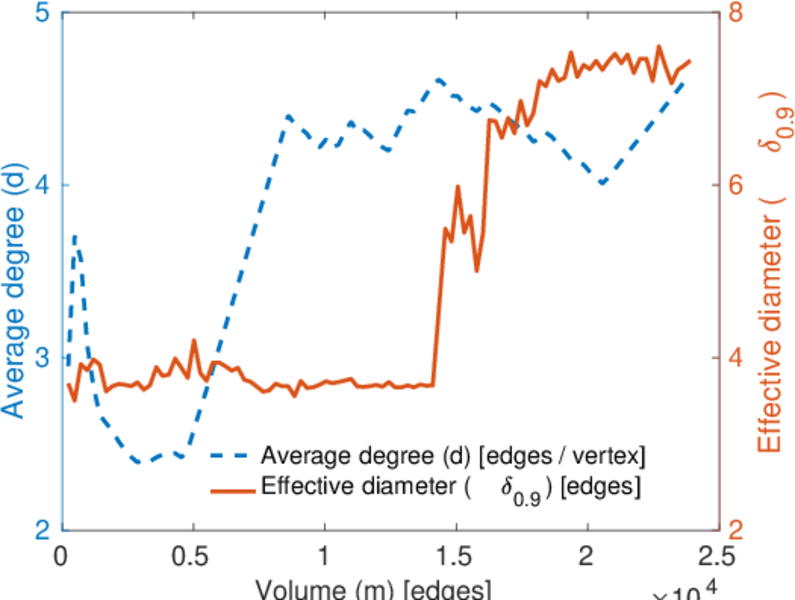
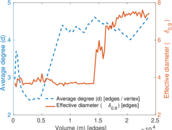
| Average degree | d = | 4.636 47
|
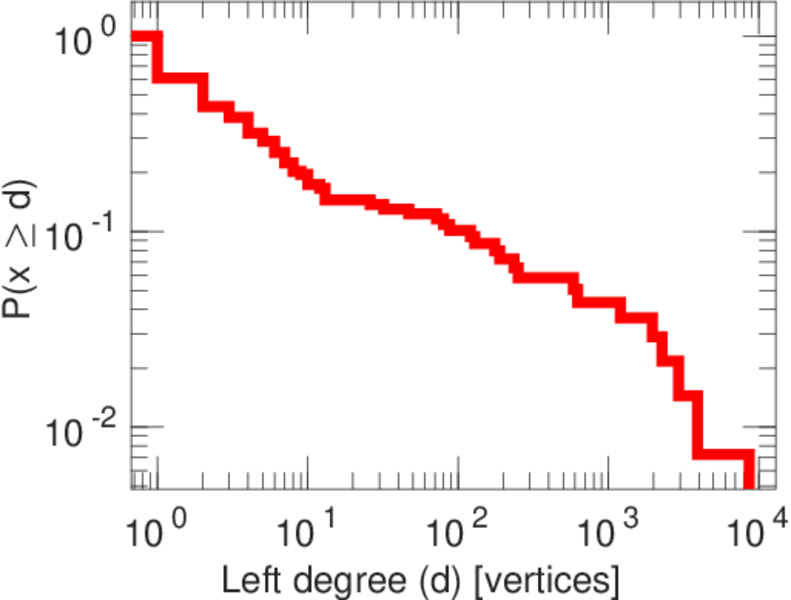
| Average left degree | d1 = | 173.196
|
| Average right degree | d2 = | 2.349 69
|
| Fill | p = | 0.013 709 1
|
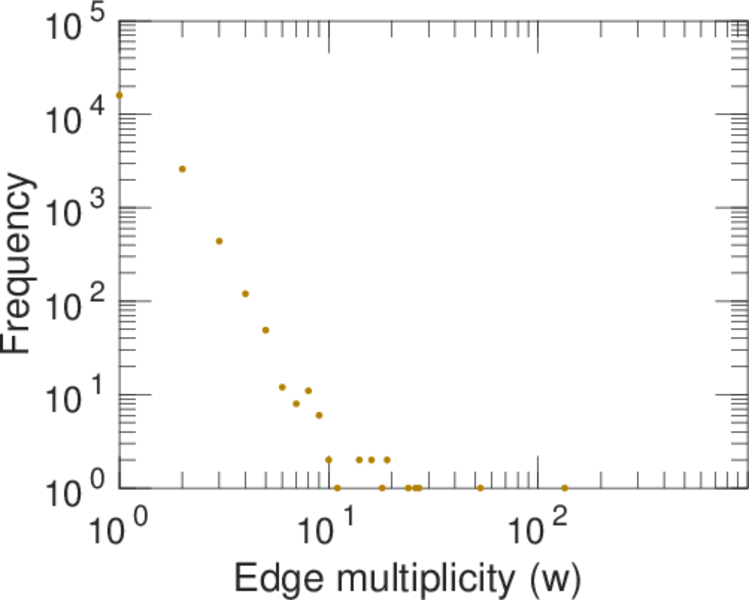
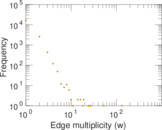
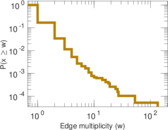
| Average edge multiplicity | m̃ = | 1.242 00
|
| Size of LCC | N = | 10,129
|
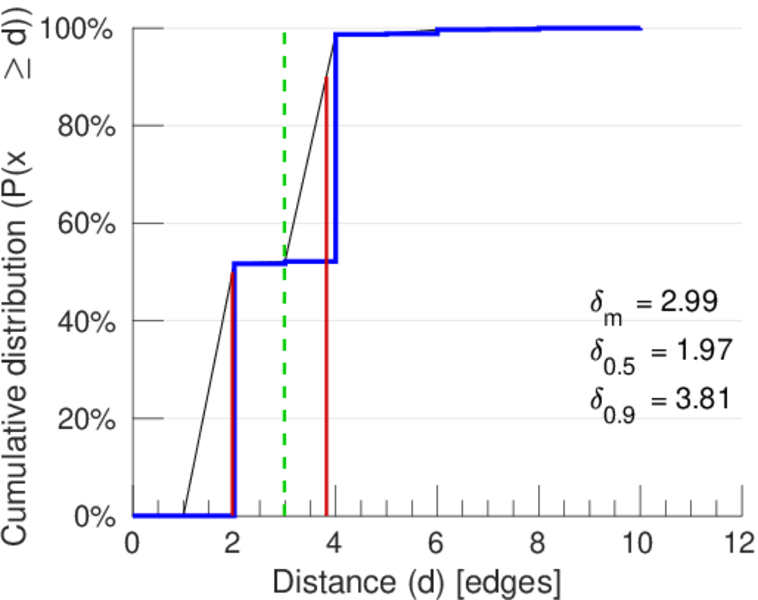
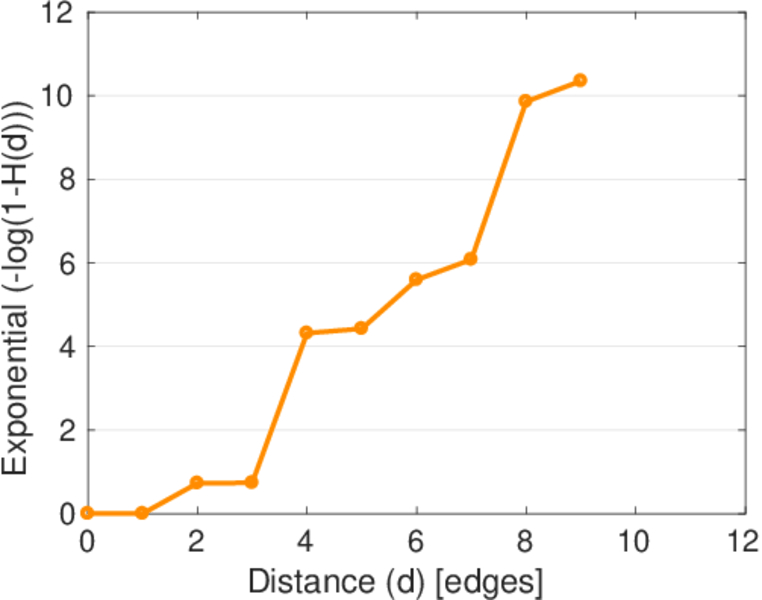
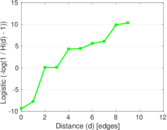
| Diameter | δ = | 12
|
| 50-Percentile effective diameter | δ0.5 = | 1.967 20
|
| 90-Percentile effective diameter | δ0.9 = | 3.813 70
|
| Median distance | δM = | 2
|
| Mean distance | δm = | 2.992 51
|
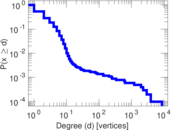
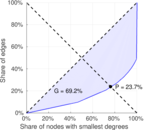
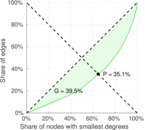
| Gini coefficient | G = | 0.695 569
|
| Balanced inequality ratio | P = | 0.233 923
|
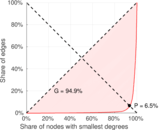
| Left balanced inequality ratio | P1 = | 0.064 683 5
|
| Right balanced inequality ratio | P2 = | 0.350 906
|
| Relative edge distribution entropy | Her = | 0.678 910
|
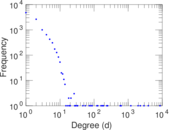
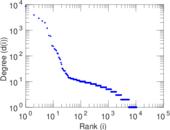
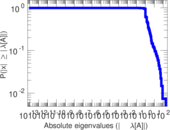
| Power law exponent | γ = | 3.109 36
|
| Tail power law exponent | γt = | 2.911 00
|
| Tail power law exponent with p | γ3 = | 2.911 00
|
| p-value | p = | 0.000 00
|
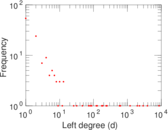
| Left tail power law exponent with p | γ3,1 = | 1.571 00
|
| Left p-value | p1 = | 0.022 000 0
|
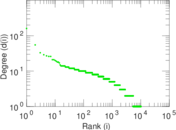
| Right tail power law exponent with p | γ3,2 = | 3.001 00
|
| Right p-value | p2 = | 0.000 00
|
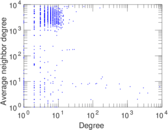
| Degree assortativity | ρ = | −0.357 745
|
| Degree assortativity p-value | pρ = | 0.000 00
|
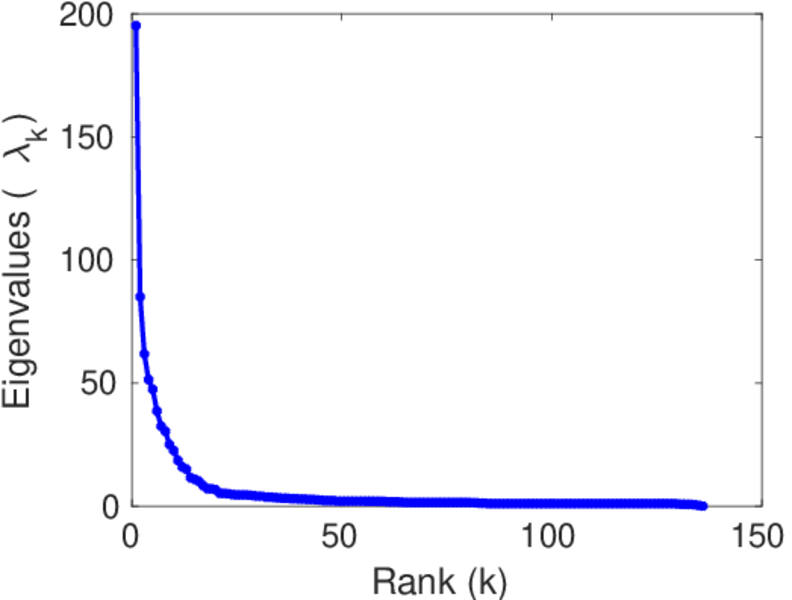
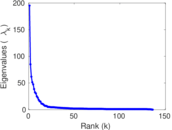
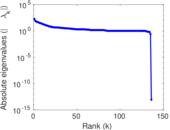
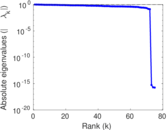
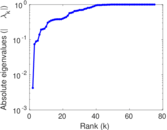
| Spectral norm | α = | 195.125
|
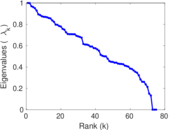
| Algebraic connectivity | a = | 0.004 221 66
|
| Spectral separation | |λ1[A] / λ2[A]| = | 2.296 57
|
| Controllability | C = | 10,029
|
| Relative controllability | Cr = | 0.973 784
|
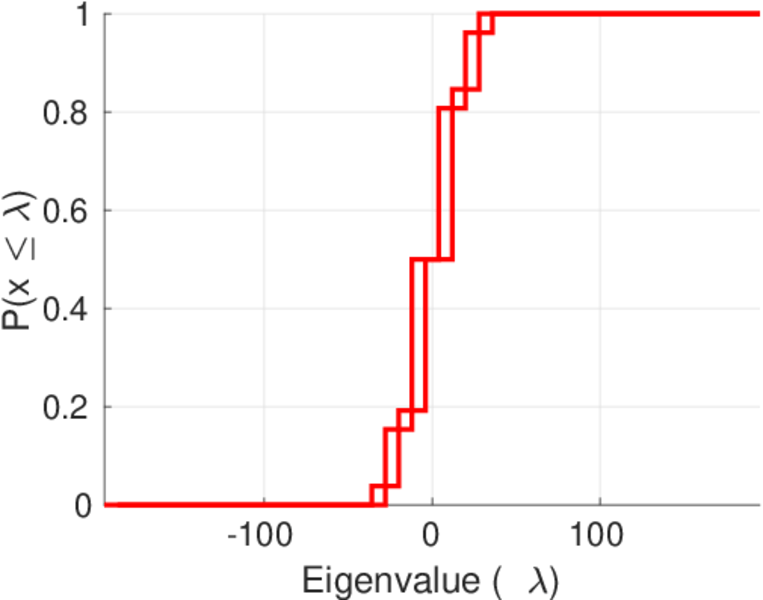
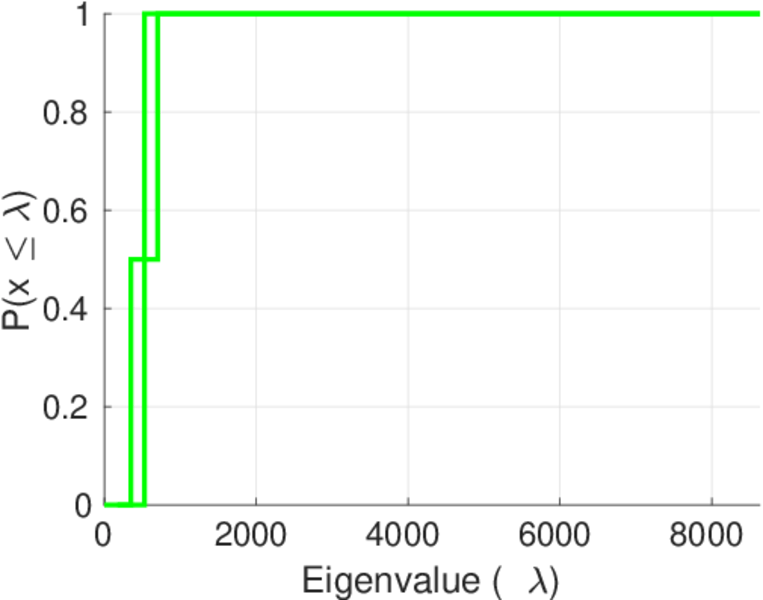
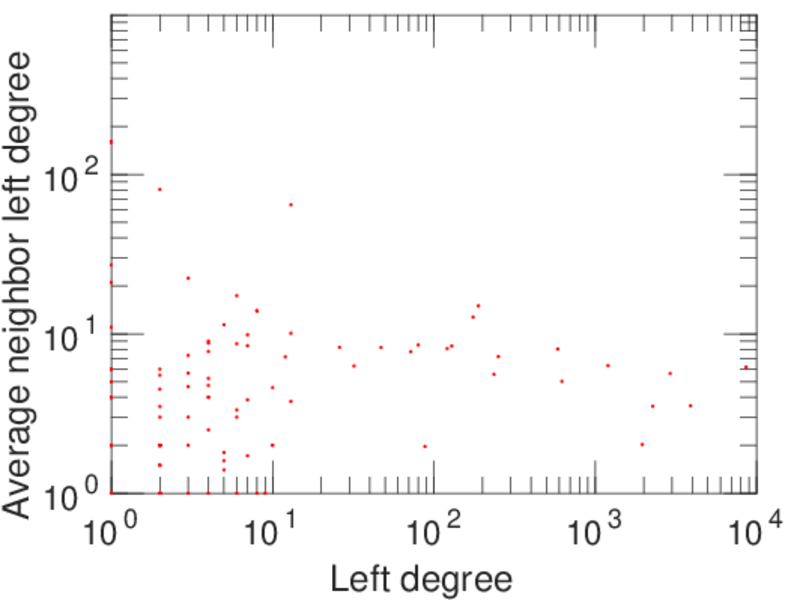
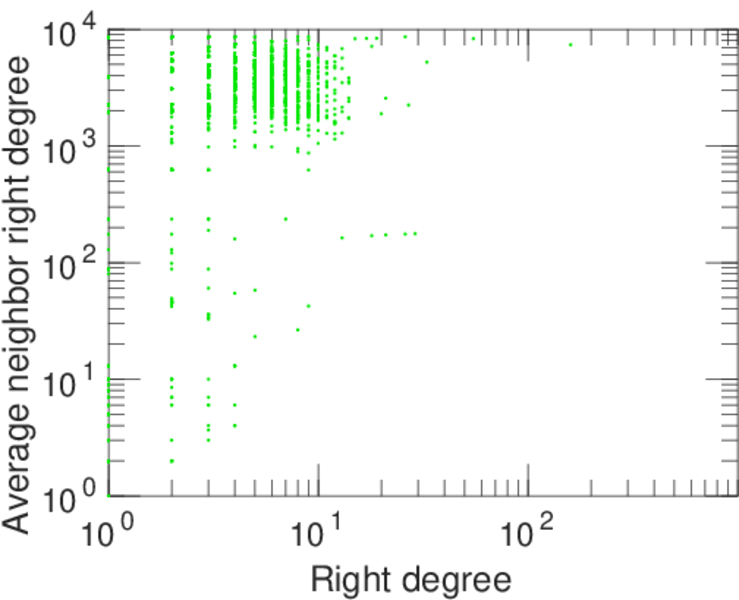
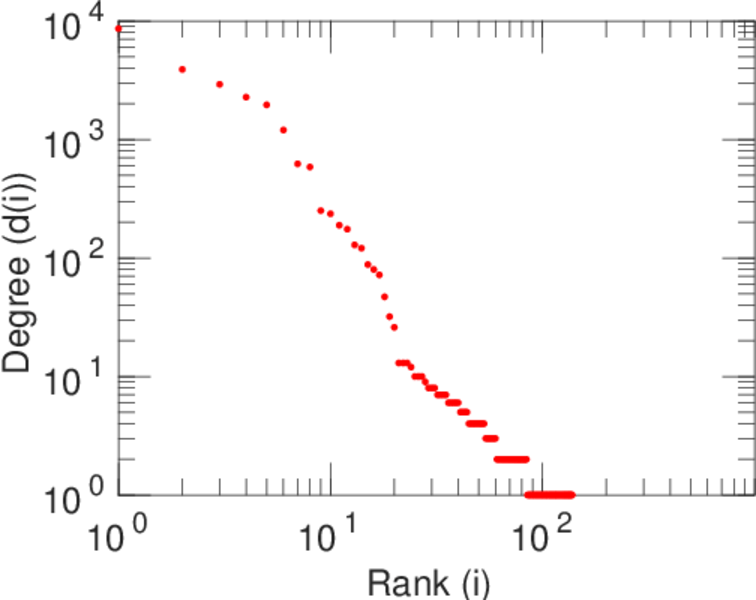
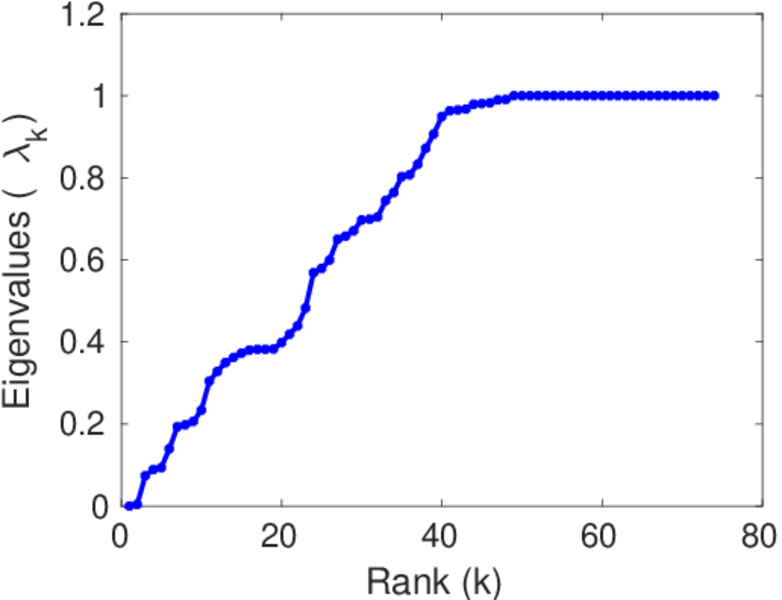
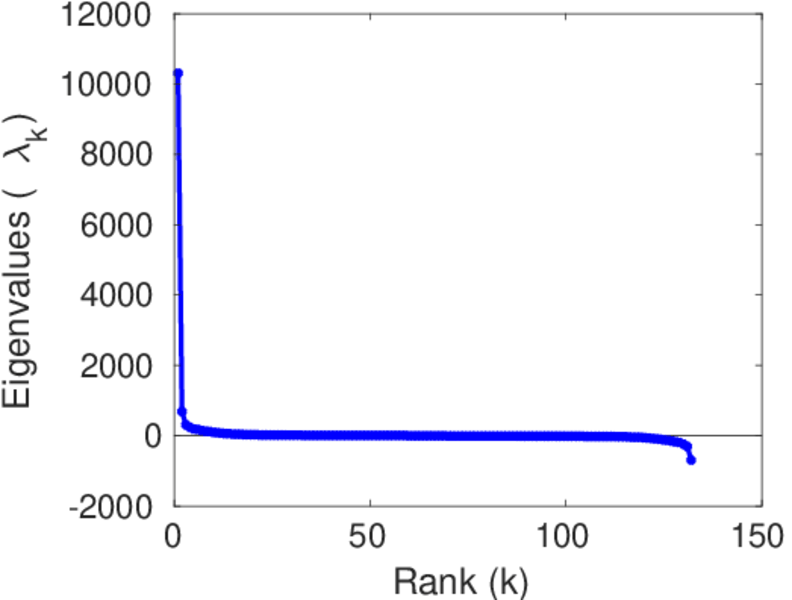
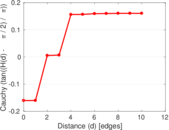
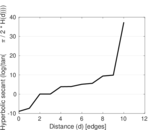
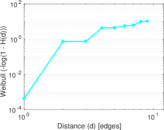
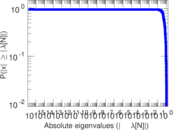
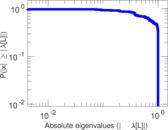
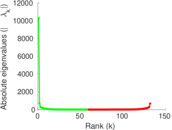
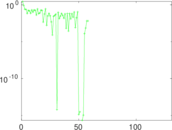
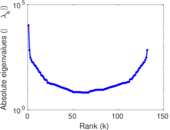
Plots


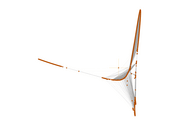


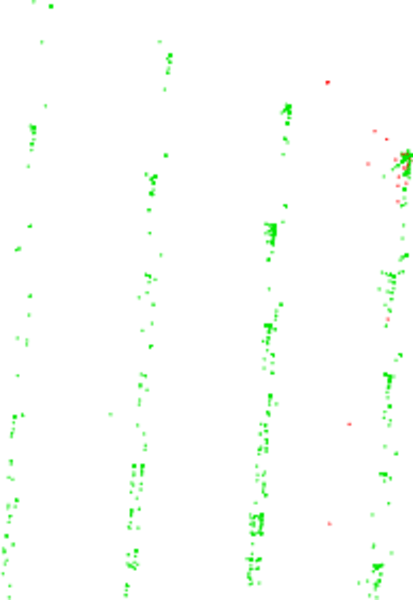
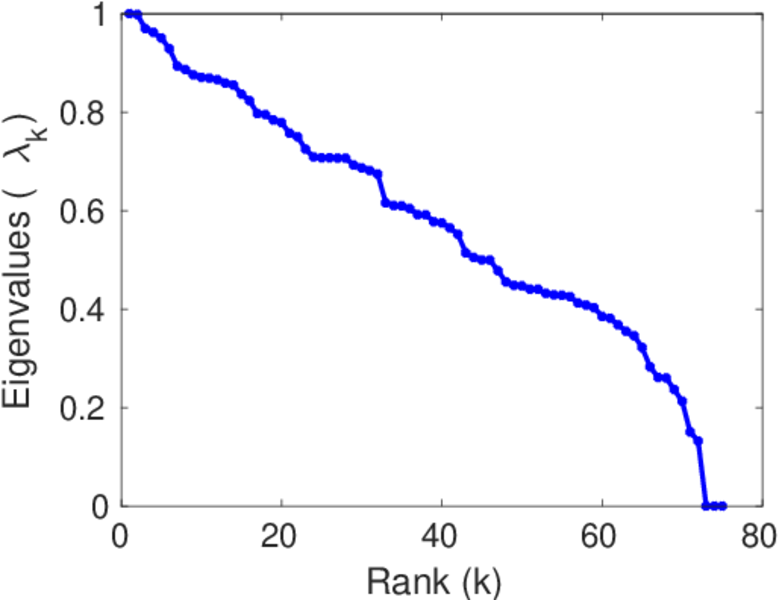
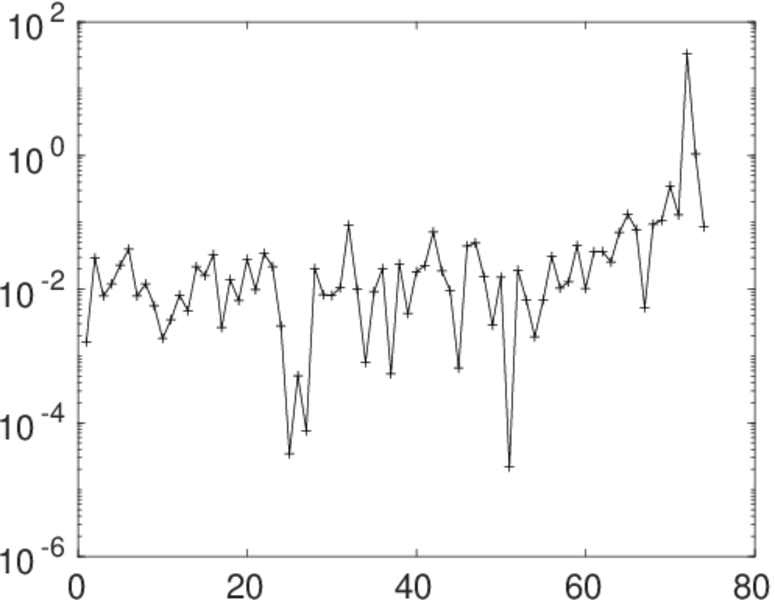
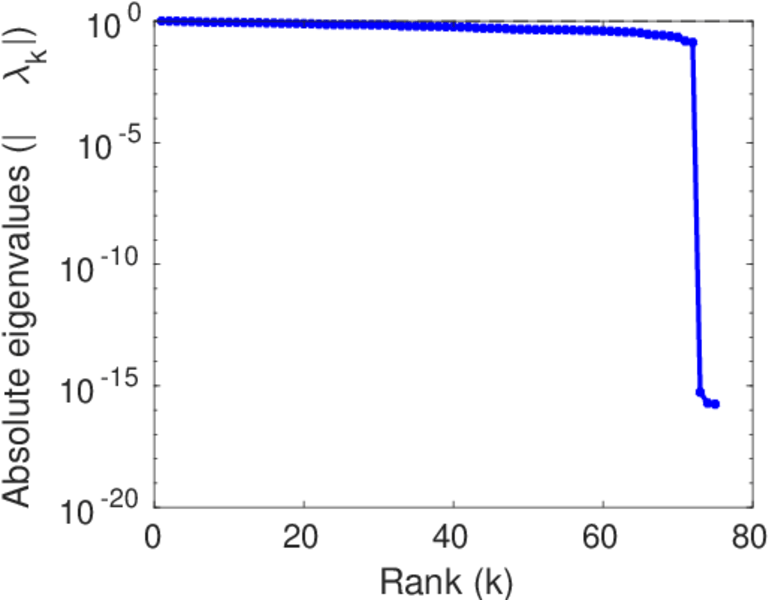
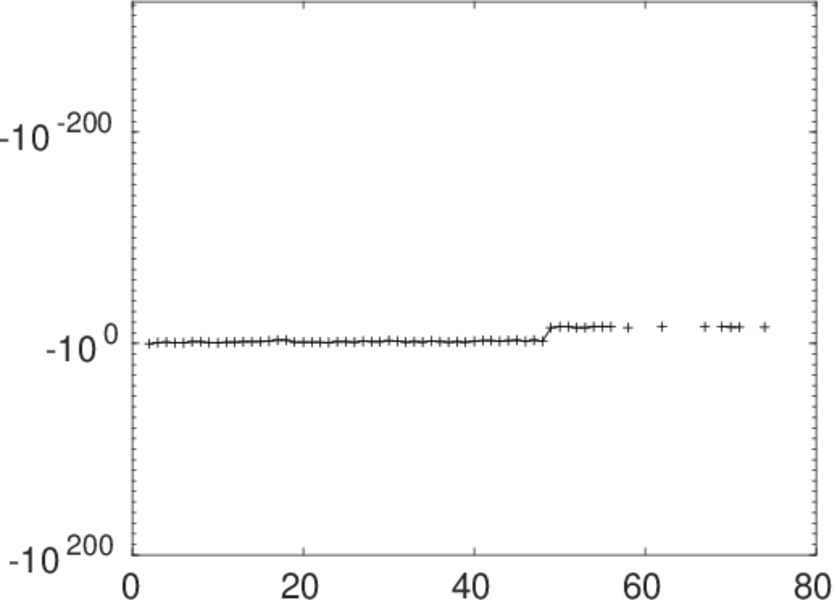
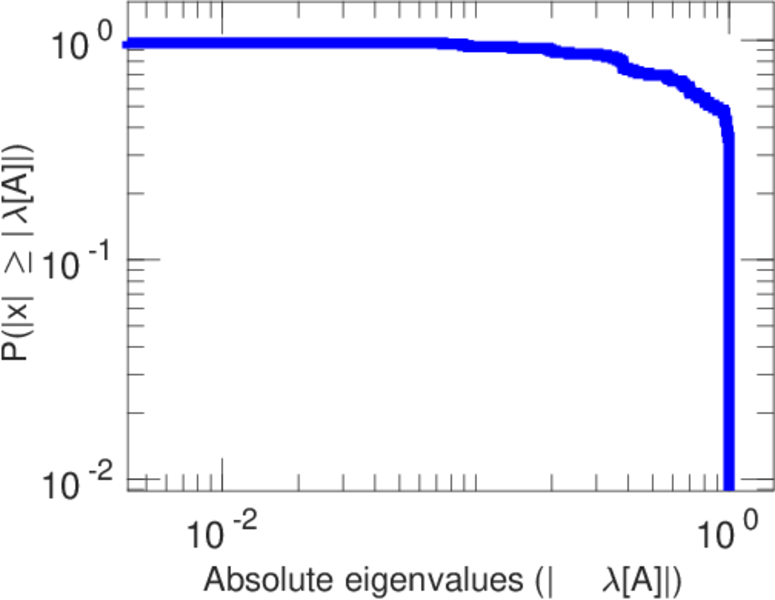
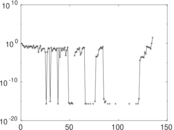
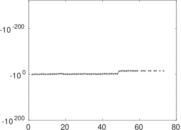
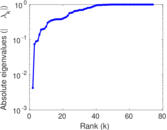
Matrix decompositions plots


Downloads
References
|
[1]
|
Jérôme Kunegis.
KONECT – The Koblenz Network Collection.
In Proc. Int. Conf. on World Wide Web Companion, pages
1343–1350, 2013.
[ http ]
|
|
[2]
|
Wikimedia Foundation.
Wikimedia downloads.
http://dumps.wikimedia.org/, January 2010.
|
 KONECT ‣ Networks ‣
Buy Me a Coffee
KONECT ‣ Networks ‣
Buy Me a Coffee