Wikipedia edits (pnt)
This is the bipartite edit network of the Pontic Wikipedia. It contains users
and pages from the Pontic Wikipedia, connected by edit events. Each edge
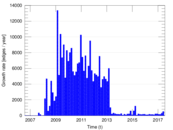
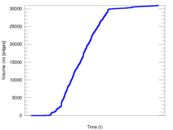
represents an edit. The dataset includes the timestamp of each edit.
Metadata
Statistics
| Size | n = | 2,478
|
| Left size | n1 = | 575
|
| Right size | n2 = | 1,903
|
| Volume | m = | 30,942
|
| Unique edge count | m̿ = | 12,752
|
| Wedge count | s = | 1,484,352
|
| Claw count | z = | 144,386,197
|
| Cross count | x = | 13,228,829,465
|
| Square count | q = | 6,352,484
|
| 4-Tour count | T4 = | 56,804,168
|
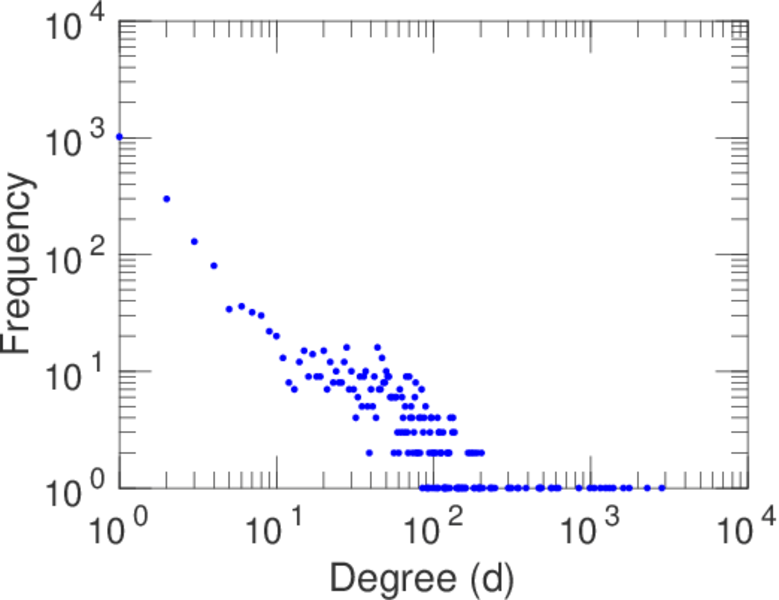
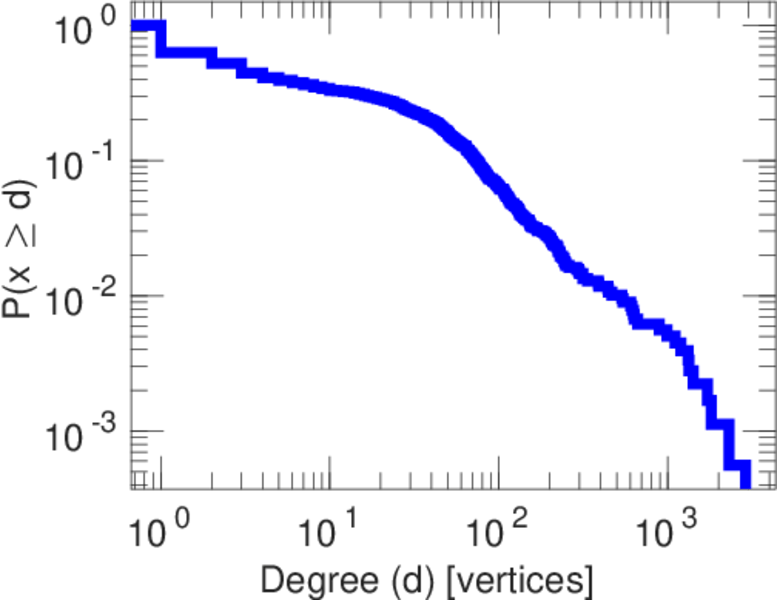
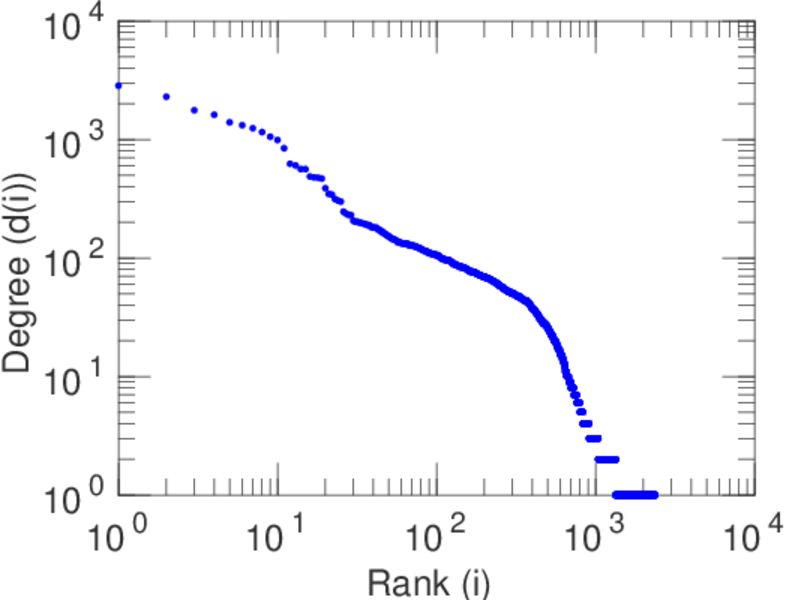
| Maximum degree | dmax = | 2,844
|
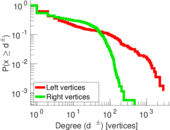
| Maximum left degree | d1max = | 2,844
|
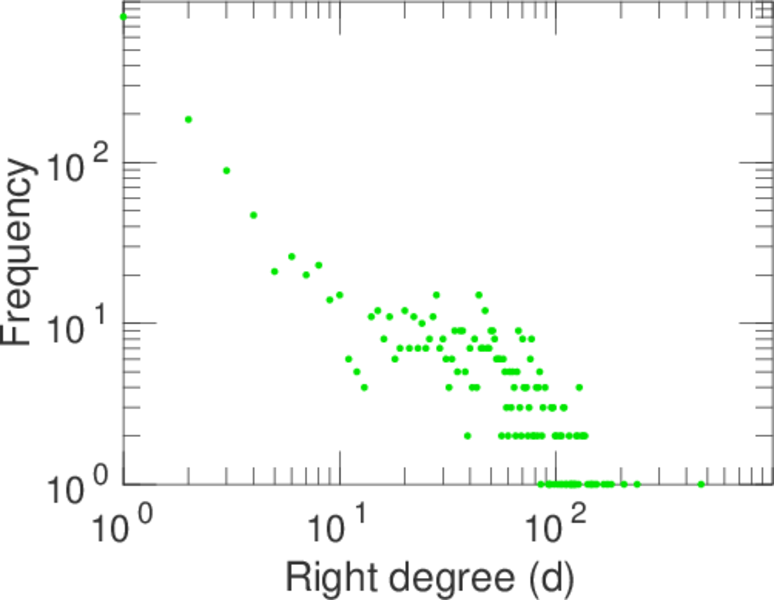
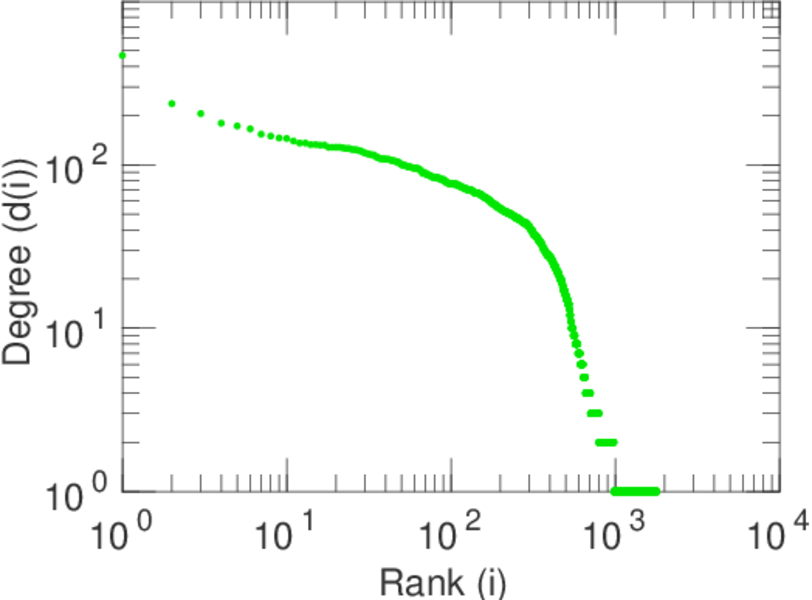
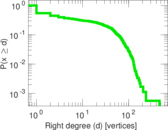
| Maximum right degree | d2max = | 468
|
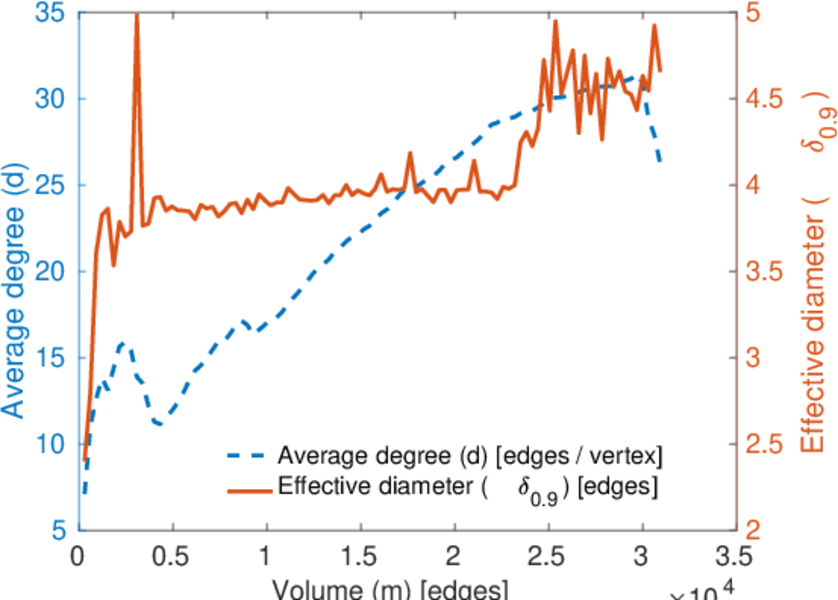
| Average degree | d = | 24.973 4
|
| Average left degree | d1 = | 53.812 2
|
| Average right degree | d2 = | 16.259 6
|
| Fill | p = | 0.011 653 9
|
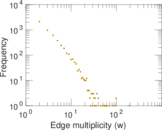
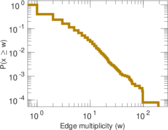
| Average edge multiplicity | m̃ = | 2.426 44
|
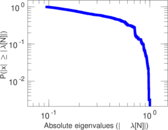
| Size of LCC | N = | 1,894
|
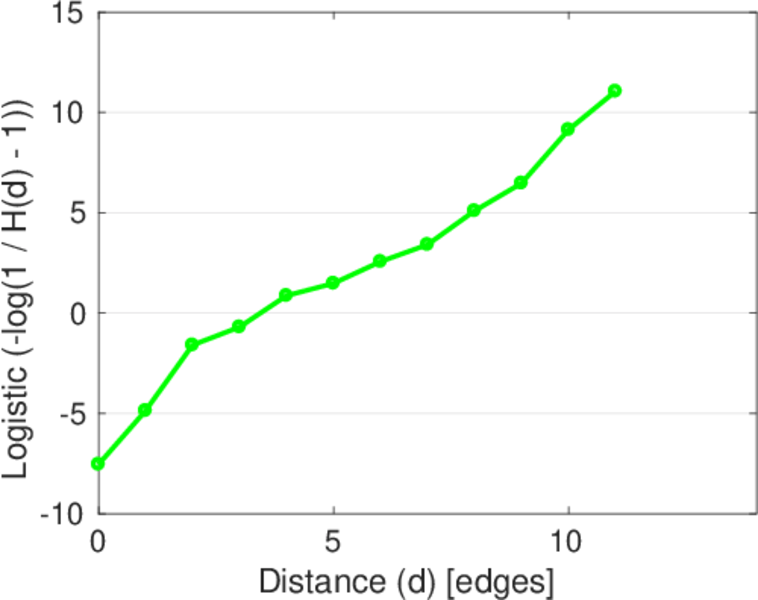
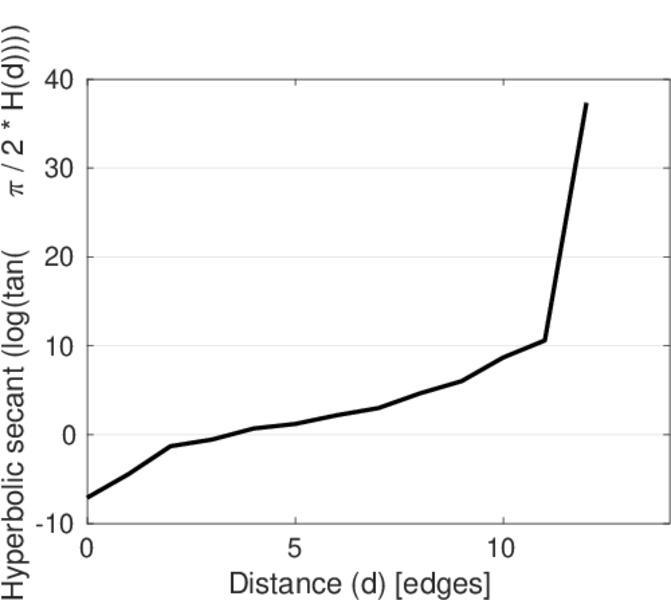
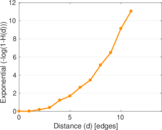
| Diameter | δ = | 12
|
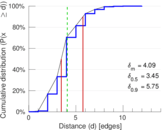
| 50-Percentile effective diameter | δ0.5 = | 3.452 40
|
| 90-Percentile effective diameter | δ0.9 = | 5.751 30
|
| Median distance | δM = | 4
|
| Mean distance | δm = | 4.085 52
|
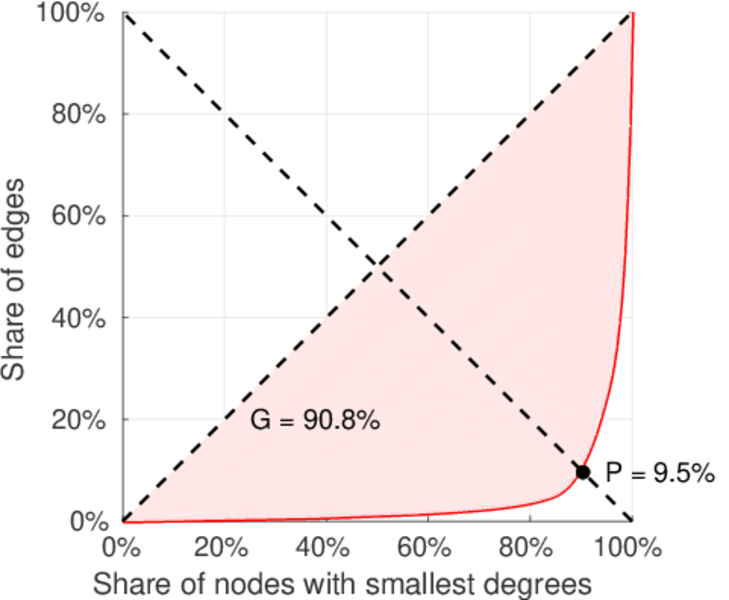
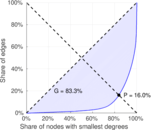
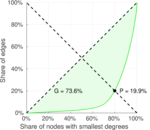
| Gini coefficient | G = | 0.827 772
|
| Balanced inequality ratio | P = | 0.166 279
|
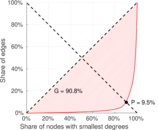
| Left balanced inequality ratio | P1 = | 0.094 661 0
|
| Right balanced inequality ratio | P2 = | 0.199 147
|
| Relative edge distribution entropy | Her = | 0.815 016
|
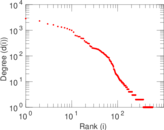
| Power law exponent | γ = | 1.948 99
|
| Tail power law exponent | γt = | 2.501 00
|
| Tail power law exponent with p | γ3 = | 2.501 00
|
| p-value | p = | 0.000 00
|
| Left tail power law exponent with p | γ3,1 = | 1.621 00
|
| Left p-value | p1 = | 0.000 00
|
| Right tail power law exponent with p | γ3,2 = | 4.531 00
|
| Right p-value | p2 = | 0.001 000 00
|
| Degree assortativity | ρ = | +0.045 047 7
|
| Degree assortativity p-value | pρ = | 3.597 86 × 10−7
|
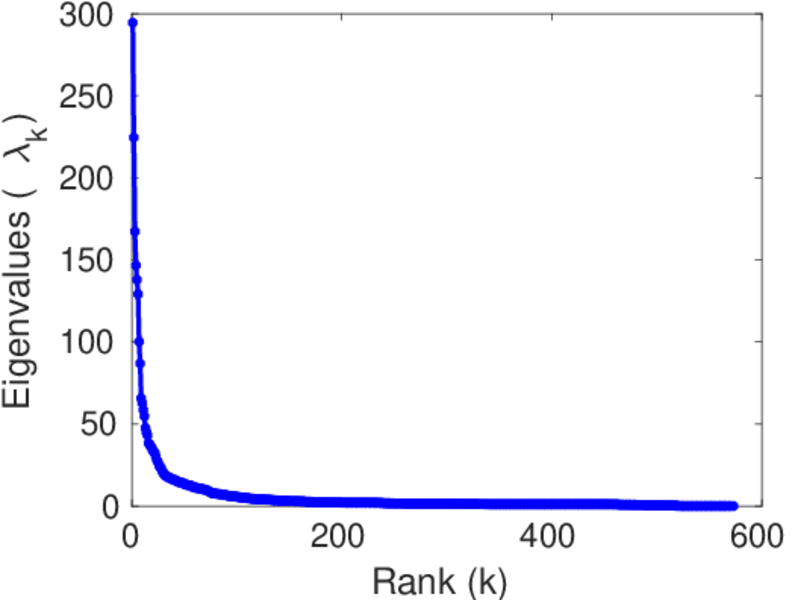
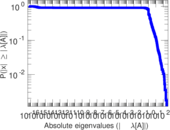
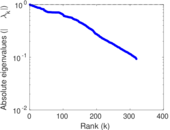
| Spectral norm | α = | 294.482
|
| Algebraic connectivity | a = | 0.047 429 5
|
| Spectral separation | |λ1[A] / λ2[A]| = | 1.312 00
|
| Controllability | C = | 1,319
|
| Relative controllability | Cr = | 0.559 135
|
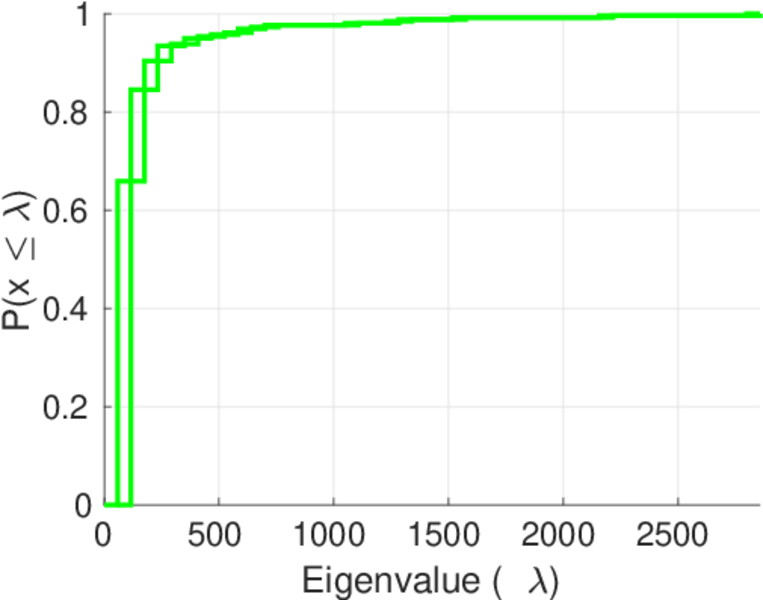
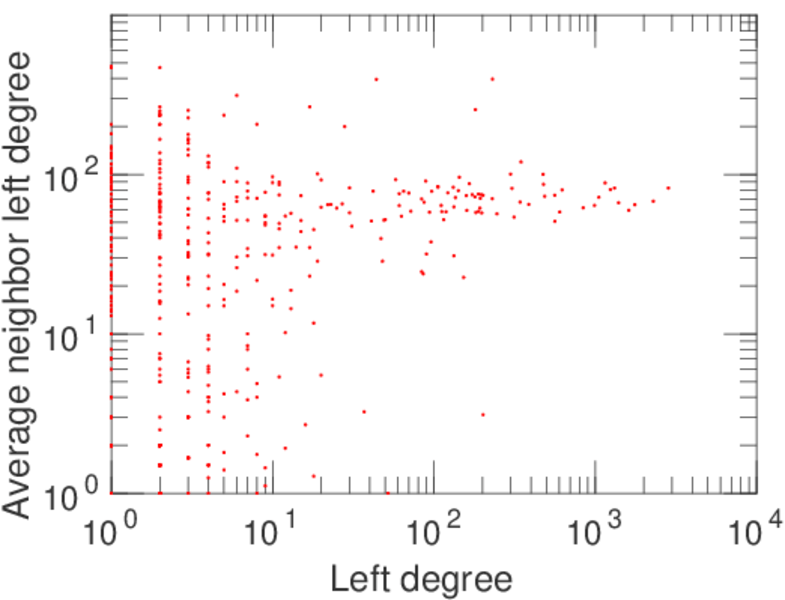
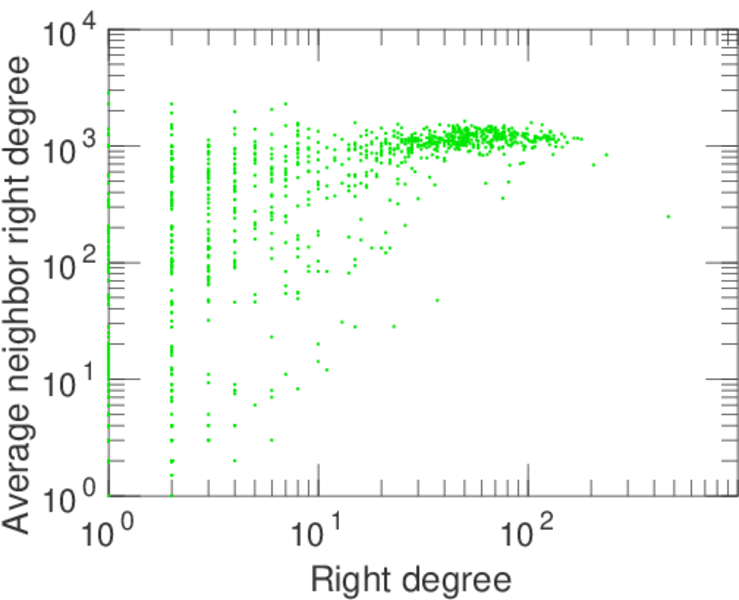
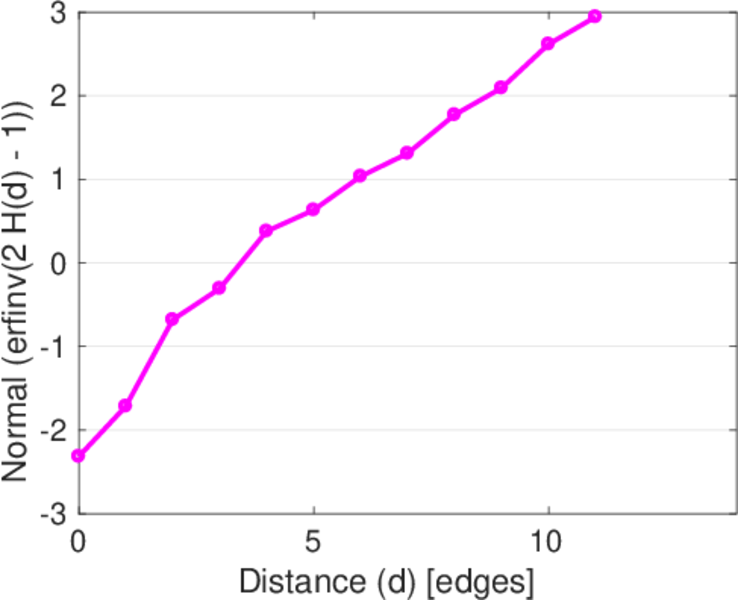
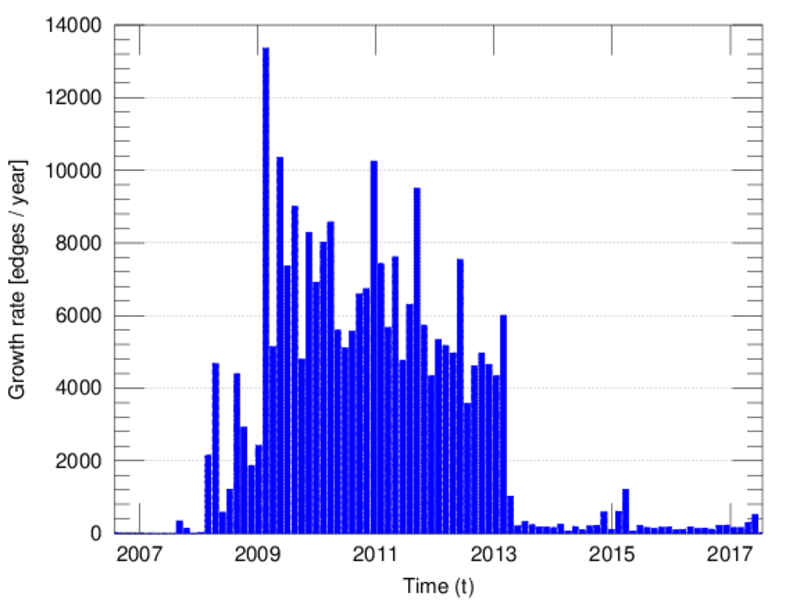
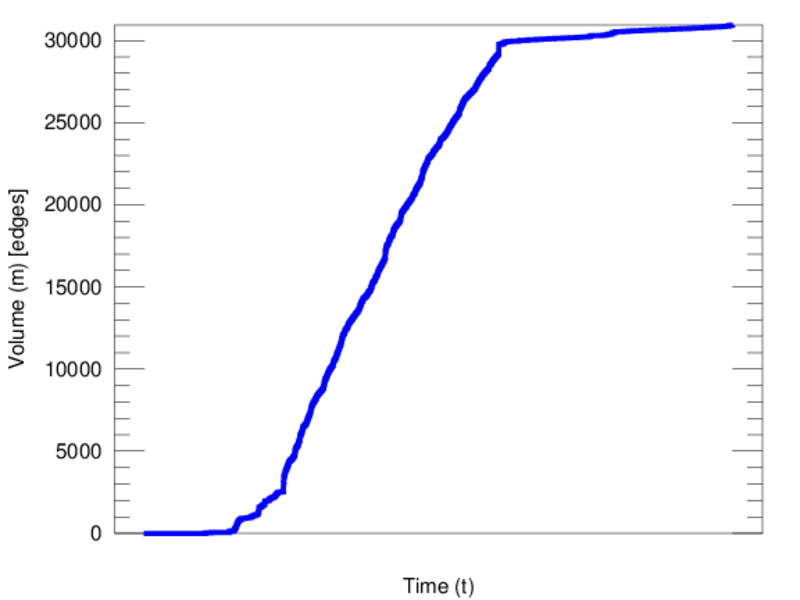
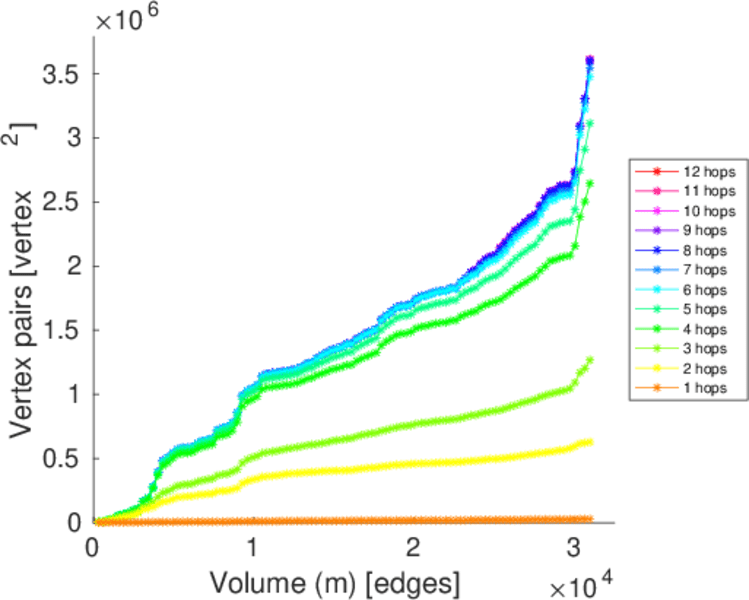
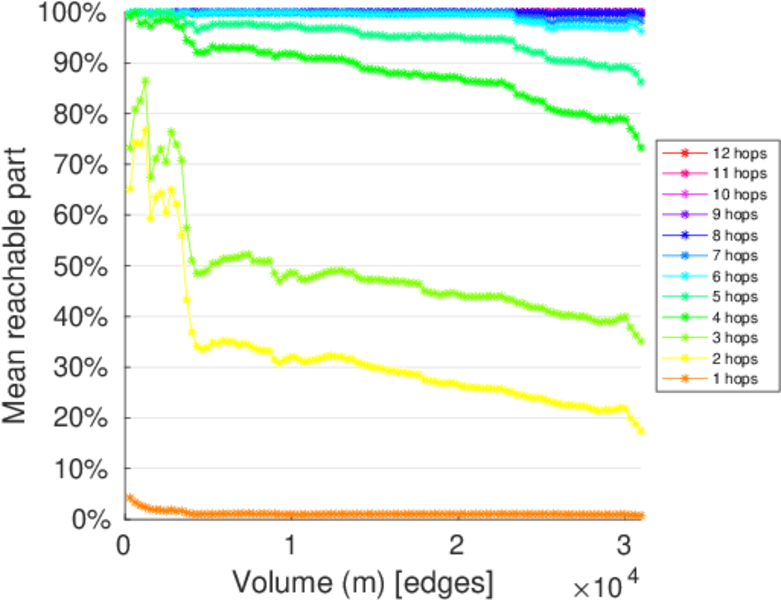
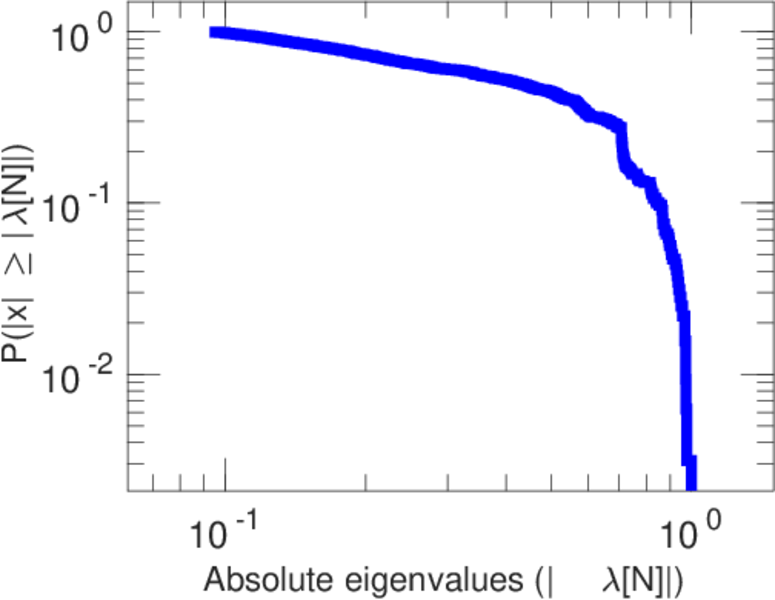
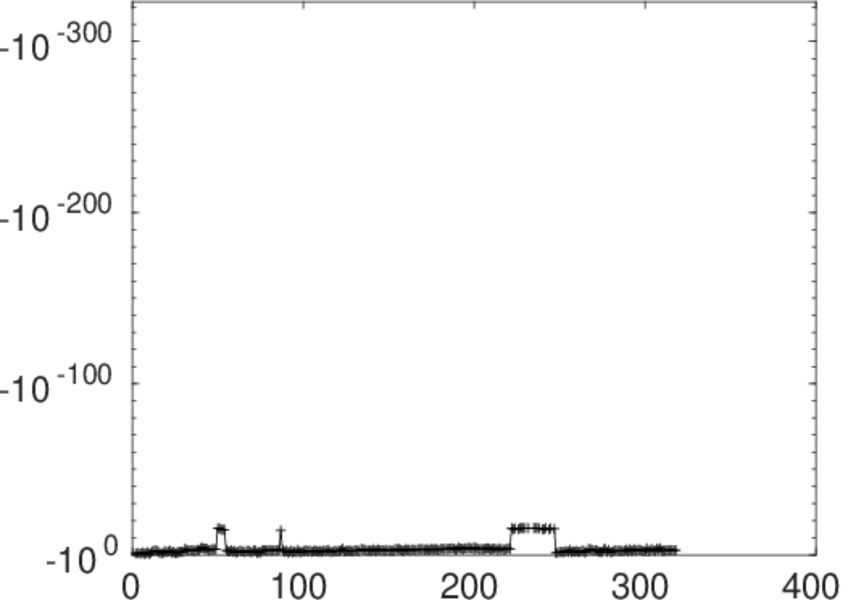
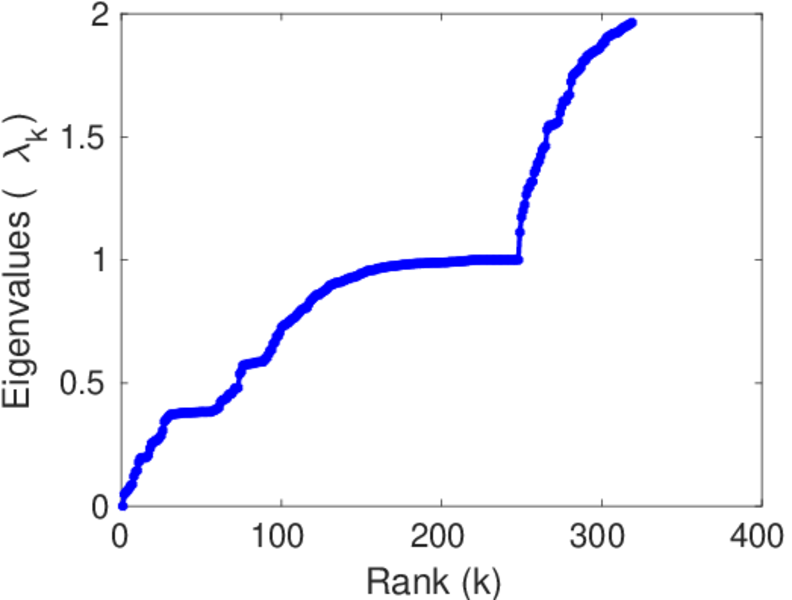
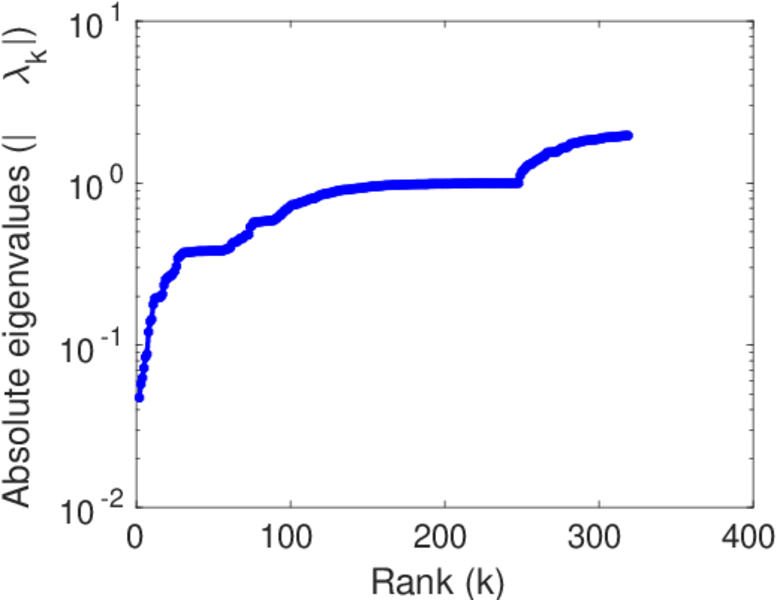
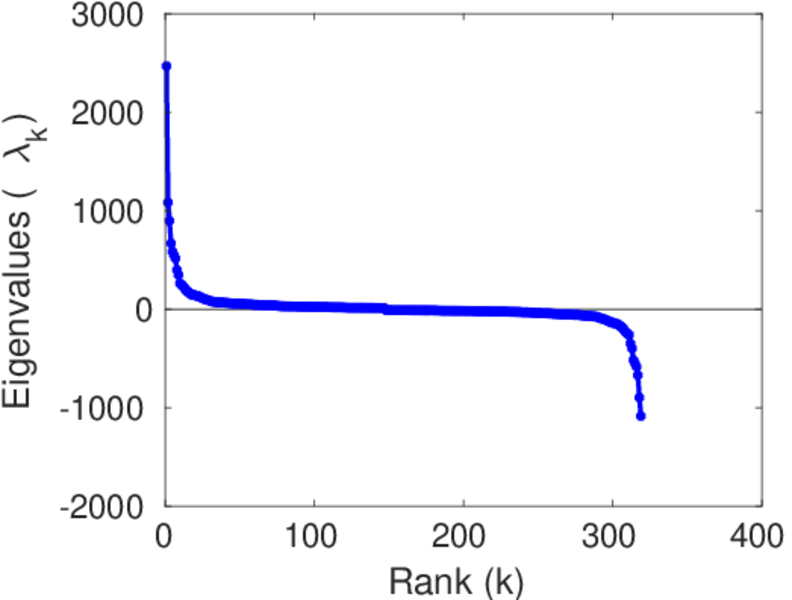
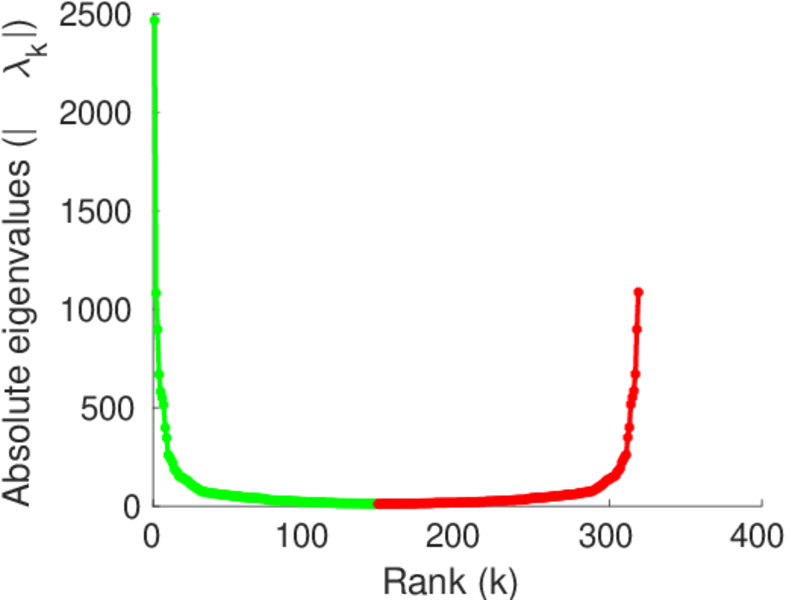
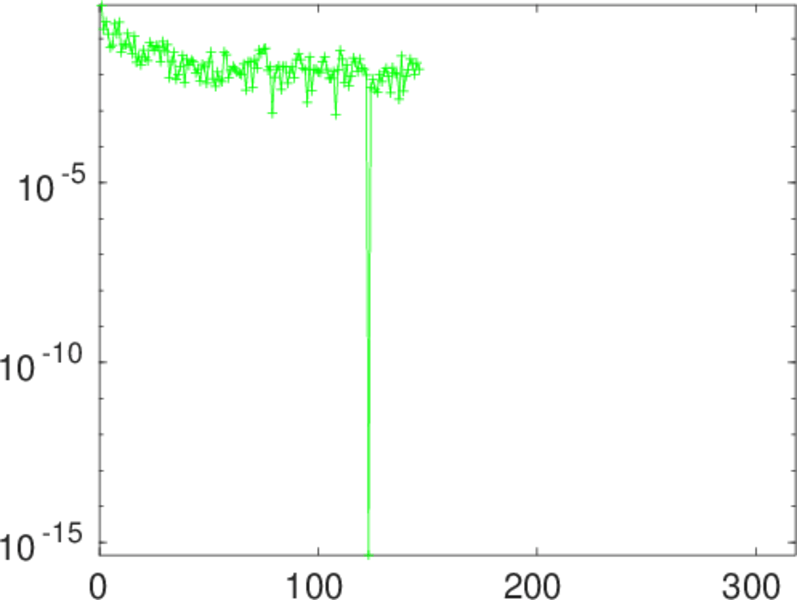
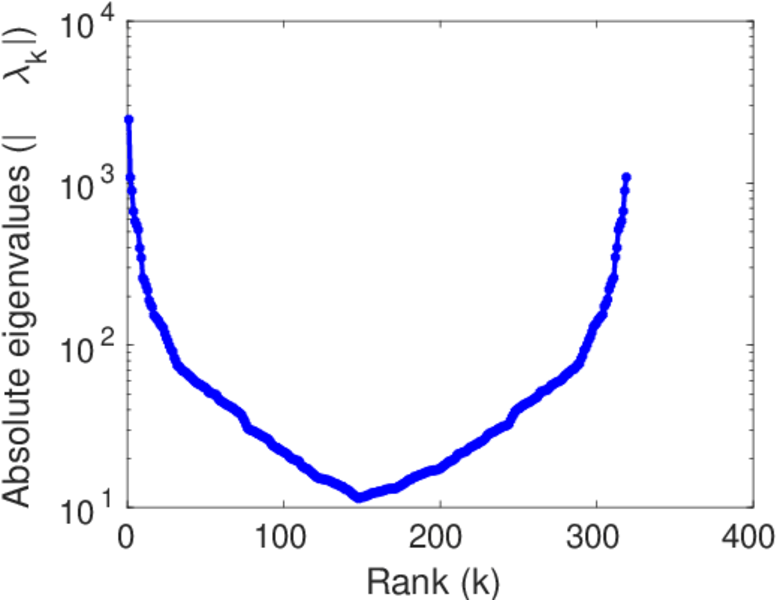
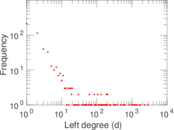
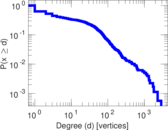
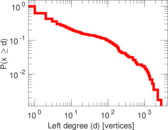
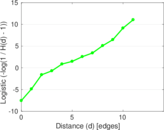
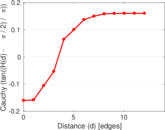
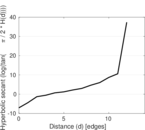
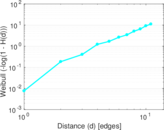
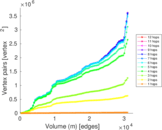
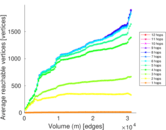
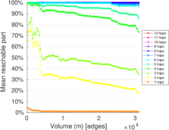
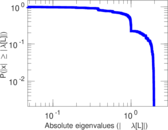
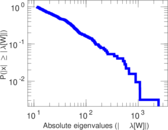
Plots


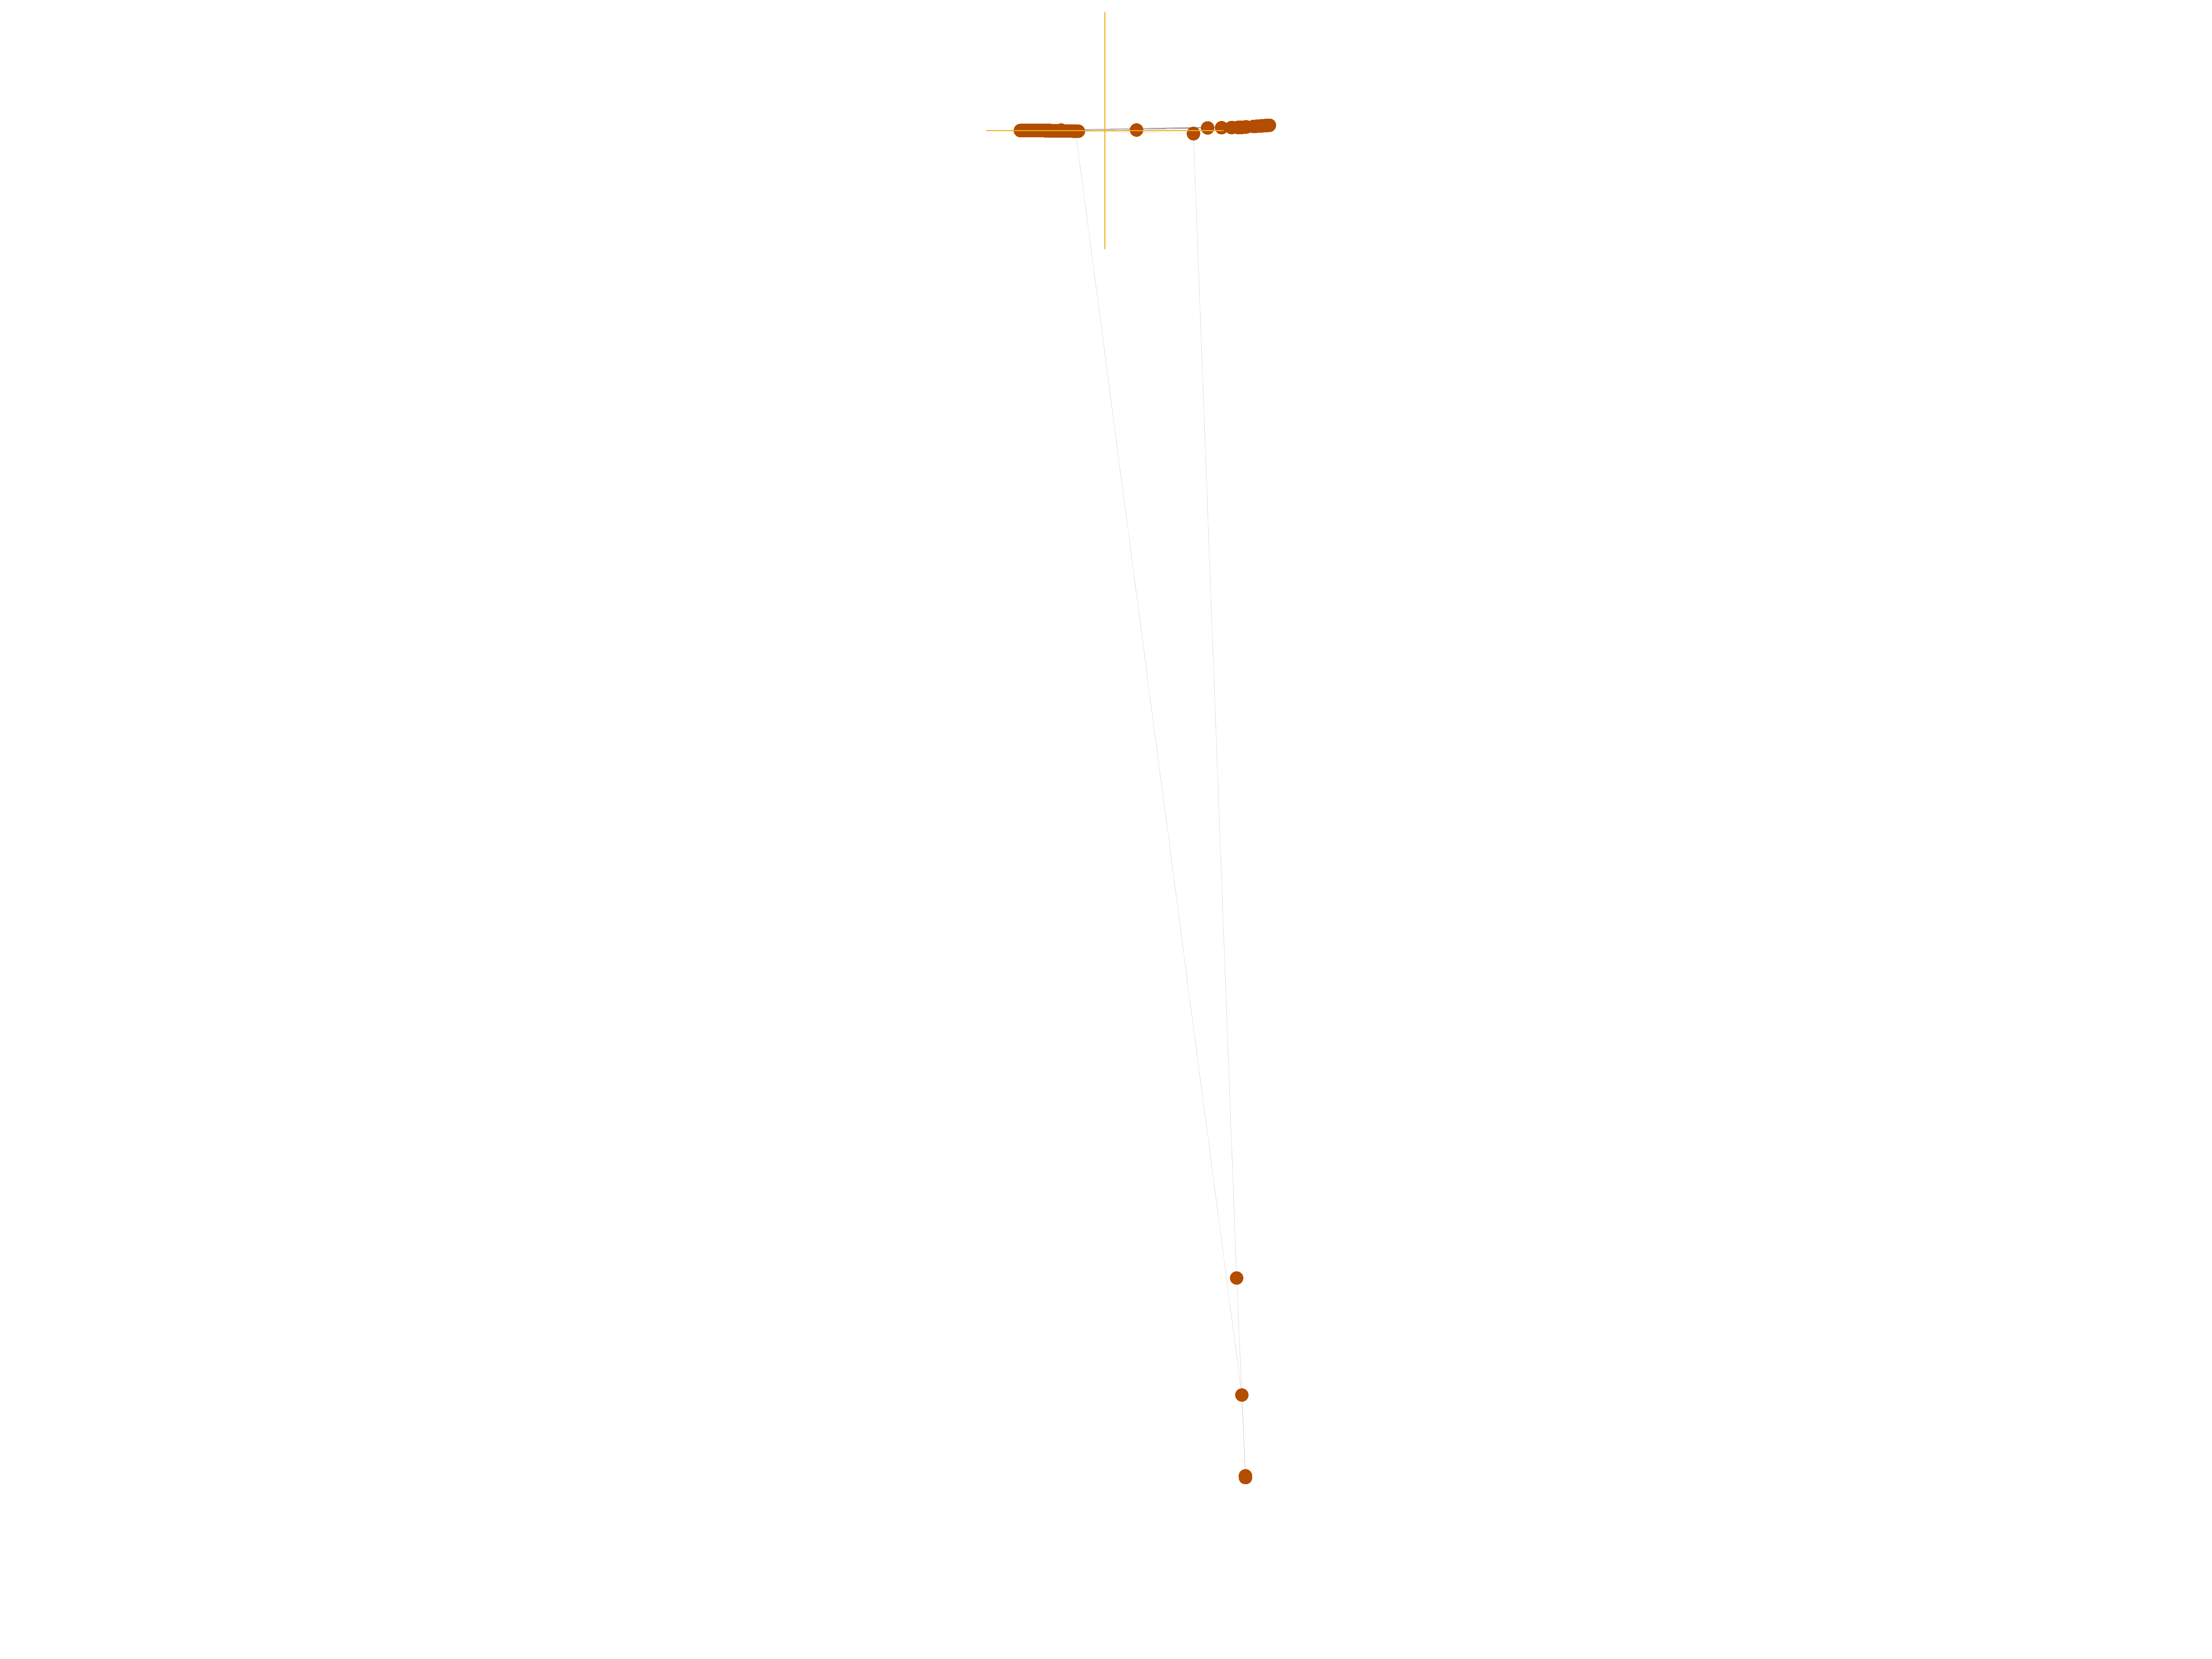
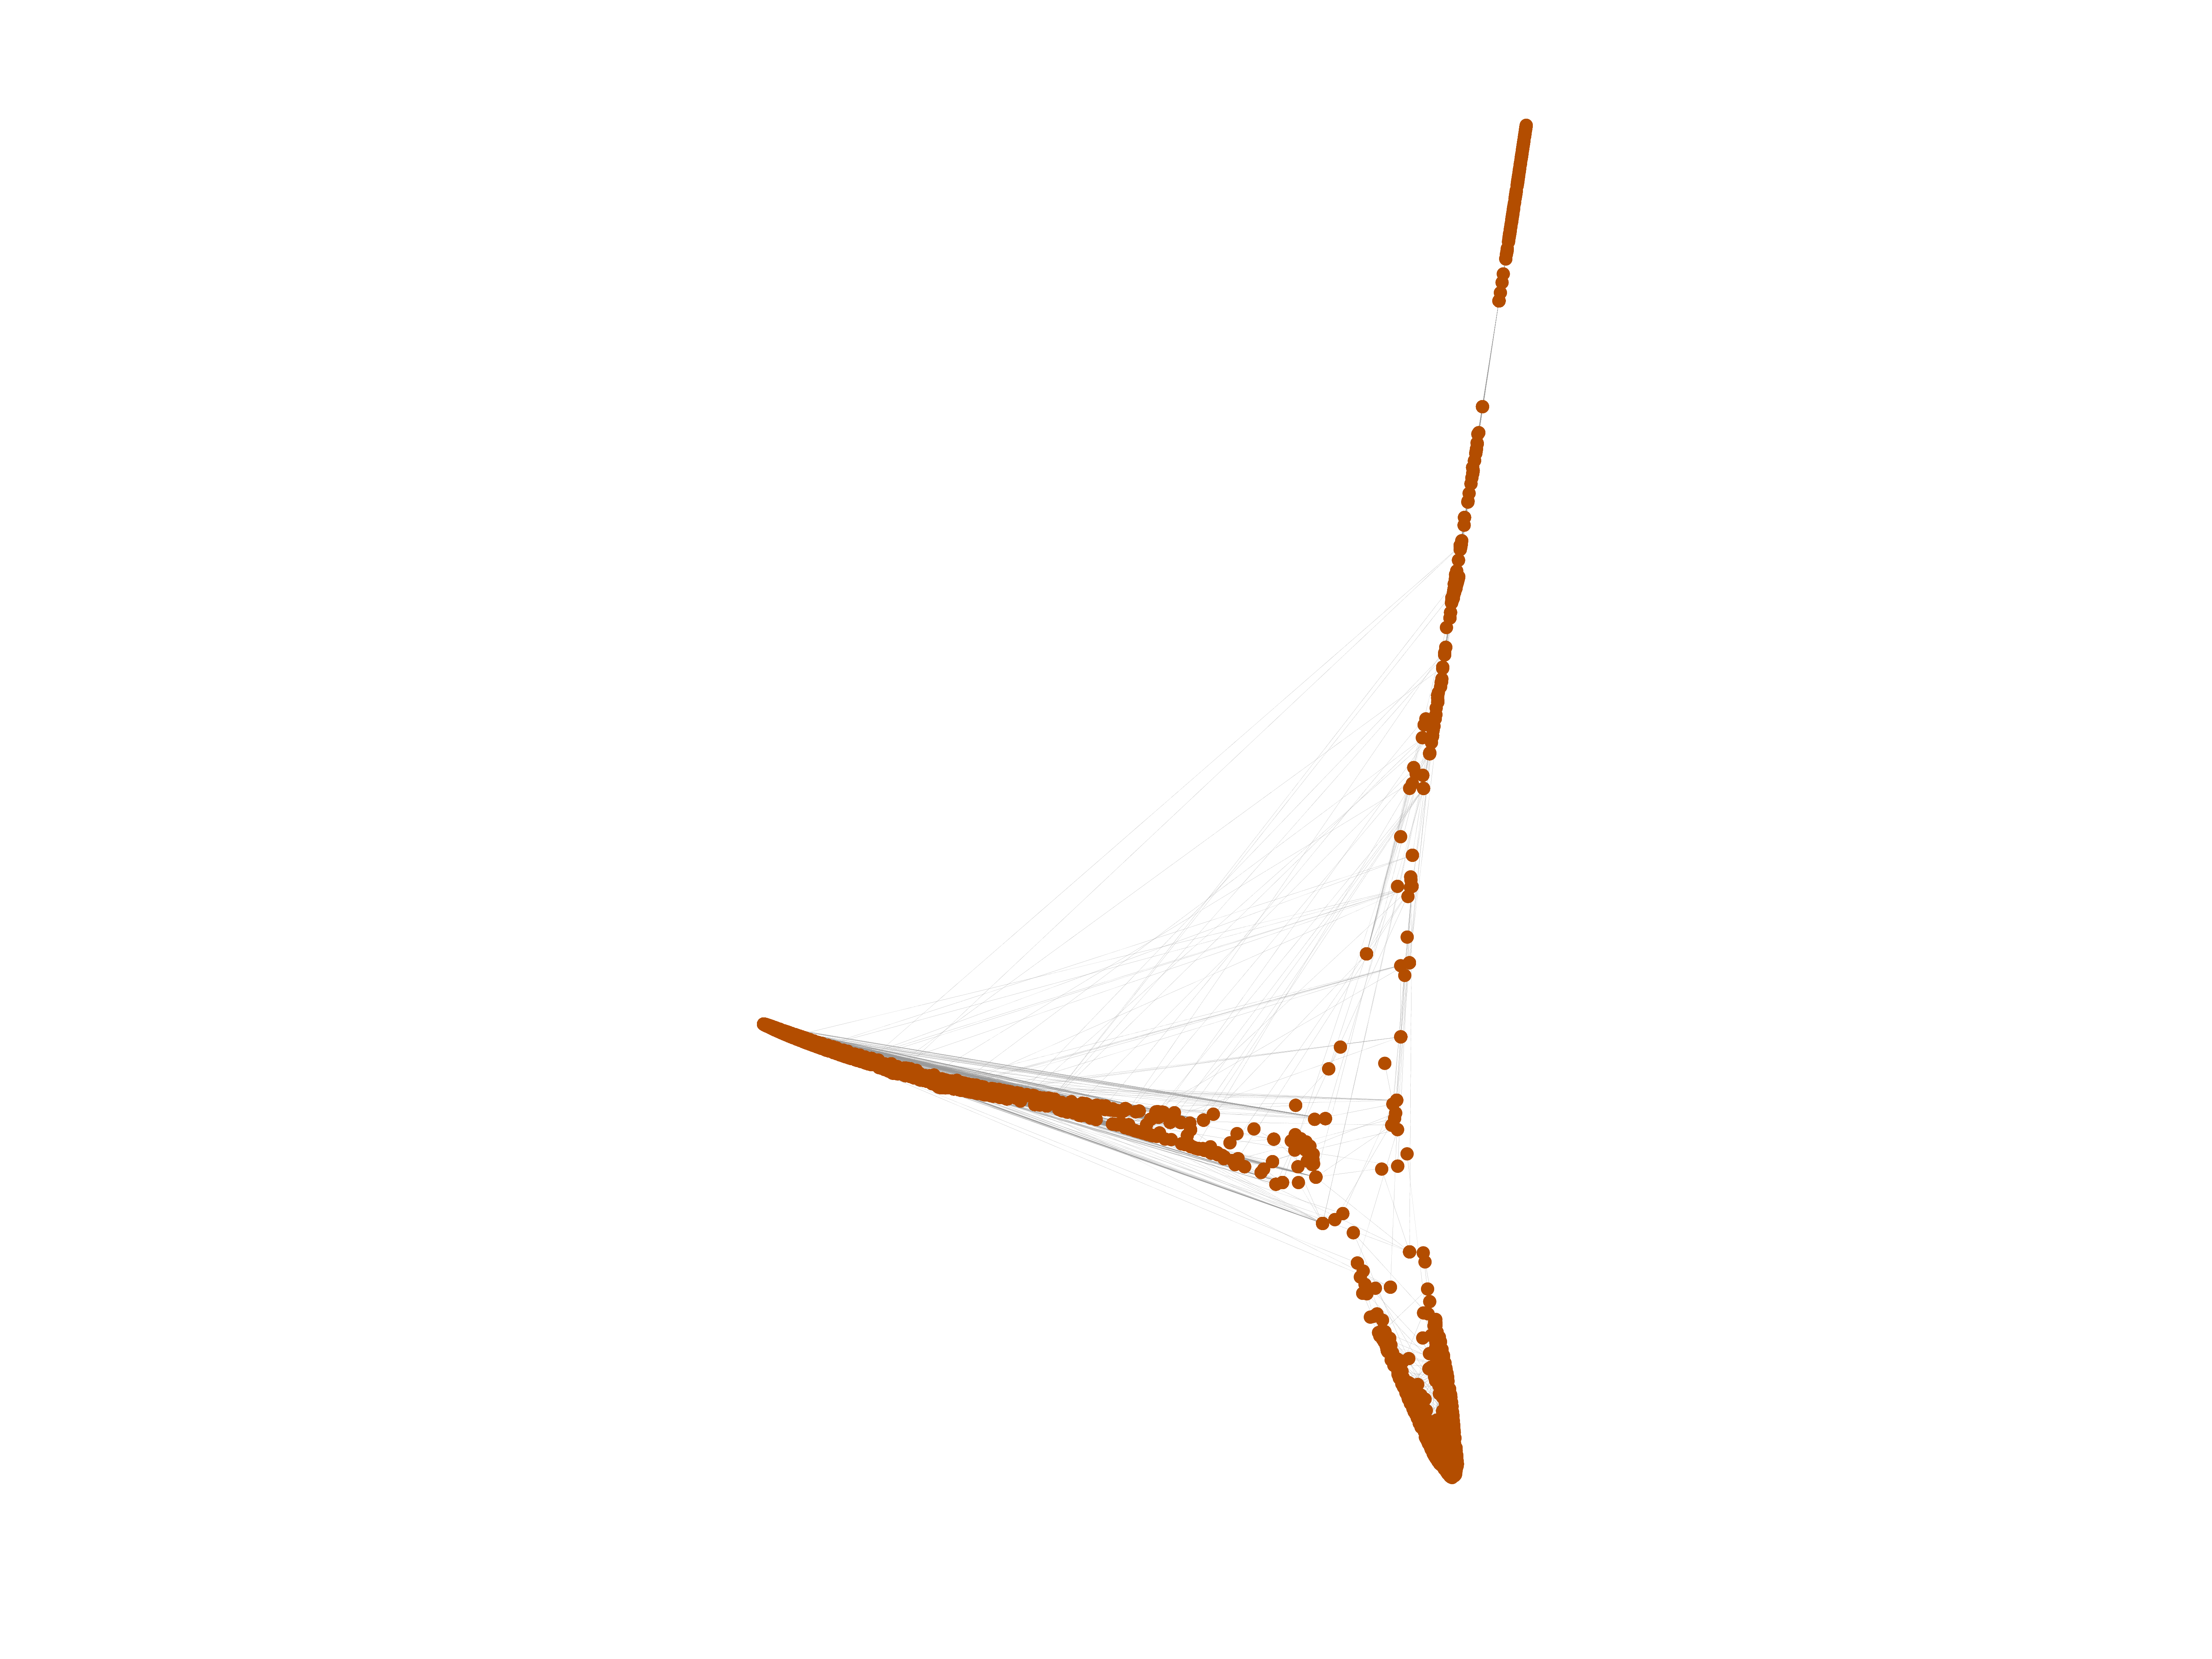
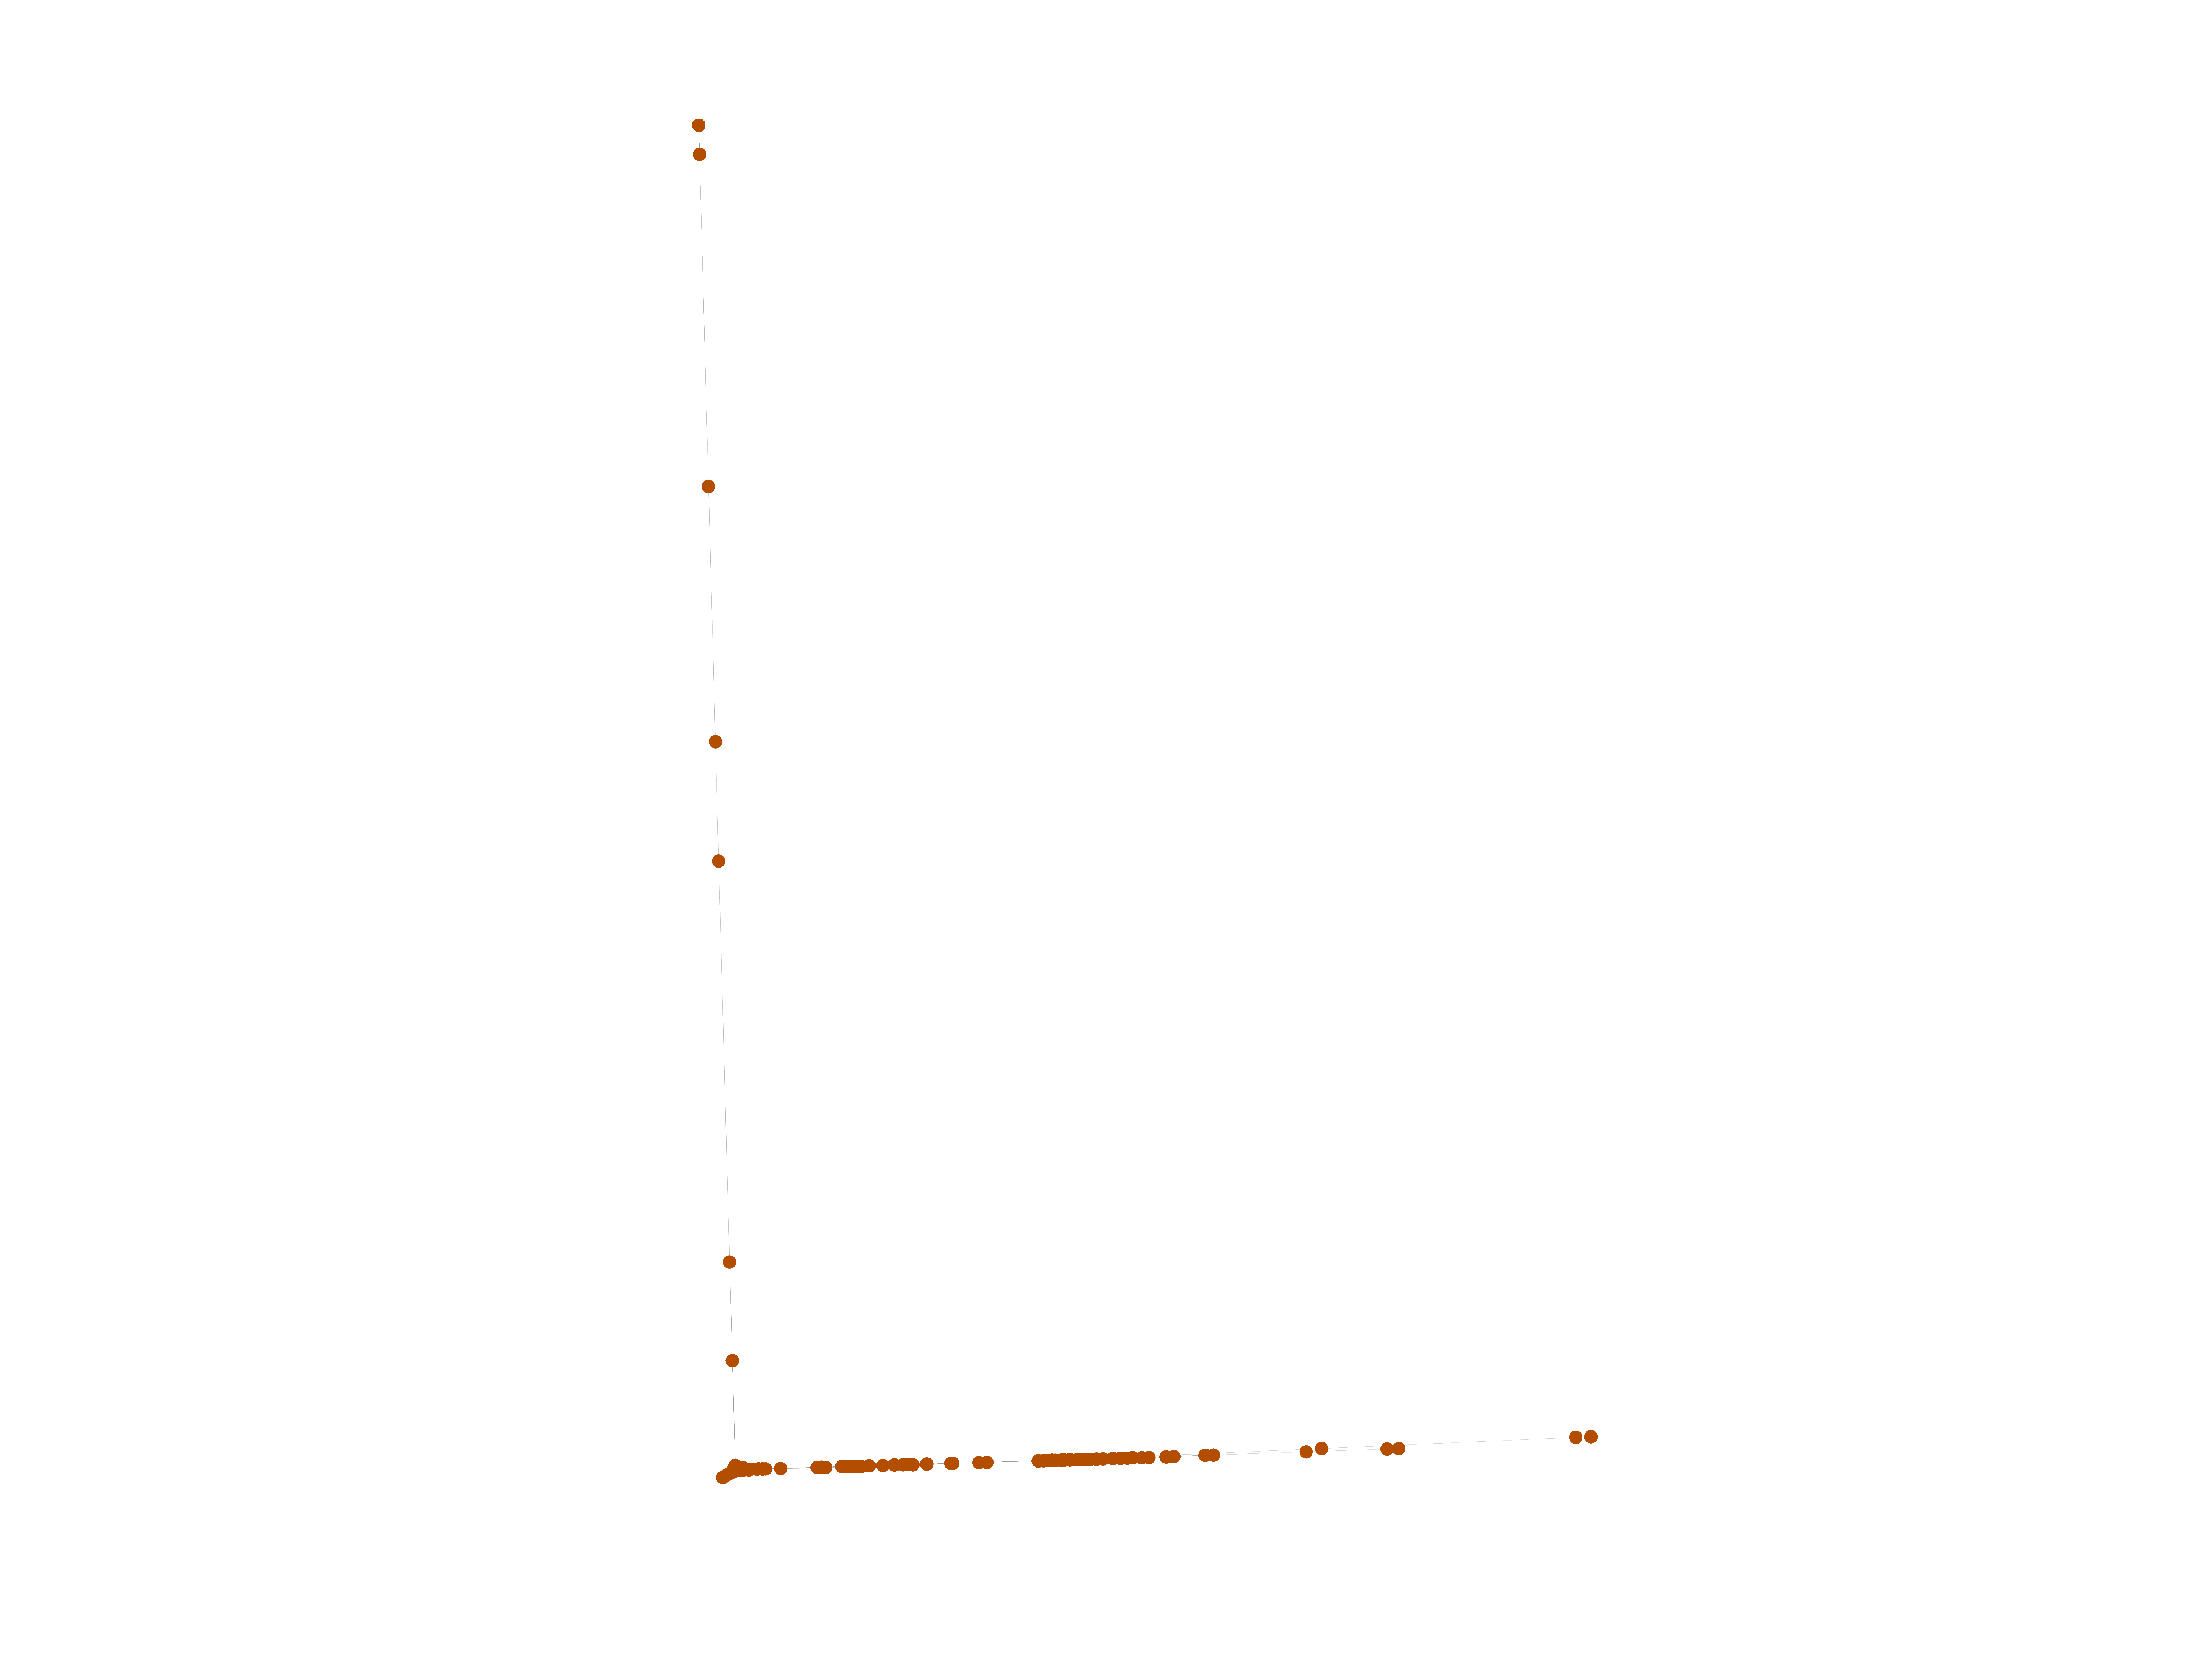
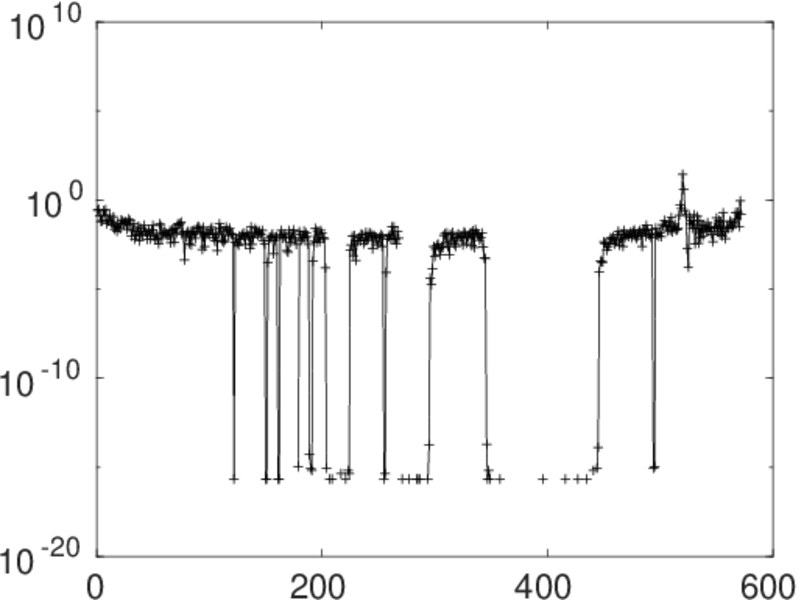
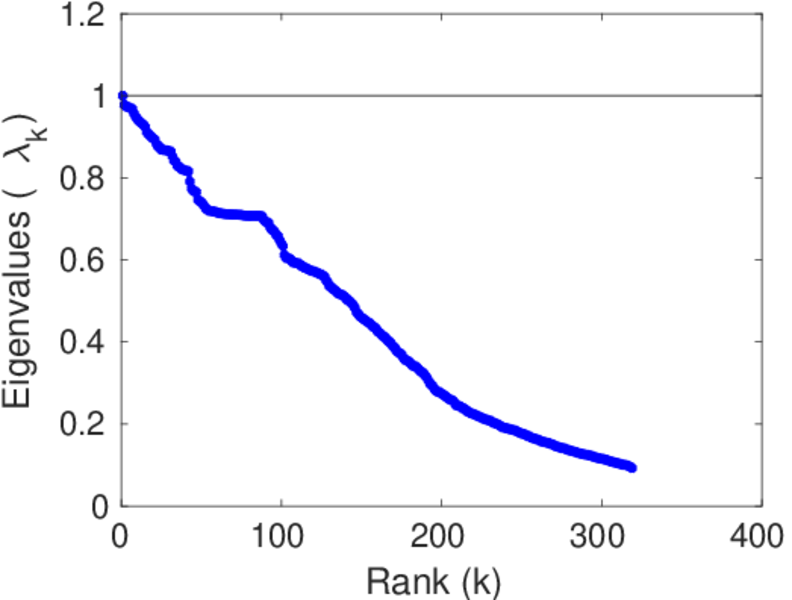
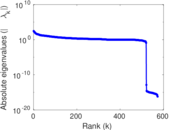
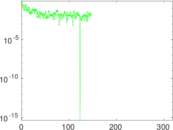
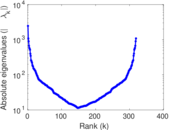
Matrix decompositions plots


Downloads
References
|
[1]
|
Jérôme Kunegis.
KONECT – The Koblenz Network Collection.
In Proc. Int. Conf. on World Wide Web Companion, pages
1343–1350, 2013.
[ http ]
|
|
[2]
|
Wikimedia Foundation.
Wikimedia downloads.
http://dumps.wikimedia.org/, January 2010.
|
 KONECT ‣ Networks ‣
Buy Me a Coffee
KONECT ‣ Networks ‣
Buy Me a Coffee