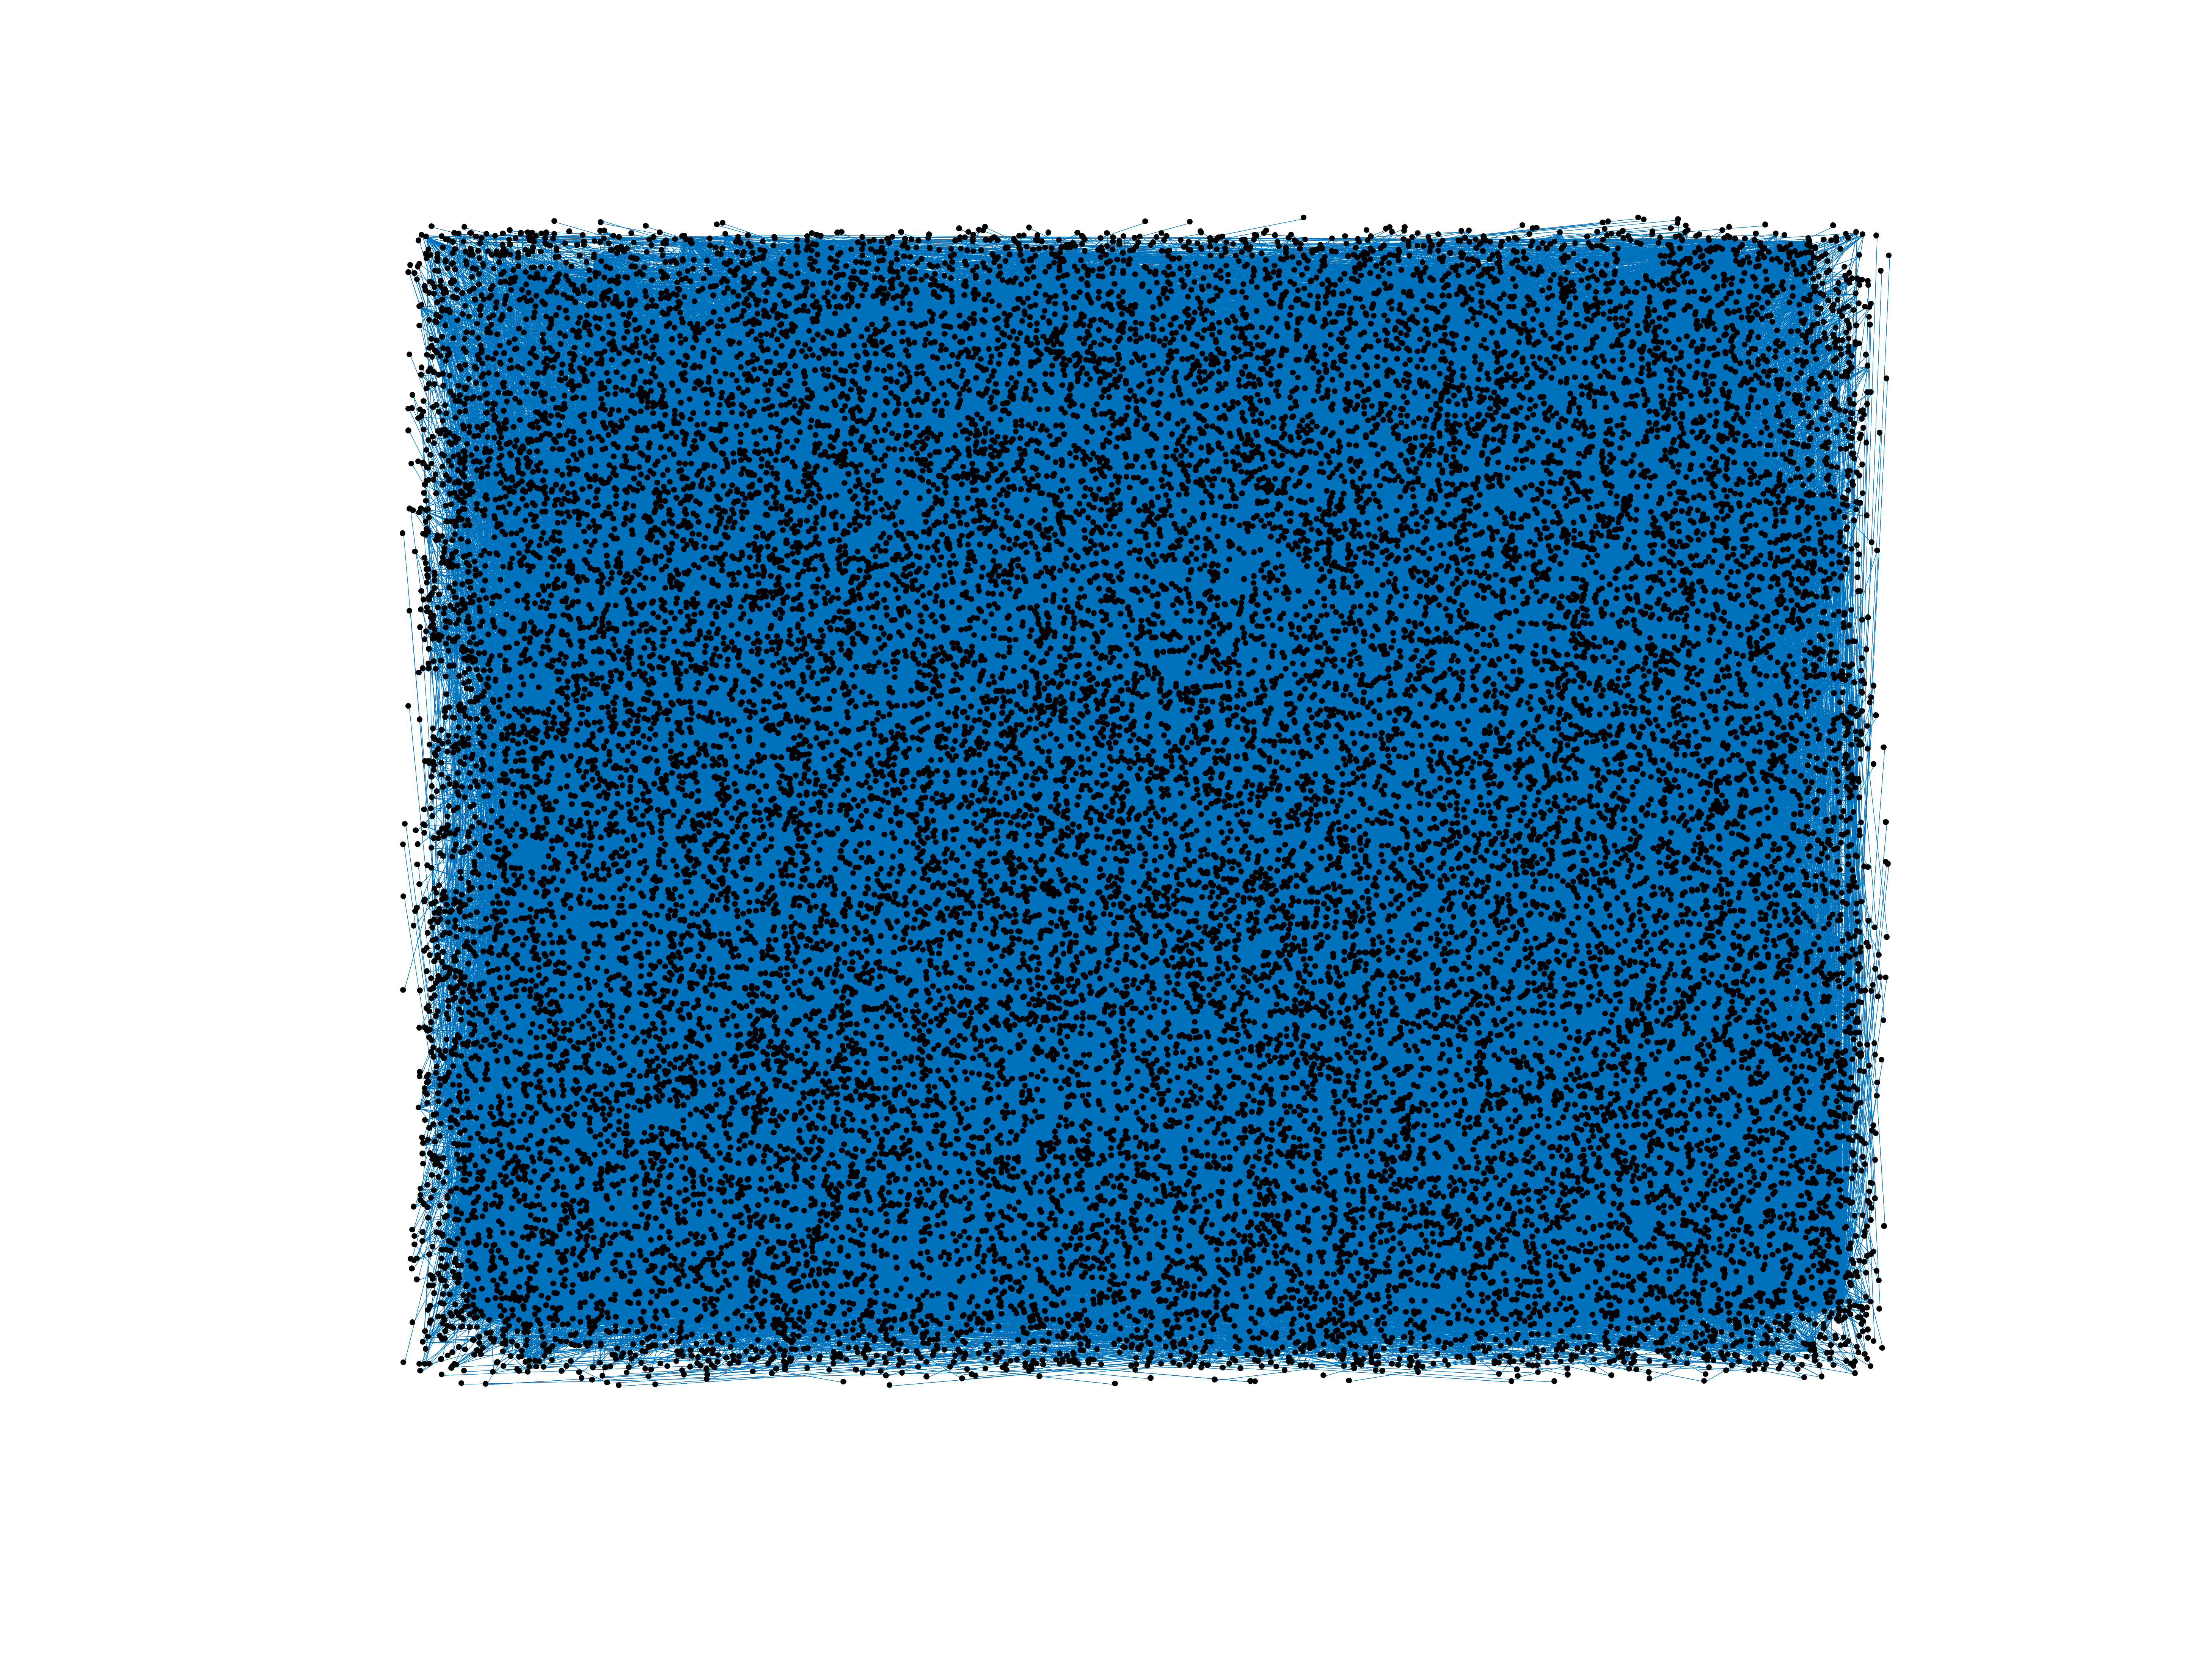
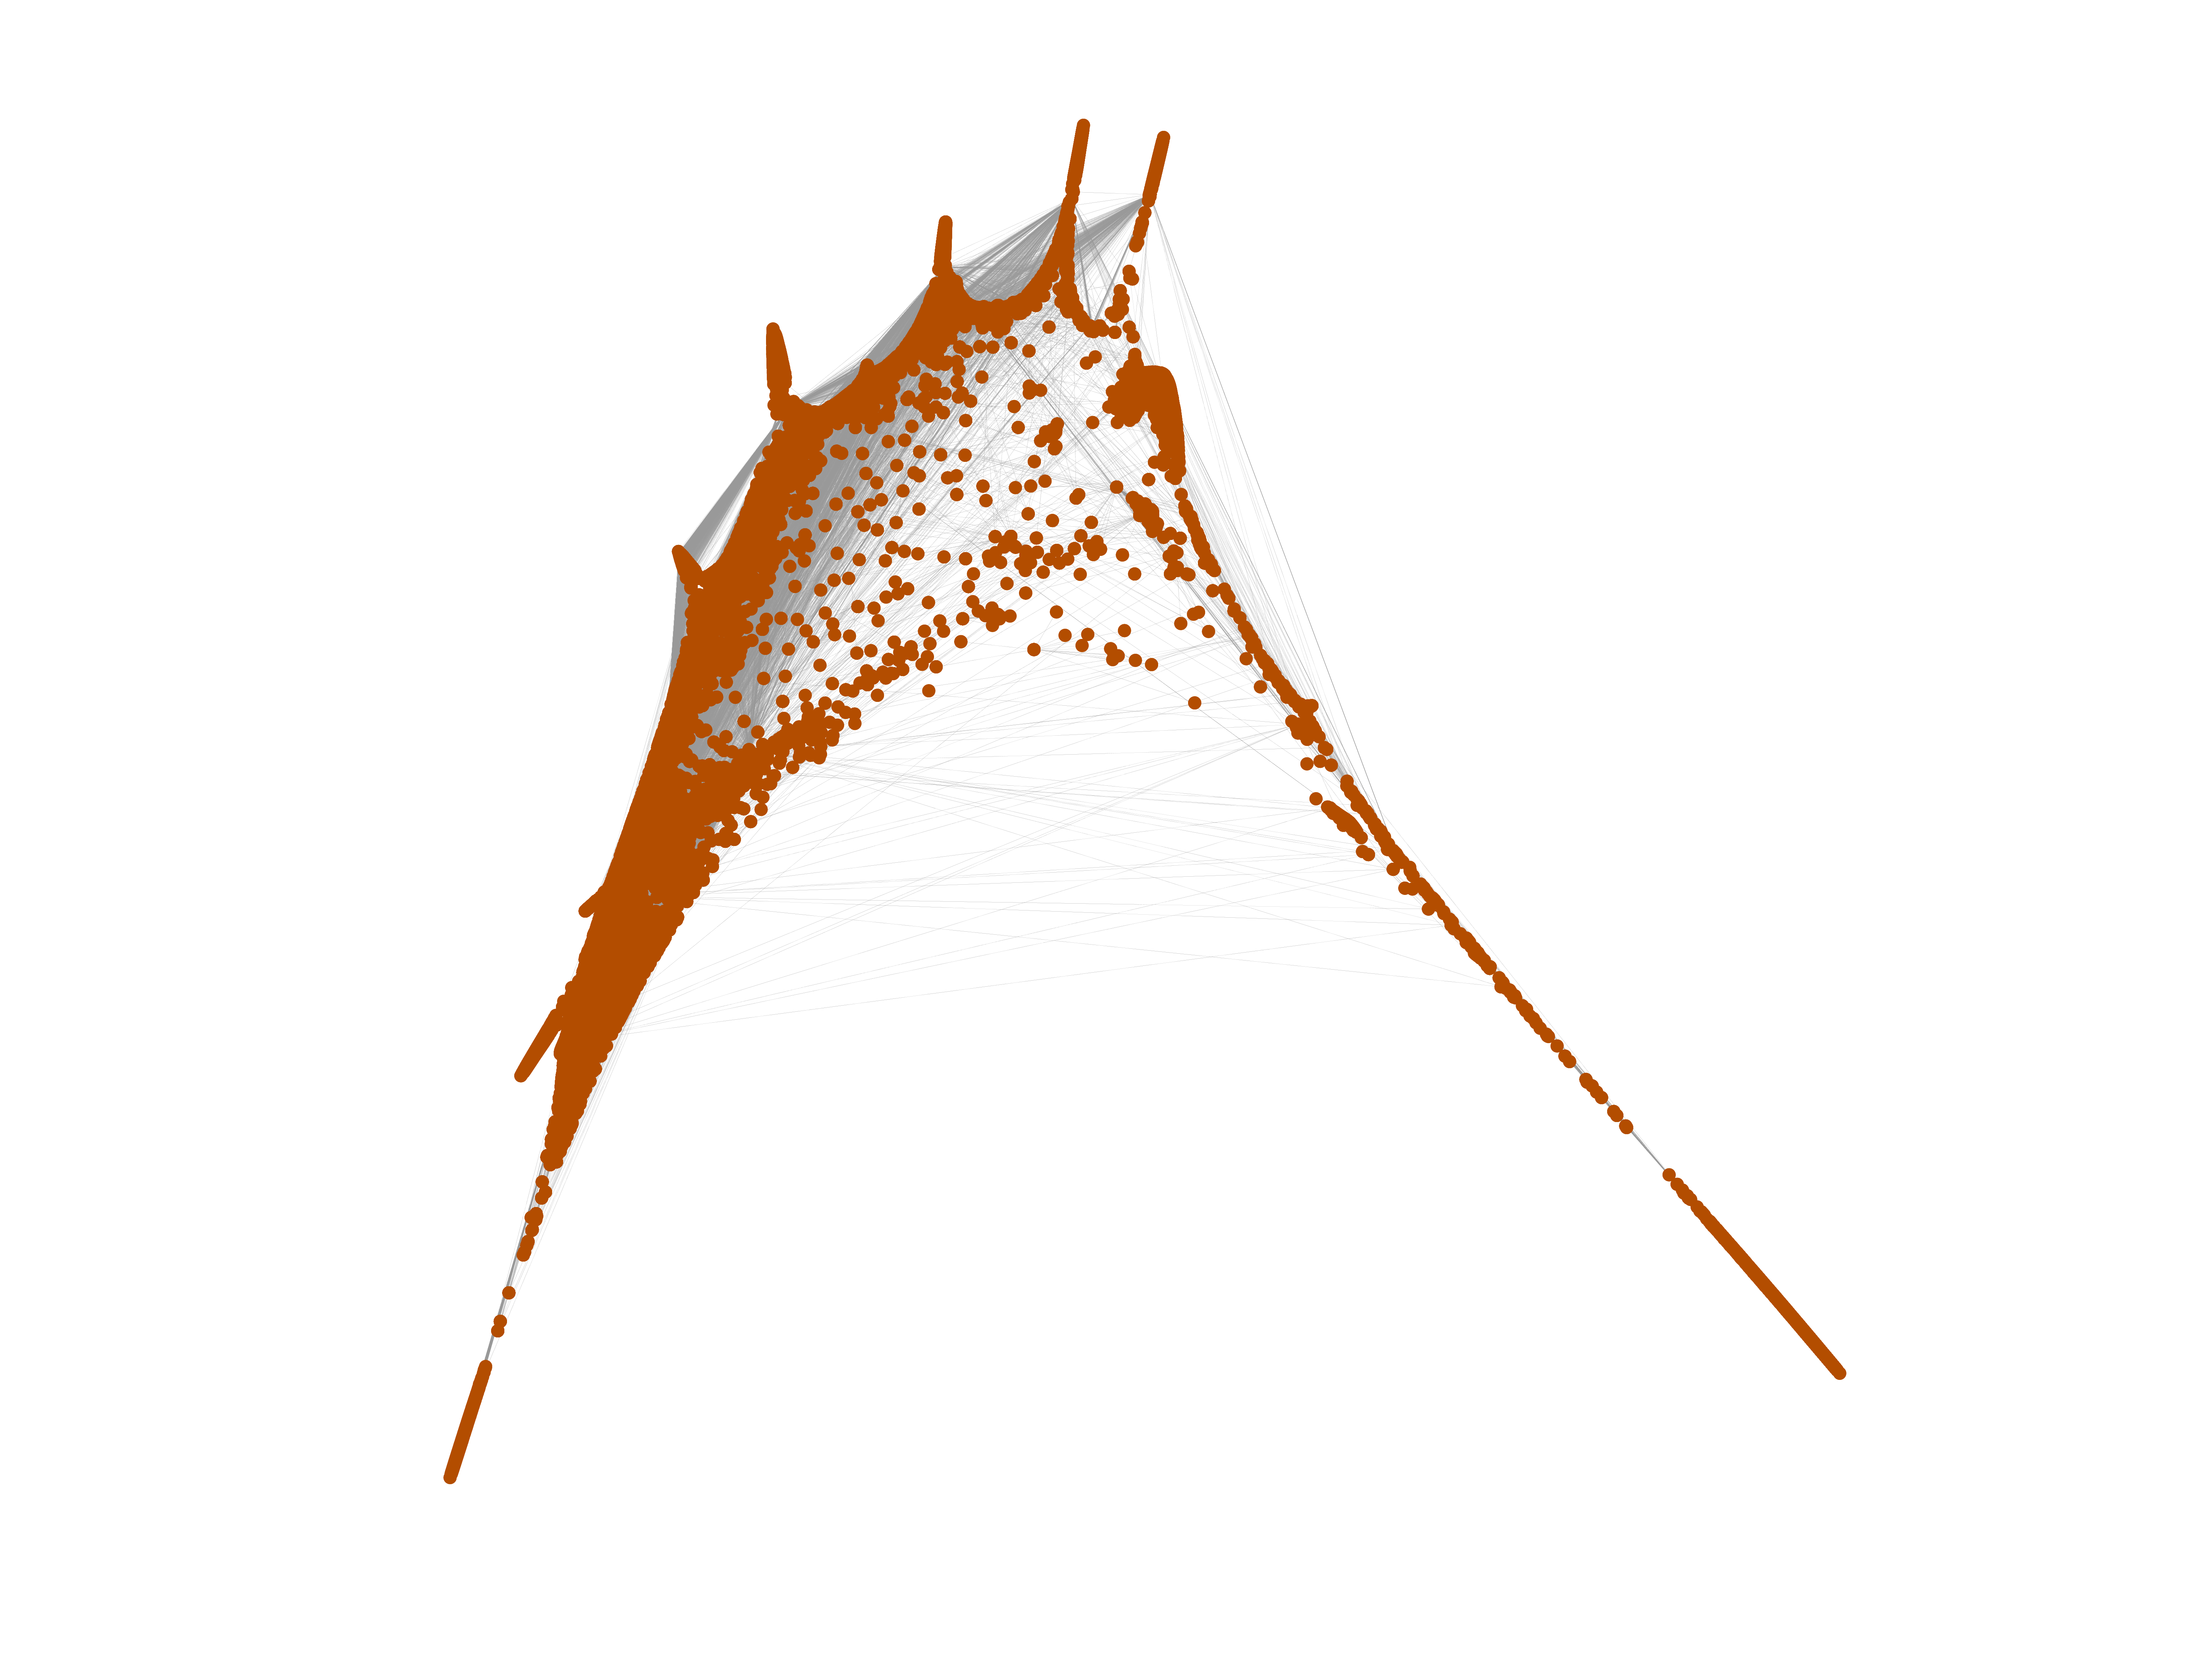
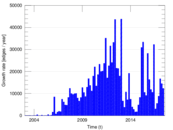
Wikipedia edits (ps)
This is the bipartite edit network of the Pashto Wikipedia. It contains users
and pages from the Pashto Wikipedia, connected by edit events. Each edge
represents an edit. The dataset includes the timestamp of each edit.
Metadata
Statistics
| Size | n = | 26,094
|
| Left size | n1 = | 1,493
|
| Right size | n2 = | 24,601
|
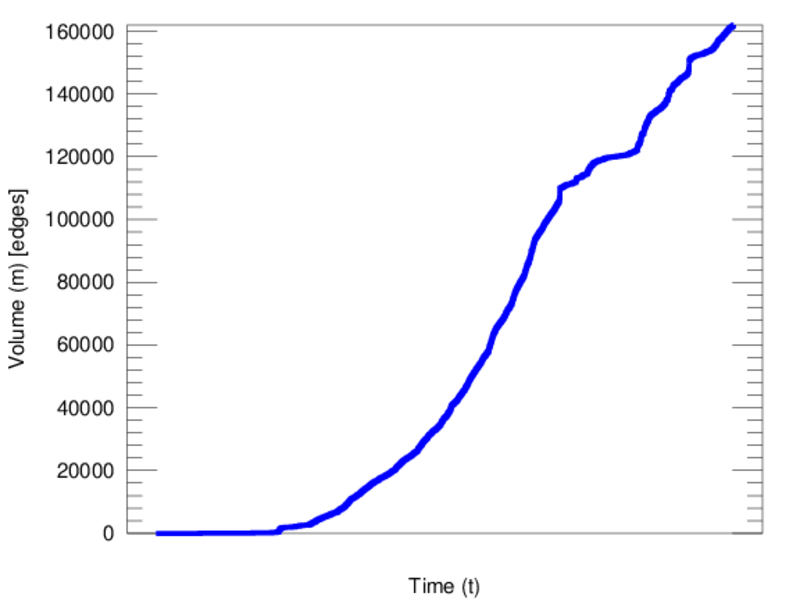
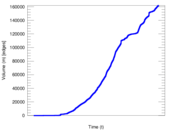
| Volume | m = | 161,969
|
| Unique edge count | m̿ = | 72,557
|
| Wedge count | s = | 95,151,212
|
| Claw count | z = | 162,148,792,147
|
| Cross count | x = | 261,800,046,392,674
|
| Square count | q = | 70,164,462
|
| 4-Tour count | T4 = | 942,124,454
|
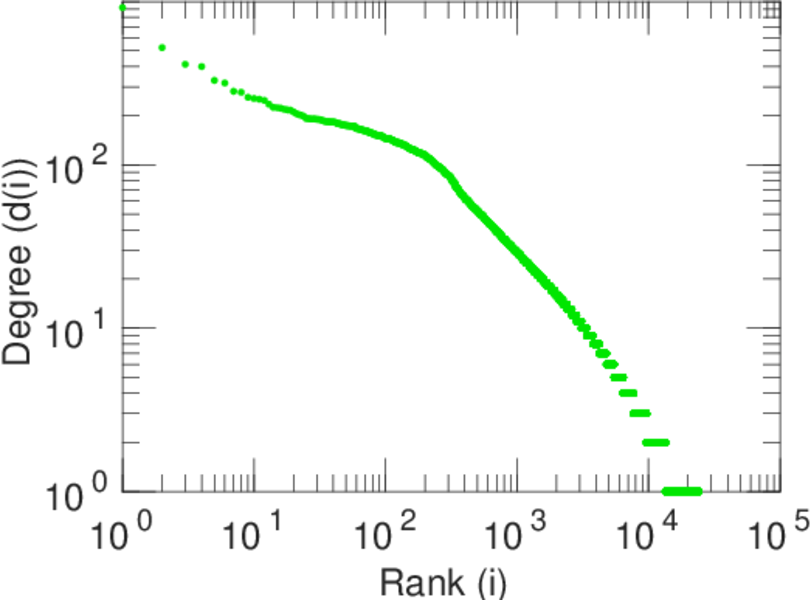
| Maximum degree | dmax = | 23,272
|
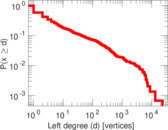
| Maximum left degree | d1max = | 23,272
|
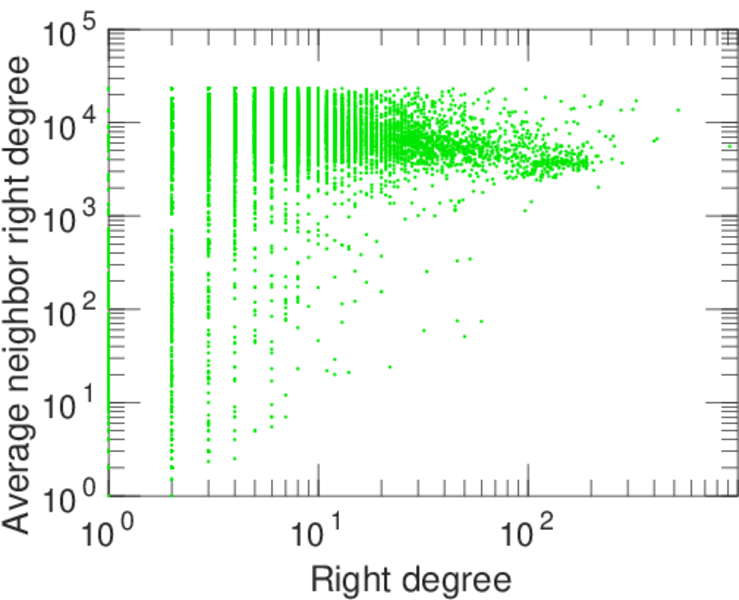
| Maximum right degree | d2max = | 918
|
| Average degree | d = | 12.414 3
|
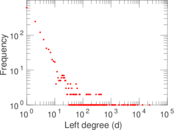
| Average left degree | d1 = | 108.486
|
| Average right degree | d2 = | 6.583 84
|
| Fill | p = | 0.001 975 45
|
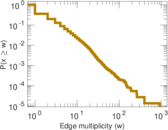
| Average edge multiplicity | m̃ = | 2.232 30
|
| Size of LCC | N = | 24,601
|
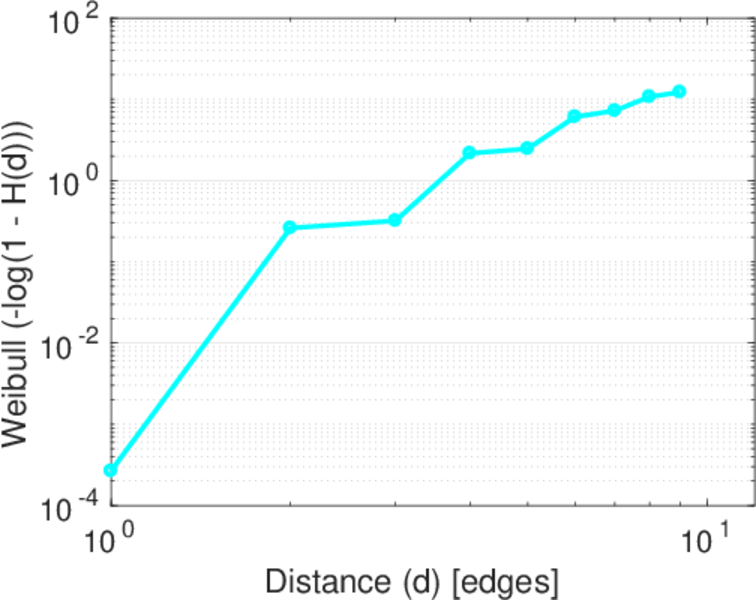
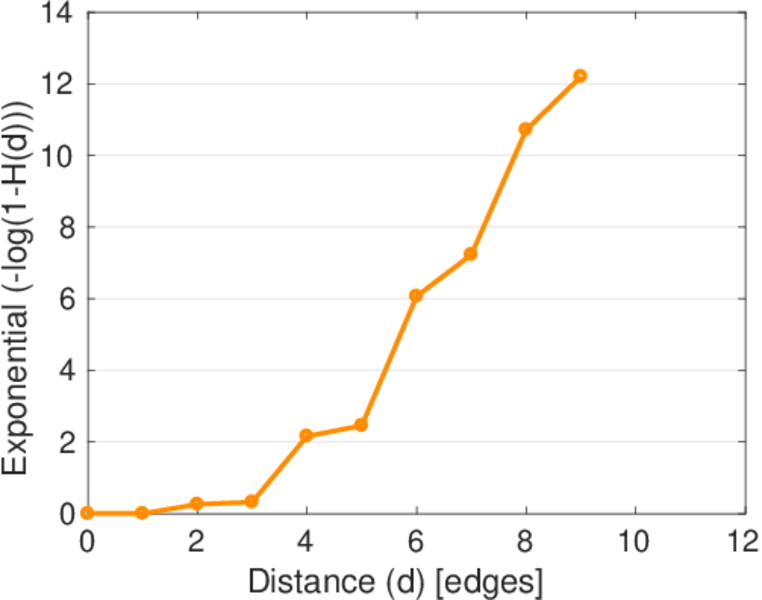
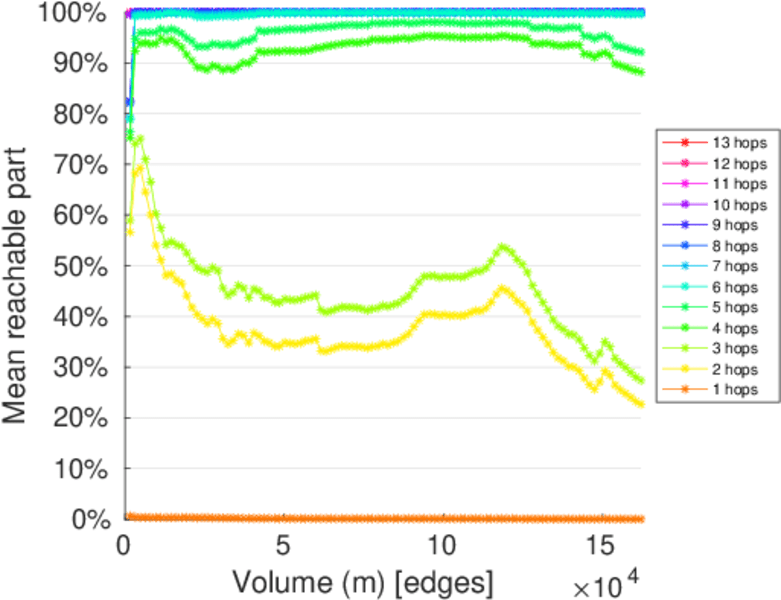
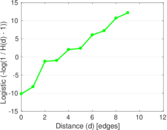
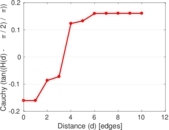
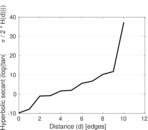
| Diameter | δ = | 12
|
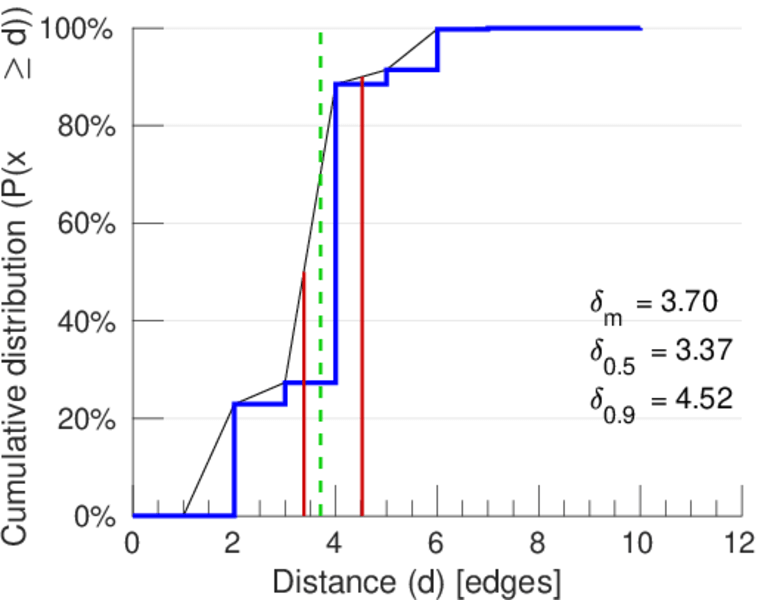
| 50-Percentile effective diameter | δ0.5 = | 3.370 67
|
| 90-Percentile effective diameter | δ0.9 = | 4.518 24
|
| Median distance | δM = | 4
|
| Mean distance | δm = | 3.701 56
|
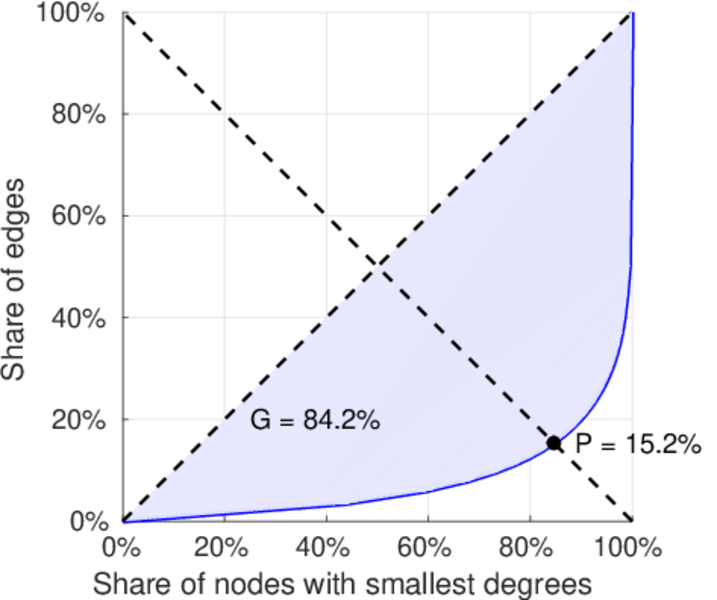
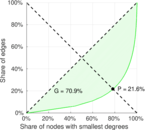
| Gini coefficient | G = | 0.845 308
|
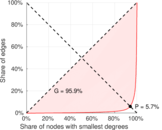
| Balanced inequality ratio | P = | 0.150 010
|
| Left balanced inequality ratio | P1 = | 0.057 412 2
|
| Right balanced inequality ratio | P2 = | 0.216 424
|
| Relative edge distribution entropy | Her = | 0.738 772
|
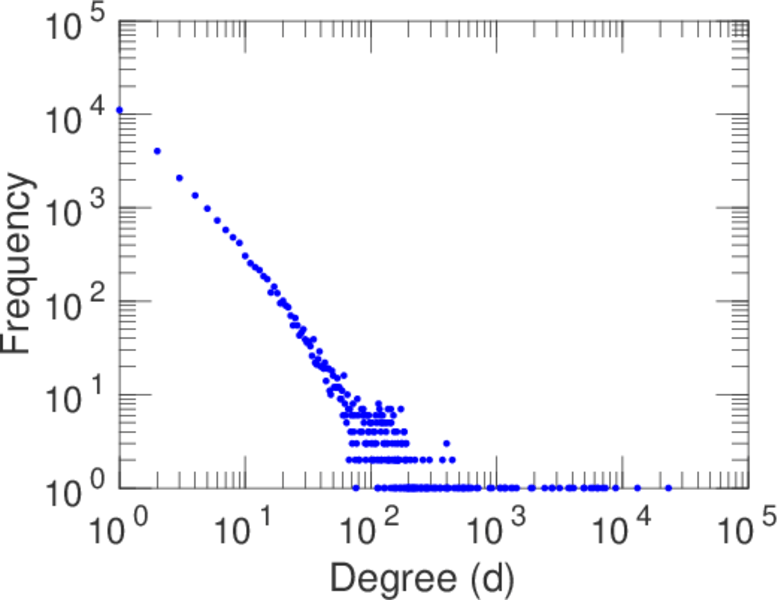
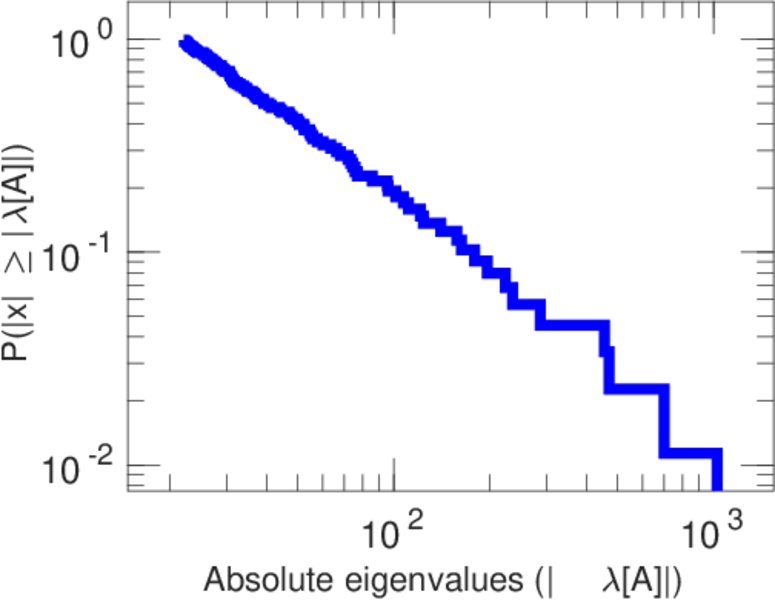
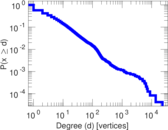
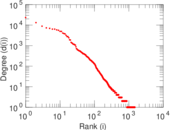
| Power law exponent | γ = | 2.638 34
|
| Tail power law exponent | γt = | 2.121 00
|
| Tail power law exponent with p | γ3 = | 2.121 00
|
| p-value | p = | 0.000 00
|
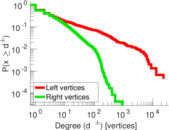
| Left tail power law exponent with p | γ3,1 = | 1.691 00
|
| Left p-value | p1 = | 0.000 00
|
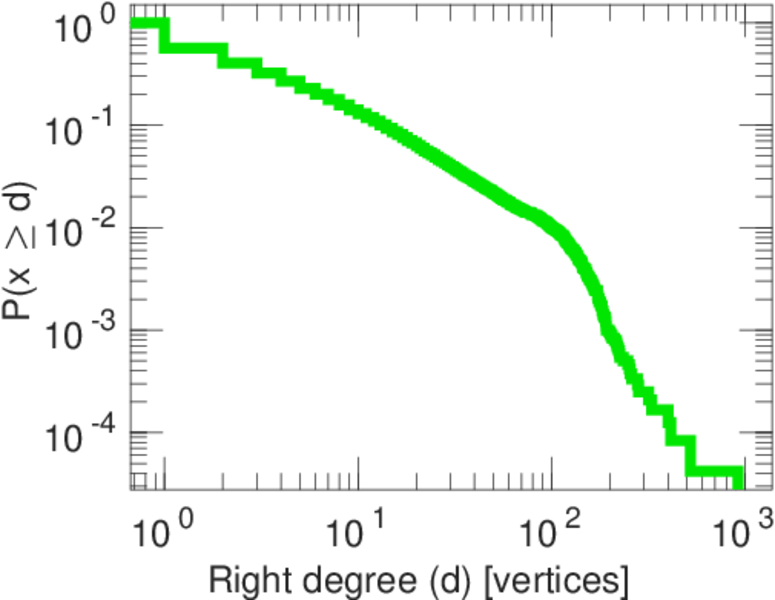
| Right tail power law exponent with p | γ3,2 = | 2.191 00
|
| Right p-value | p2 = | 0.000 00
|
| Degree assortativity | ρ = | −0.361 223
|
| Degree assortativity p-value | pρ = | 0.000 00
|
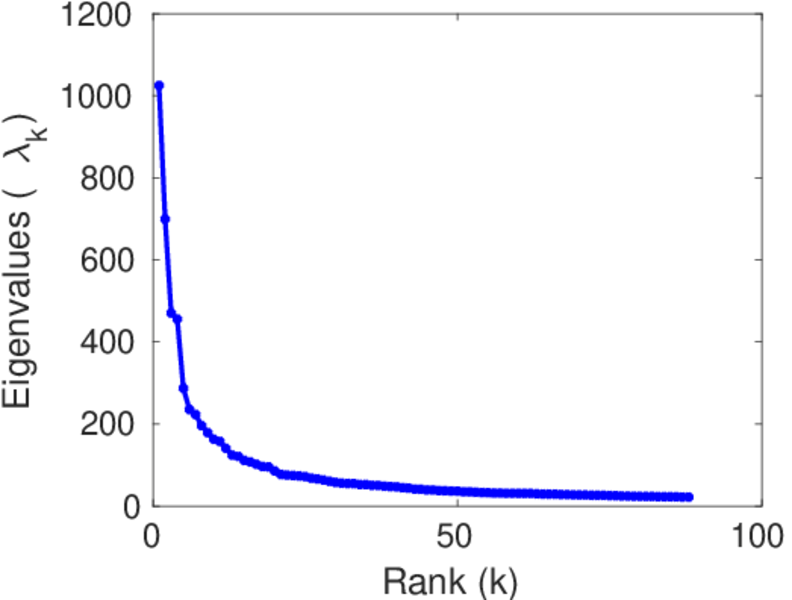
| Spectral norm | α = | 1,024.68
|
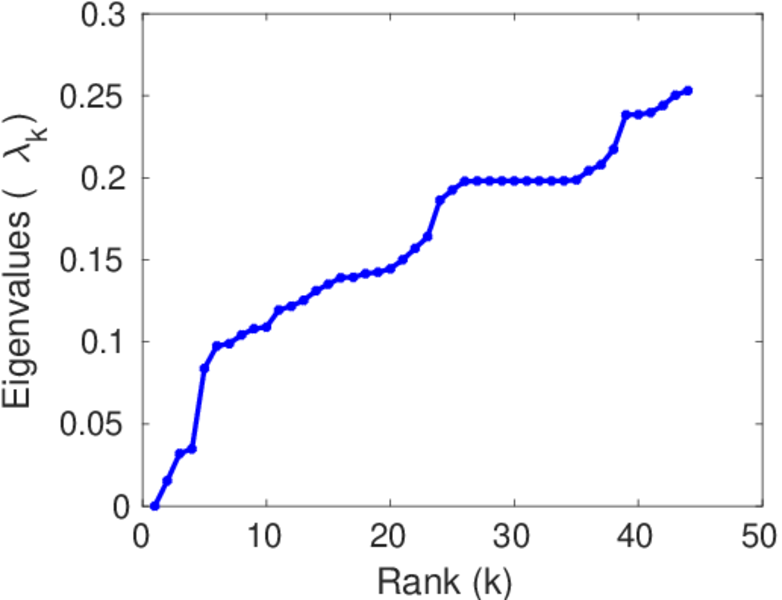
| Algebraic connectivity | a = | 0.015 386 9
|
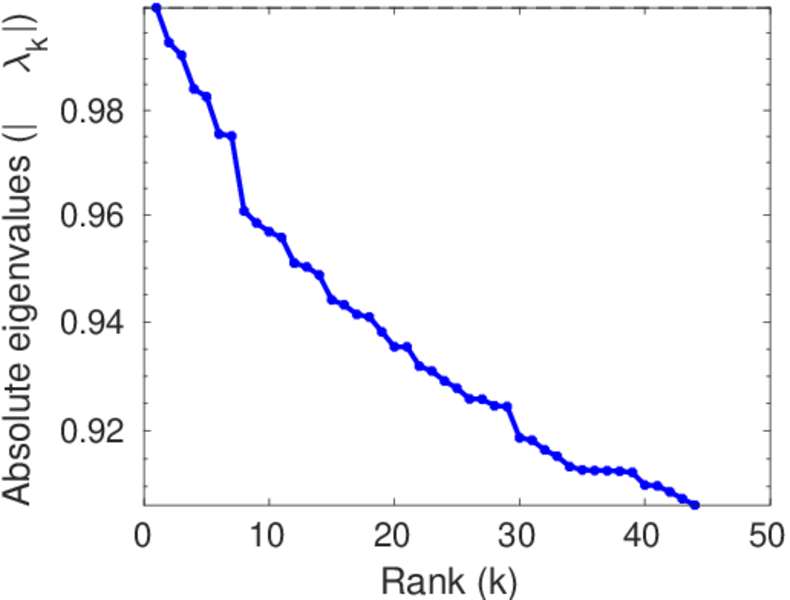
| Spectral separation | |λ1[A] / λ2[A]| = | 1.465 13
|
| Controllability | C = | 22,672
|
| Relative controllability | Cr = | 0.890 705
|
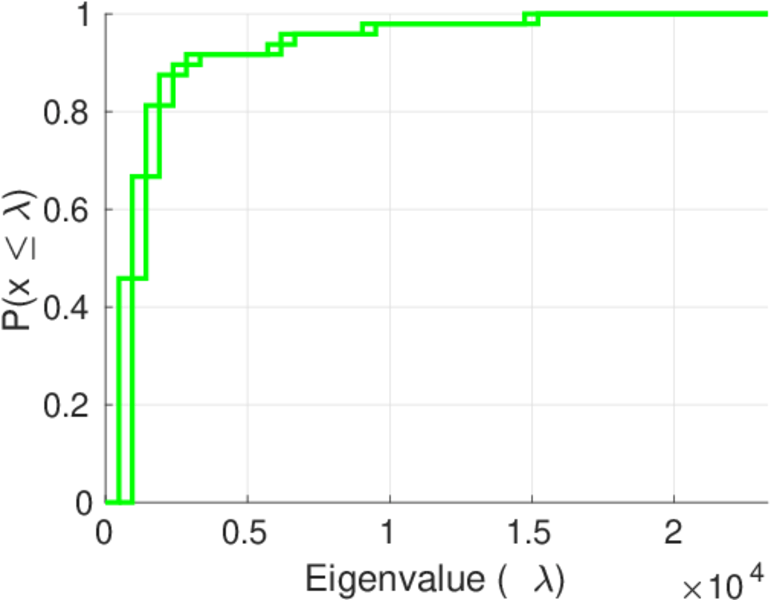
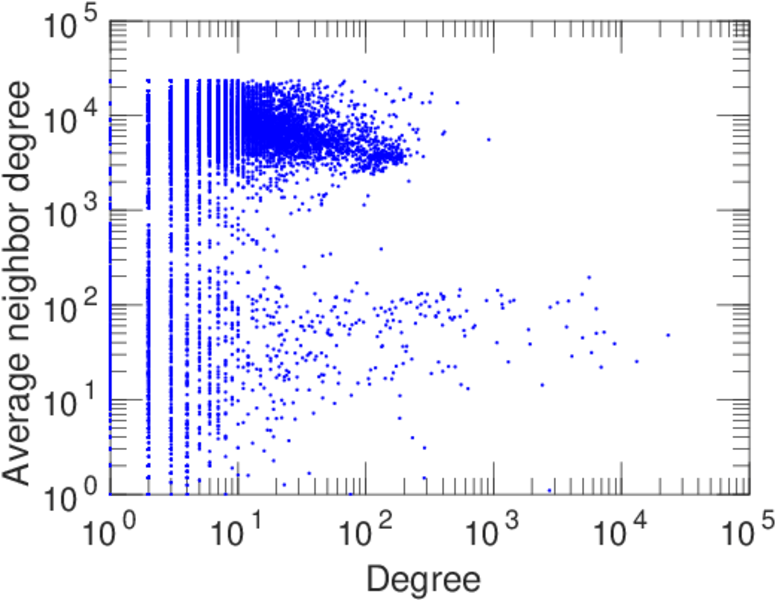
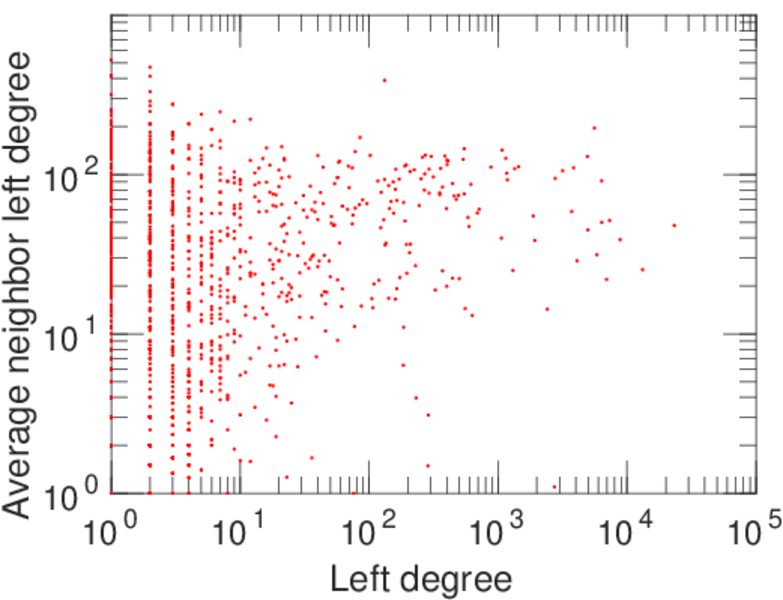
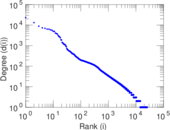
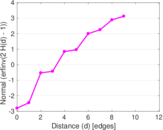
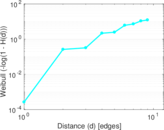
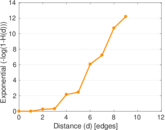
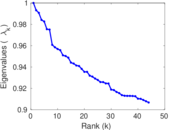
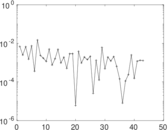
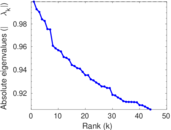
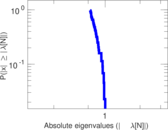
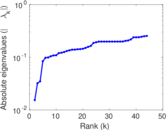
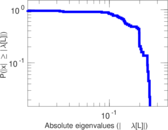
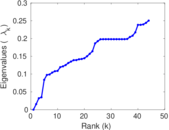
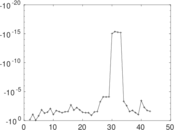
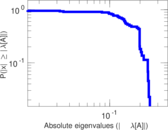
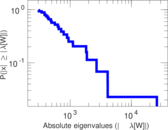
Plots


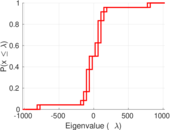
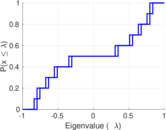


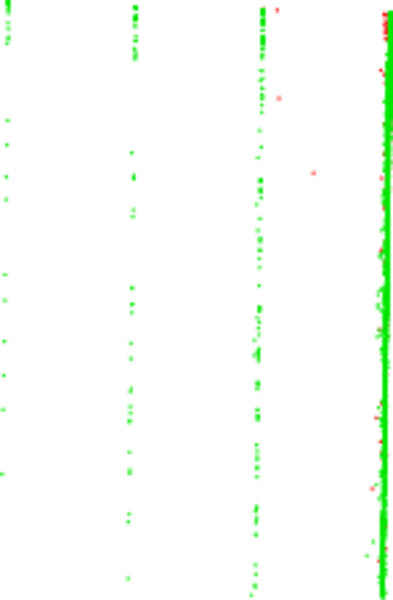
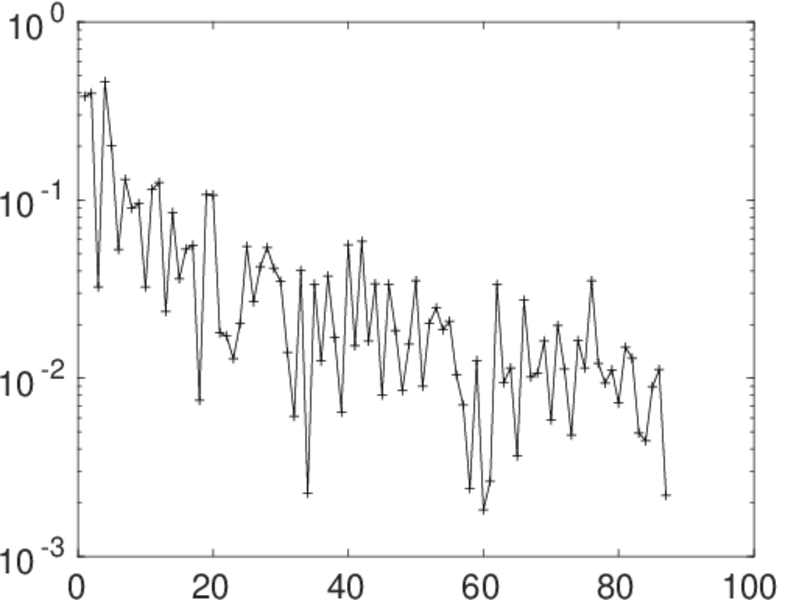
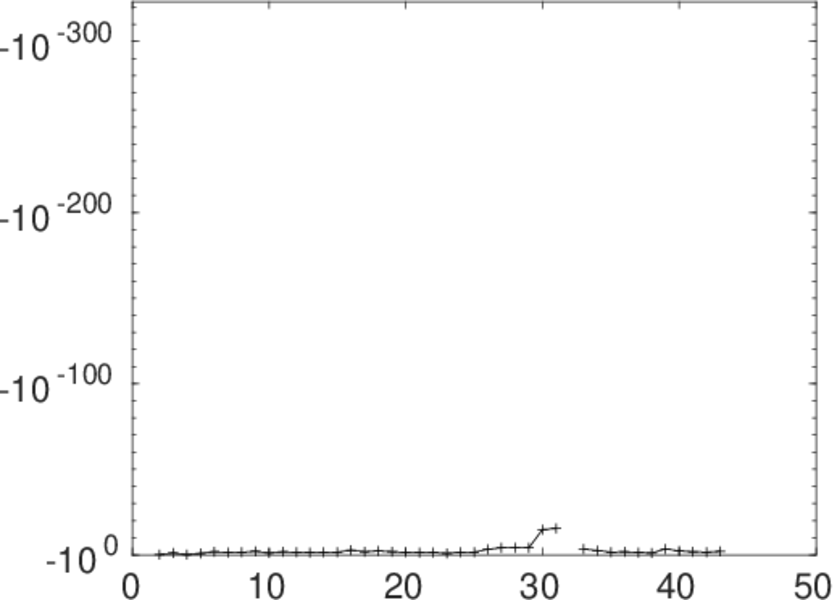
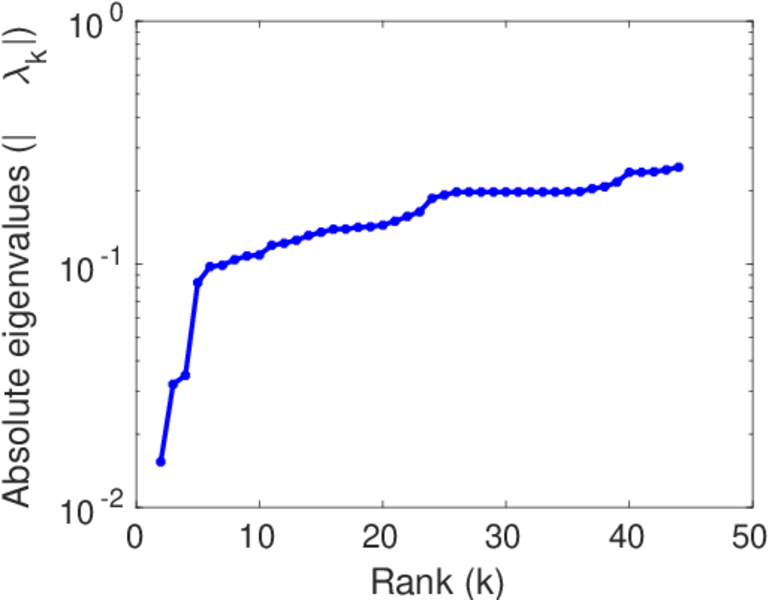
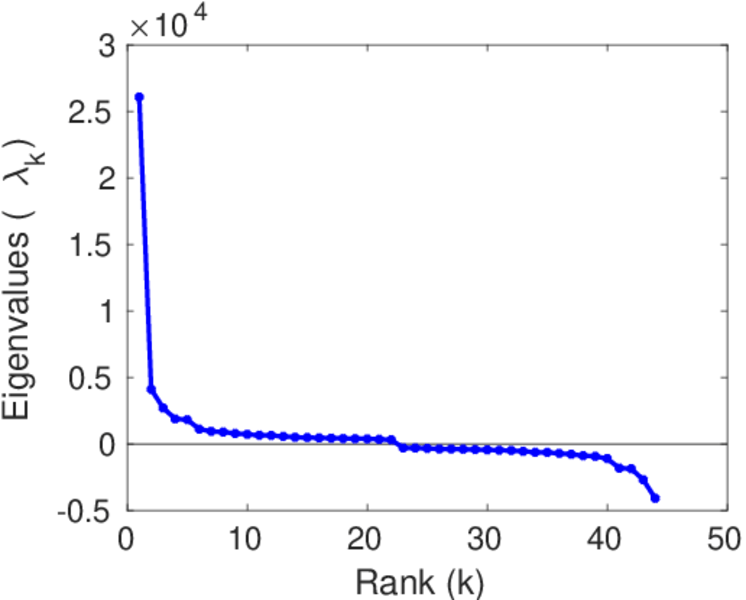
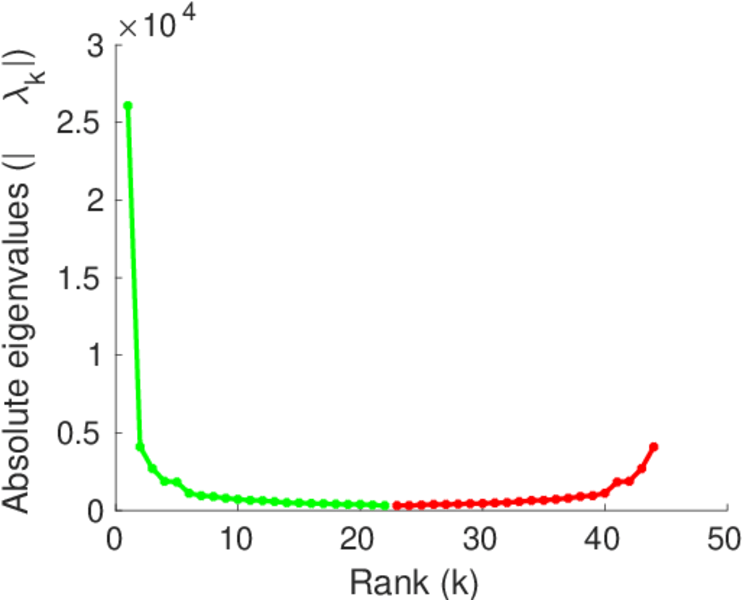
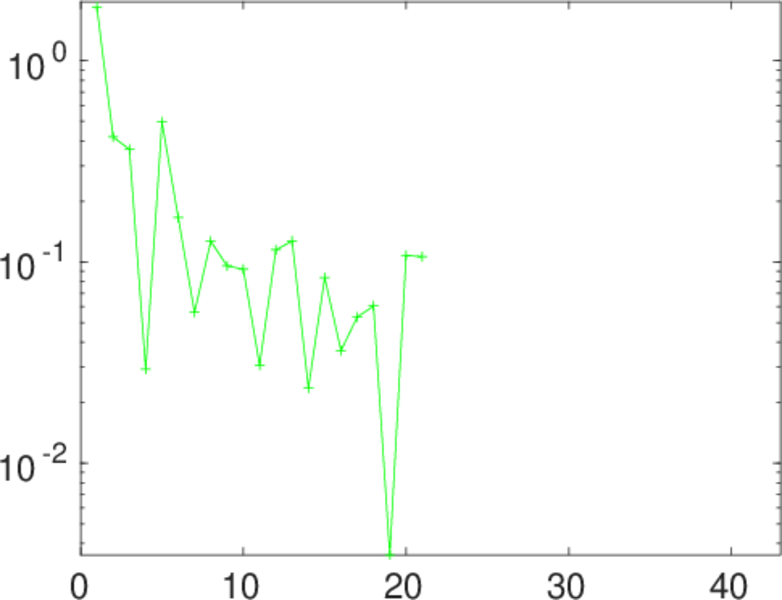
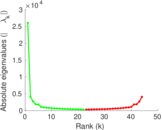
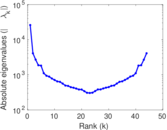
Matrix decompositions plots


Downloads
References
|
[1]
|
Jérôme Kunegis.
KONECT – The Koblenz Network Collection.
In Proc. Int. Conf. on World Wide Web Companion, pages
1343–1350, 2013.
[ http ]
|
|
[2]
|
Wikimedia Foundation.
Wikimedia downloads.
http://dumps.wikimedia.org/, January 2010.
|
 KONECT ‣ Networks ‣
Buy Me a Coffee
KONECT ‣ Networks ‣
Buy Me a Coffee