Wikivoyage edits (pt)
This is the bipartite edit network of the Portuguese Wikivoyage. It contains
users and pages from the Portuguese Wikivoyage, connected by edit events. Each
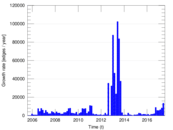
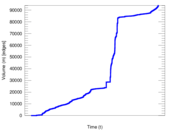
edge represents an edit. The dataset includes the timestamp of each edit.
Metadata
Statistics
| Size | n = | 8,759
|
| Left size | n1 = | 1,501
|
| Right size | n2 = | 7,258
|
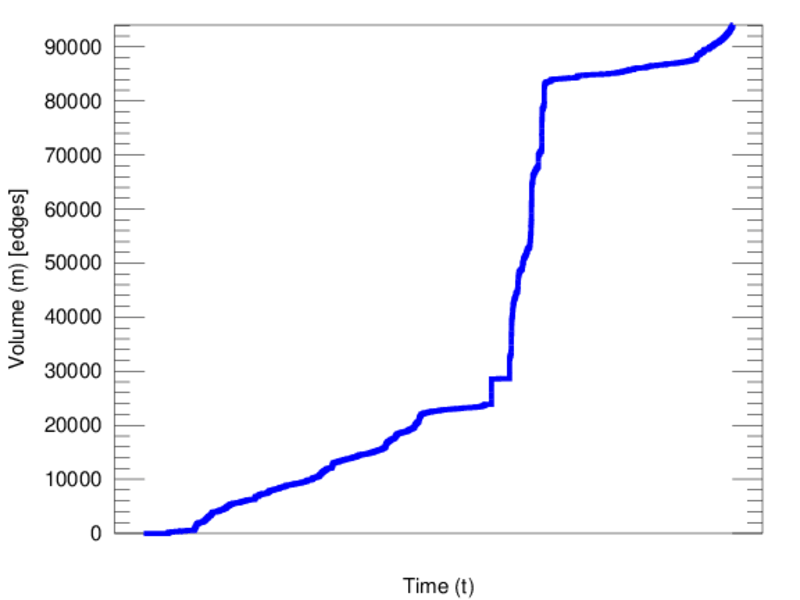
| Volume | m = | 94,059
|
| Unique edge count | m̿ = | 36,801
|
| Wedge count | s = | 44,443,627
|
| Claw count | z = | 57,302,448,864
|
| Cross count | x = | 65,141,887,826,214
|
| Square count | q = | 75,426,527
|
| 4-Tour count | T4 = | 781,342,390
|
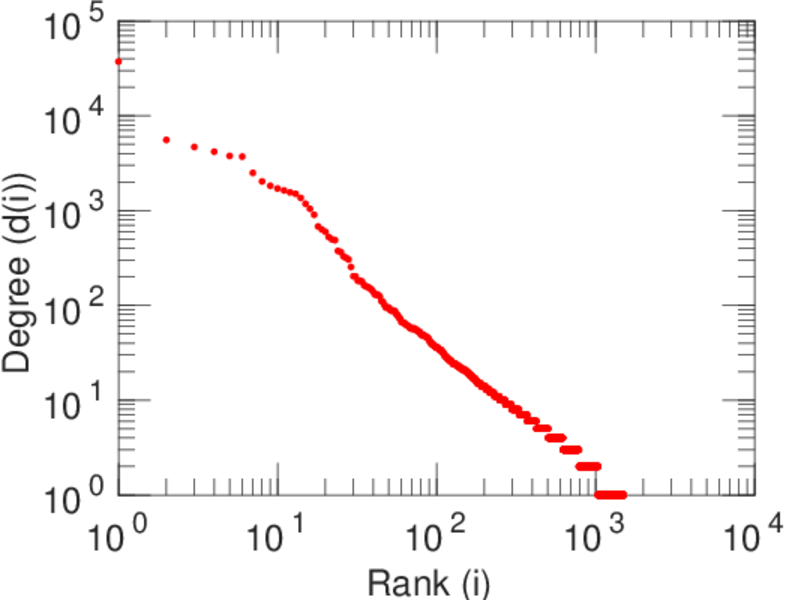
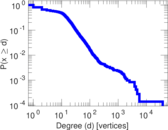
| Maximum degree | dmax = | 37,328
|
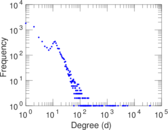
| Maximum left degree | d1max = | 37,328
|
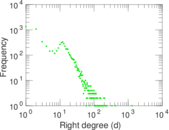
| Maximum right degree | d2max = | 1,304
|
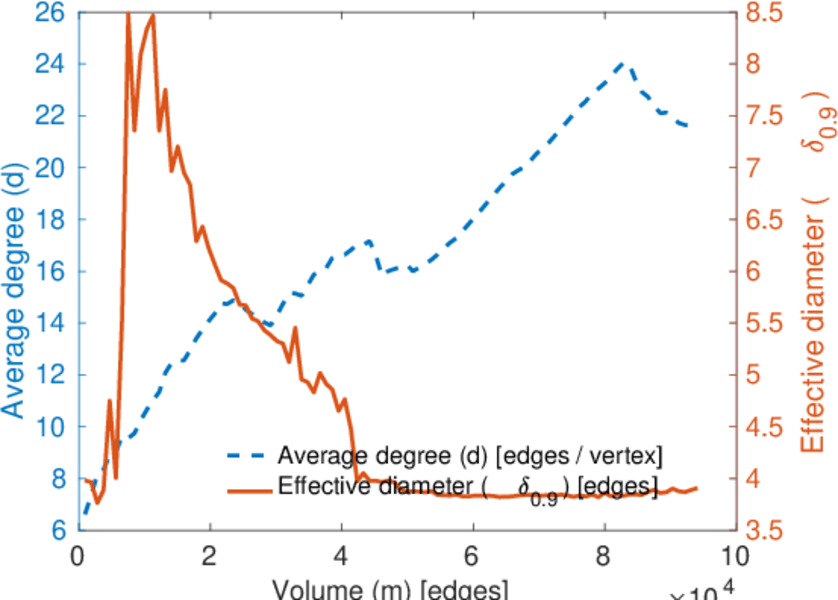
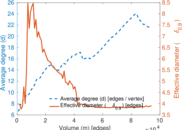
| Average degree | d = | 21.477 1
|
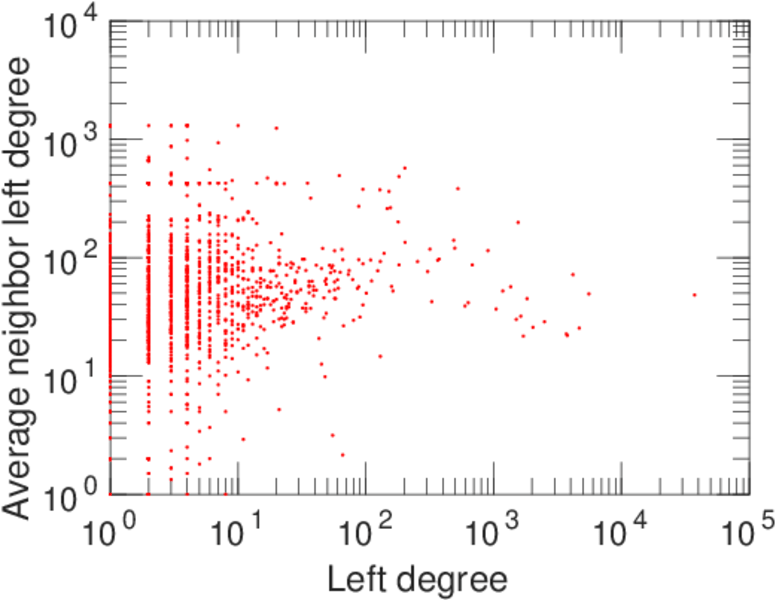
| Average left degree | d1 = | 62.664 2
|
| Average right degree | d2 = | 12.959 4
|
| Fill | p = | 0.003 378 02
|
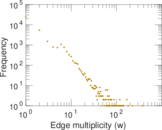
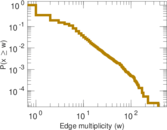
| Average edge multiplicity | m̃ = | 2.555 88
|
| Size of LCC | N = | 8,441
|
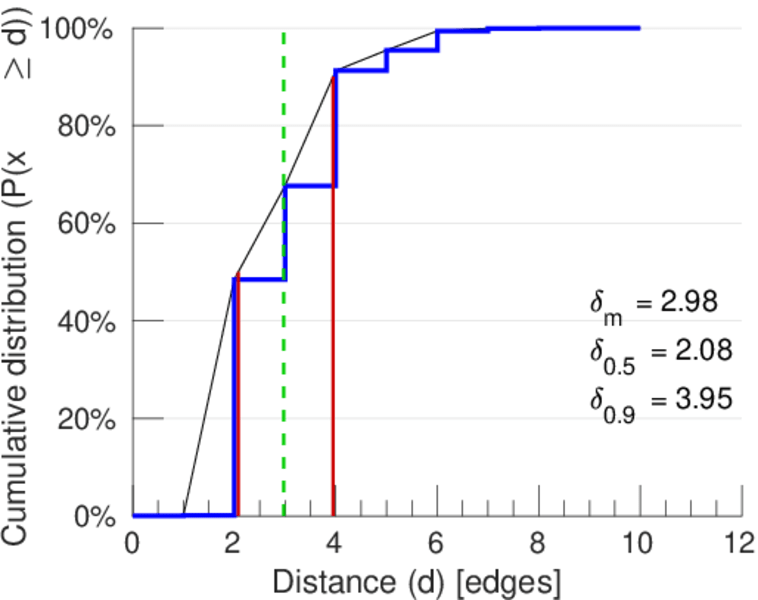
| Diameter | δ = | 10
|
| 50-Percentile effective diameter | δ0.5 = | 2.079 72
|
| 90-Percentile effective diameter | δ0.9 = | 3.947 06
|
| Median distance | δM = | 3
|
| Mean distance | δm = | 2.977 90
|
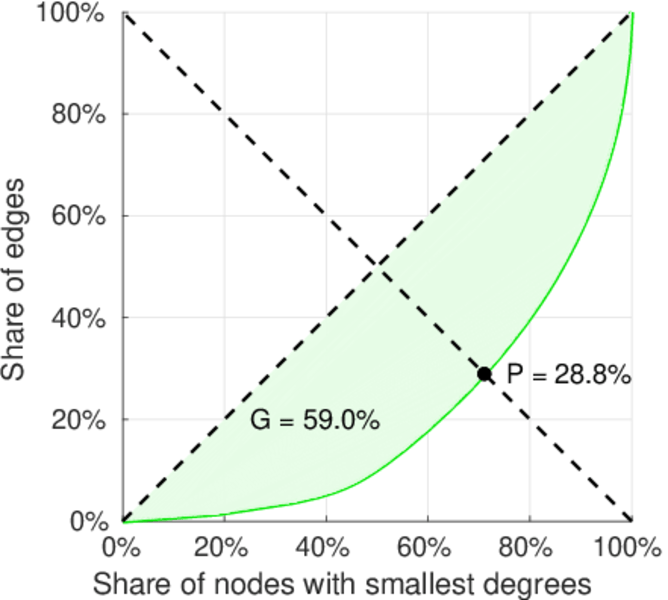
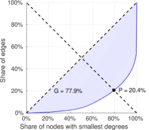
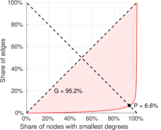
| Gini coefficient | G = | 0.774 419
|
| Balanced inequality ratio | P = | 0.206 806
|
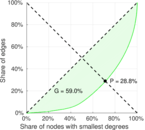
| Left balanced inequality ratio | P1 = | 0.065 692 8
|
| Right balanced inequality ratio | P2 = | 0.287 968
|
| Relative edge distribution entropy | Her = | 0.742 152
|
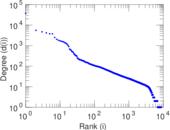
| Power law exponent | γ = | 1.933 91
|
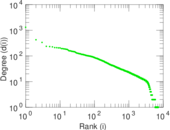
| Tail power law exponent | γt = | 3.051 00
|
| Tail power law exponent with p | γ3 = | 3.051 00
|
| p-value | p = | 0.000 00
|
| Left tail power law exponent with p | γ3,1 = | 1.991 00
|
| Left p-value | p1 = | 0.000 00
|
| Right tail power law exponent with p | γ3,2 = | 5.441 00
|
| Right p-value | p2 = | 0.121 000
|
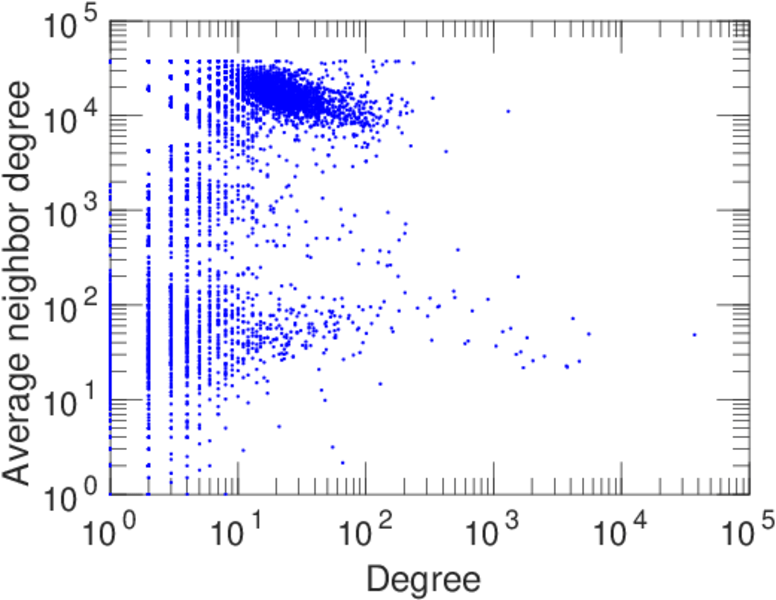
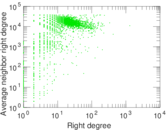
| Degree assortativity | ρ = | −0.271 955
|
| Degree assortativity p-value | pρ = | 0.000 00
|
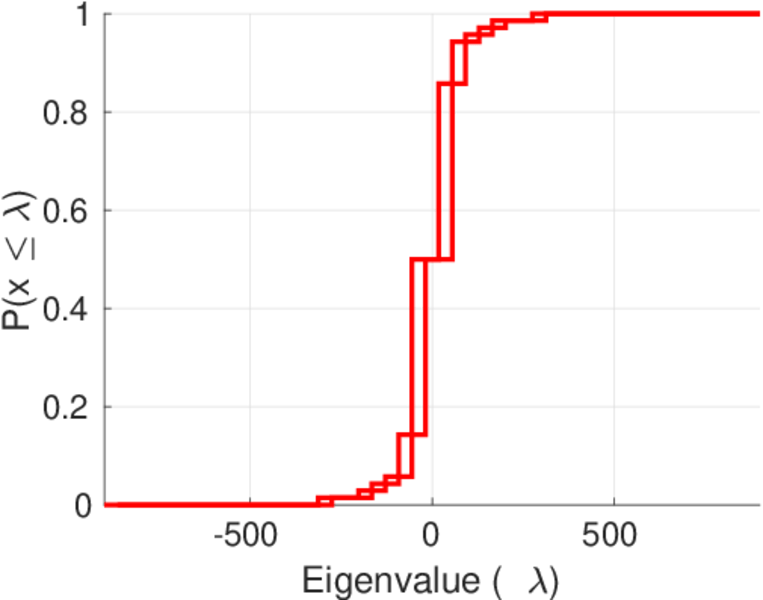
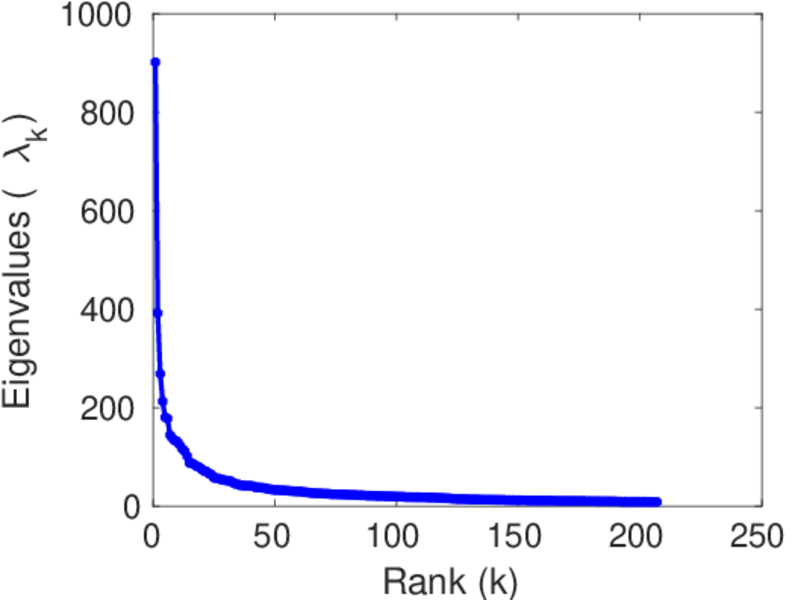
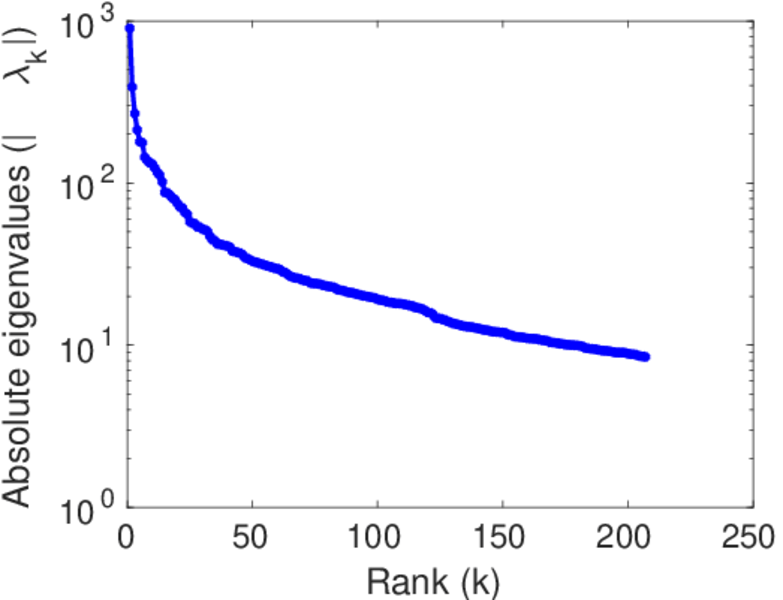
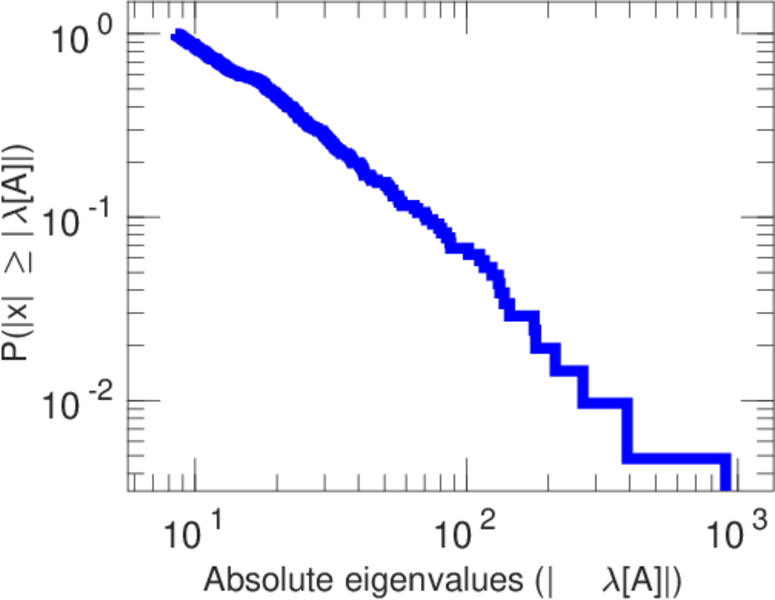
| Spectral norm | α = | 901.543
|
| Algebraic connectivity | a = | 0.090 556 4
|
| Spectral separation | |λ1[A] / λ2[A]| = | 2.302 53
|
| Controllability | C = | 6,675
|
| Relative controllability | Cr = | 0.767 153
|
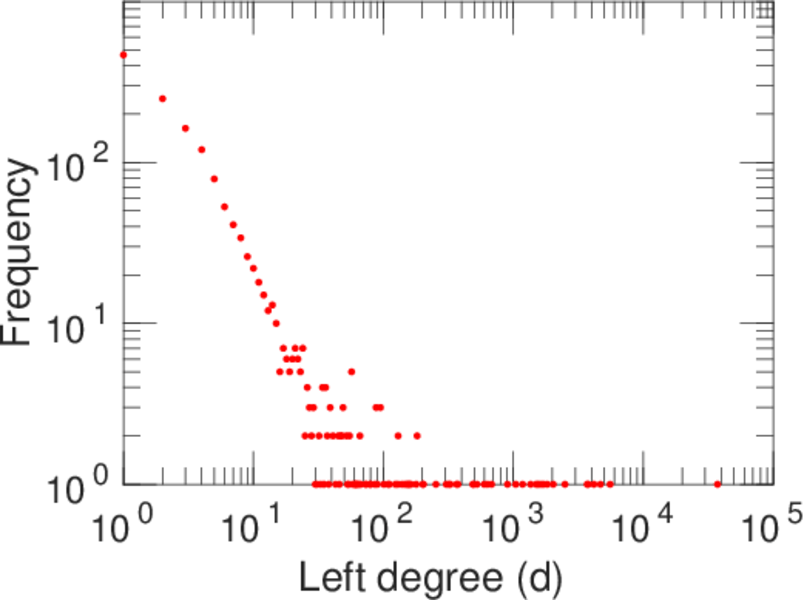
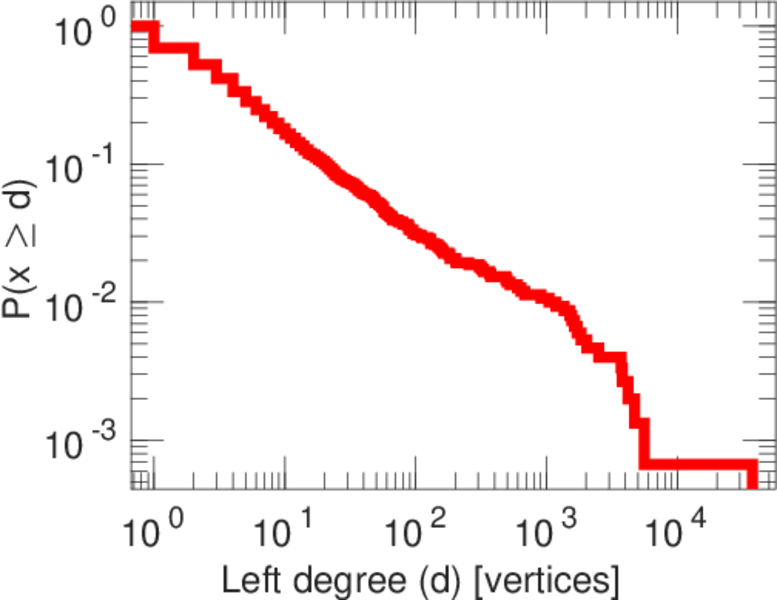
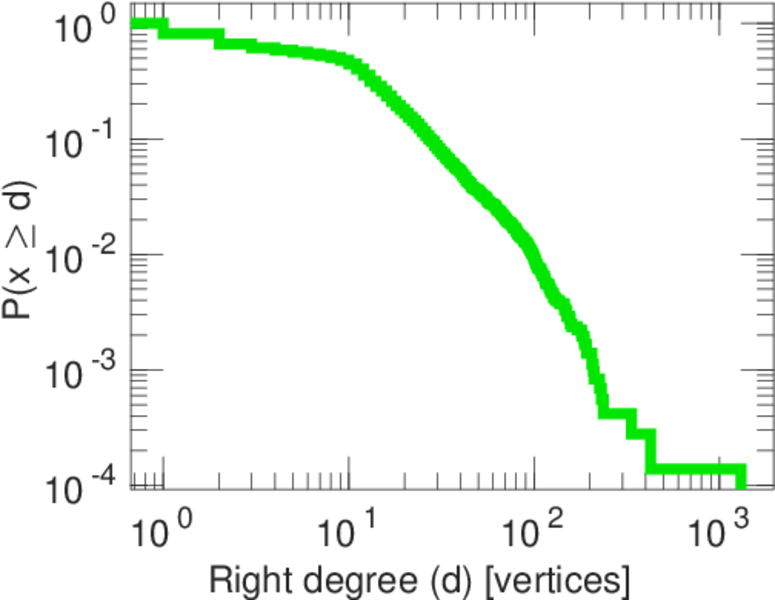
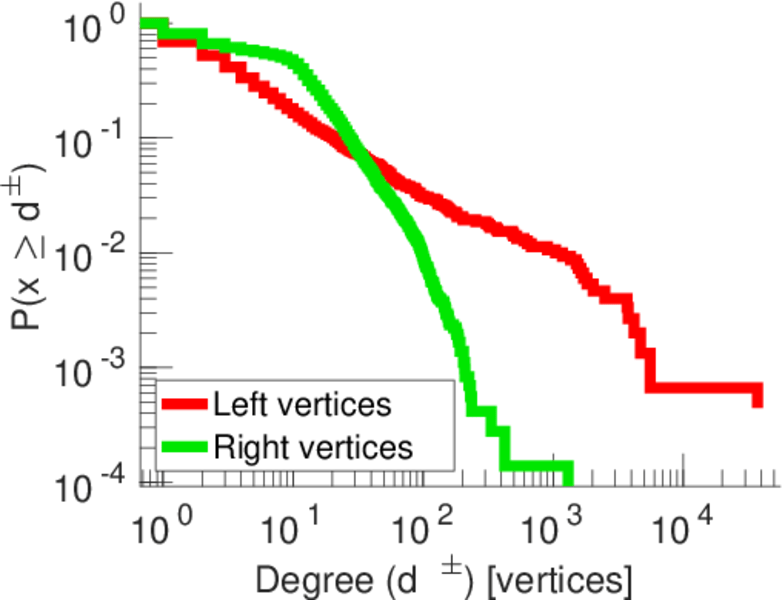
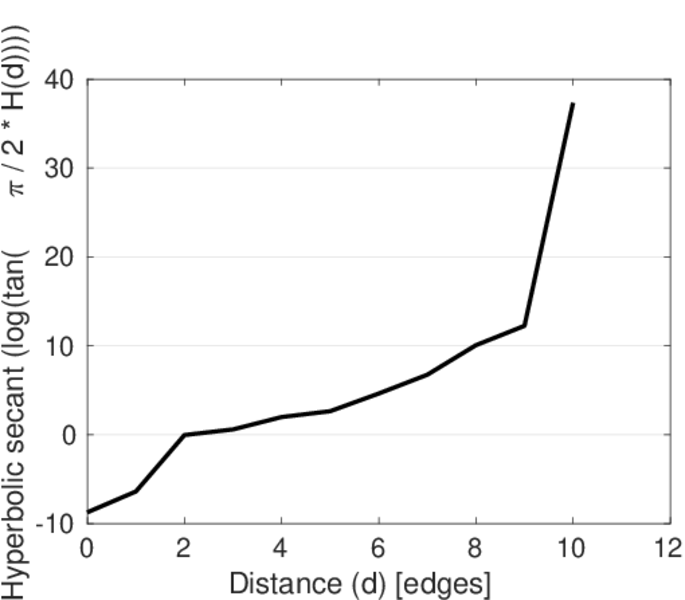
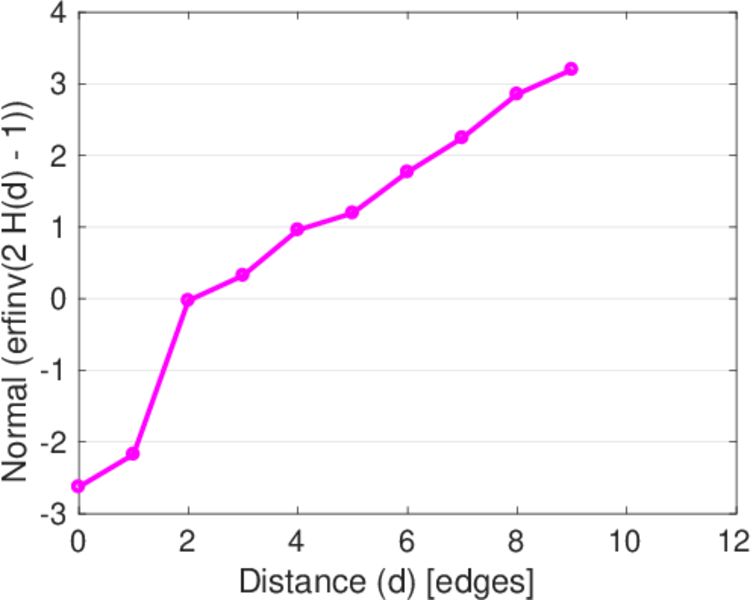
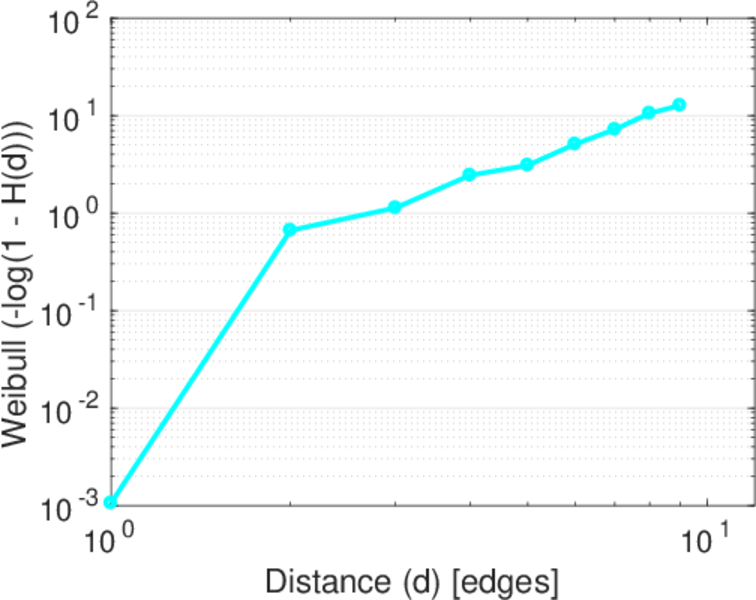
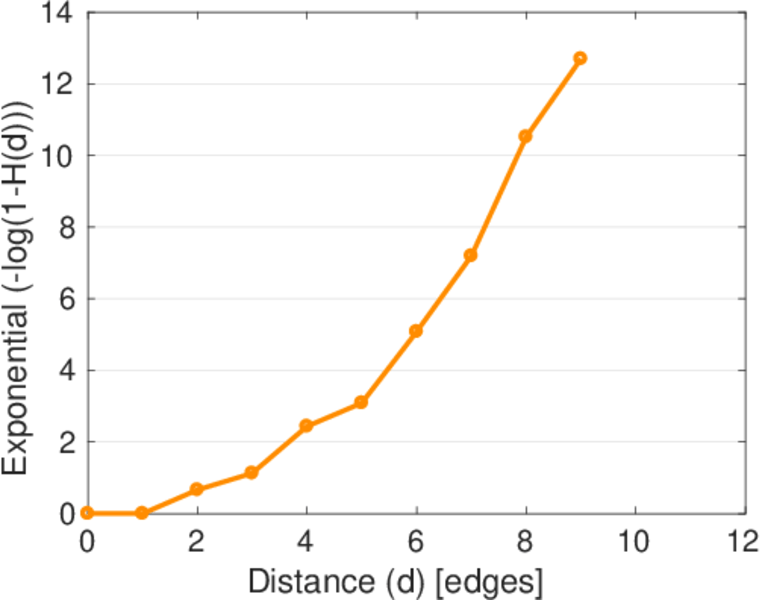
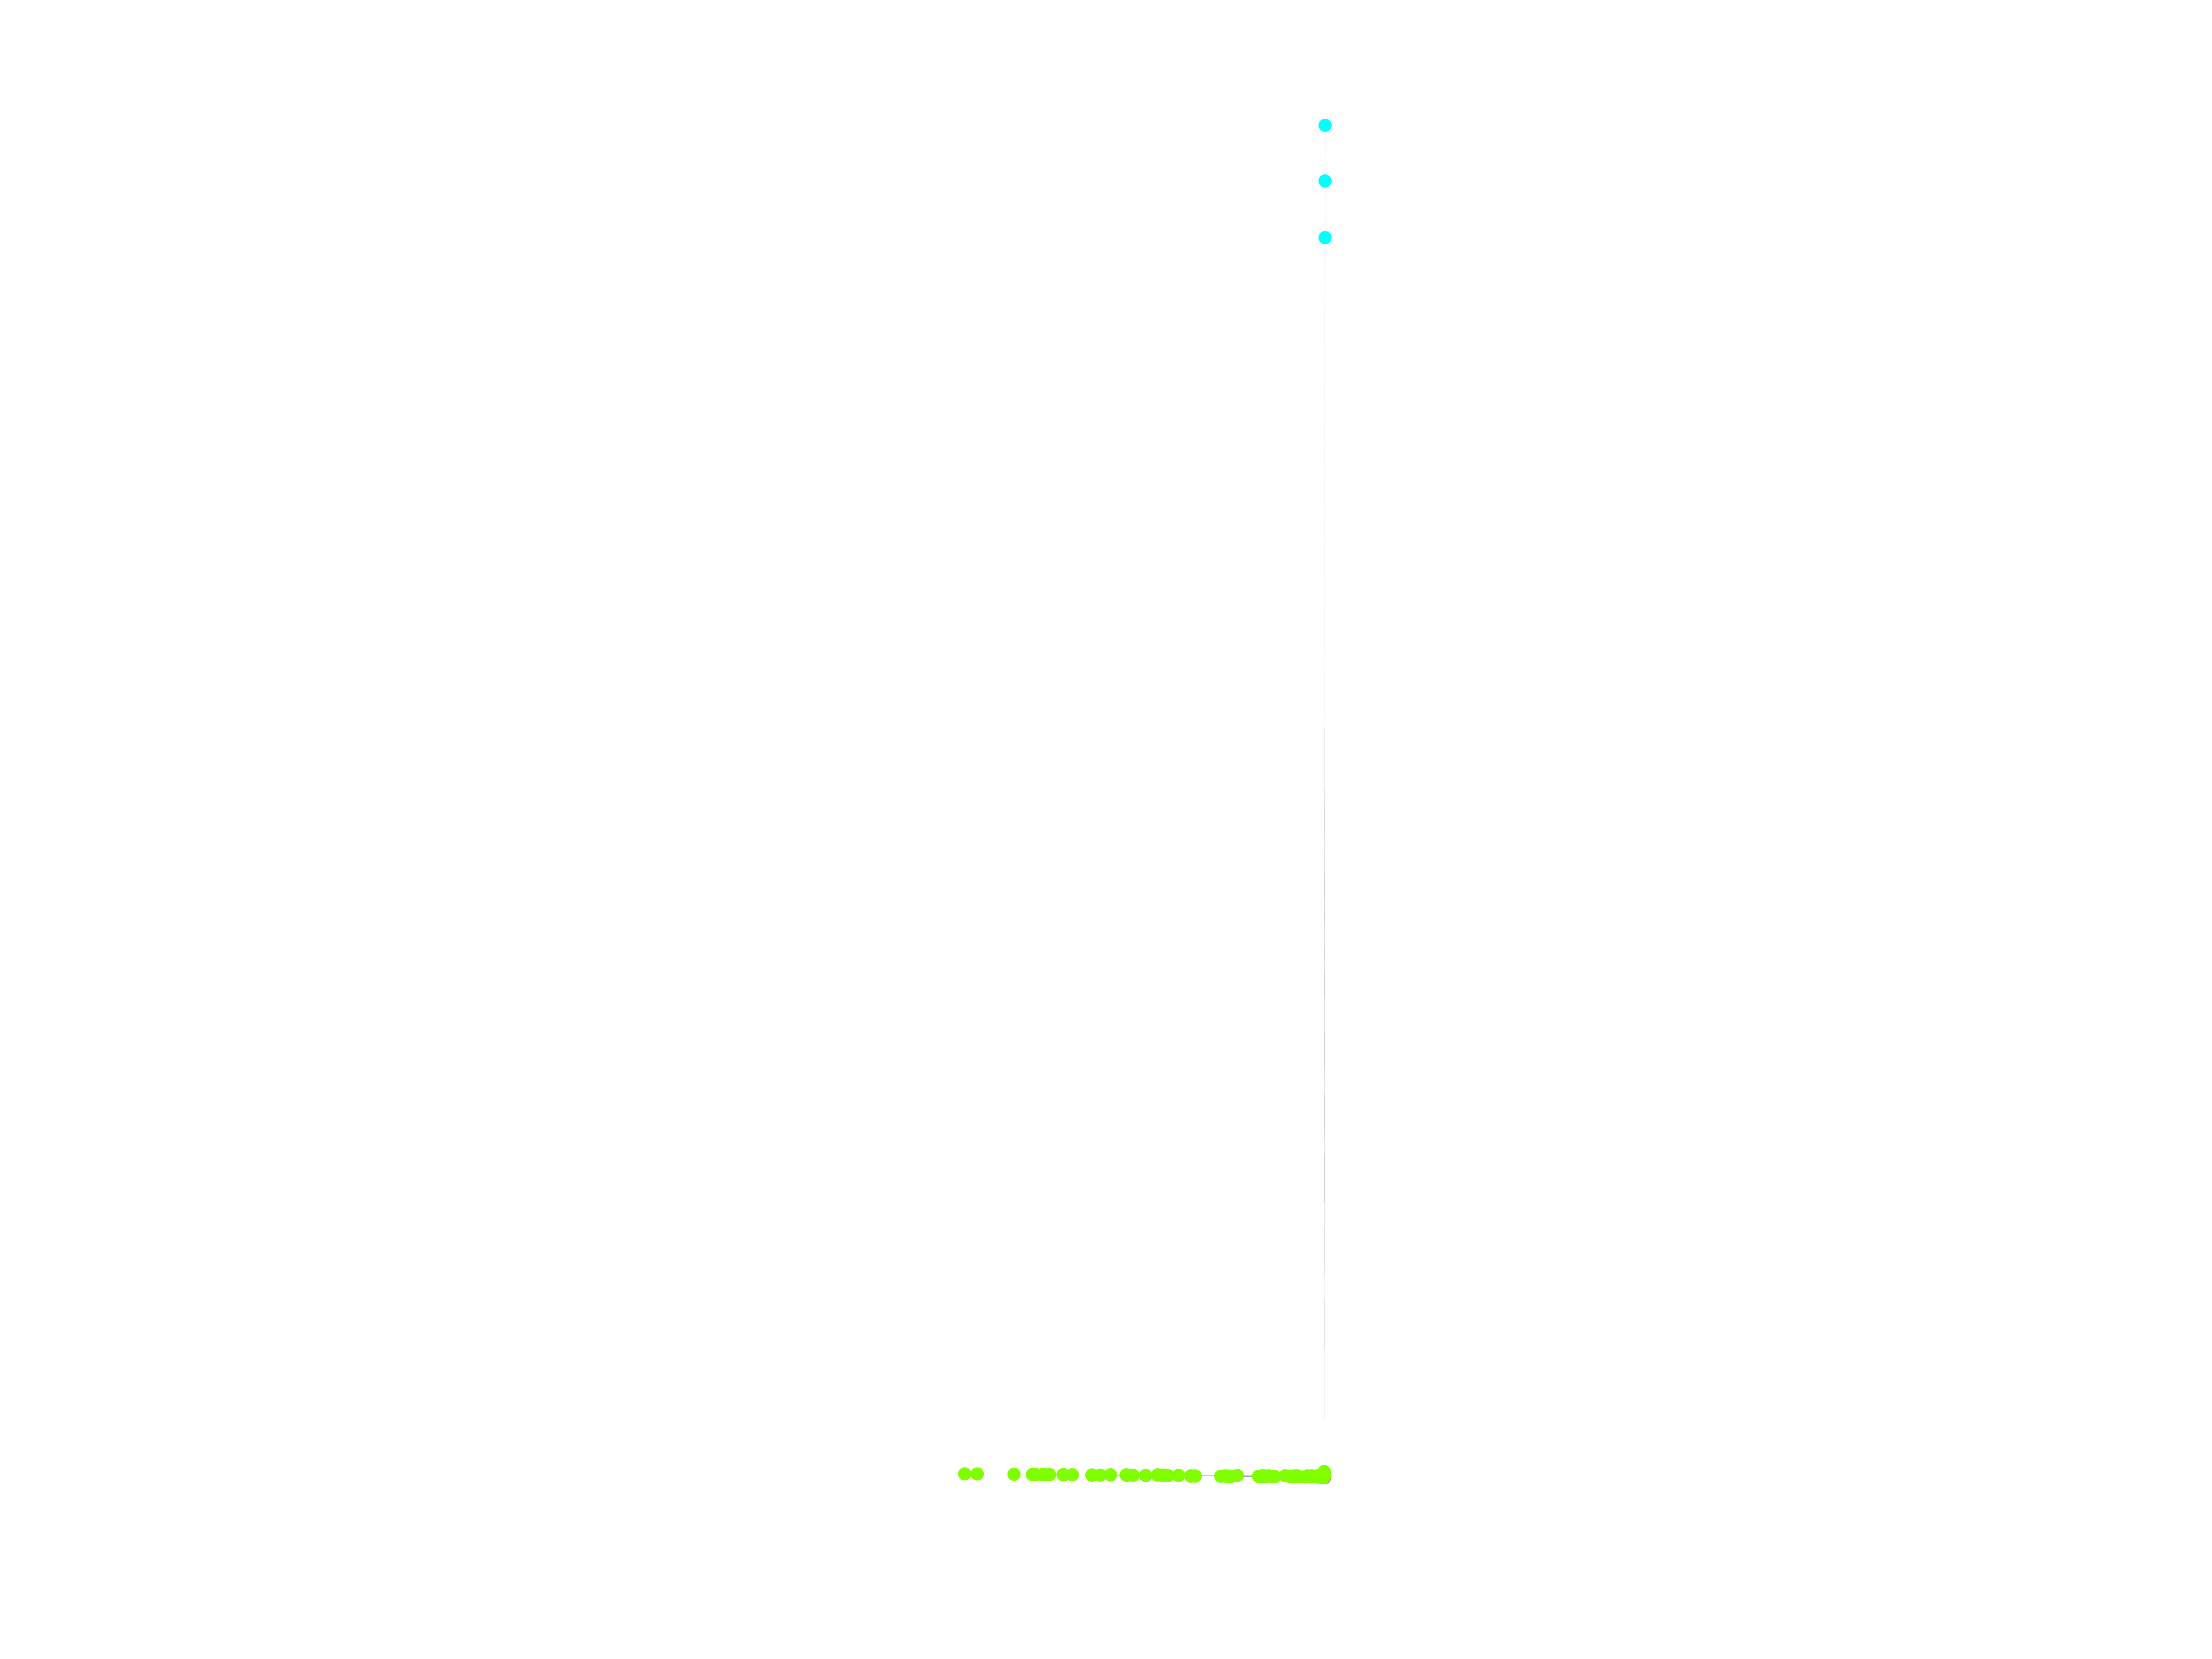
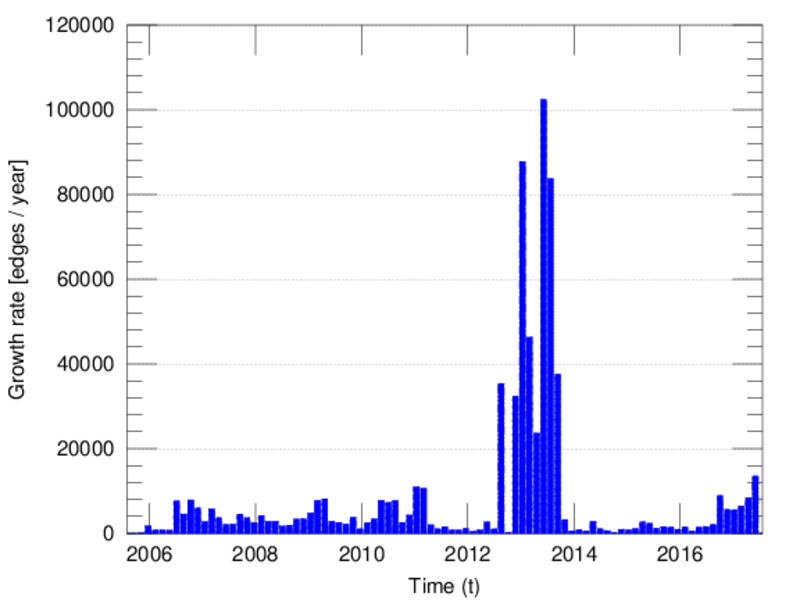
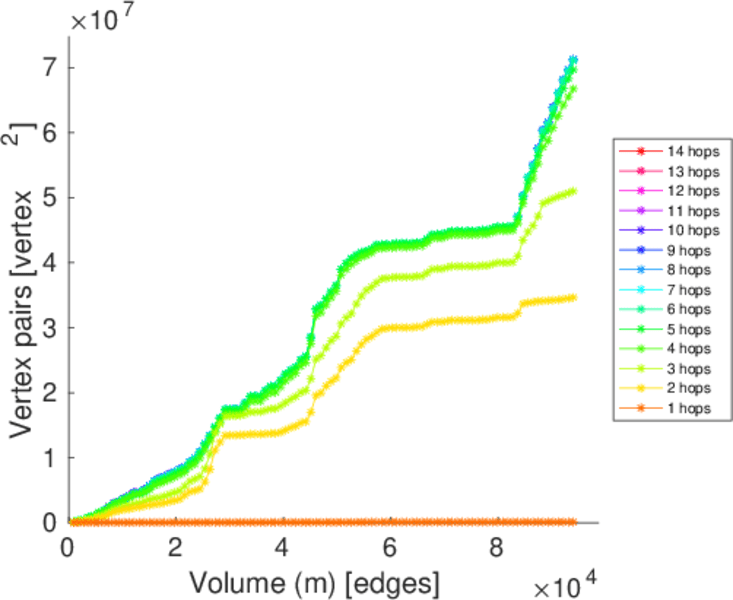
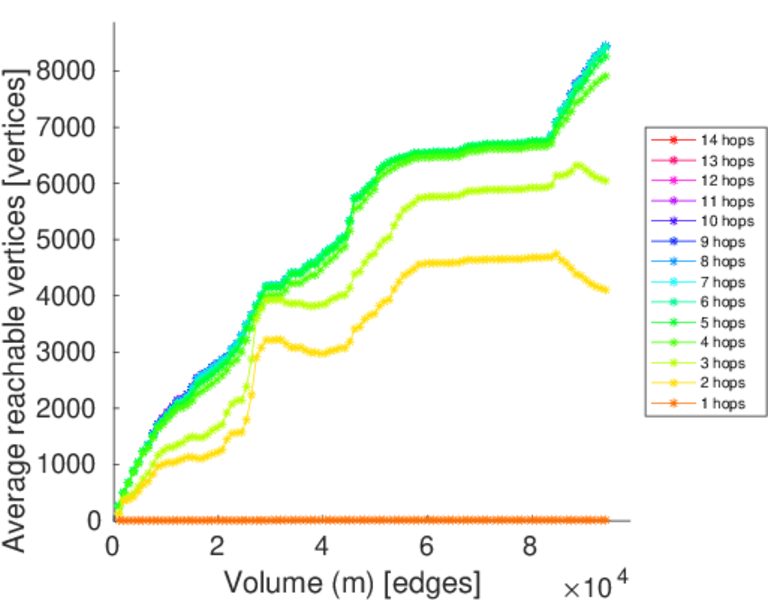
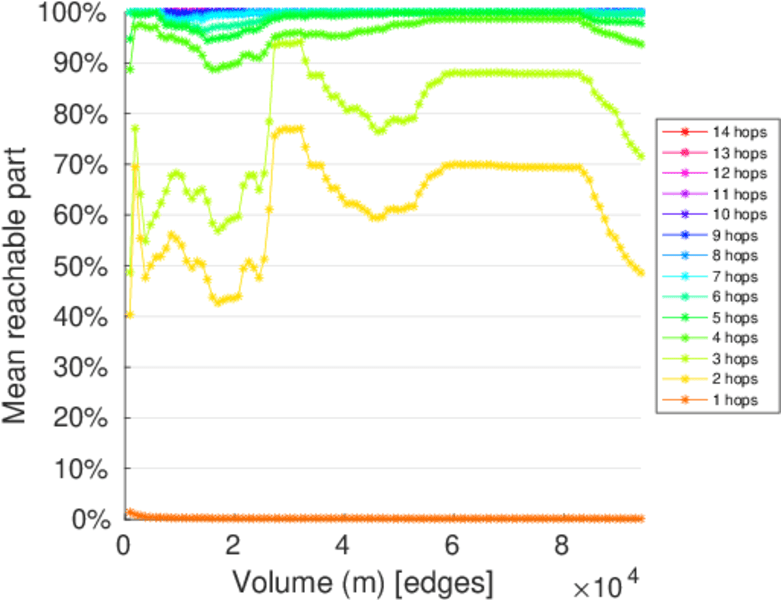
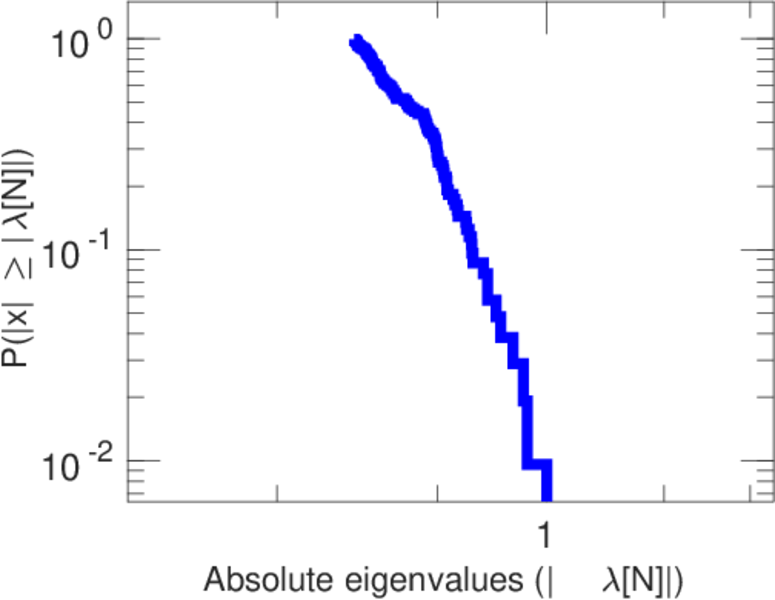
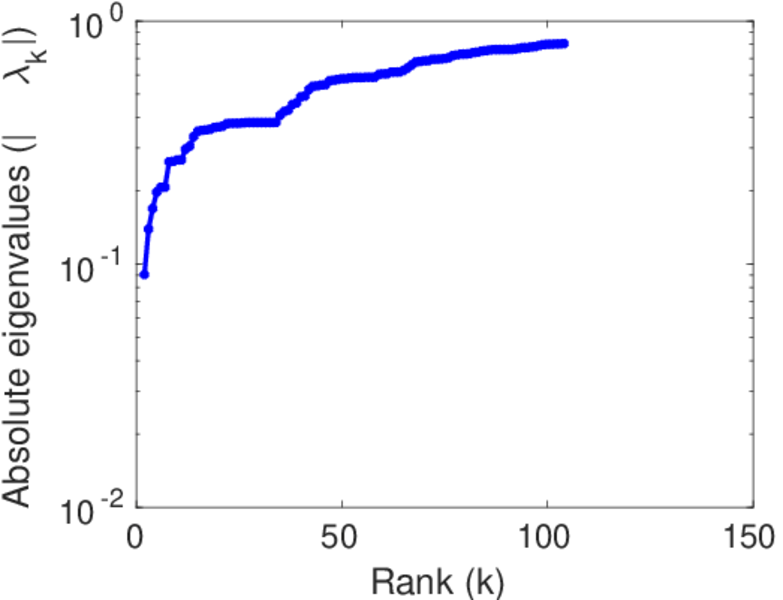
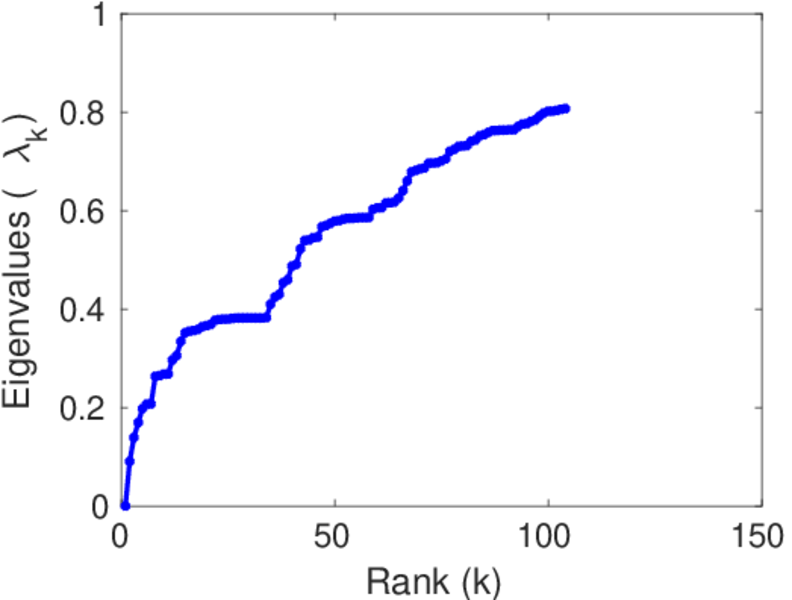
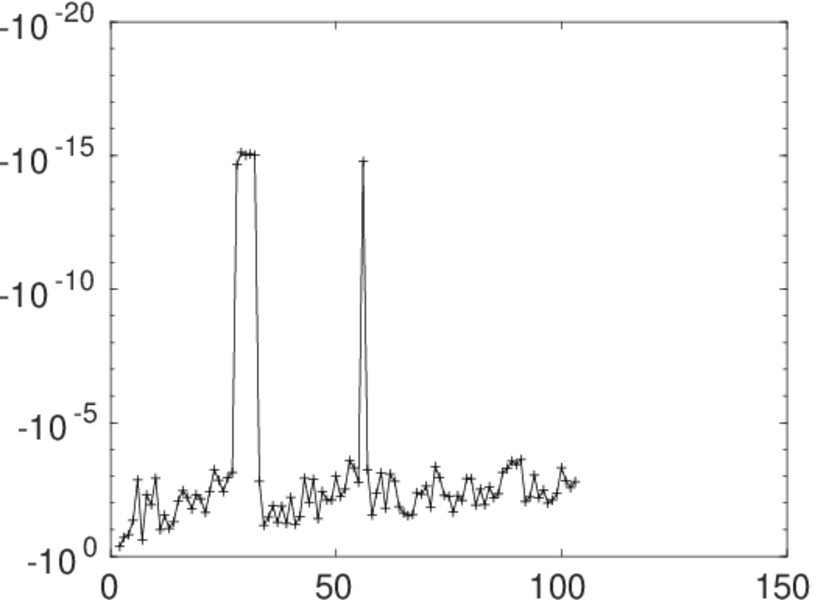
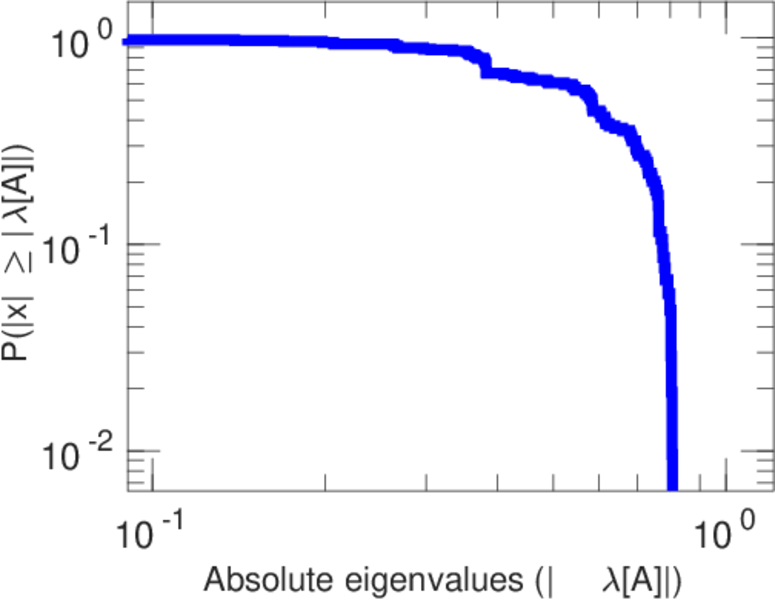
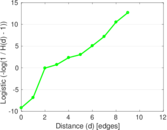
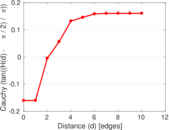
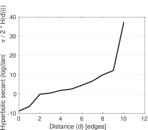
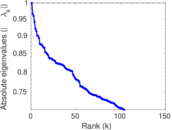
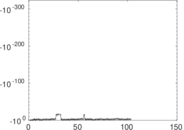
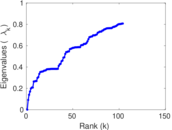
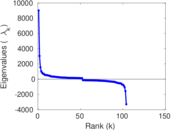
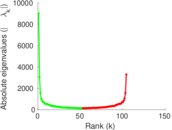
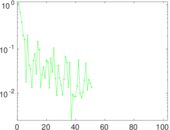
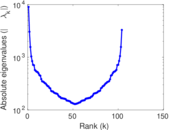
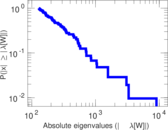
Plots


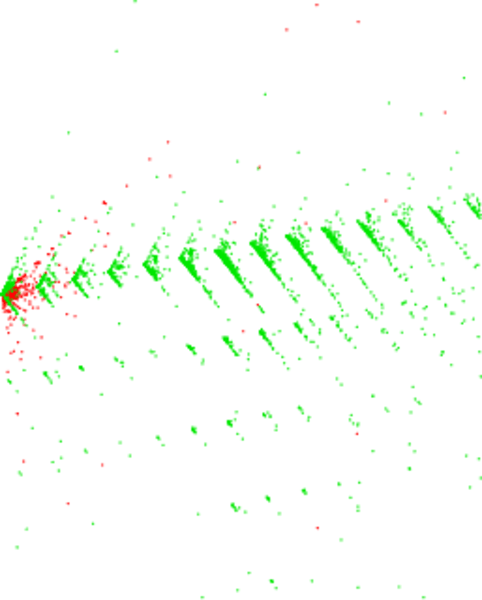
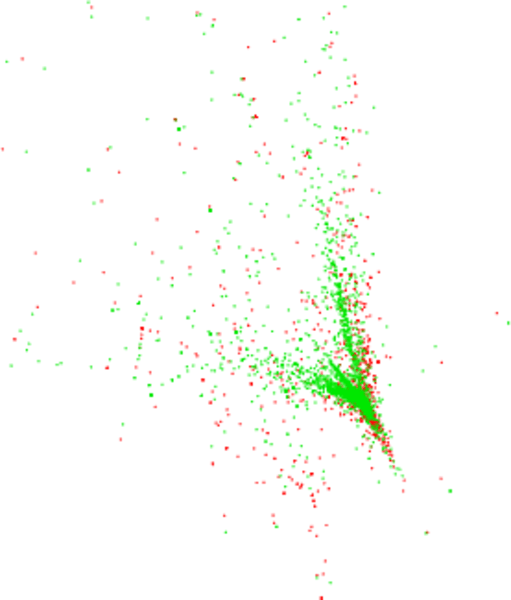
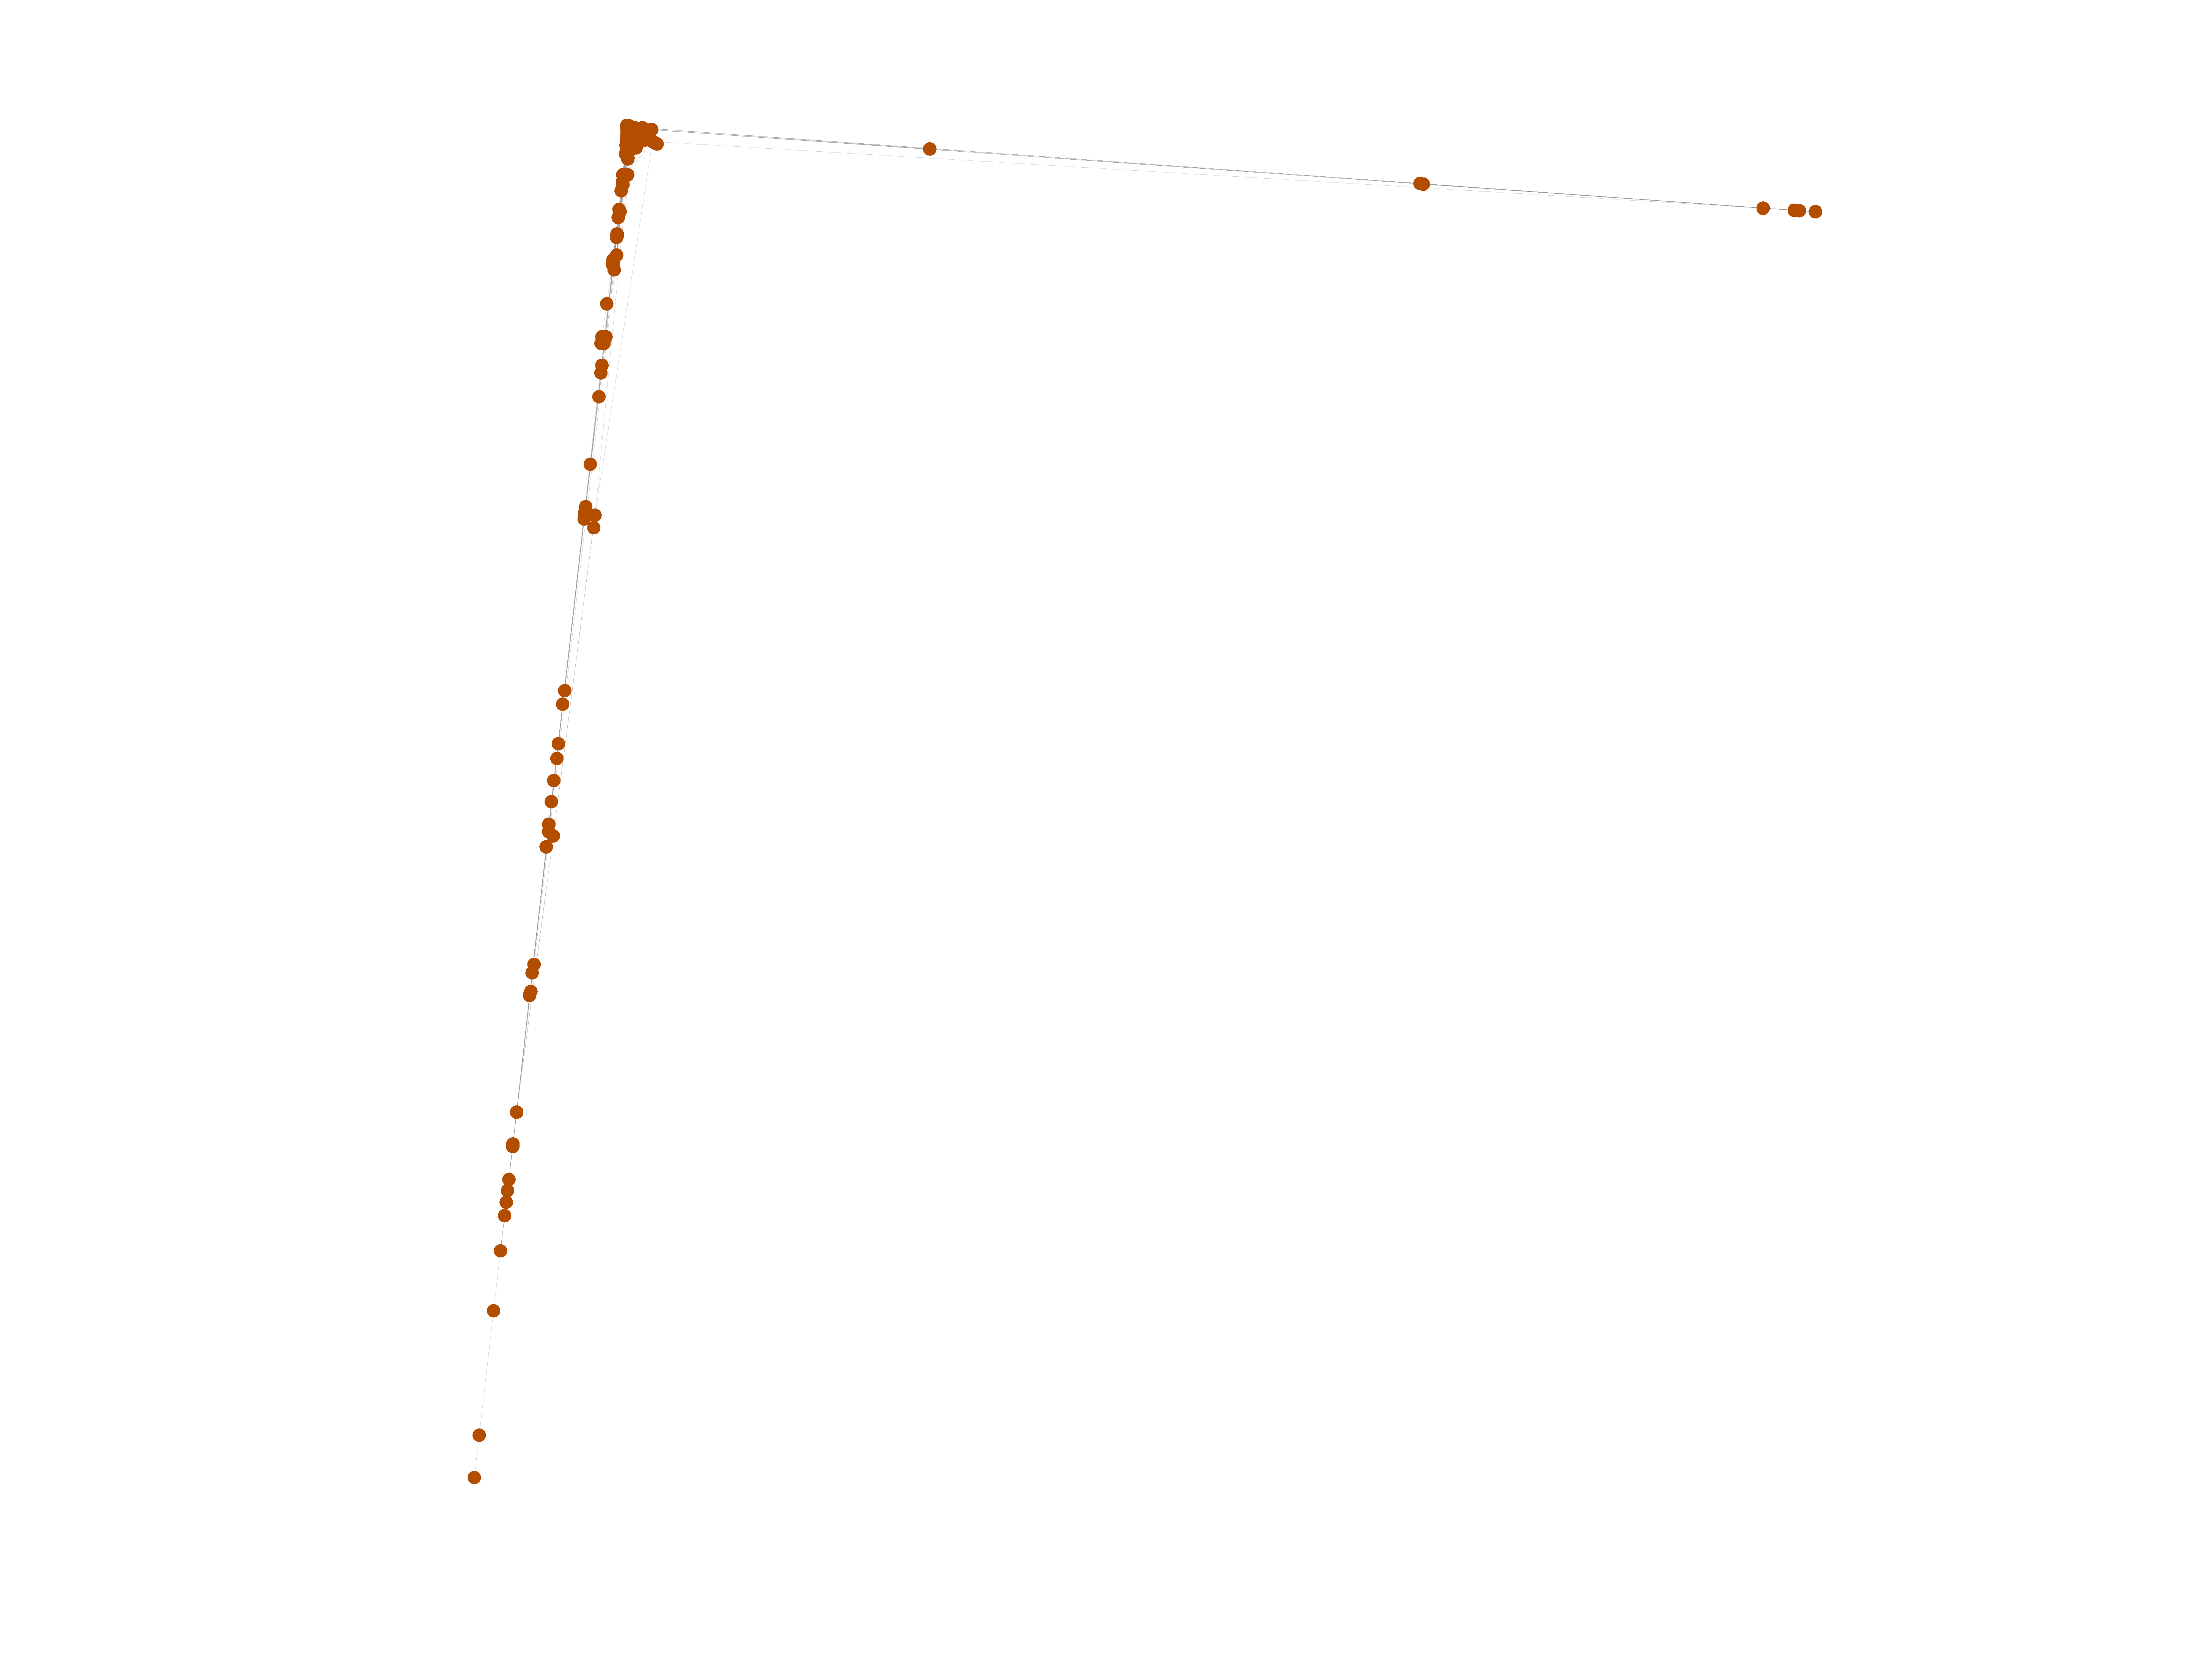
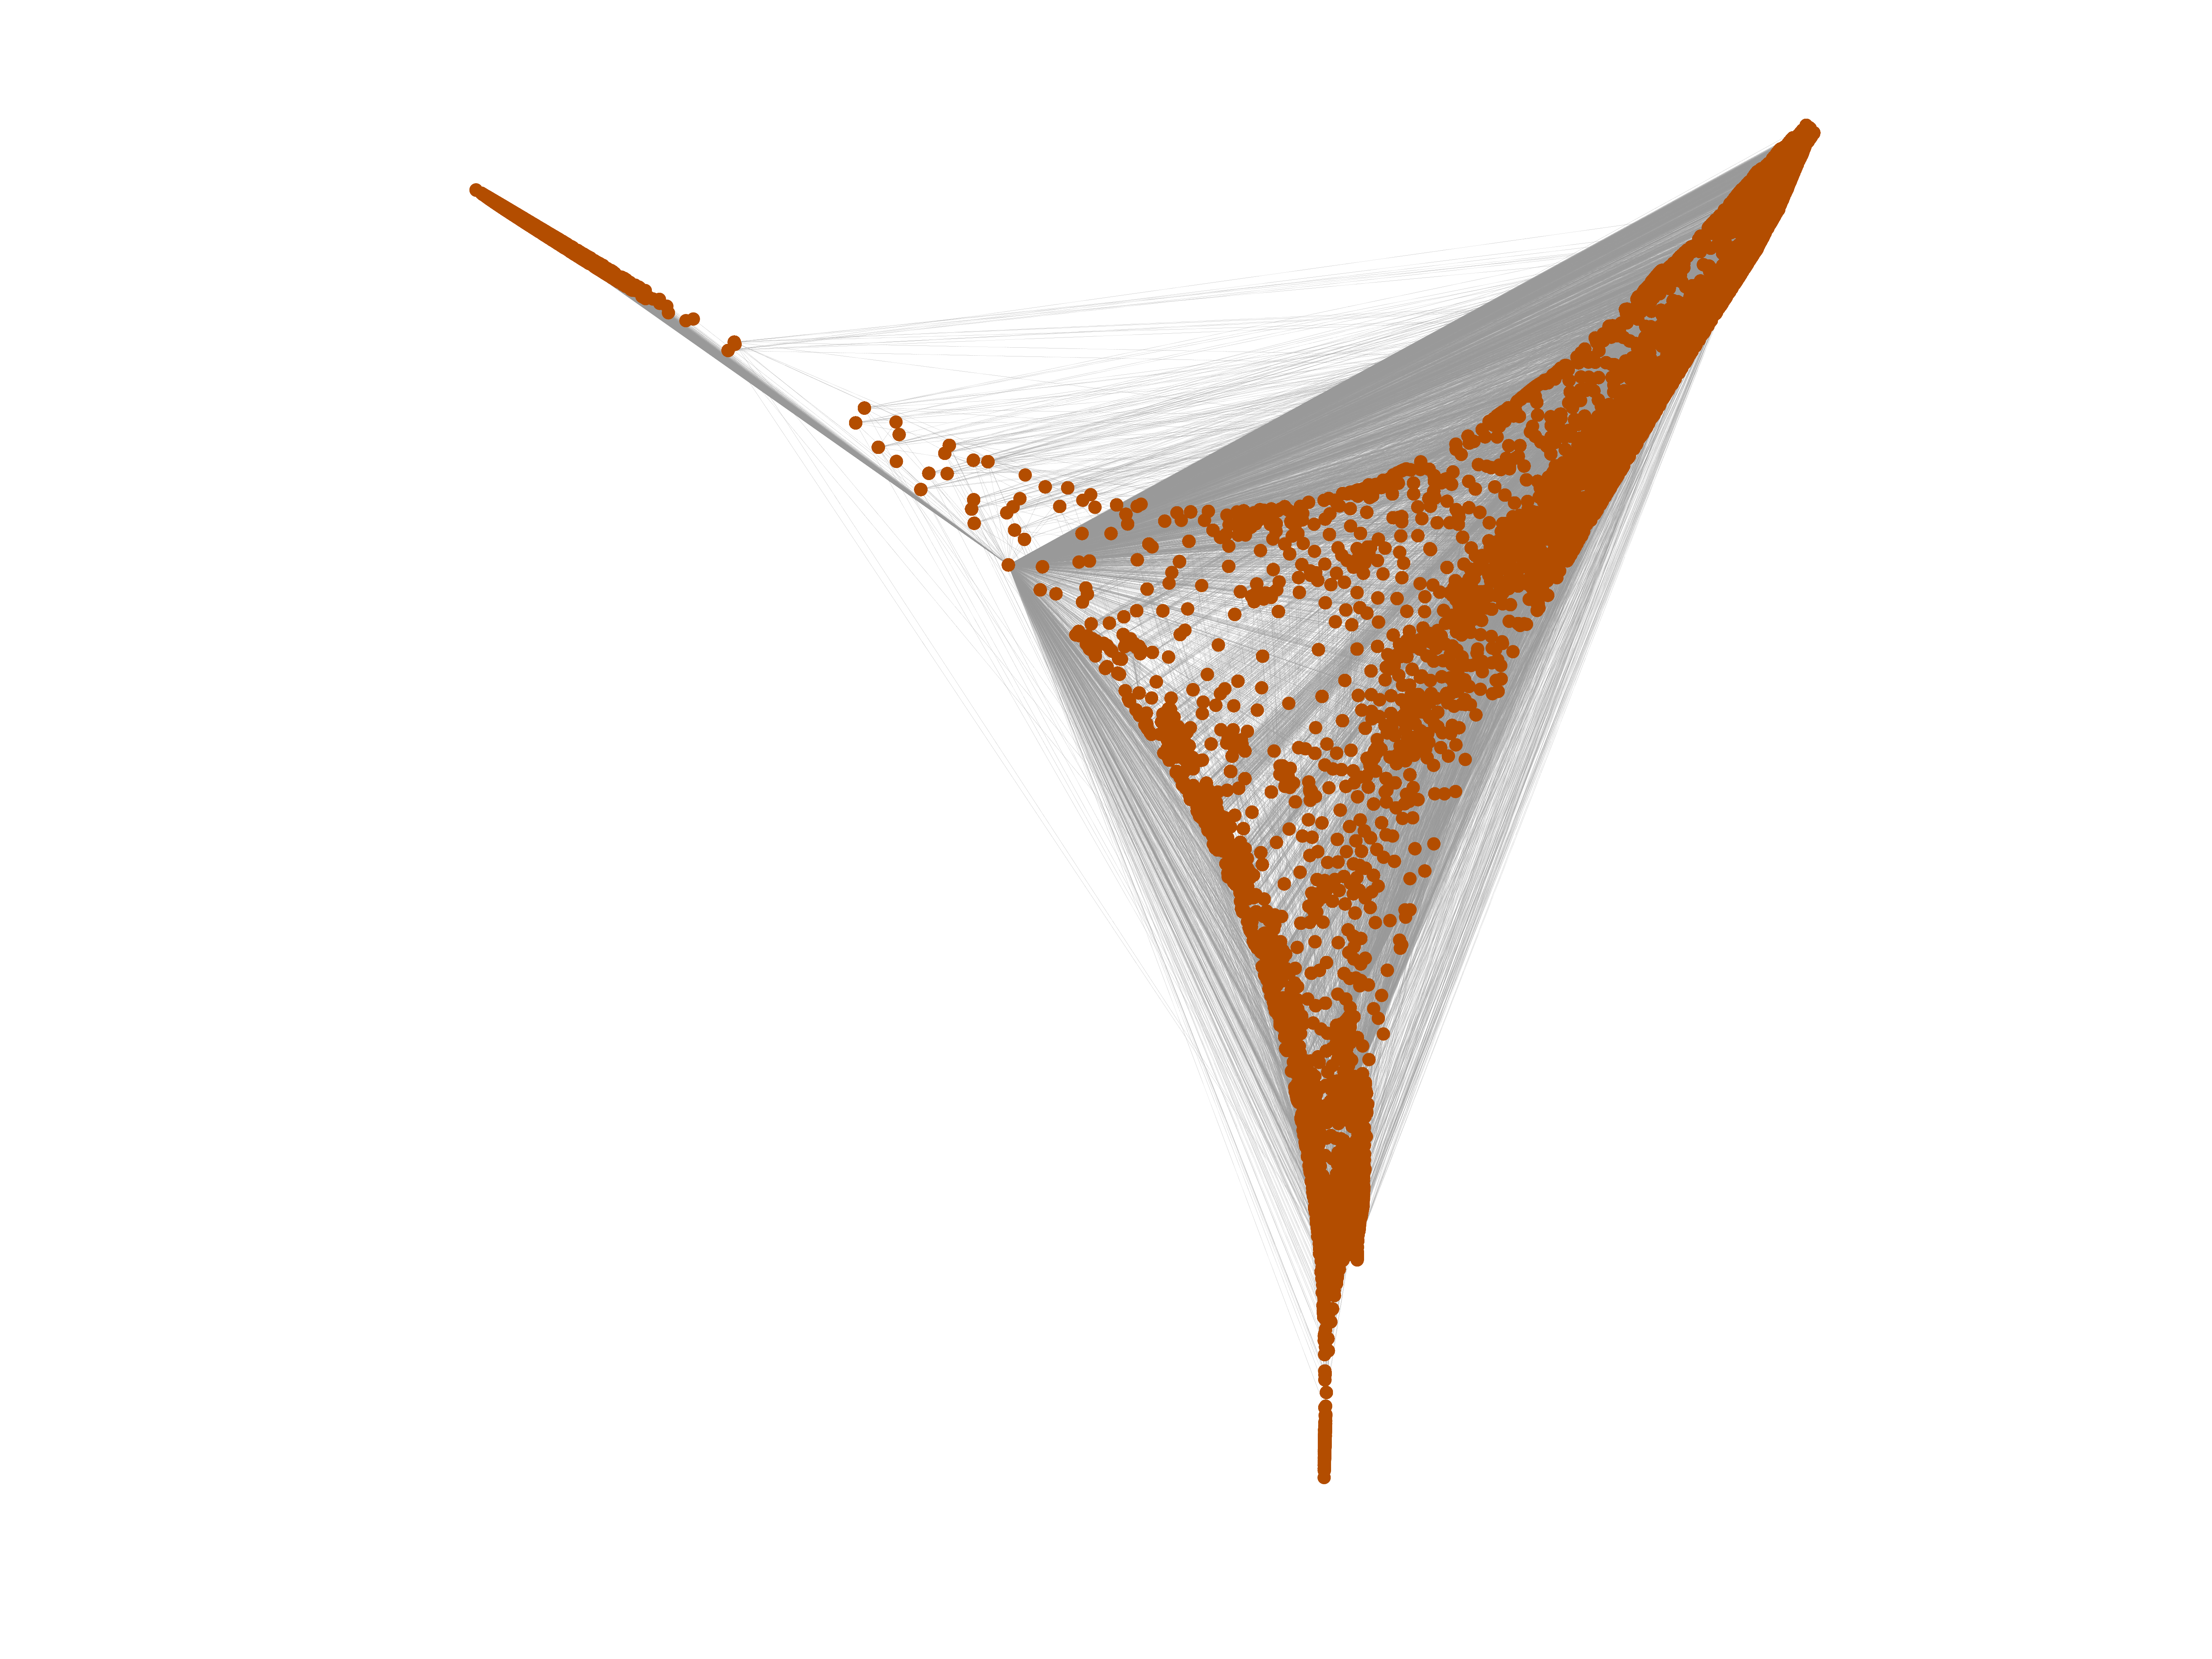
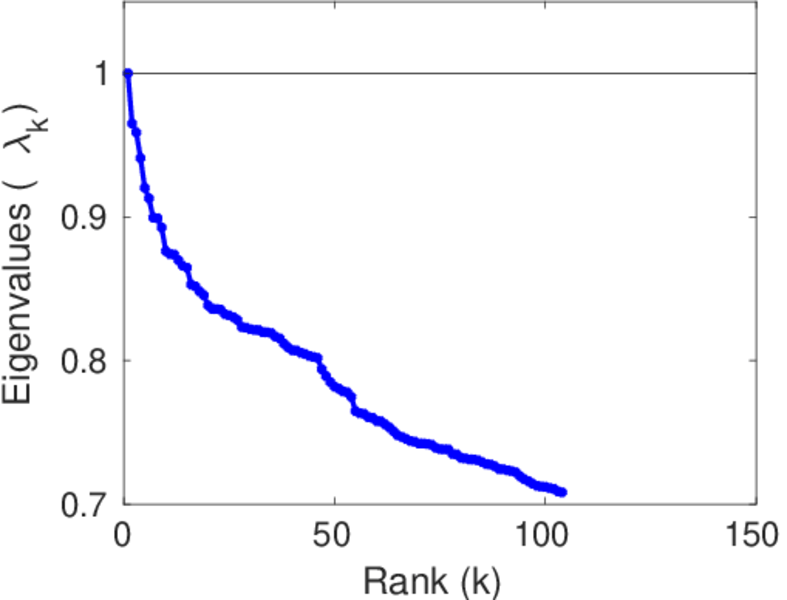
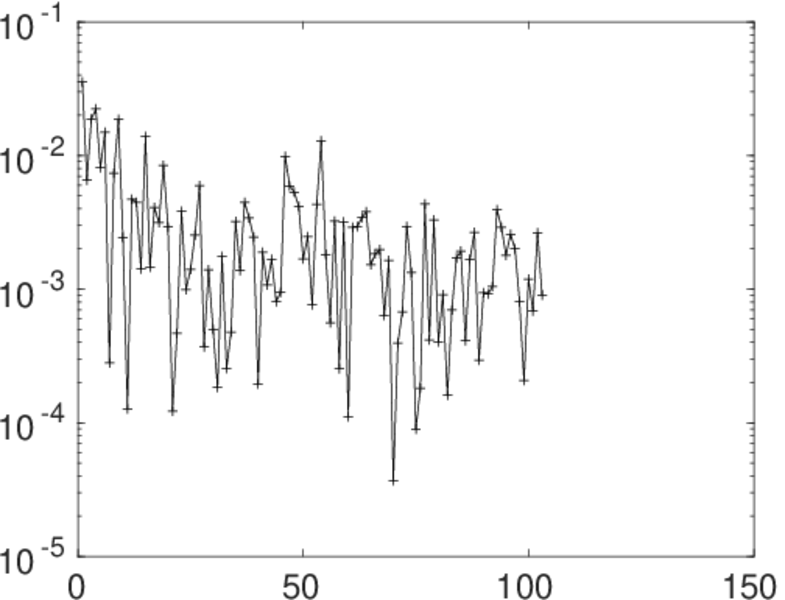
Matrix decompositions plots


Downloads
References
|
[1]
|
Jérôme Kunegis.
KONECT – The Koblenz Network Collection.
In Proc. Int. Conf. on World Wide Web Companion, pages
1343–1350, 2013.
[ http ]
|
|
[2]
|
Wikimedia Foundation.
Wikimedia downloads.
http://dumps.wikimedia.org/, January 2010.
|
 KONECT ‣ Networks ‣
Buy Me a Coffee
KONECT ‣ Networks ‣
Buy Me a Coffee