Wiktionary edits (pt)
This is the bipartite edit network of the Portuguese Wiktionary. It contains
users and pages from the Portuguese Wiktionary, connected by edit events. Each
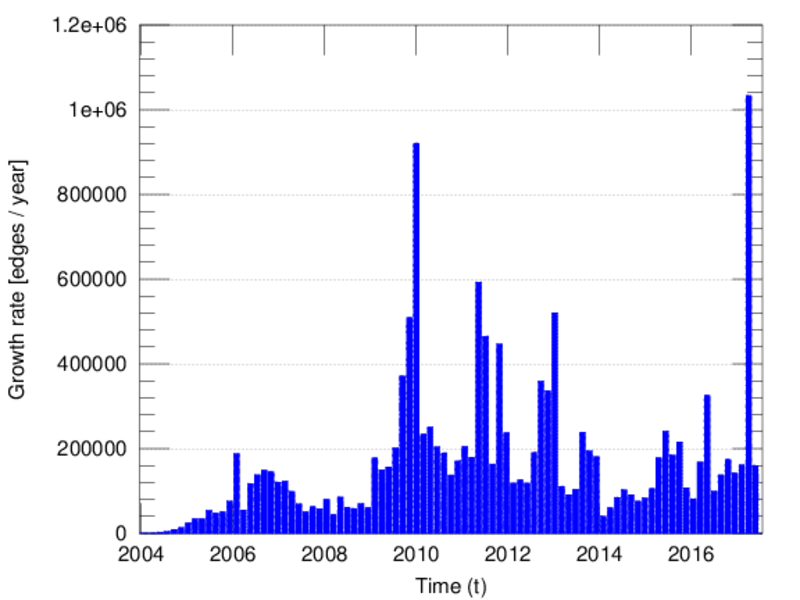
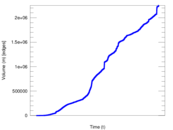
edge represents an edit. The dataset includes the timestamp of each edit.
Metadata
Statistics
| Size | n = | 340,357
|
| Left size | n1 = | 5,213
|
| Right size | n2 = | 335,144
|
| Volume | m = | 2,252,790
|
| Unique edge count | m̿ = | 1,375,504
|
| Wedge count | s = | 59,916,559,758
|
| Claw count | z = | 2,847,033,080,897,105
|
| Cross count | x = | 1.146 83 × 1020
|
| Square count | q = | 51,682,710,958
|
| 4-Tour count | T4 = | 653,130,712,212
|
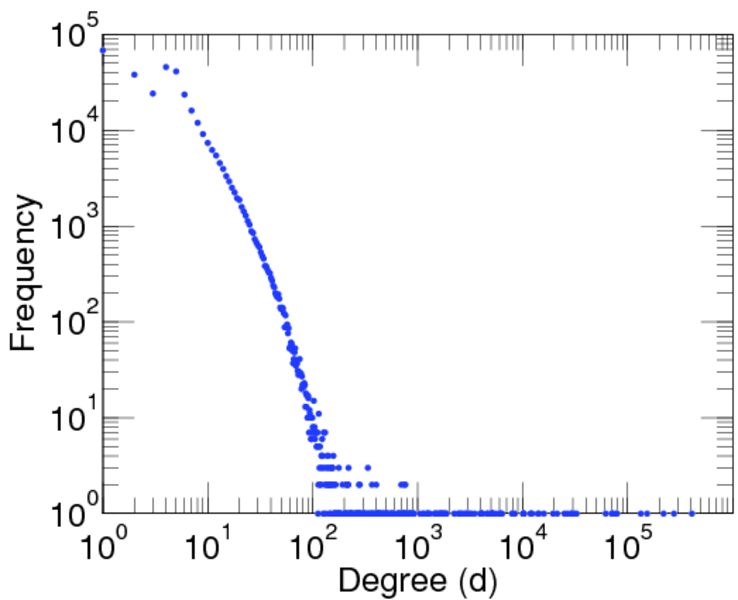
| Maximum degree | dmax = | 409,449
|
| Maximum left degree | d1max = | 409,449
|
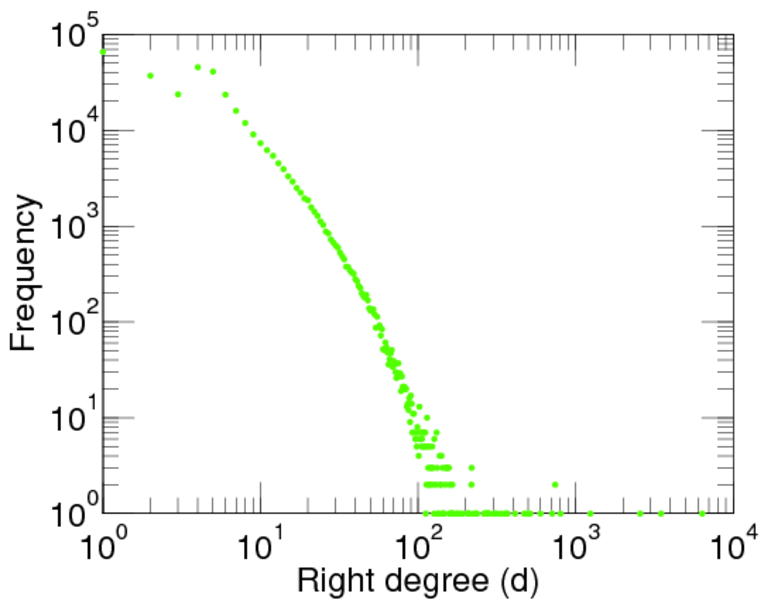
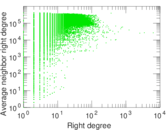
| Maximum right degree | d2max = | 6,361
|
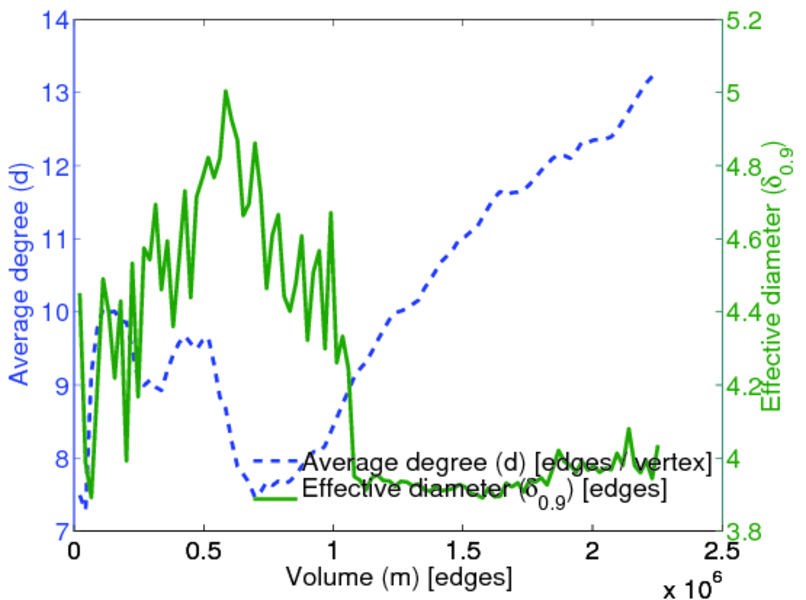
| Average degree | d = | 13.237 8
|
| Average left degree | d1 = | 432.148
|
| Average right degree | d2 = | 6.721 86
|
| Fill | p = | 0.000 787 304
|
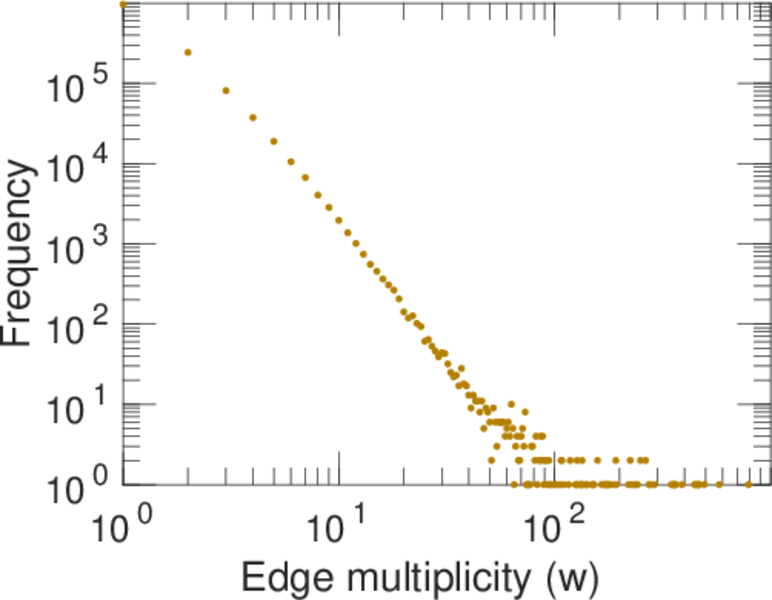
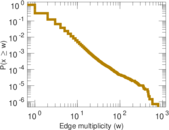
| Average edge multiplicity | m̃ = | 1.637 79
|
| Size of LCC | N = | 338,000
|
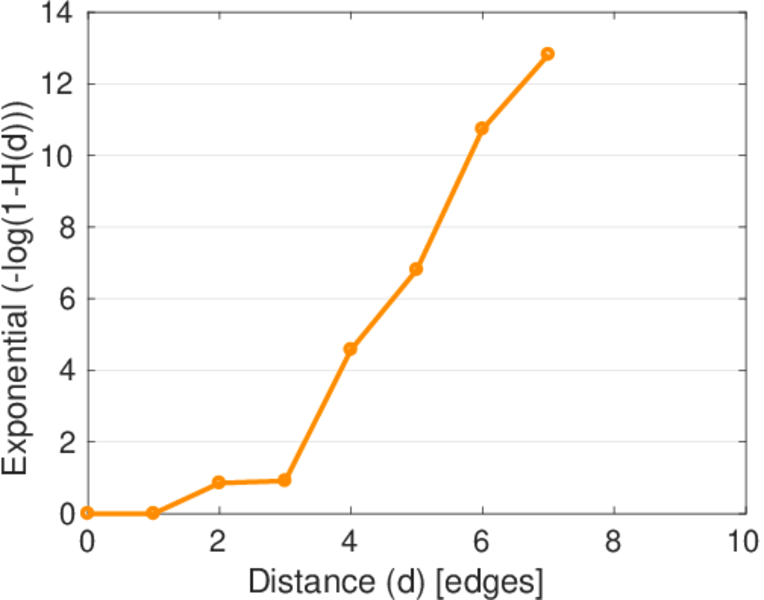
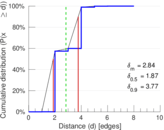
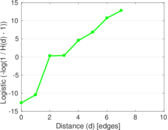
| Diameter | δ = | 10
|
| 50-Percentile effective diameter | δ0.5 = | 1.871 92
|
| 90-Percentile effective diameter | δ0.9 = | 3.770 27
|
| Median distance | δM = | 2
|
| Mean distance | δm = | 2.838 73
|
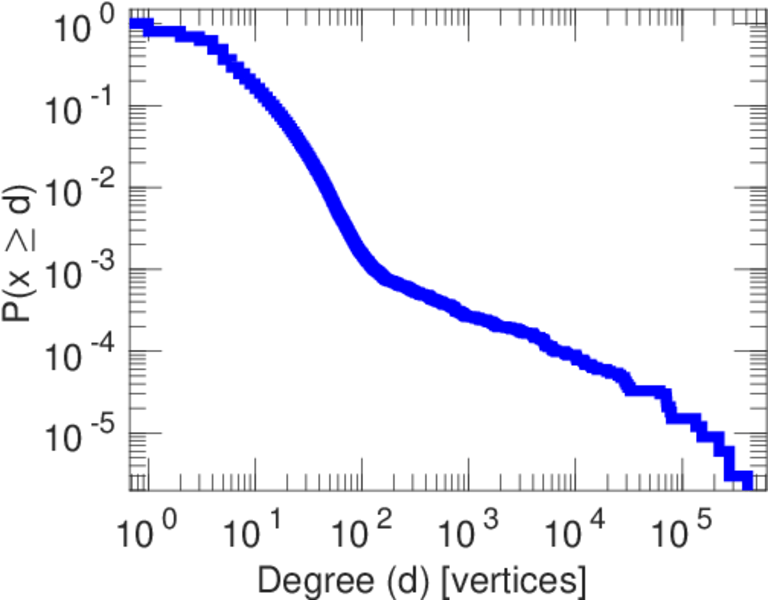
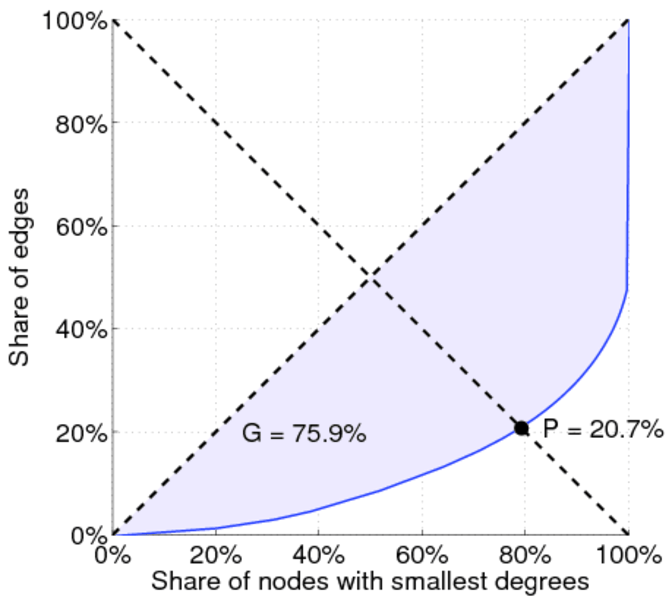
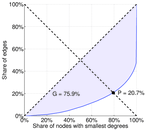
| Gini coefficient | G = | 0.760 271
|
| Balanced inequality ratio | P = | 0.209 046
|
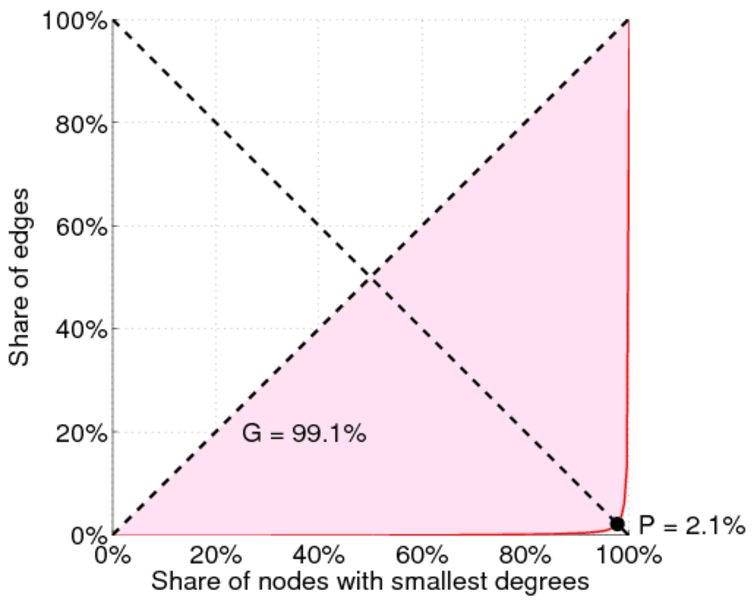
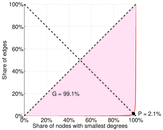
| Left balanced inequality ratio | P1 = | 0.021 060 1
|
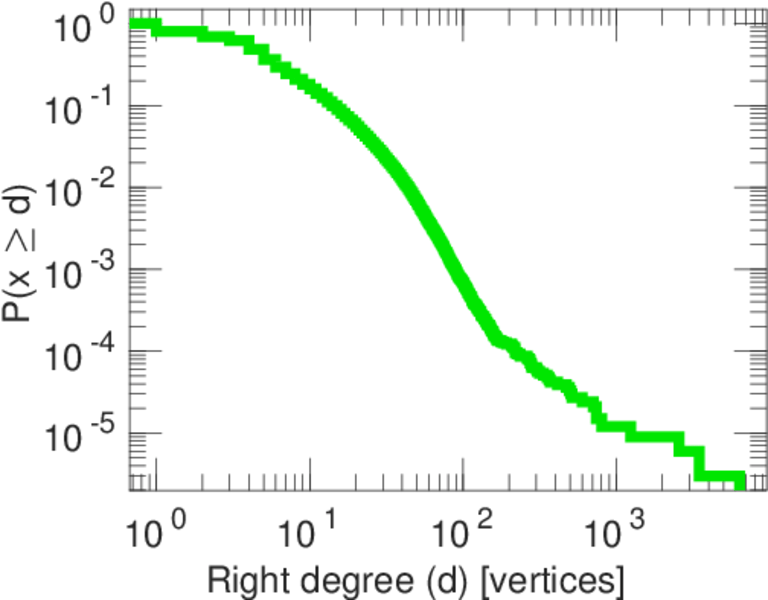
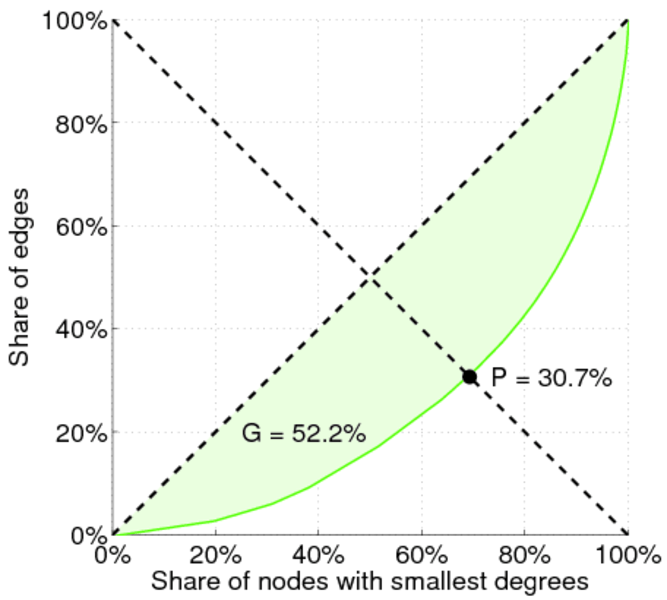
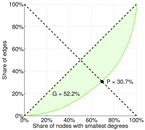
| Right balanced inequality ratio | P2 = | 0.306 792
|
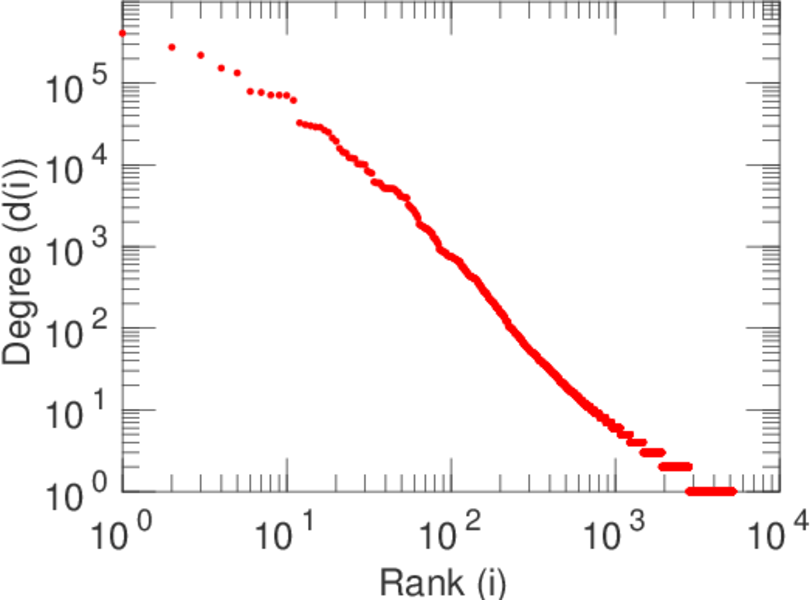
| Power law exponent | γ = | 1.905 24
|
| Tail power law exponent | γt = | 3.001 00
|
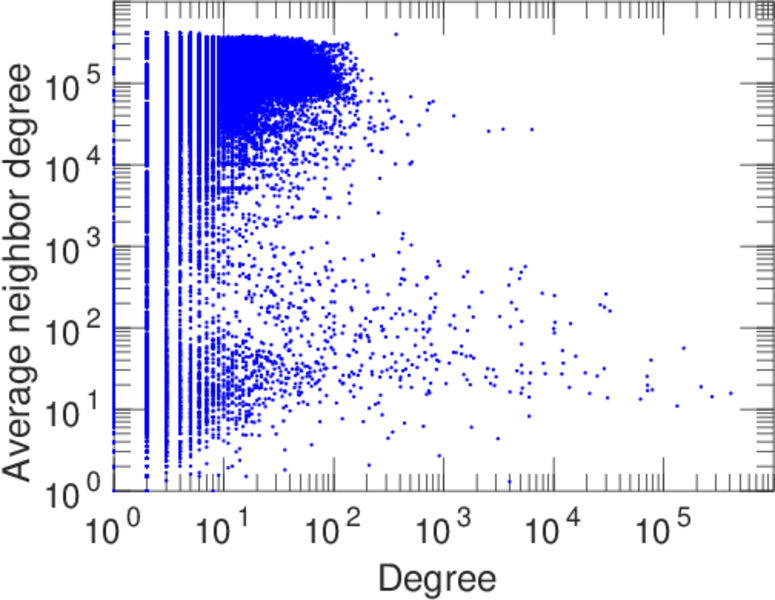
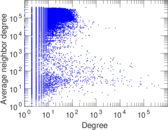
| Degree assortativity | ρ = | −0.185 731
|
| Degree assortativity p-value | pρ = | 0.000 00
|
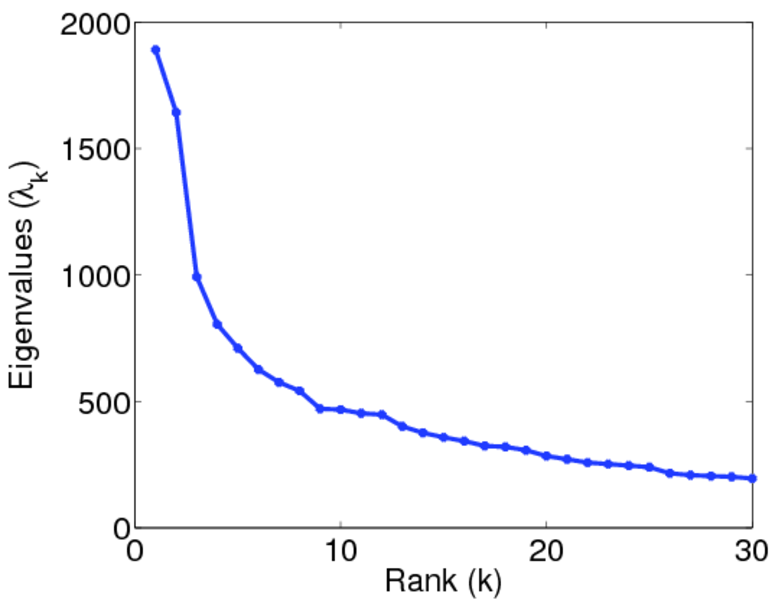
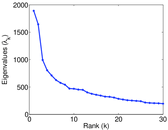
| Spectral norm | α = | 1,890.98
|
| Algebraic connectivity | a = | 0.038 673 9
|
| Controllability | C = | 329,385
|
| Relative controllability | Cr = | 0.972 323
|
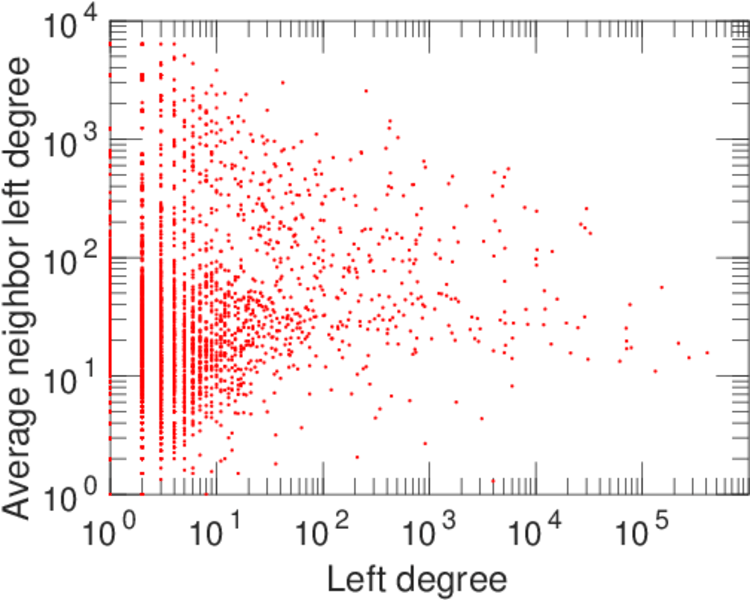
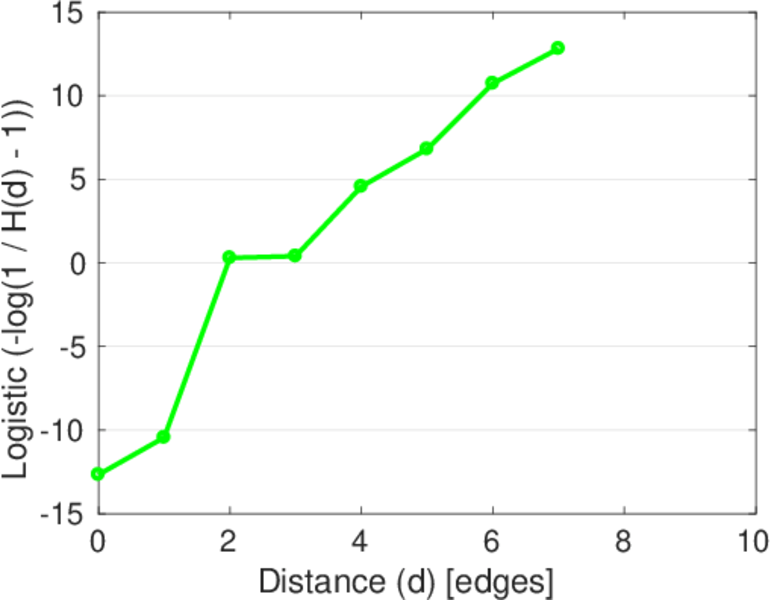
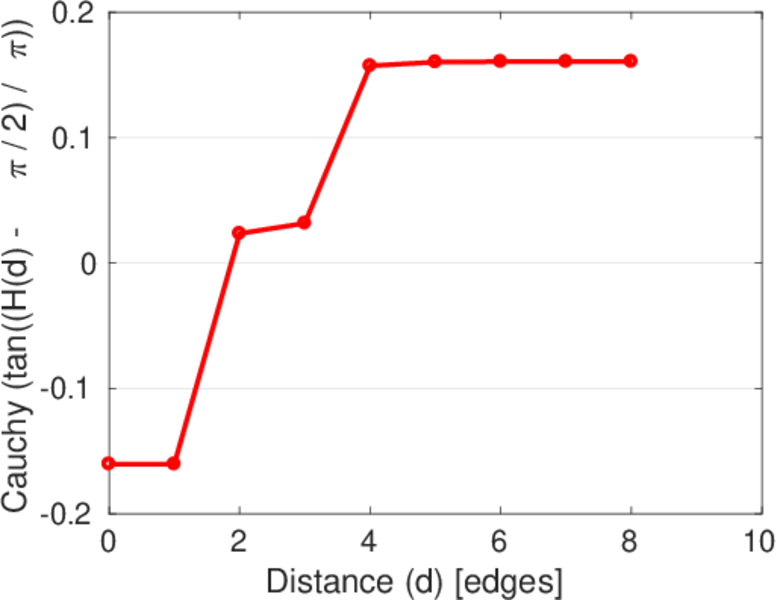
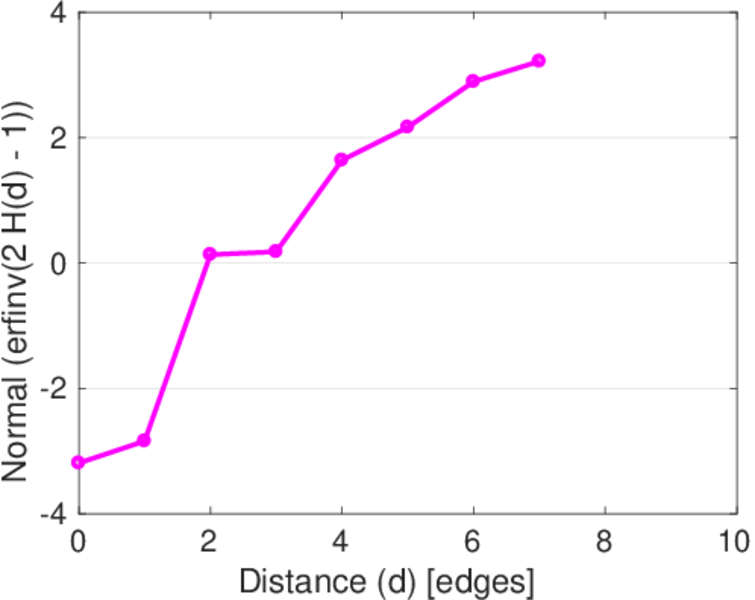
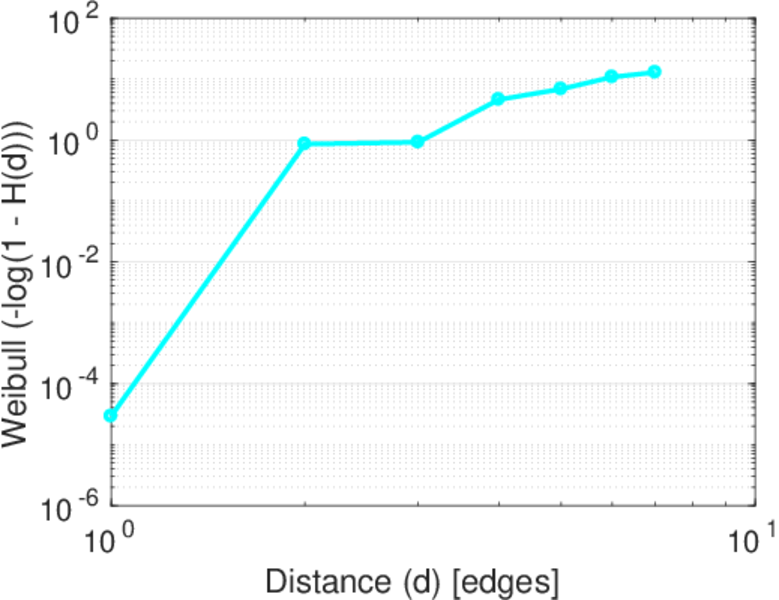
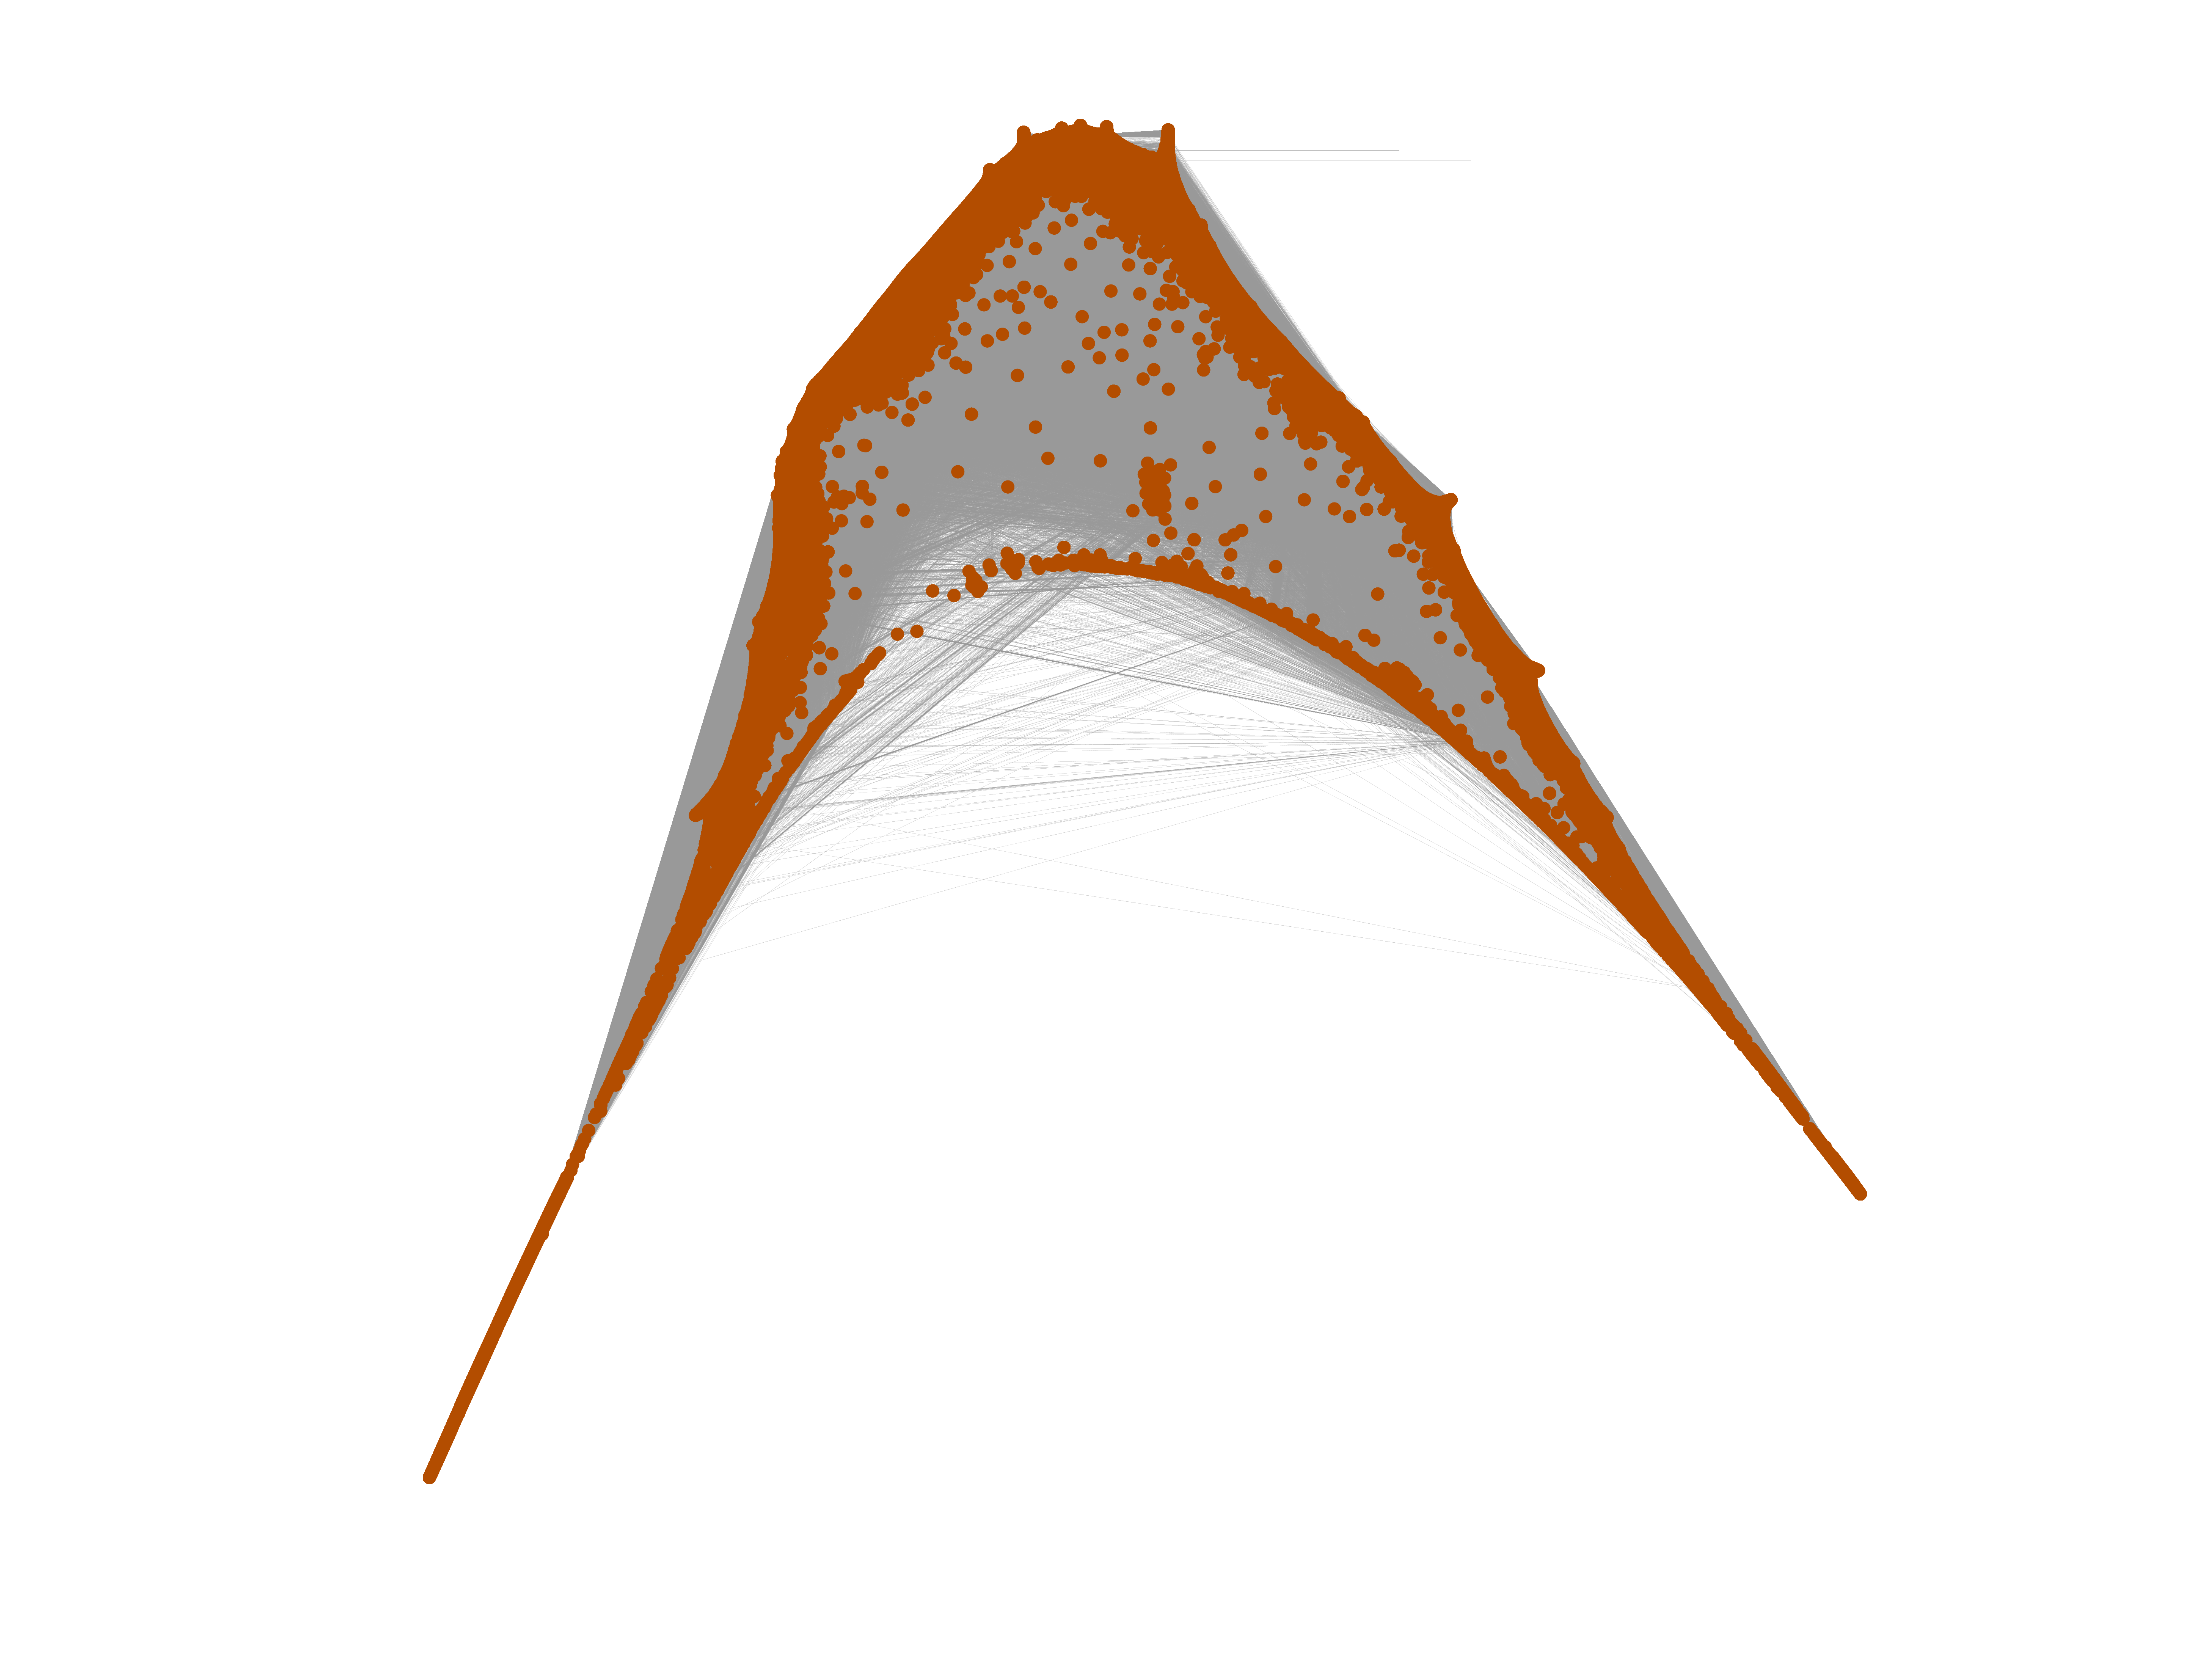
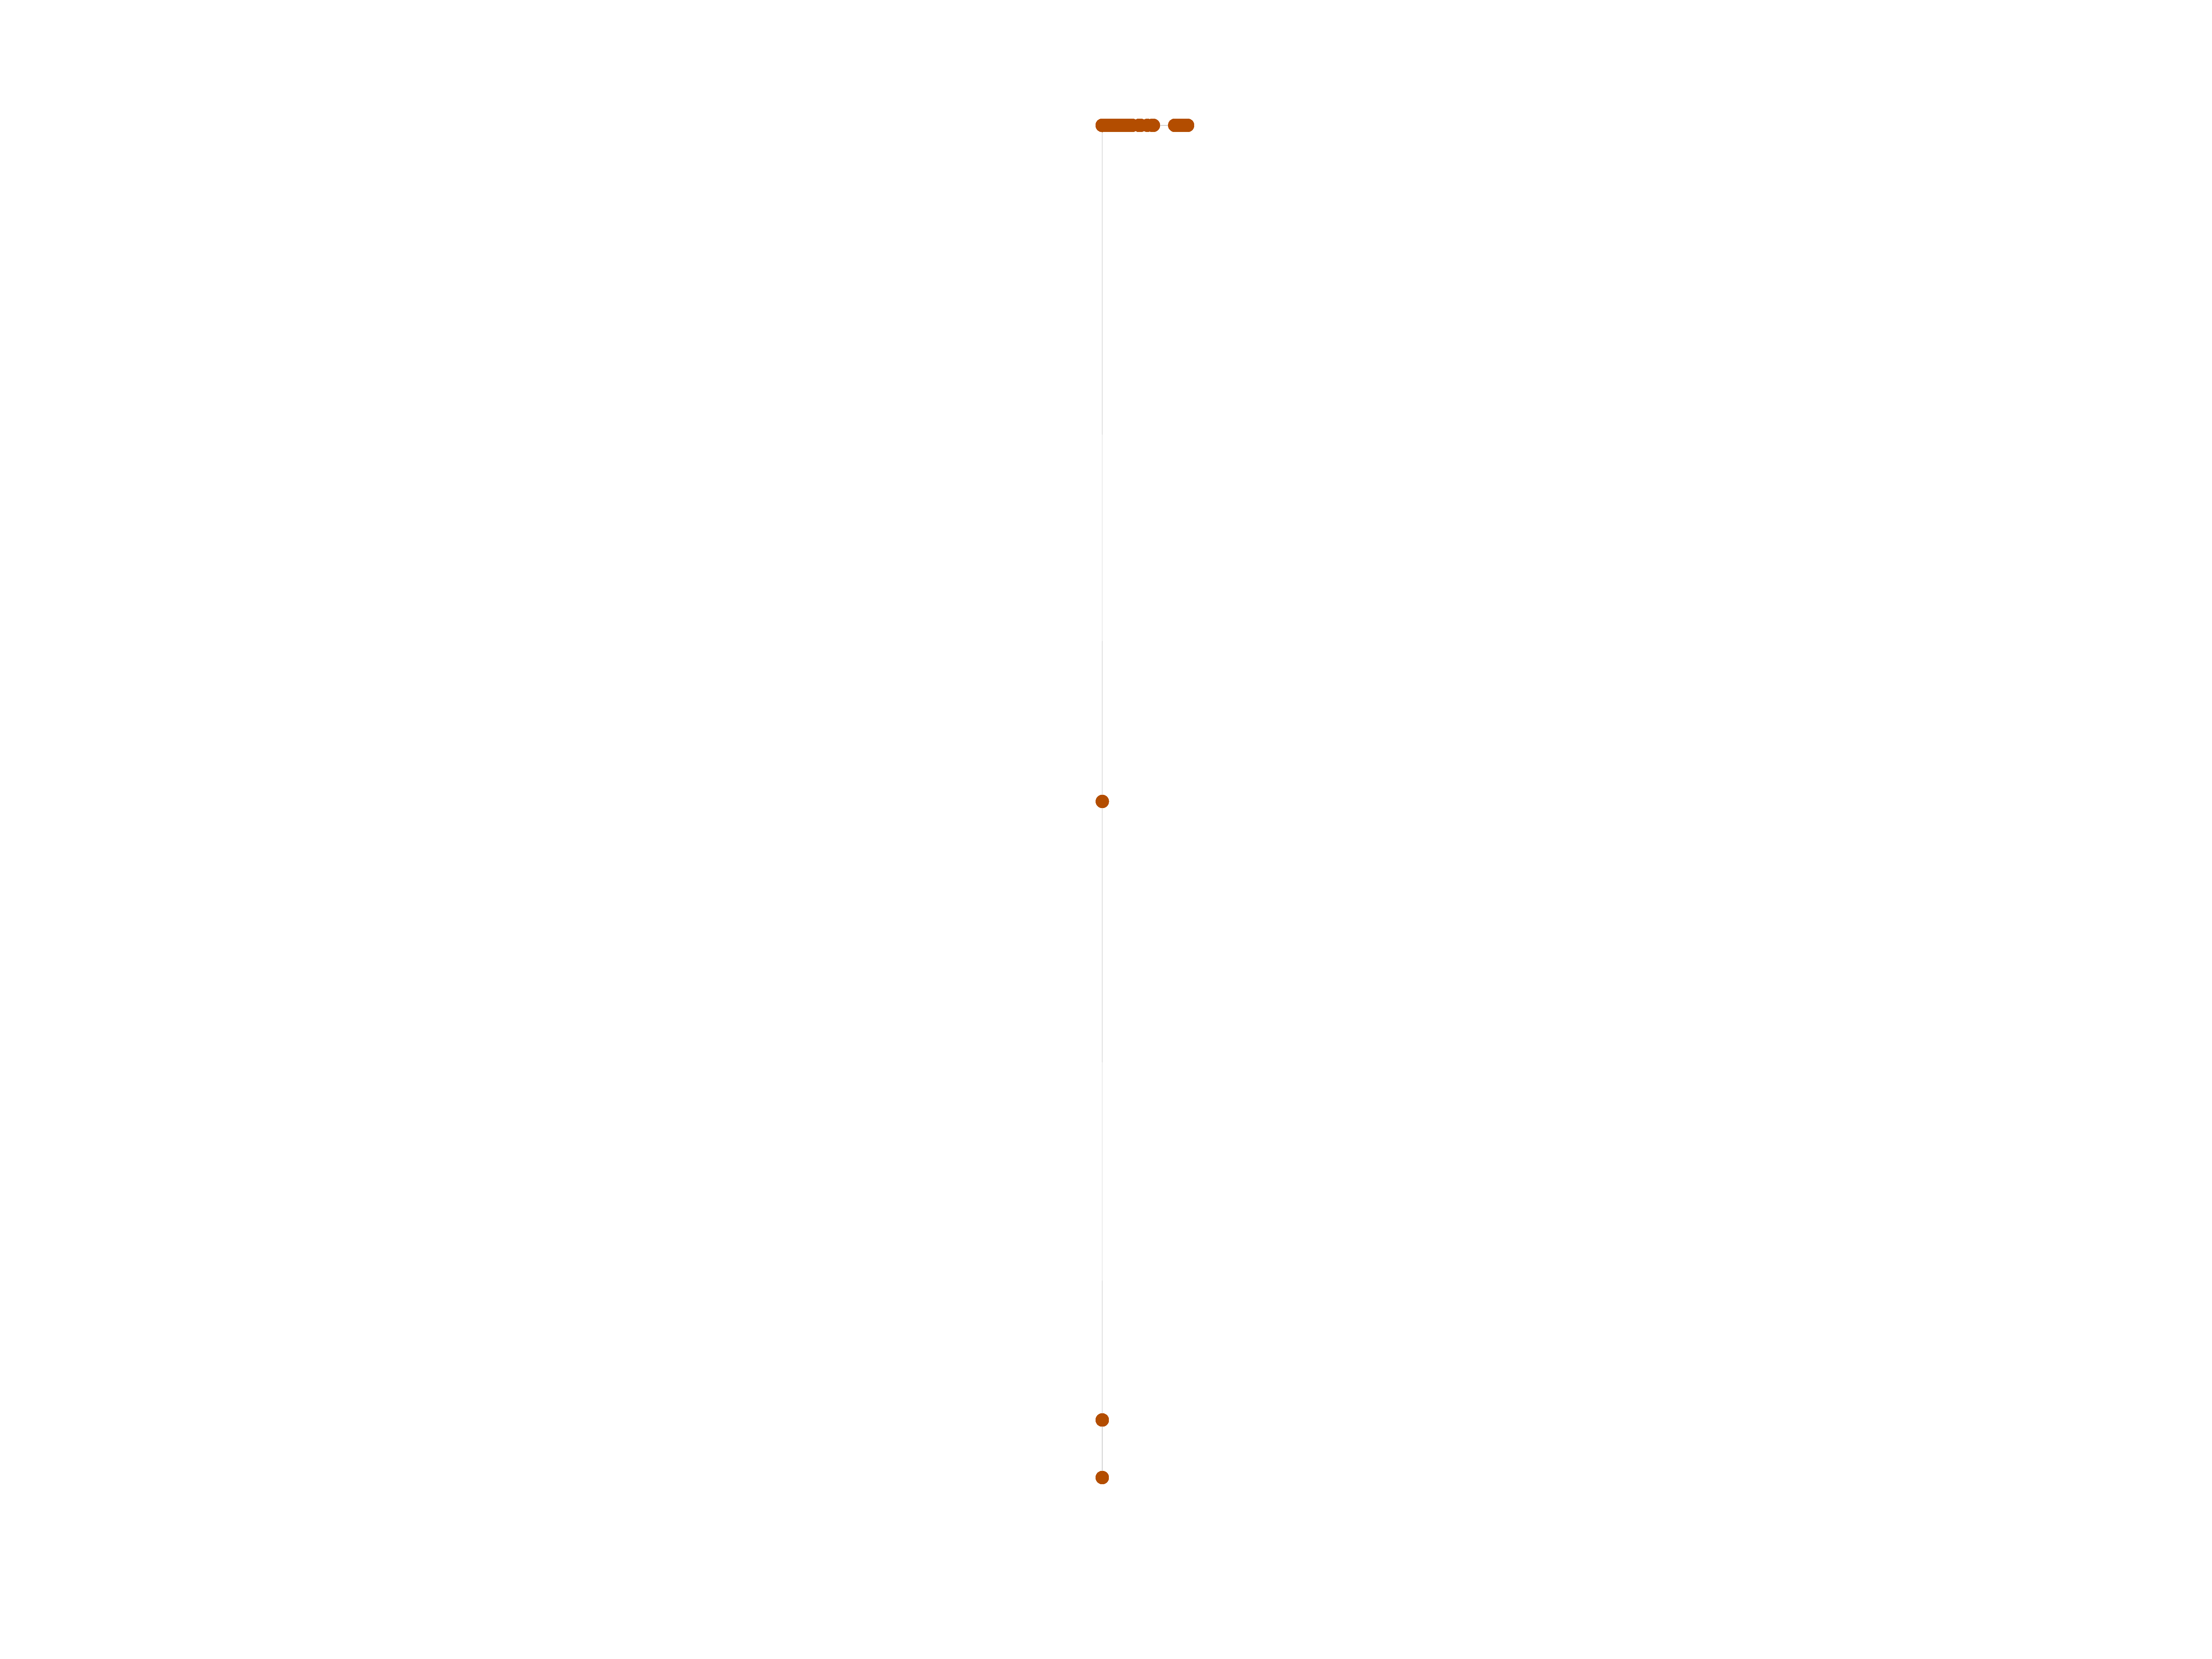
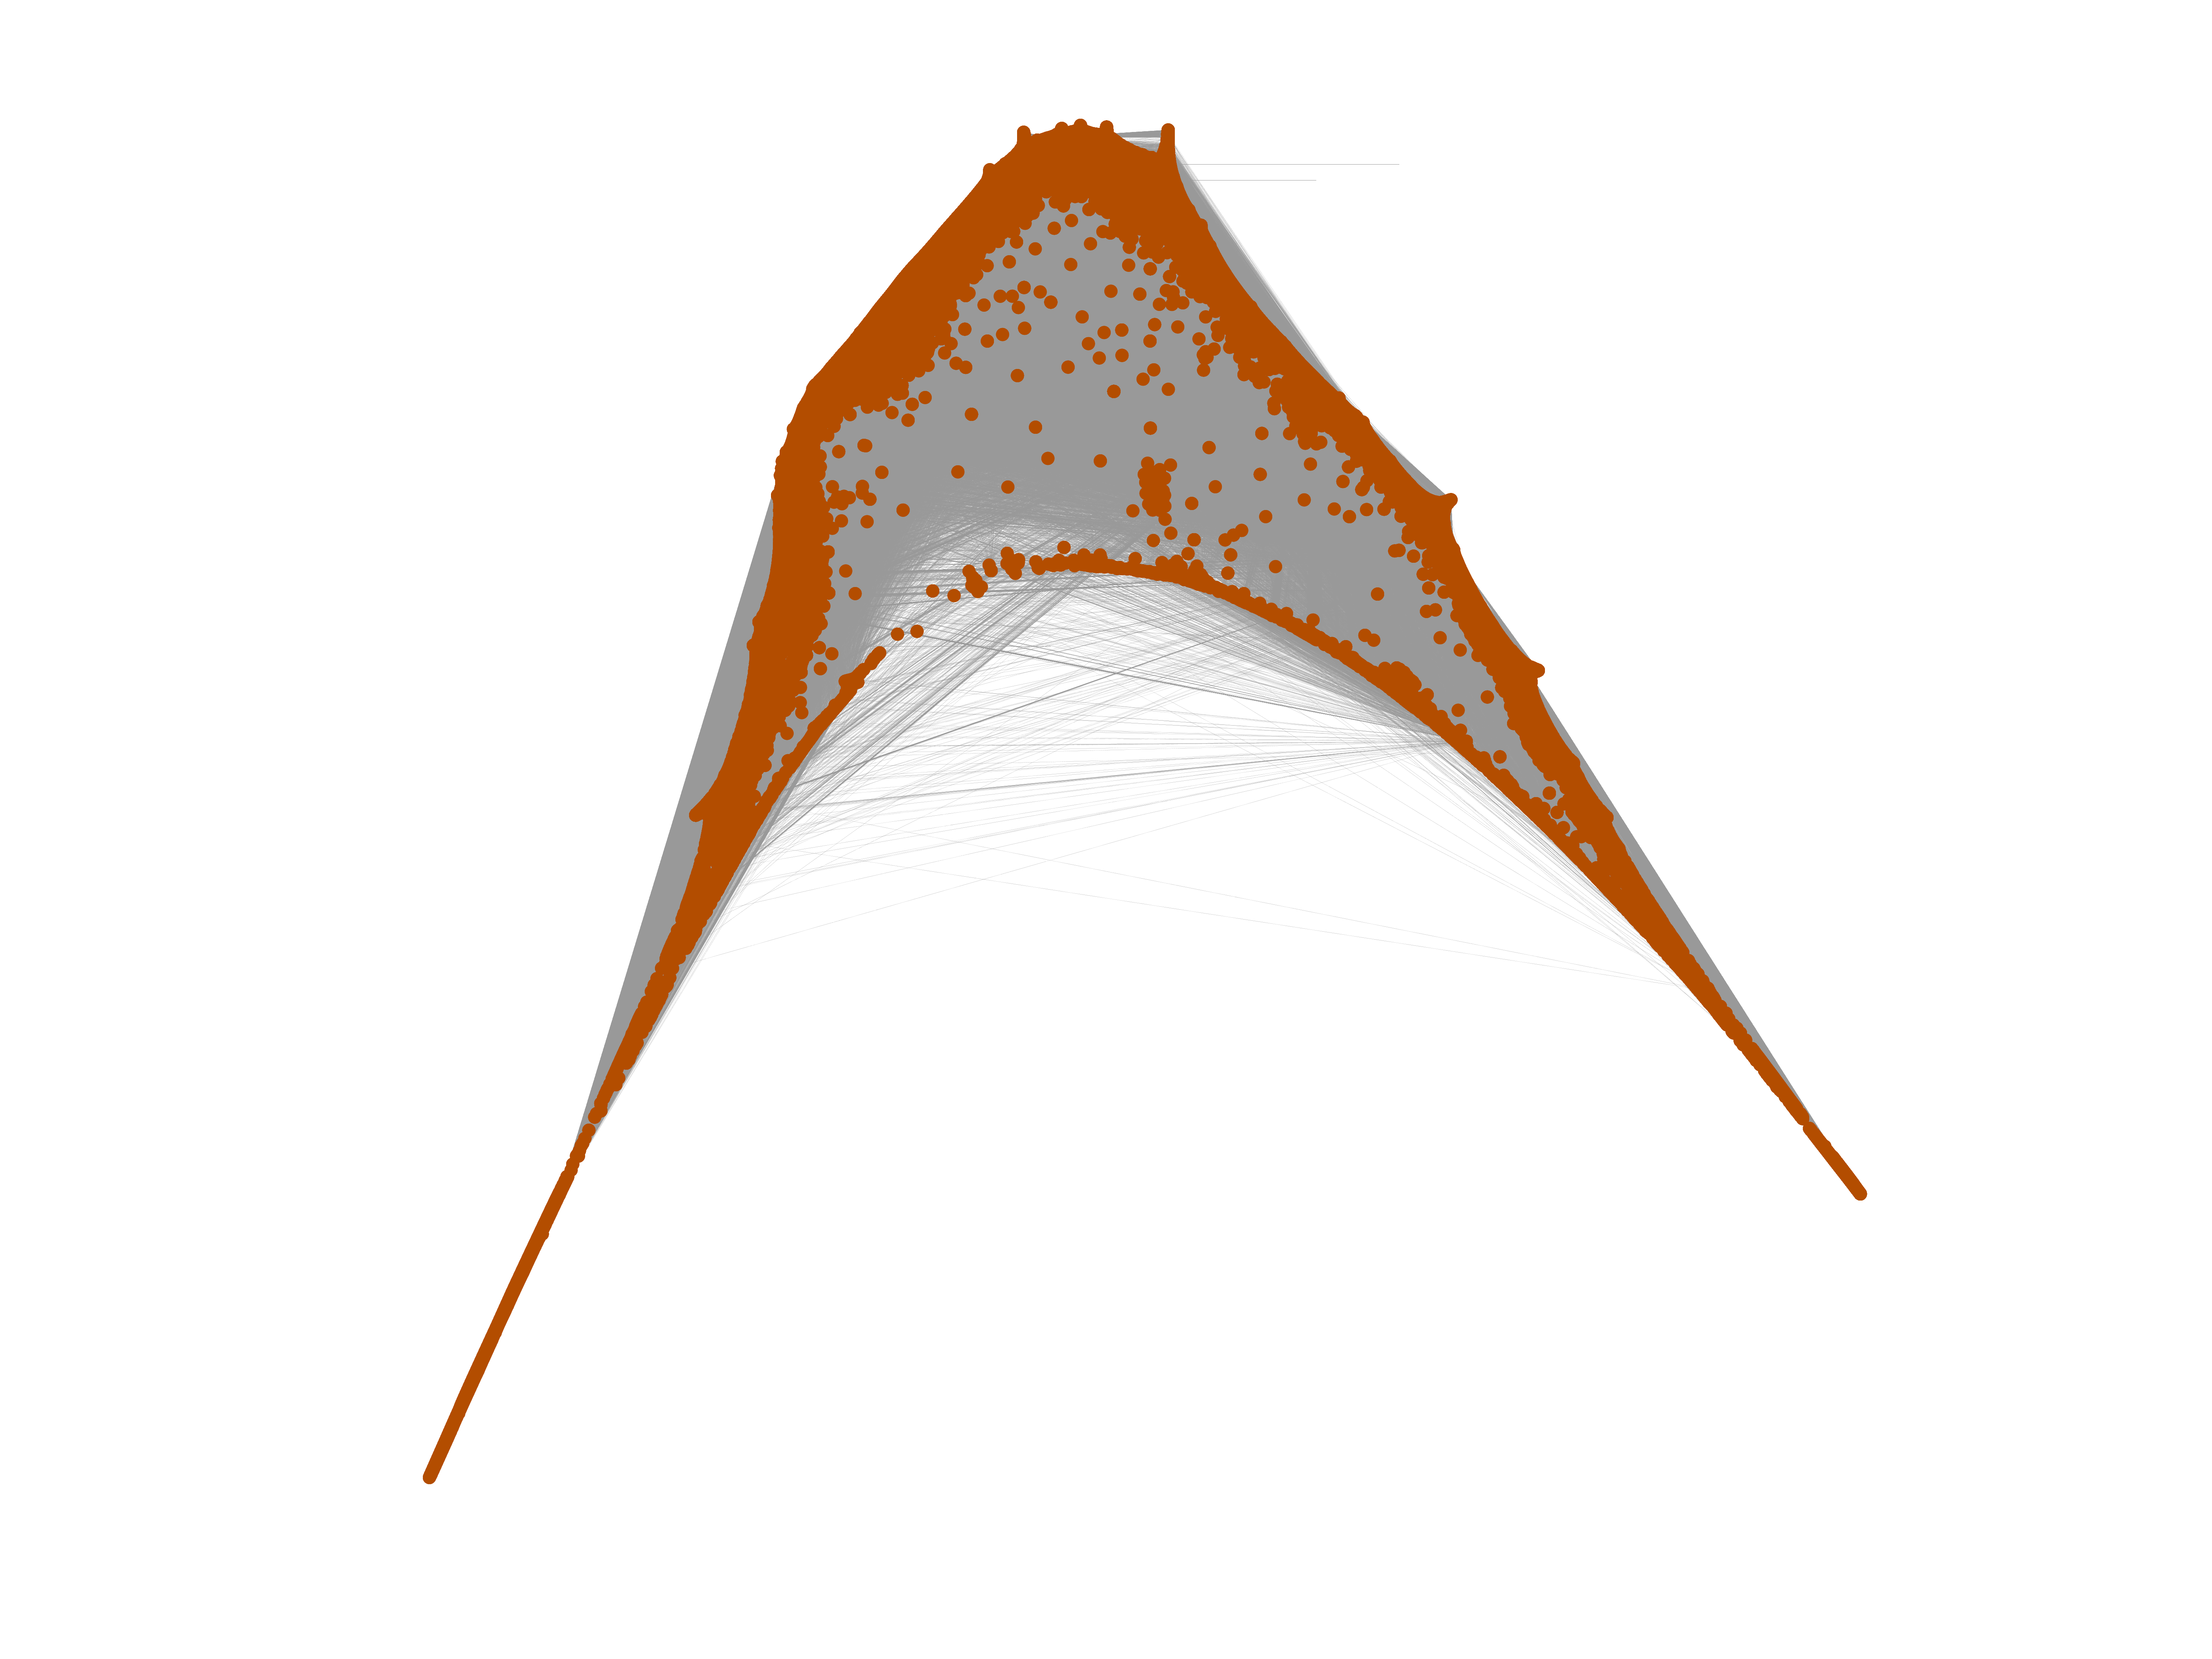
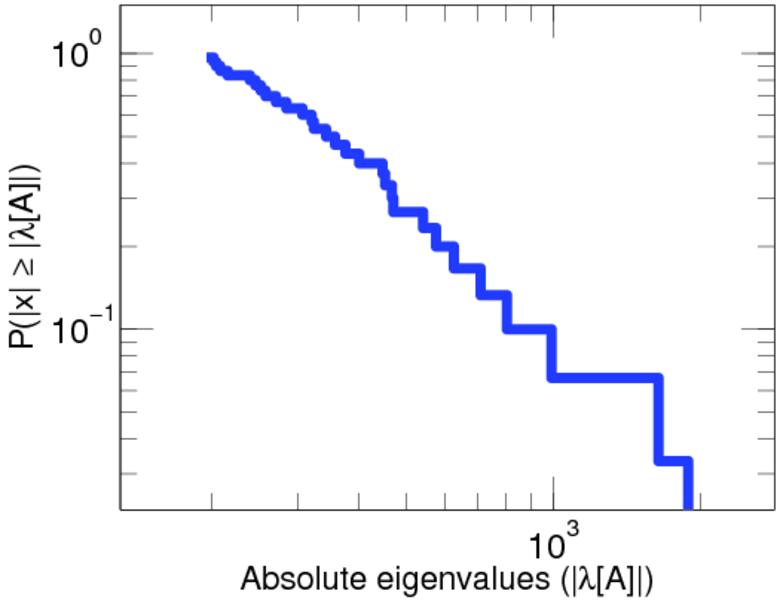
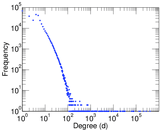
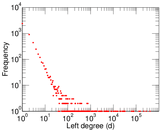
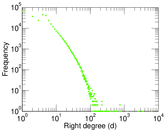
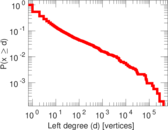
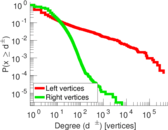
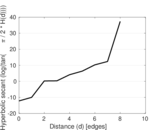
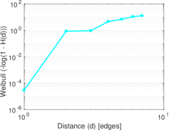
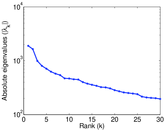
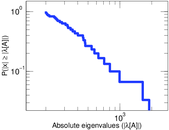
Plots


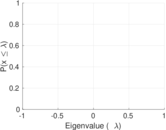
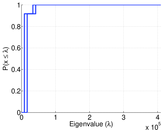

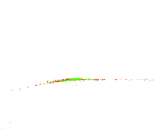
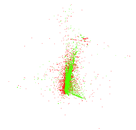


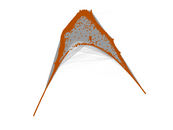


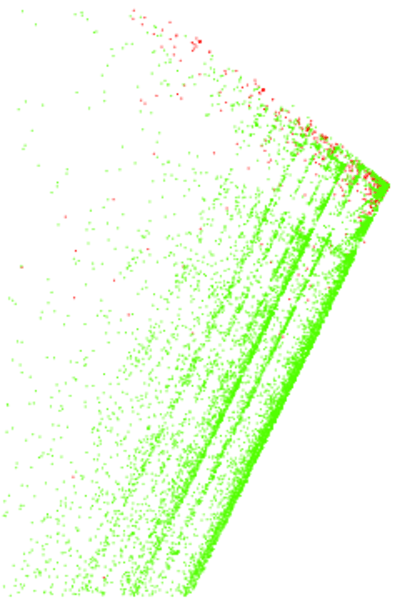
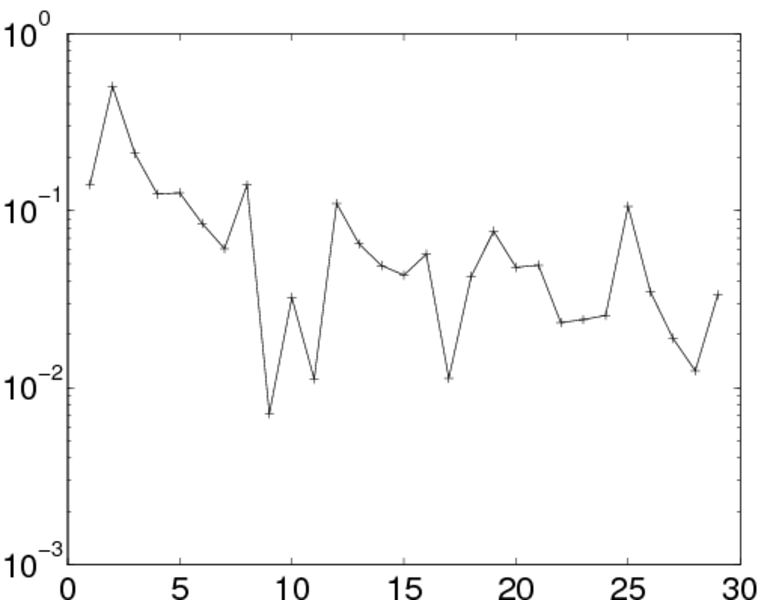
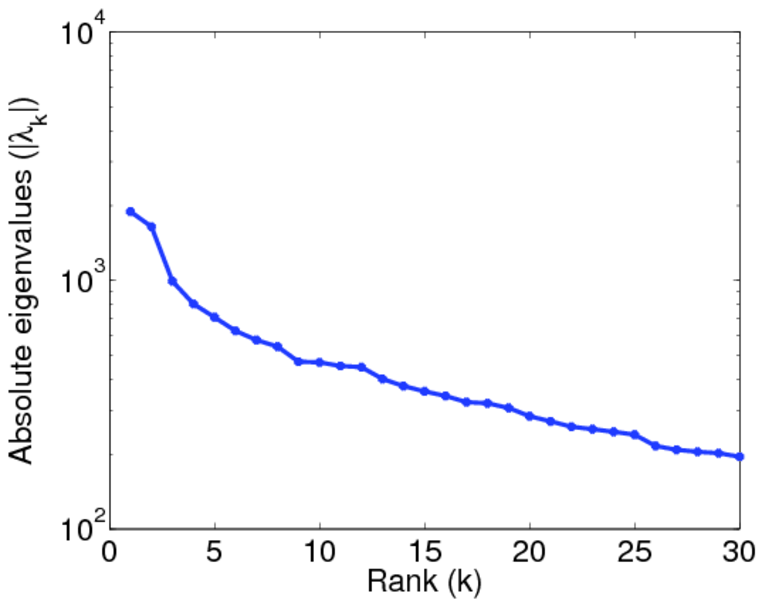
Matrix decompositions plots
Downloads
References
|
[1]
|
Jérôme Kunegis.
KONECT – The Koblenz Network Collection.
In Proc. Int. Conf. on World Wide Web Companion, pages
1343–1350, 2013.
[ http ]
|
|
[2]
|
Wikimedia Foundation.
Wikimedia downloads.
http://dumps.wikimedia.org/, January 2010.
|
 KONECT ‣ Networks ‣
Buy Me a Coffee
KONECT ‣ Networks ‣
Buy Me a Coffee