Wikipedia edits (qu)
This is the bipartite edit network of the Quechua Wikipedia. It contains users
and pages from the Quechua Wikipedia, connected by edit events. Each edge
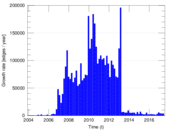
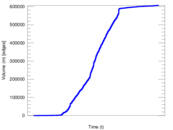
represents an edit. The dataset includes the timestamp of each edit.
Metadata
Statistics
| Size | n = | 53,539
|
| Left size | n1 = | 2,063
|
| Right size | n2 = | 51,476
|
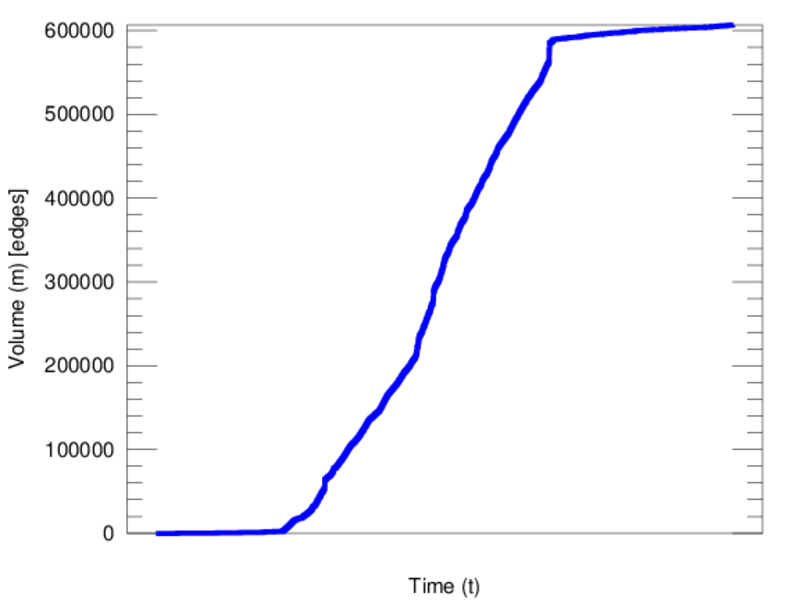
| Volume | m = | 606,625
|
| Unique edge count | m̿ = | 297,718
|
| Wedge count | s = | 1,403,943,901
|
| Claw count | z = | 6,922,768,722,327
|
| Cross count | x = | 30,064,865,031,312,492
|
| Square count | q = | 2,866,909,009
|
| 4-Tour count | T4 = | 28,551,985,664
|
| Maximum degree | dmax = | 60,887
|
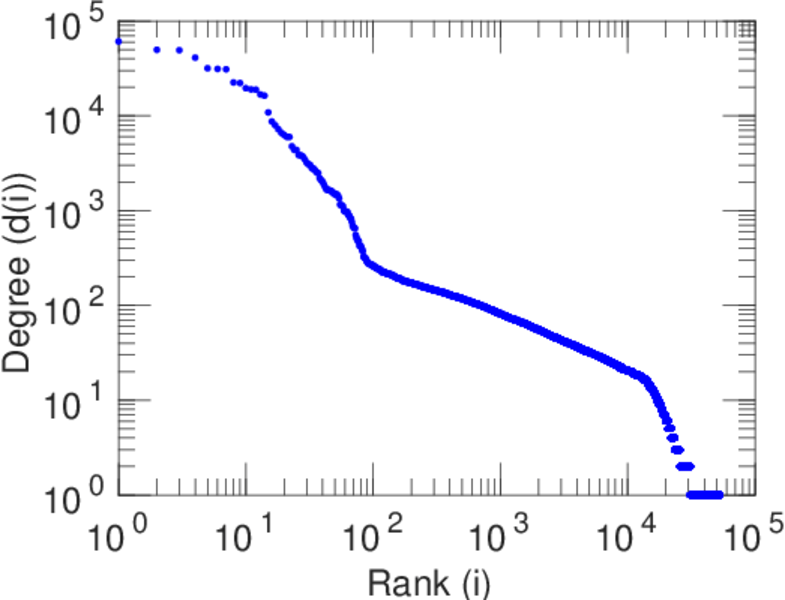
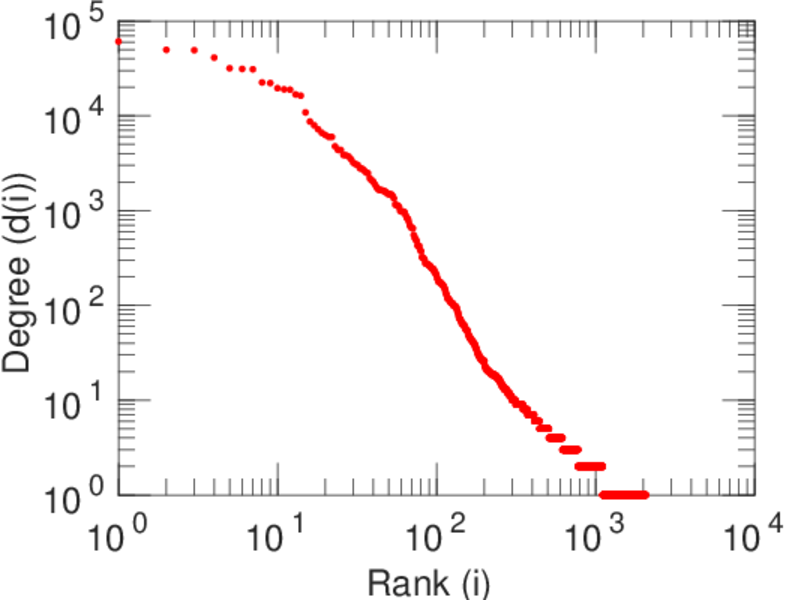
| Maximum left degree | d1max = | 60,887
|
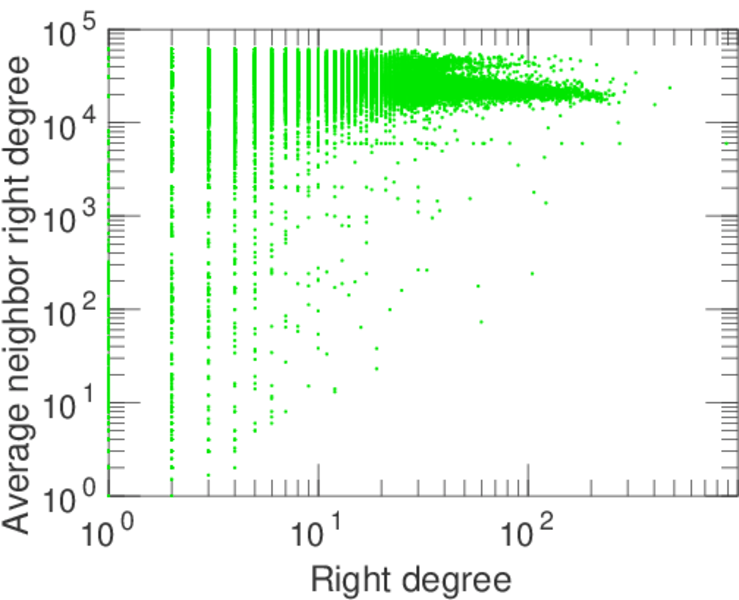
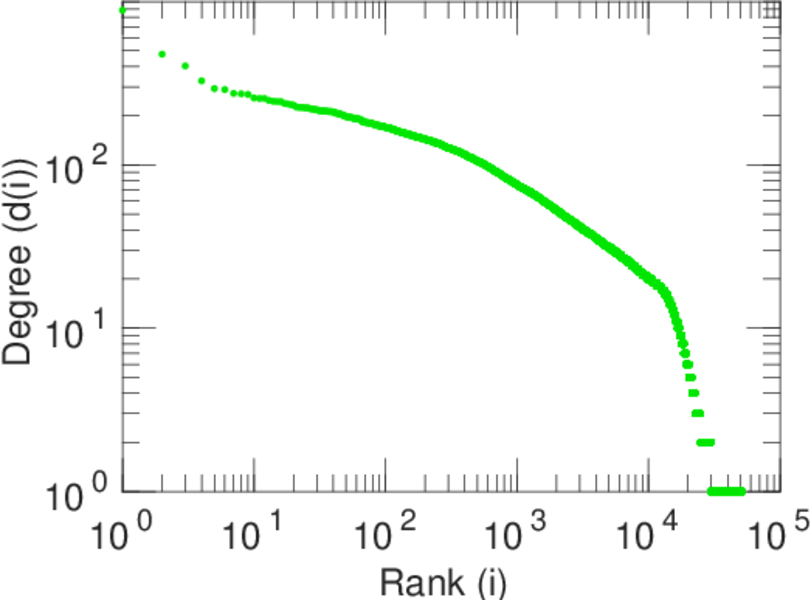
| Maximum right degree | d2max = | 885
|
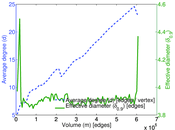
| Average degree | d = | 22.661 1
|
| Average left degree | d1 = | 294.050
|
| Average right degree | d2 = | 11.784 6
|
| Fill | p = | 0.002 803 50
|
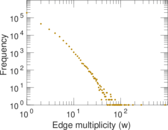
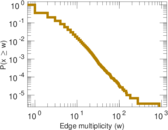
| Average edge multiplicity | m̃ = | 2.037 58
|
| Size of LCC | N = | 52,526
|
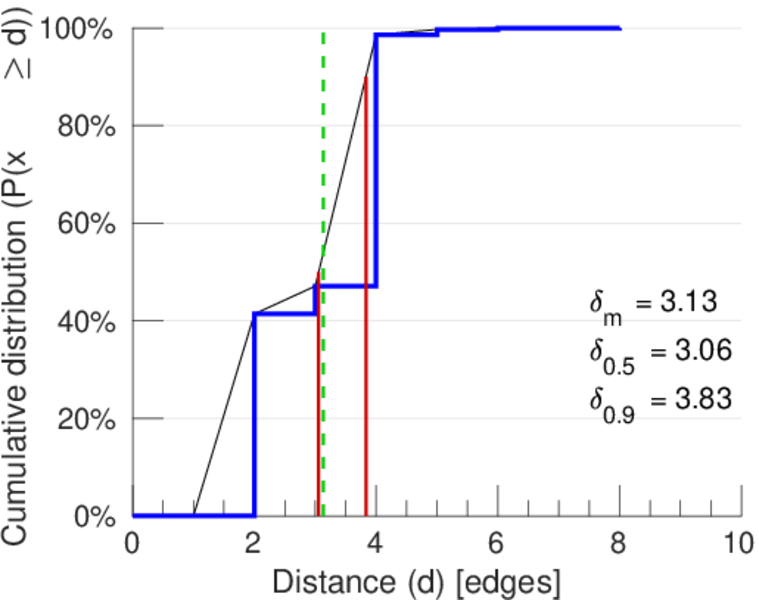
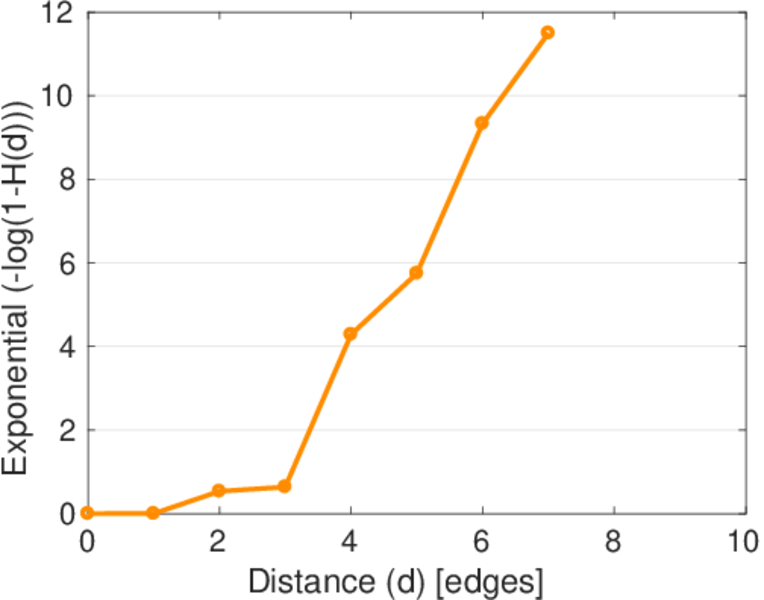
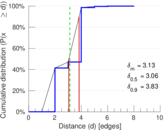
| Diameter | δ = | 10
|
| 50-Percentile effective diameter | δ0.5 = | 3.056 36
|
| 90-Percentile effective diameter | δ0.9 = | 3.832 63
|
| Median distance | δM = | 4
|
| Mean distance | δm = | 3.131 95
|
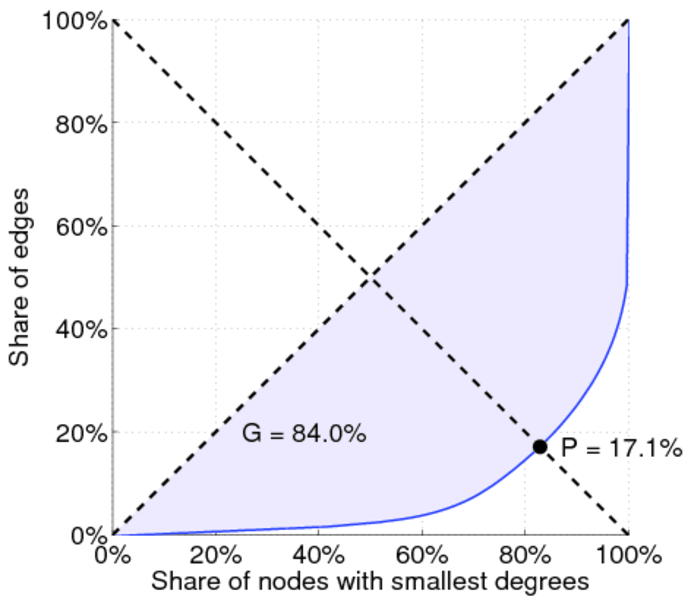
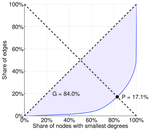
| Gini coefficient | G = | 0.838 429
|
| Balanced inequality ratio | P = | 0.173 625
|
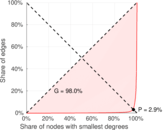
| Left balanced inequality ratio | P1 = | 0.028 666 8
|
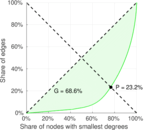
| Right balanced inequality ratio | P2 = | 0.231 517
|
| Relative edge distribution entropy | Her = | 0.718 069
|
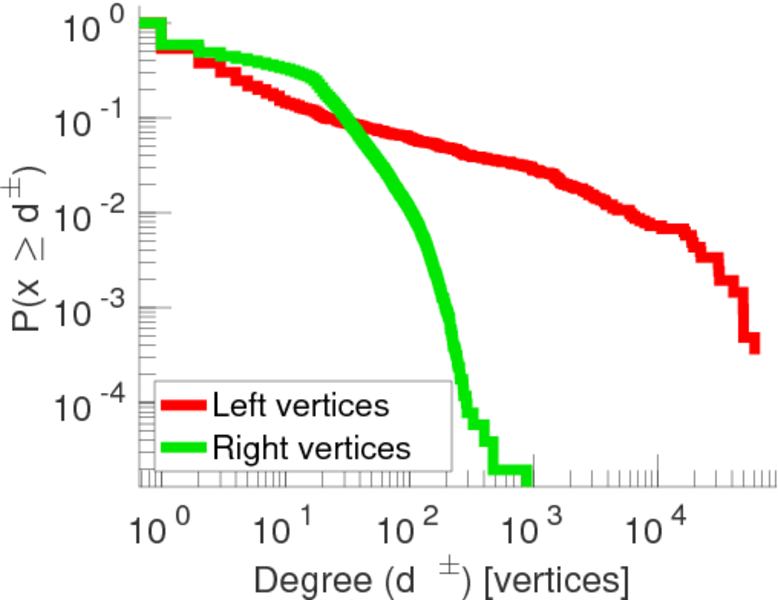
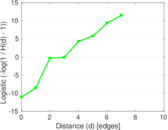
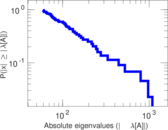
| Power law exponent | γ = | 1.955 13
|
| Tail power law exponent | γt = | 3.151 00
|
| Tail power law exponent with p | γ3 = | 3.151 00
|
| p-value | p = | 0.000 00
|
| Left tail power law exponent with p | γ3,1 = | 1.691 00
|
| Left p-value | p1 = | 0.000 00
|
| Right tail power law exponent with p | γ3,2 = | 3.411 00
|
| Right p-value | p2 = | 0.000 00
|
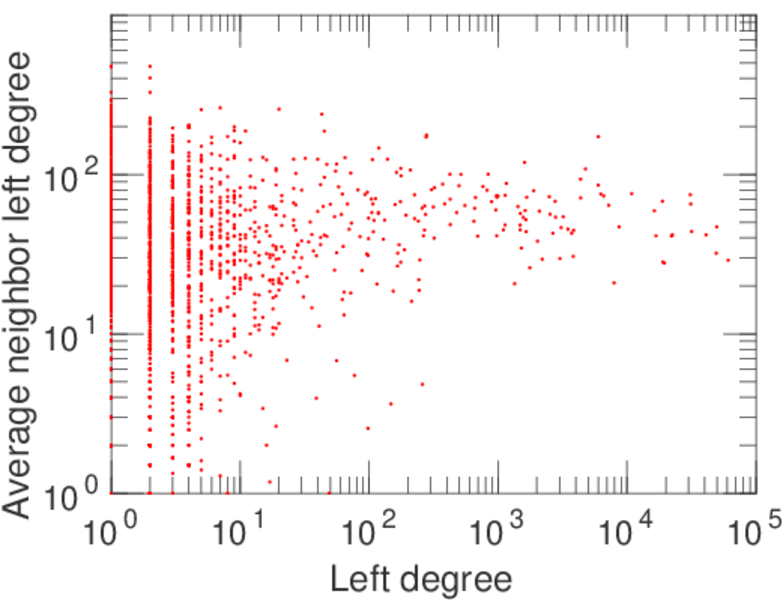
| Degree assortativity | ρ = | −0.370 257
|
| Degree assortativity p-value | pρ = | 0.000 00
|
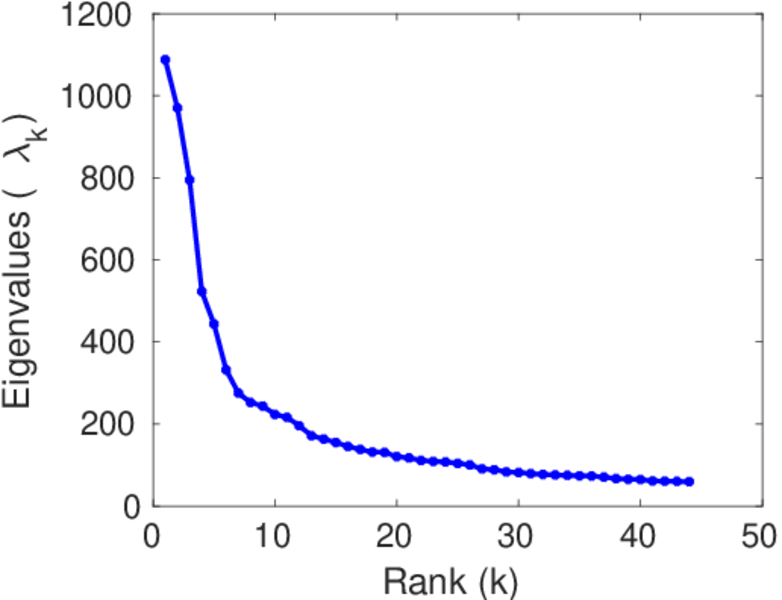
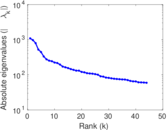
| Spectral norm | α = | 1,088.01
|
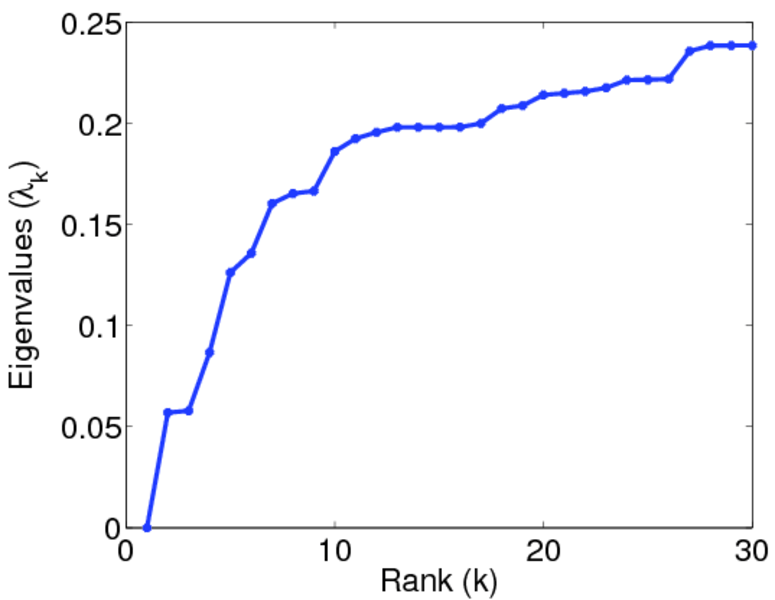
| Algebraic connectivity | a = | 0.056 955 9
|
| Controllability | C = | 49,245
|
| Relative controllability | Cr = | 0.926 494
|
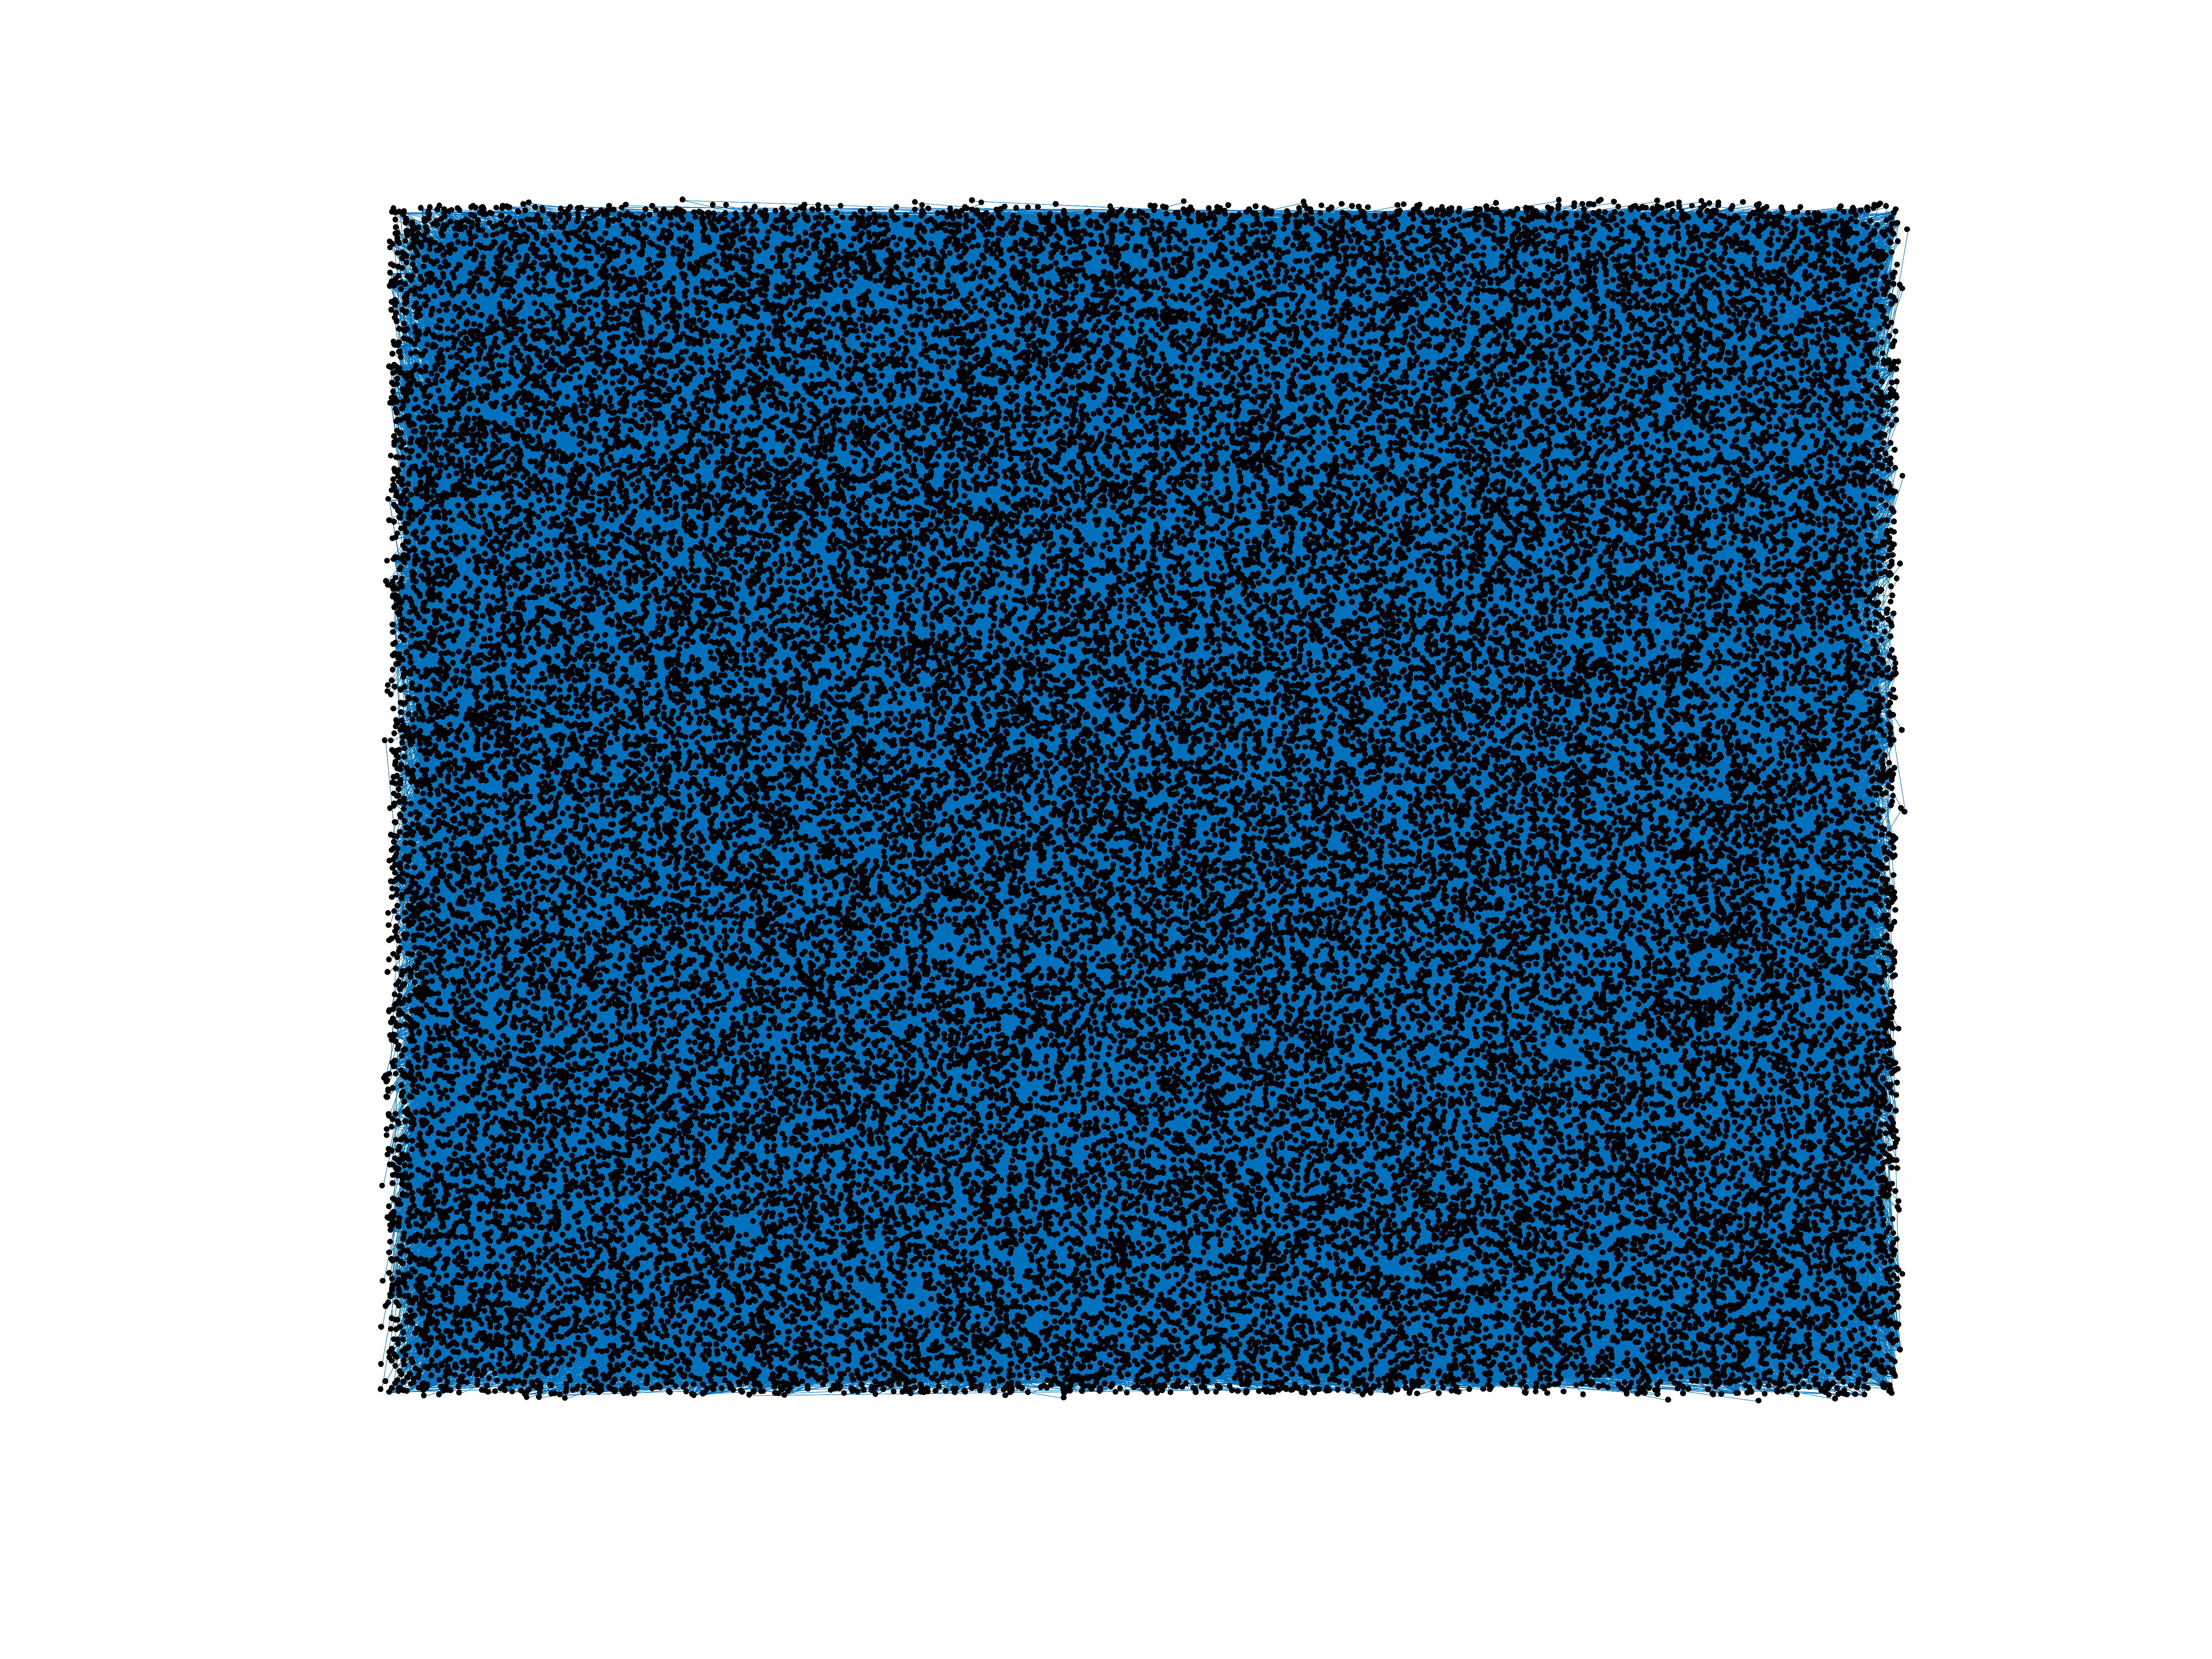
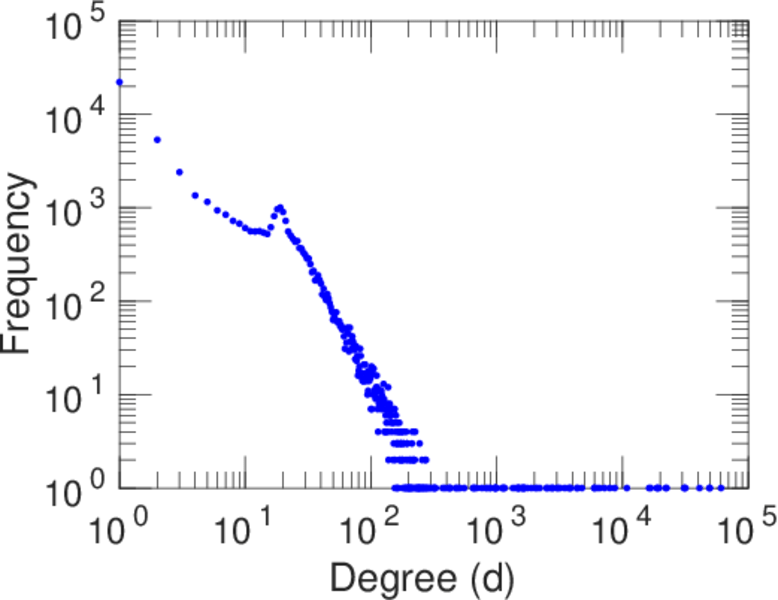
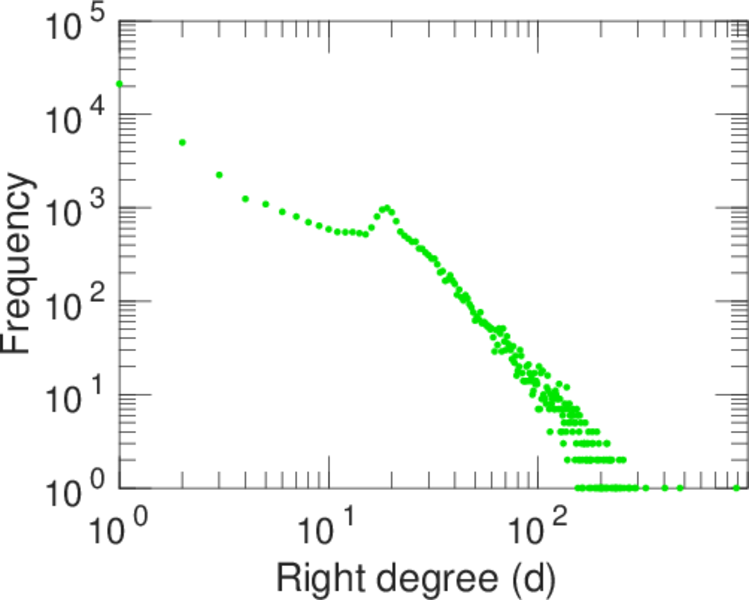
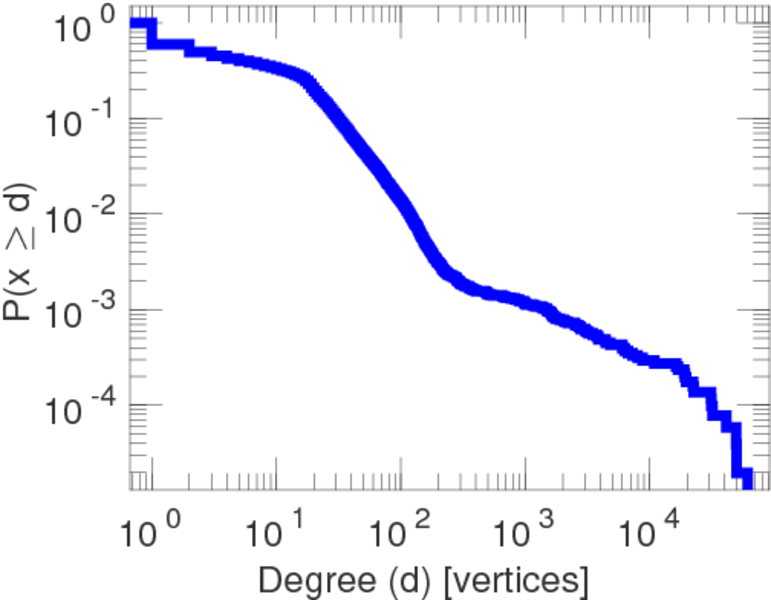
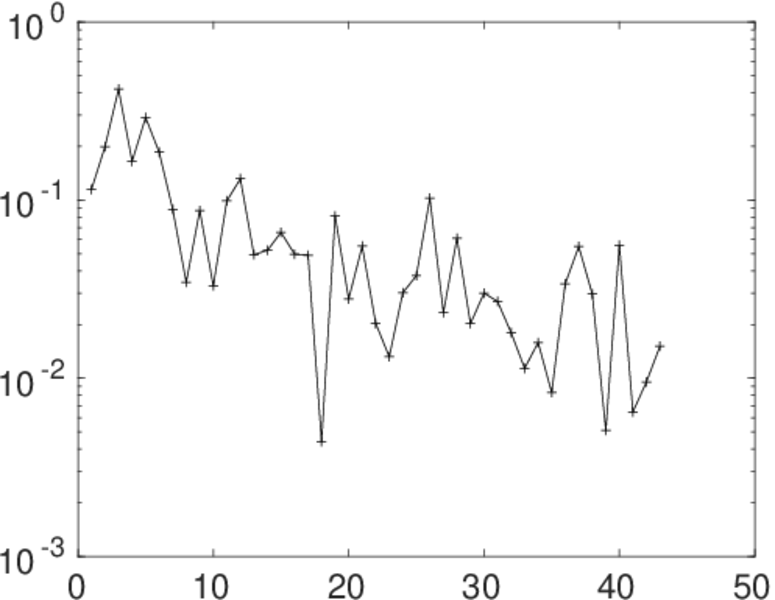
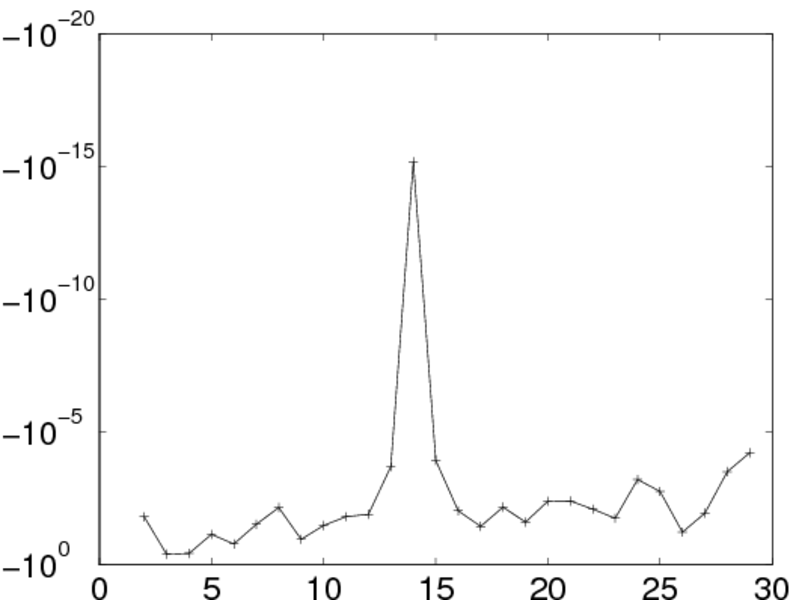
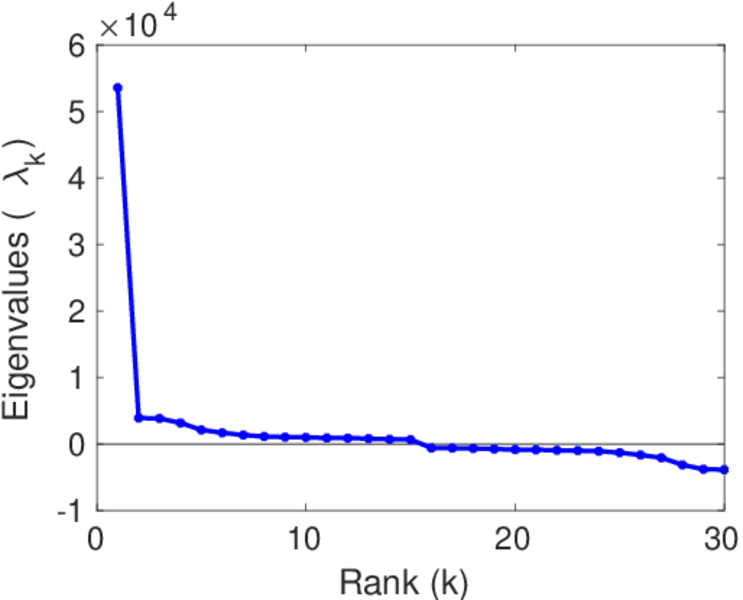
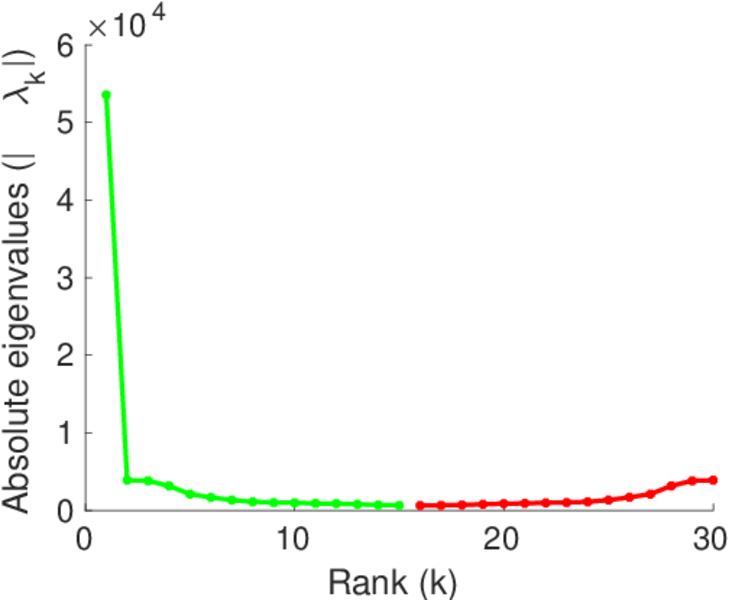
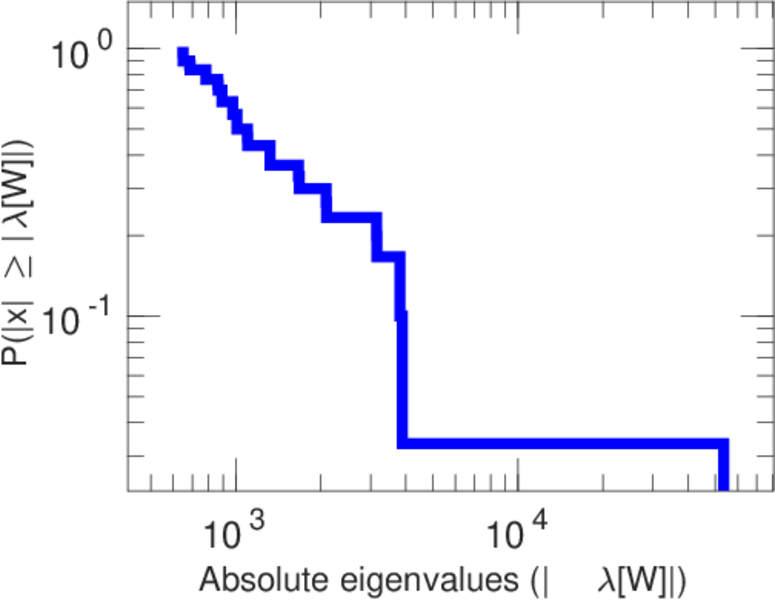
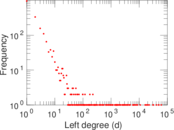
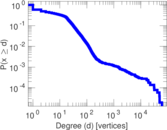
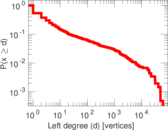
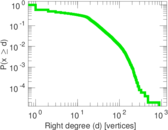
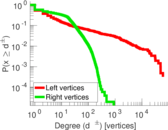
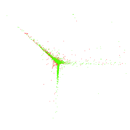
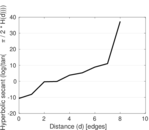
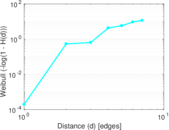
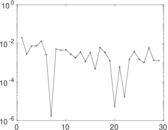
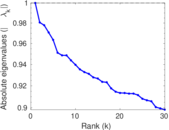
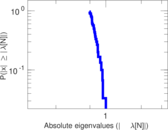
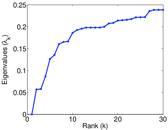
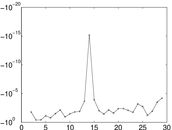
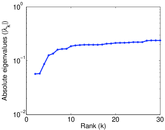
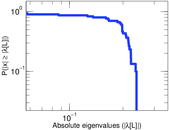
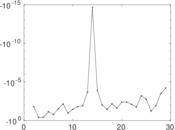
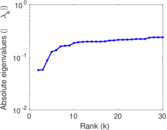
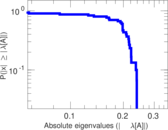
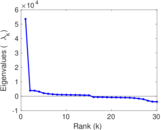
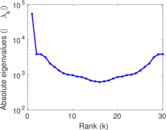
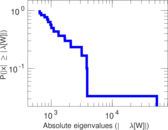
Plots


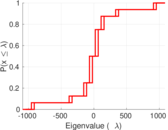
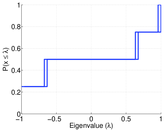
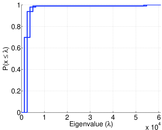
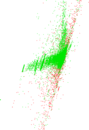


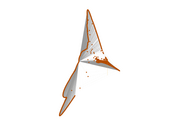
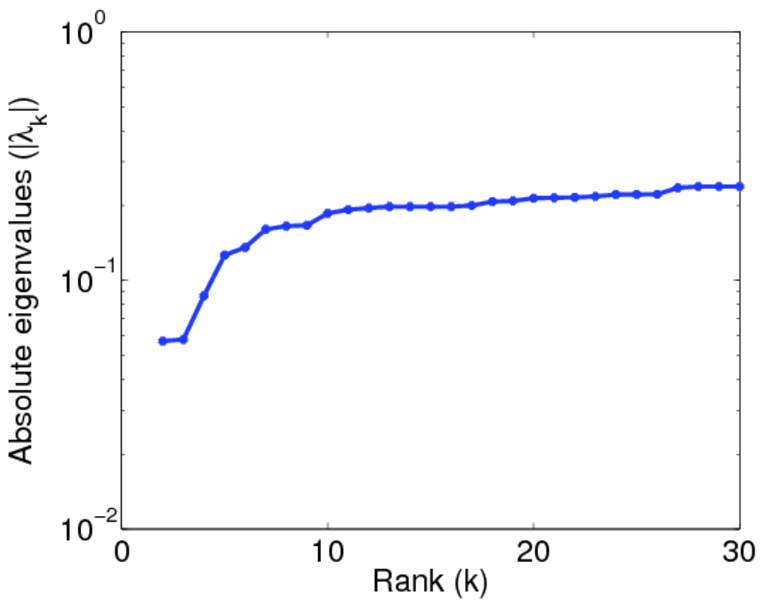
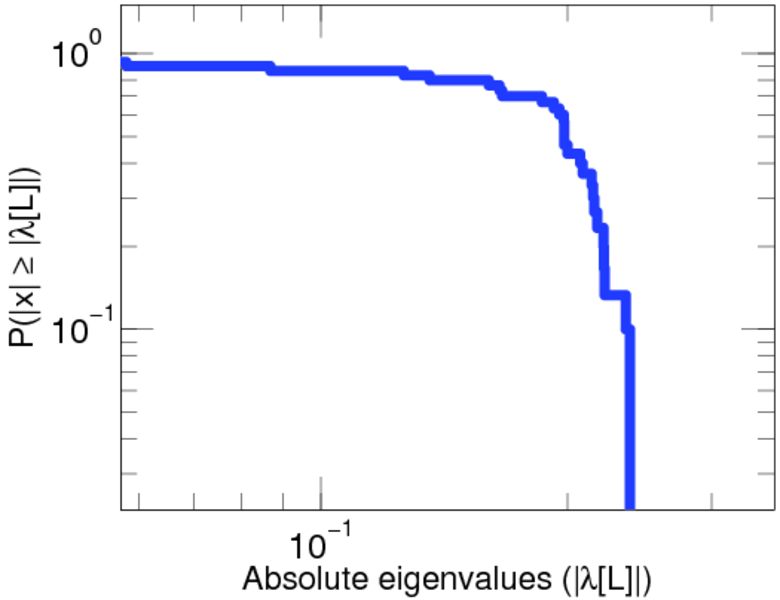
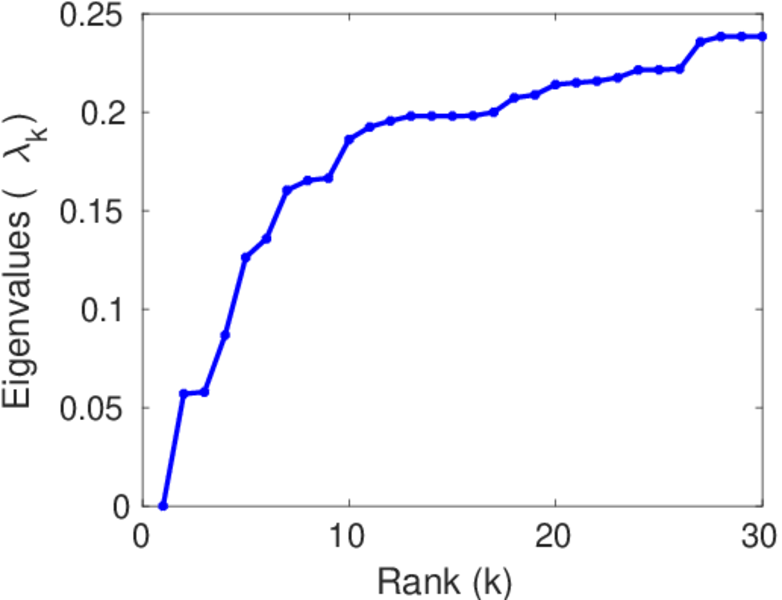
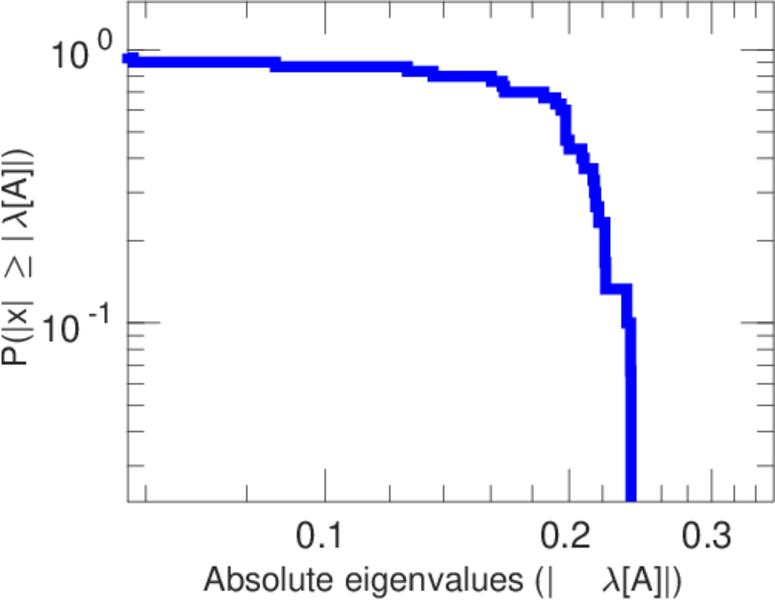
Matrix decompositions plots


Downloads
References
|
[1]
|
Jérôme Kunegis.
KONECT – The Koblenz Network Collection.
In Proc. Int. Conf. on World Wide Web Companion, pages
1343–1350, 2013.
[ http ]
|
|
[2]
|
Wikimedia Foundation.
Wikimedia downloads.
http://dumps.wikimedia.org/, January 2010.
|
 KONECT ‣ Networks ‣
Buy Me a Coffee
KONECT ‣ Networks ‣
Buy Me a Coffee