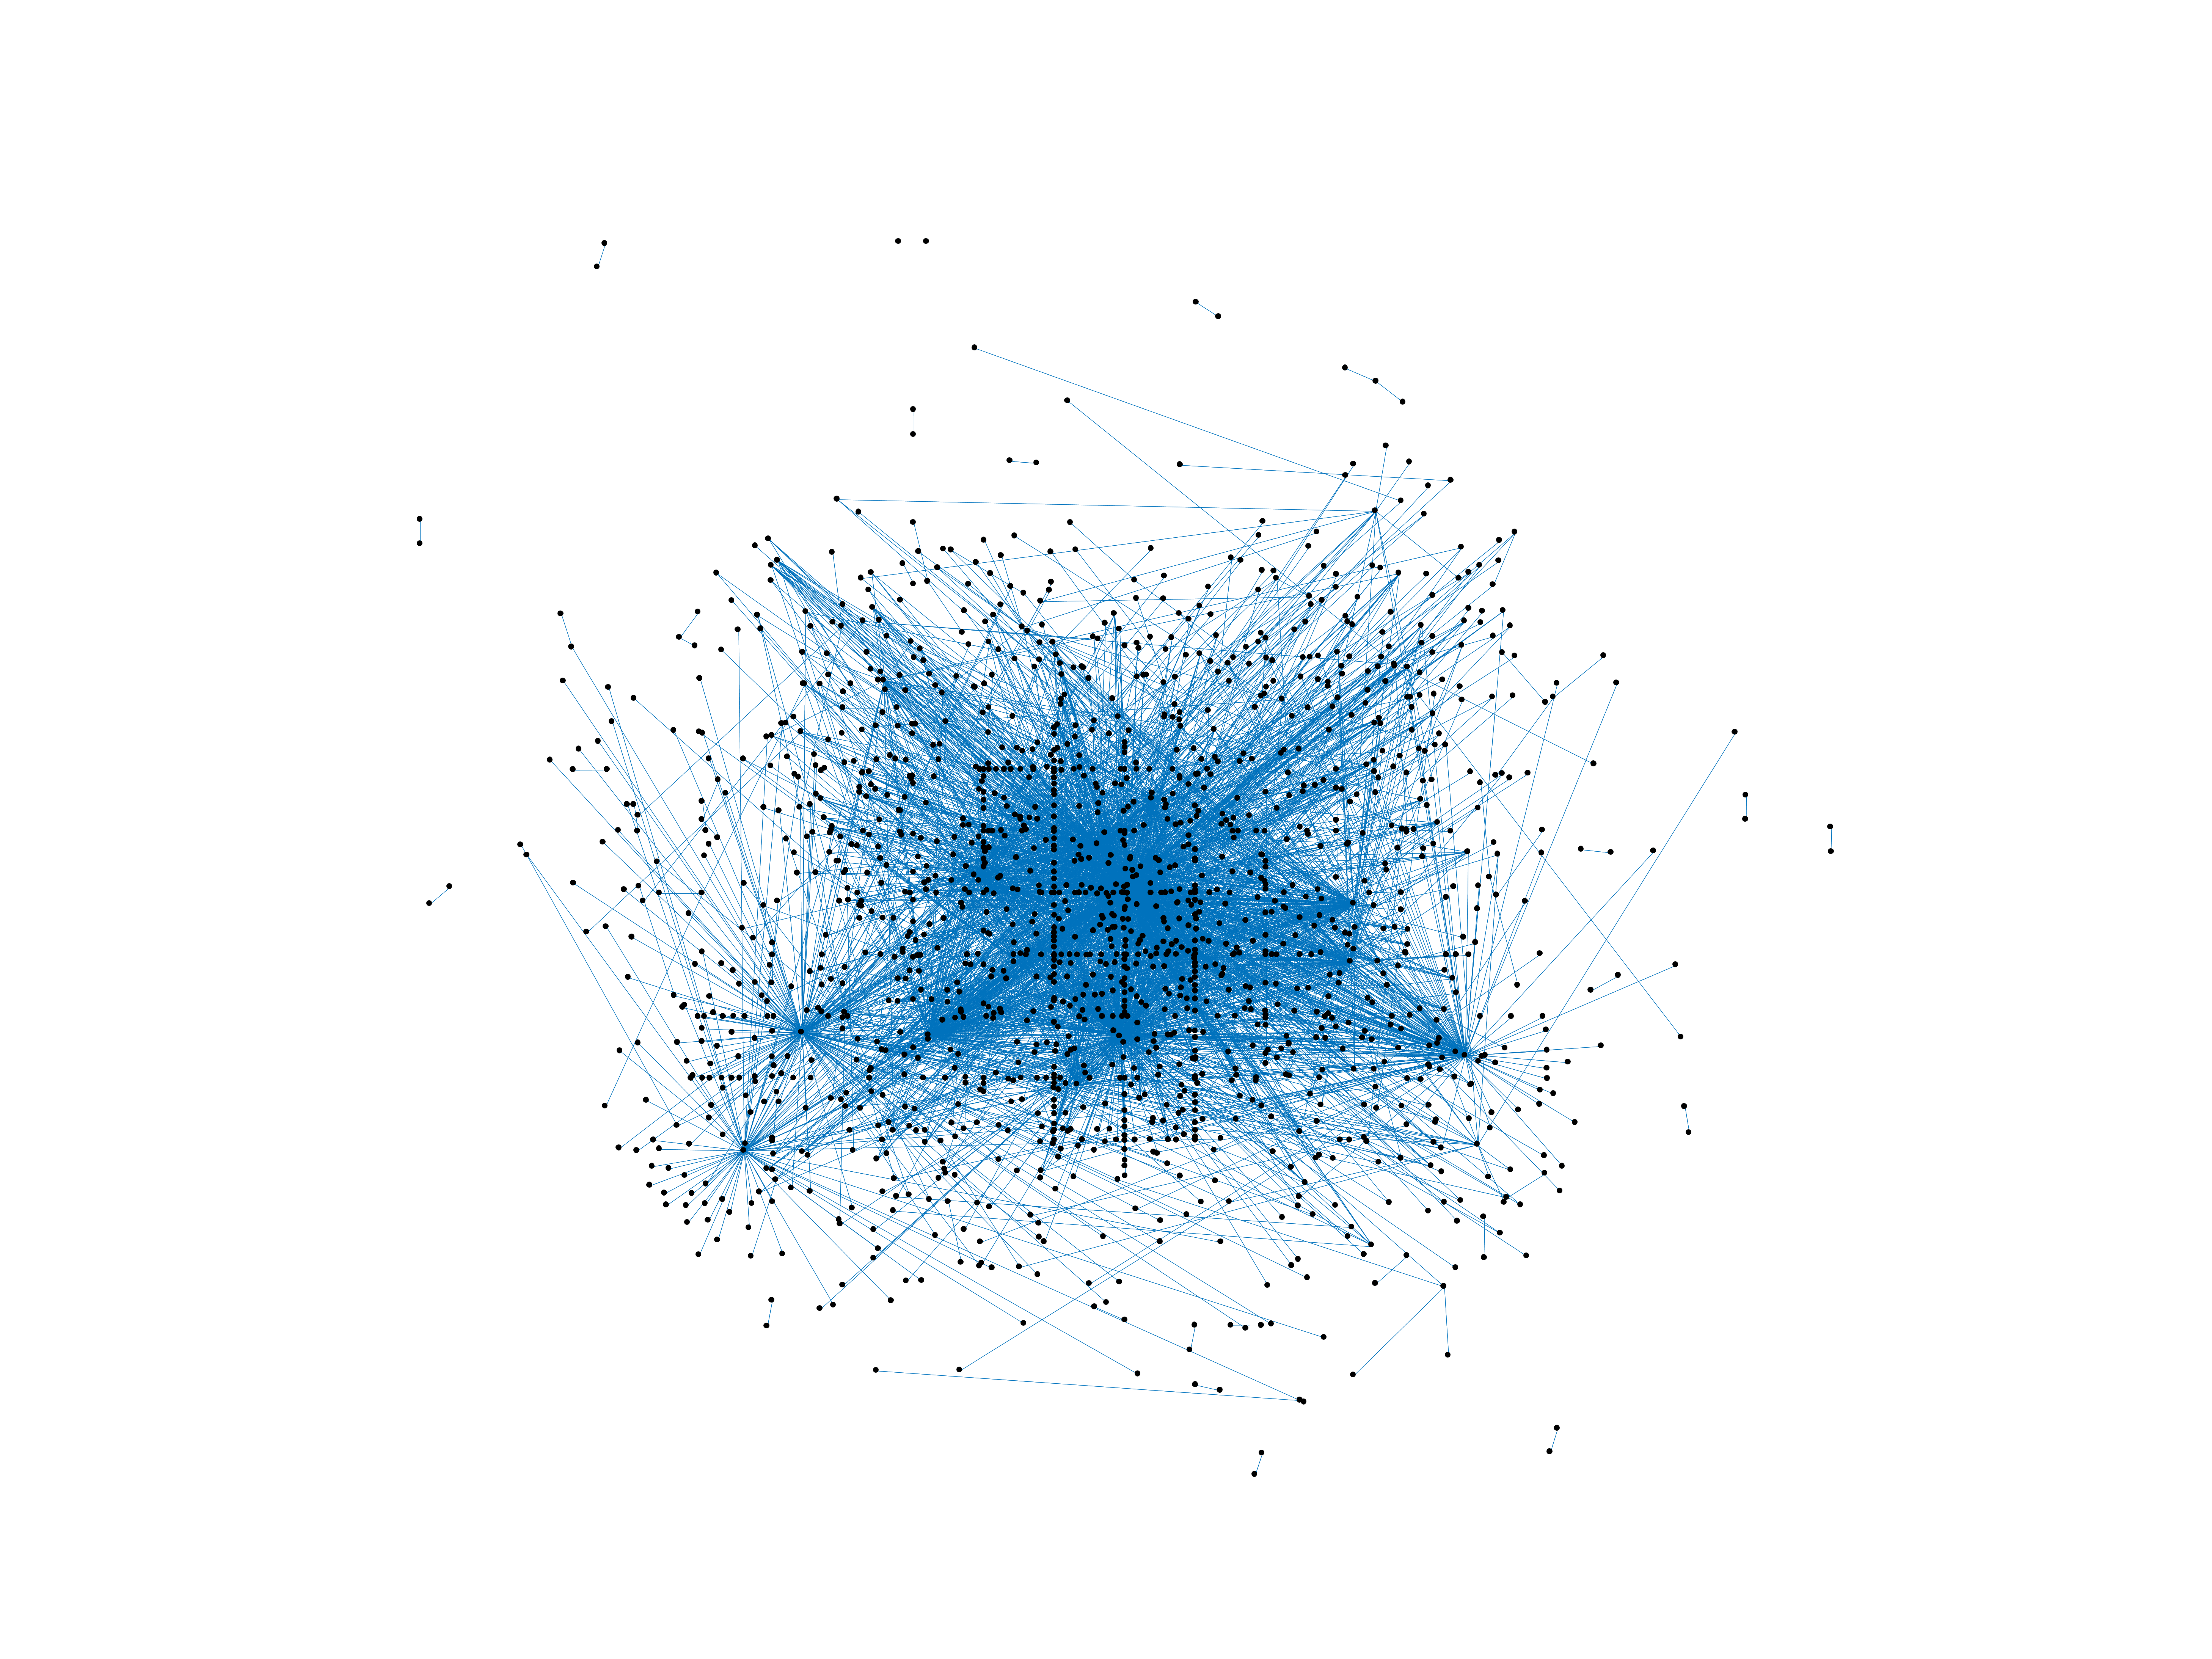
Wiktionary edits (qu)
This is the bipartite edit network of the Quechua Wiktionary. It contains users
and pages from the Quechua Wiktionary, connected by edit events. Each edge
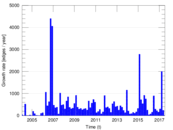
represents an edit. The dataset includes the timestamp of each edit.
Metadata
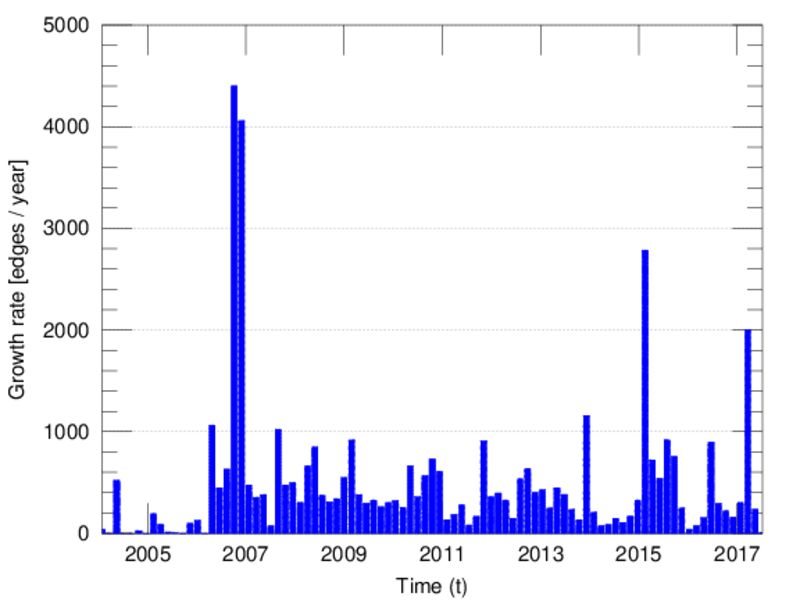
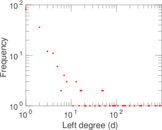
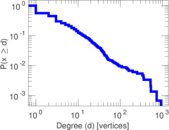
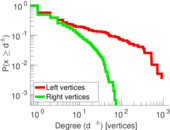
Statistics
| Size | n = | 1,689
|
| Left size | n1 = | 194
|
| Right size | n2 = | 1,495
|
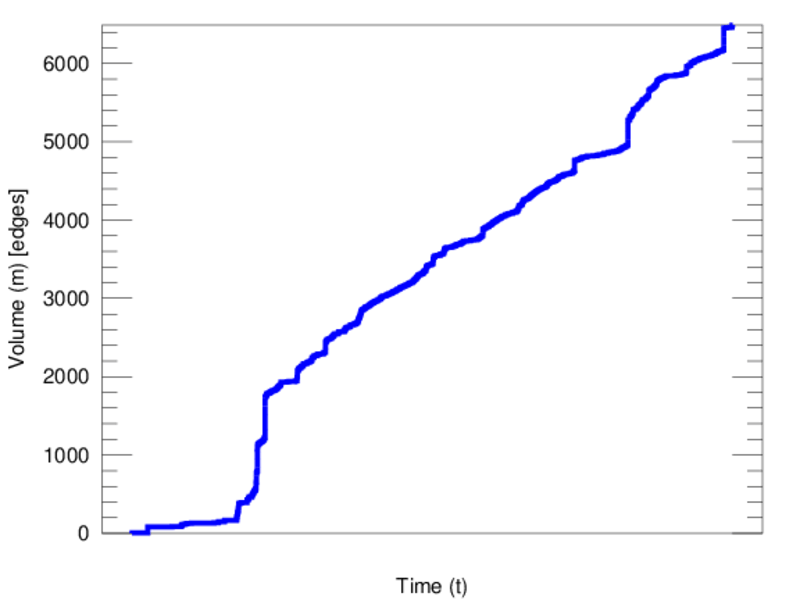
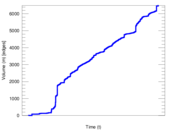
| Volume | m = | 6,491
|
| Unique edge count | m̿ = | 3,686
|
| Wedge count | s = | 391,396
|
| Claw count | z = | 40,526,033
|
| Cross count | x = | 3,770,614,368
|
| Square count | q = | 314,130
|
| 4-Tour count | T4 = | 4,086,320
|
| Maximum degree | dmax = | 918
|
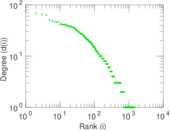
| Maximum left degree | d1max = | 918
|
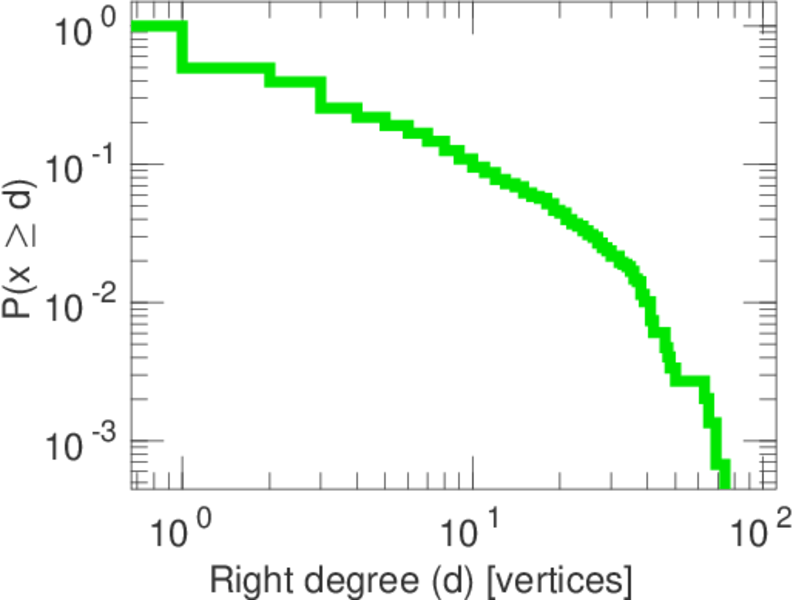
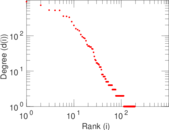
| Maximum right degree | d2max = | 74
|
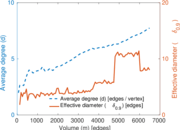
| Average degree | d = | 7.686 20
|
| Average left degree | d1 = | 33.458 8
|
| Average right degree | d2 = | 4.341 81
|
| Fill | p = | 0.012 709 0
|
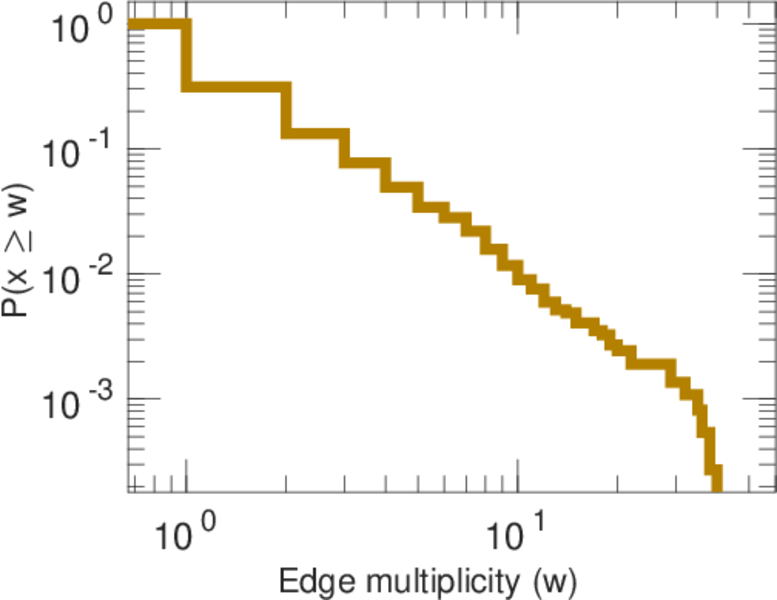
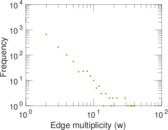
| Average edge multiplicity | m̃ = | 1.760 99
|
| Size of LCC | N = | 1,443
|
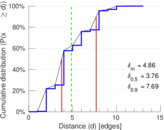
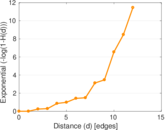
| Diameter | δ = | 14
|
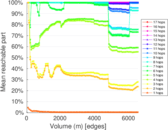
| 50-Percentile effective diameter | δ0.5 = | 3.758 69
|
| 90-Percentile effective diameter | δ0.9 = | 7.689 57
|
| Median distance | δM = | 4
|
| Mean distance | δm = | 4.858 03
|
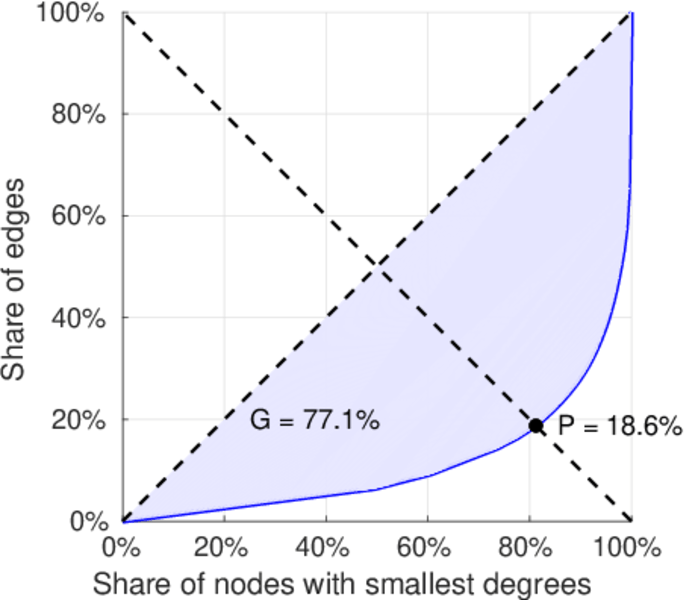
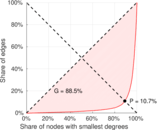
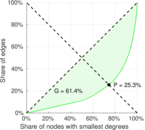
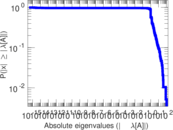
| Gini coefficient | G = | 0.771 466
|
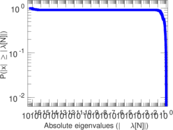
| Balanced inequality ratio | P = | 0.186 258
|
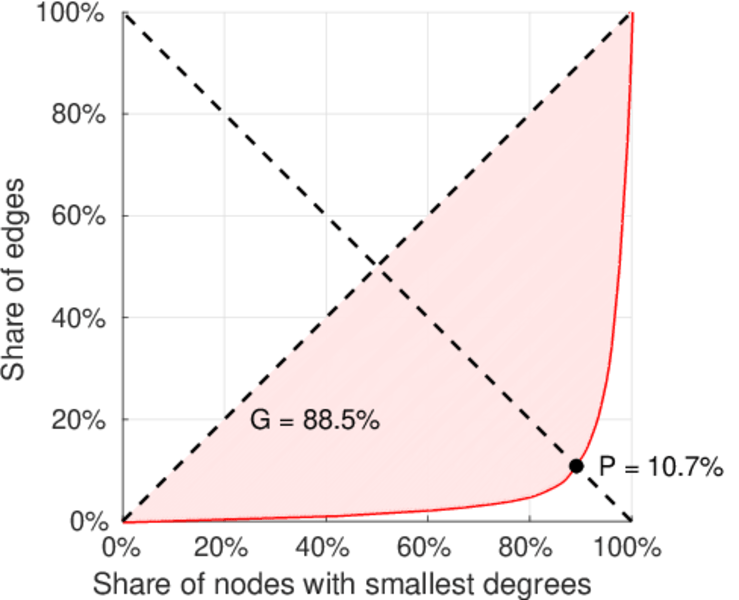
| Left balanced inequality ratio | P1 = | 0.106 763
|
| Right balanced inequality ratio | P2 = | 0.253 428
|
| Relative edge distribution entropy | Her = | 0.787 337
|
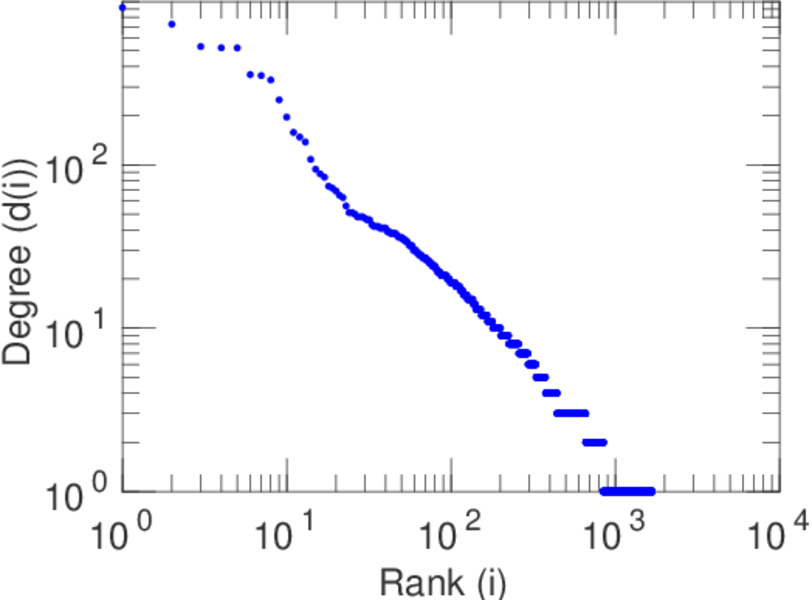
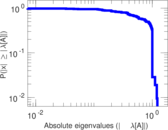
| Power law exponent | γ = | 2.667 64
|
| Tail power law exponent | γt = | 1.971 00
|
| Tail power law exponent with p | γ3 = | 1.971 00
|
| p-value | p = | 0.000 00
|
| Left tail power law exponent with p | γ3,1 = | 1.661 00
|
| Left p-value | p1 = | 0.014 000 0
|
| Right tail power law exponent with p | γ3,2 = | 2.031 00
|
| Right p-value | p2 = | 0.000 00
|
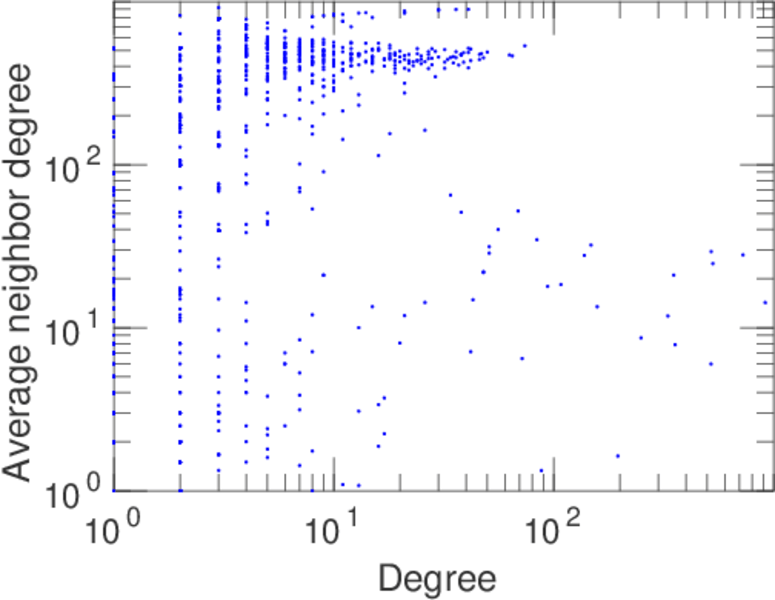
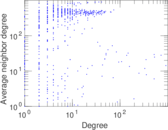
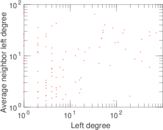
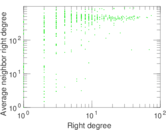
| Degree assortativity | ρ = | −0.114 878
|
| Degree assortativity p-value | pρ = | 2.646 54 × 10−12
|
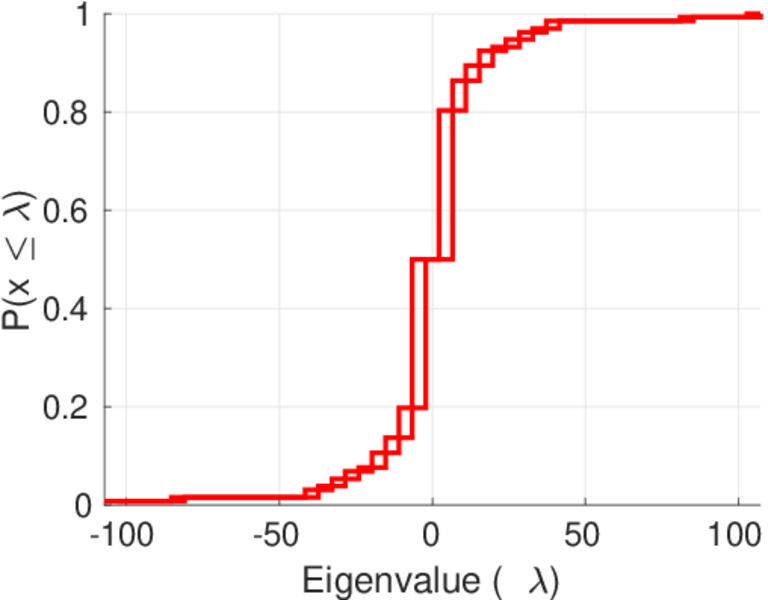
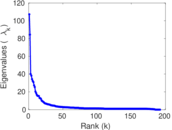
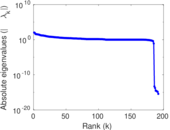
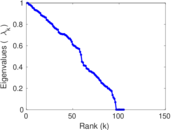
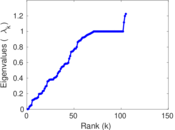
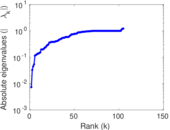
| Spectral norm | α = | 107.211
|
| Algebraic connectivity | a = | 0.007 272 33
|
| Spectral separation | |λ1[A] / λ2[A]| = | 1.270 36
|
| Controllability | C = | 1,310
|
| Relative controllability | Cr = | 0.780 691
|
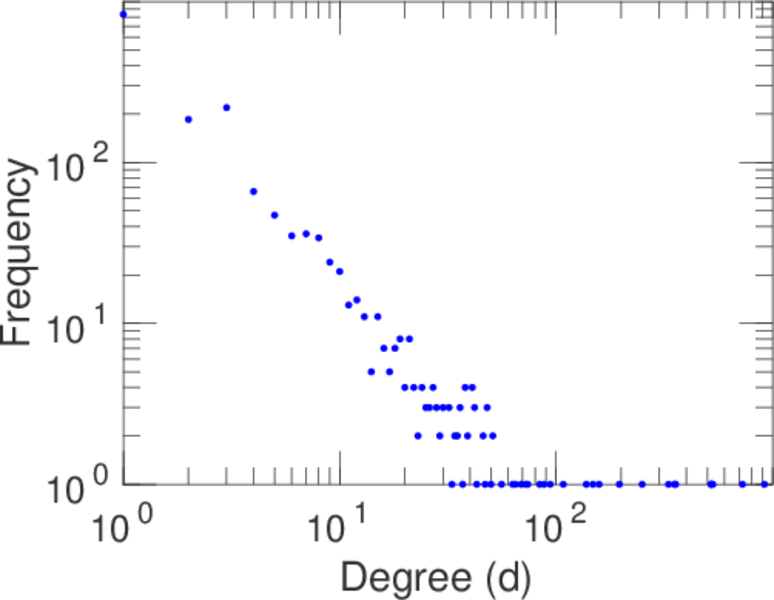
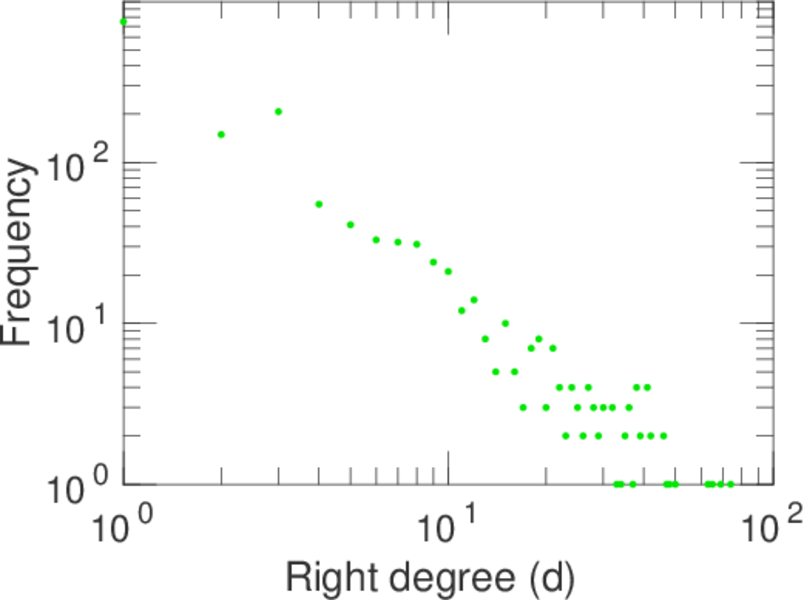
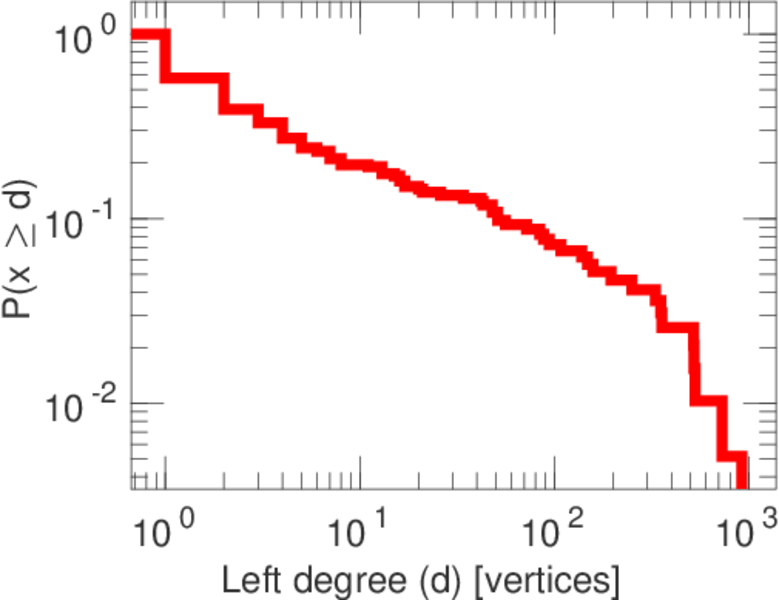
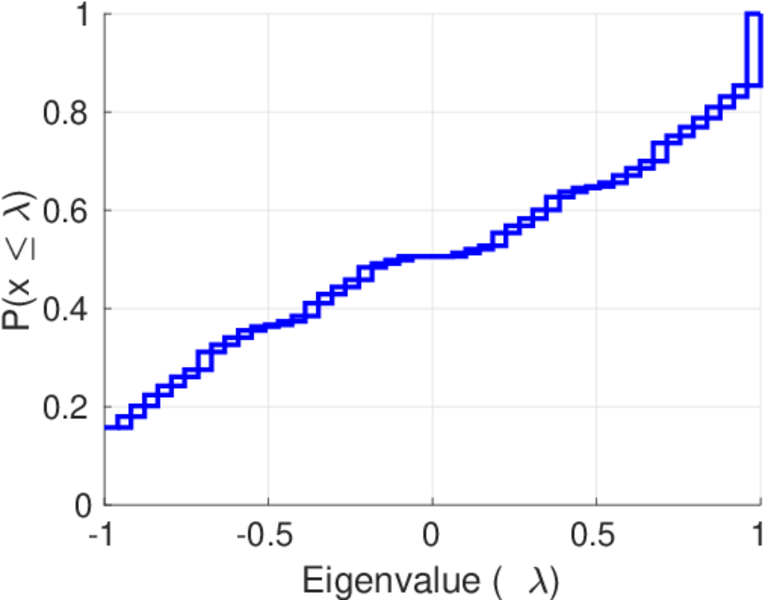
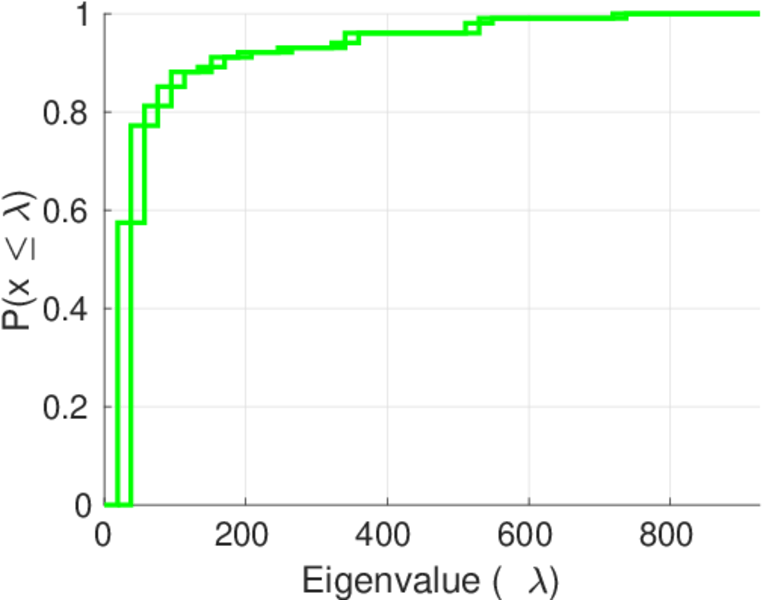
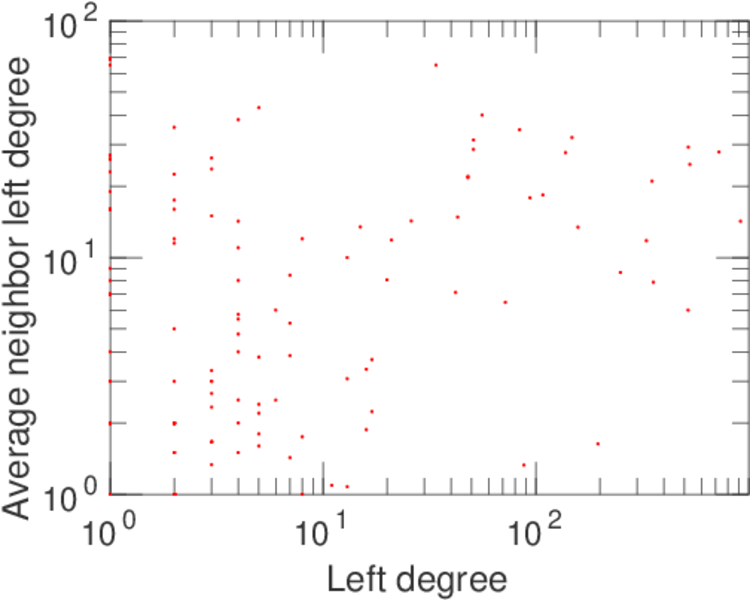
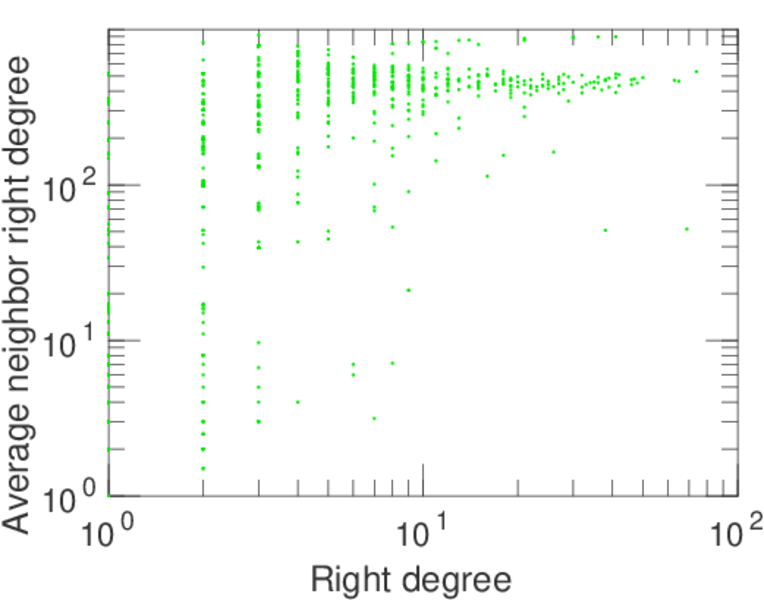
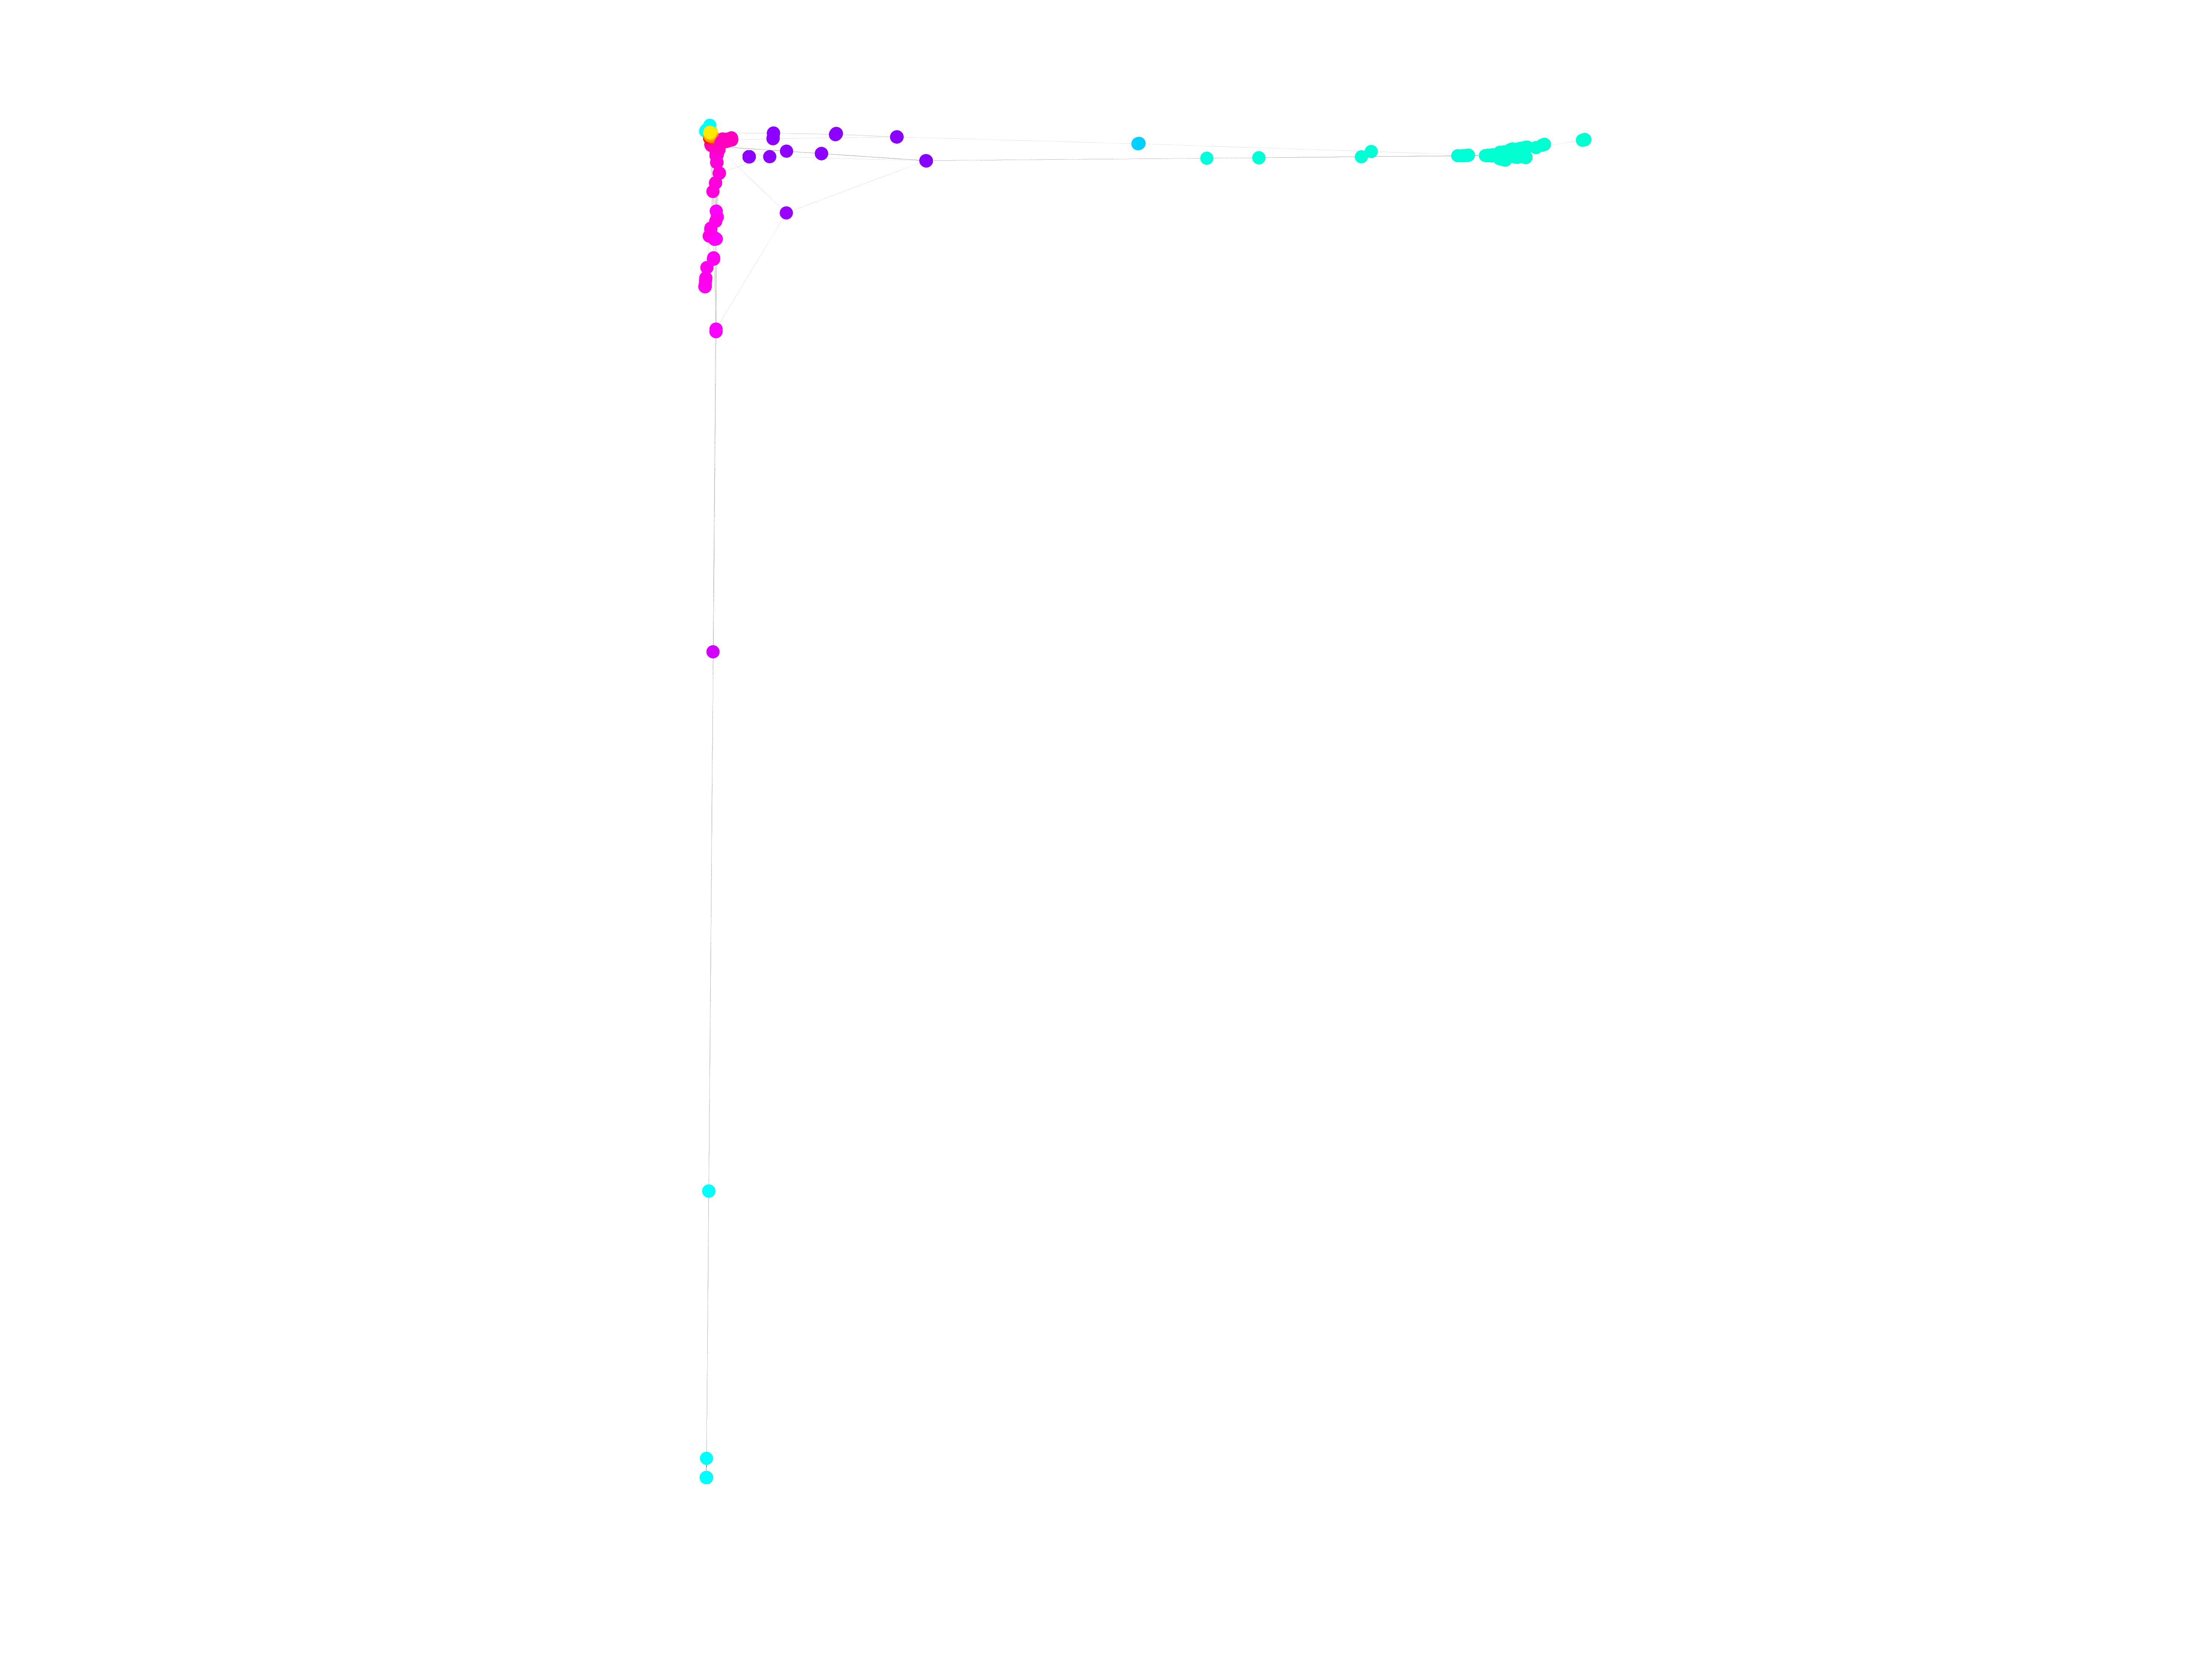
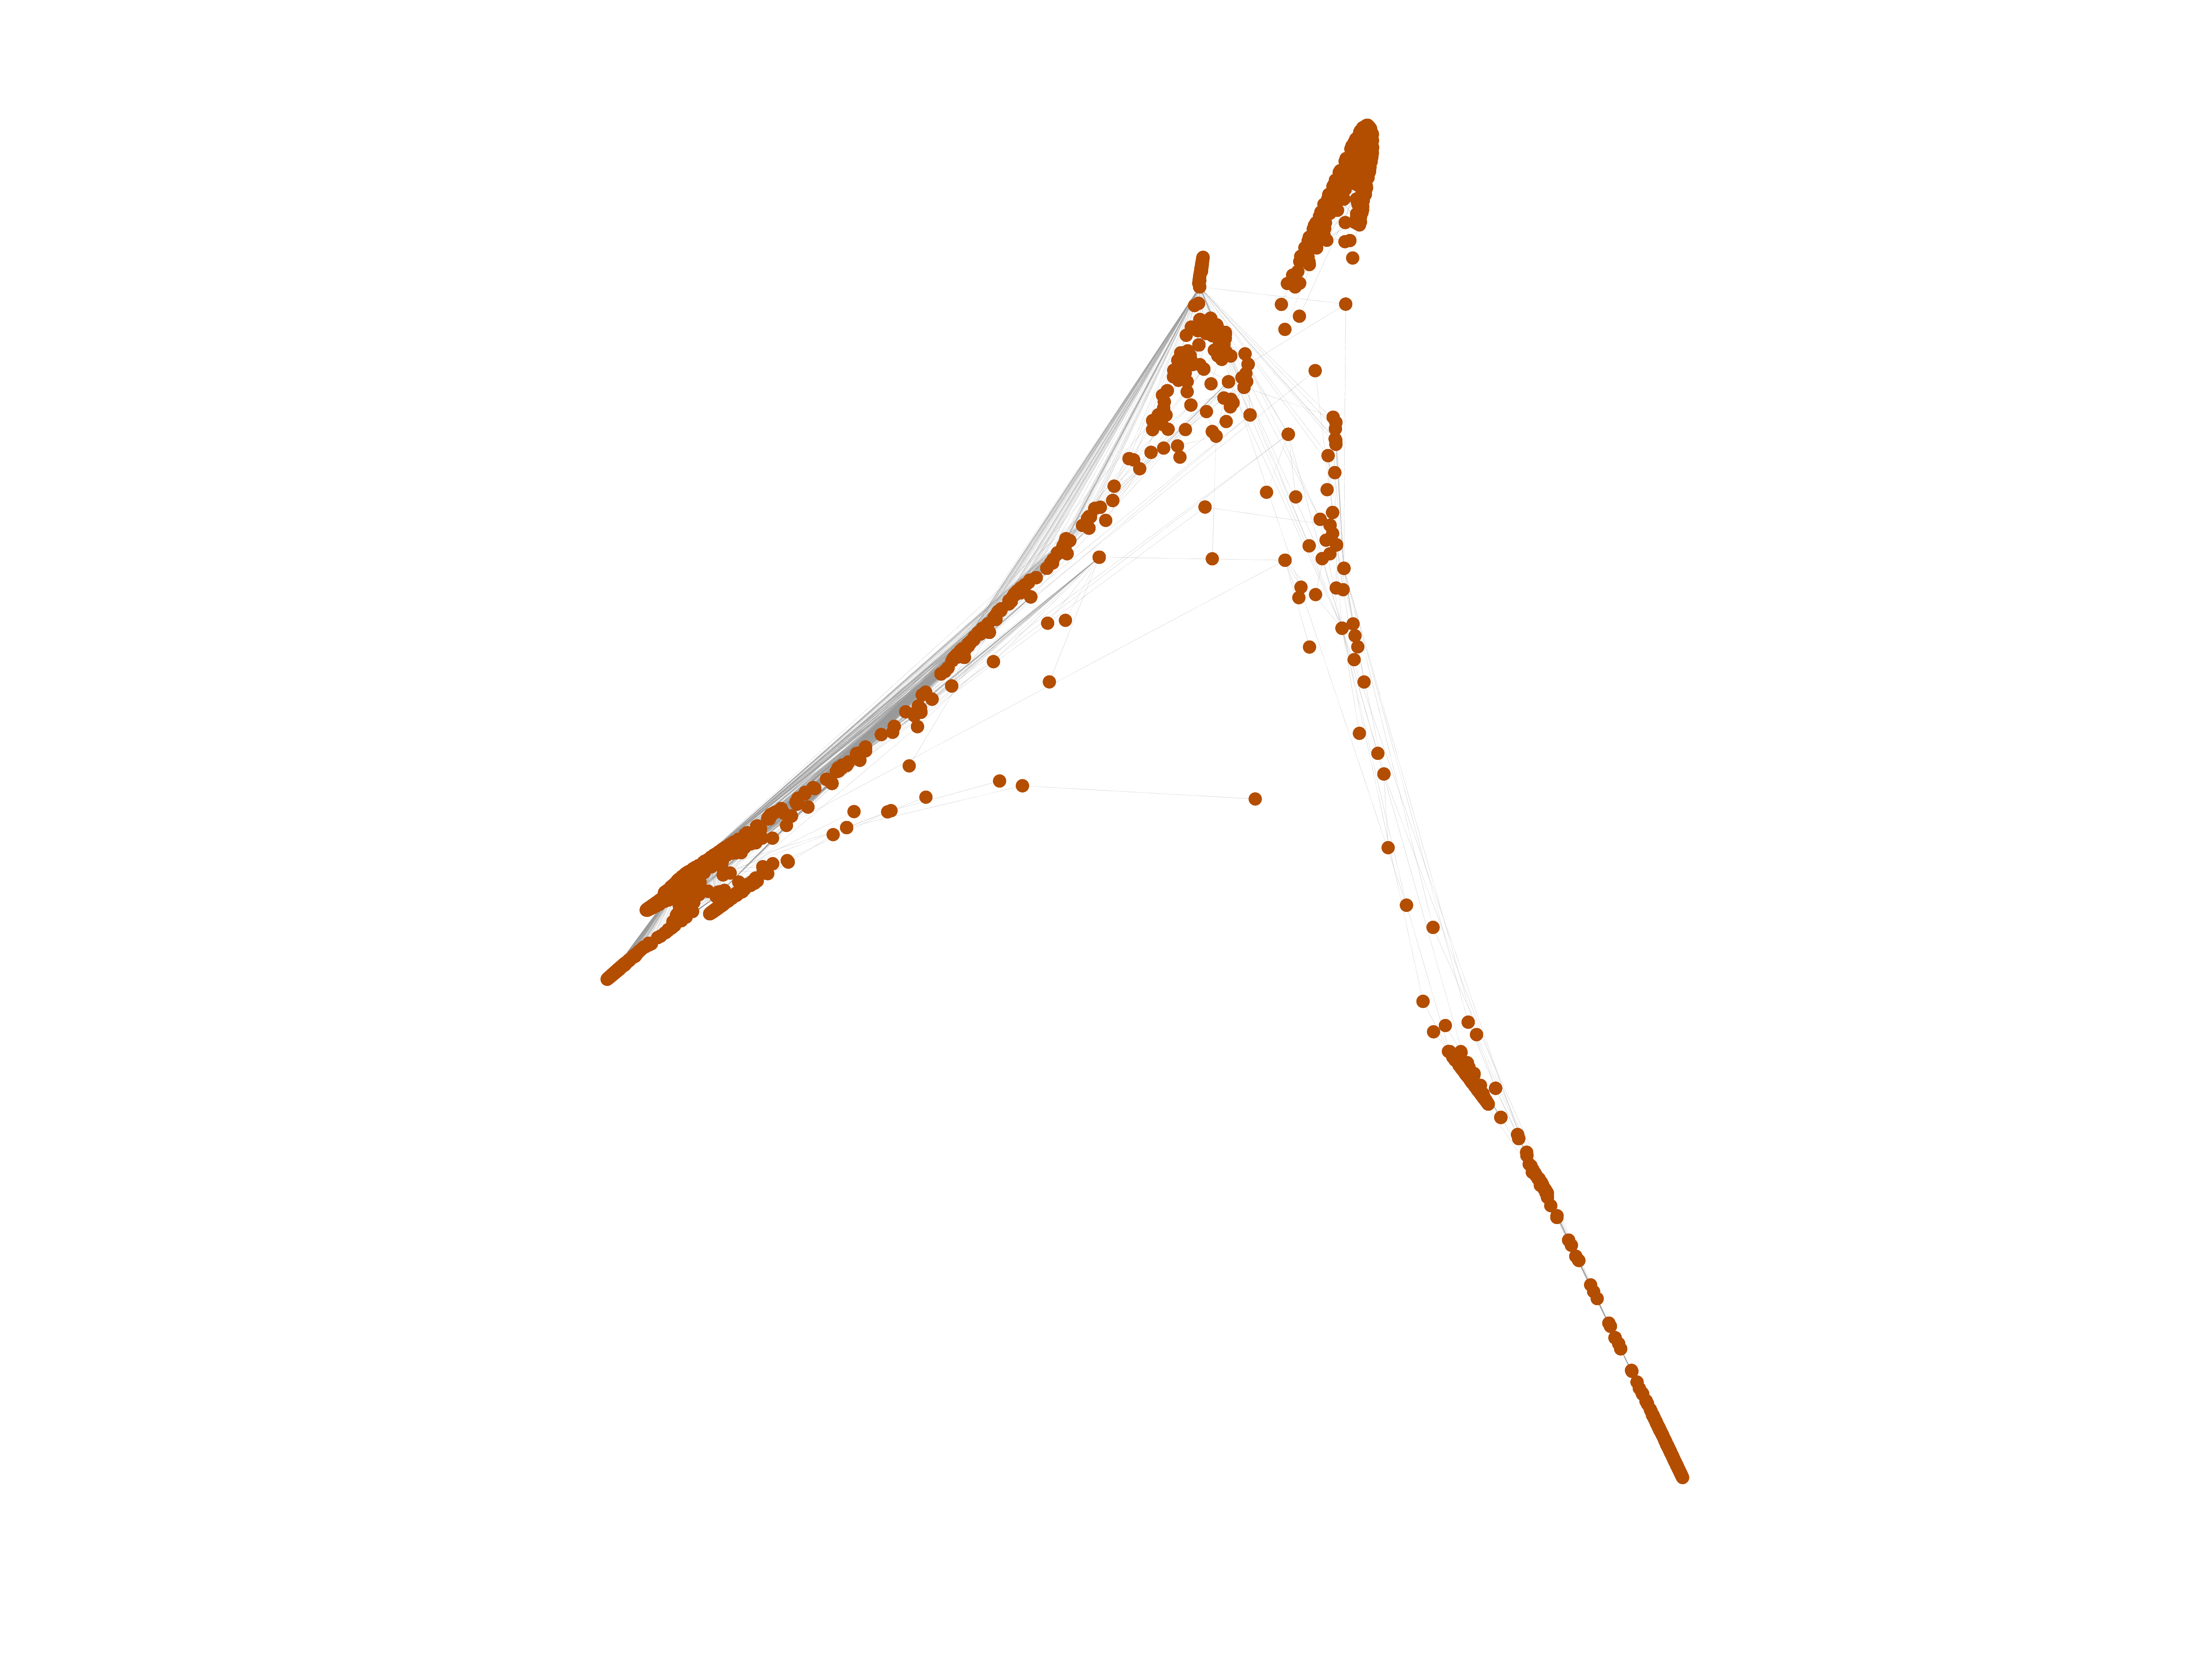
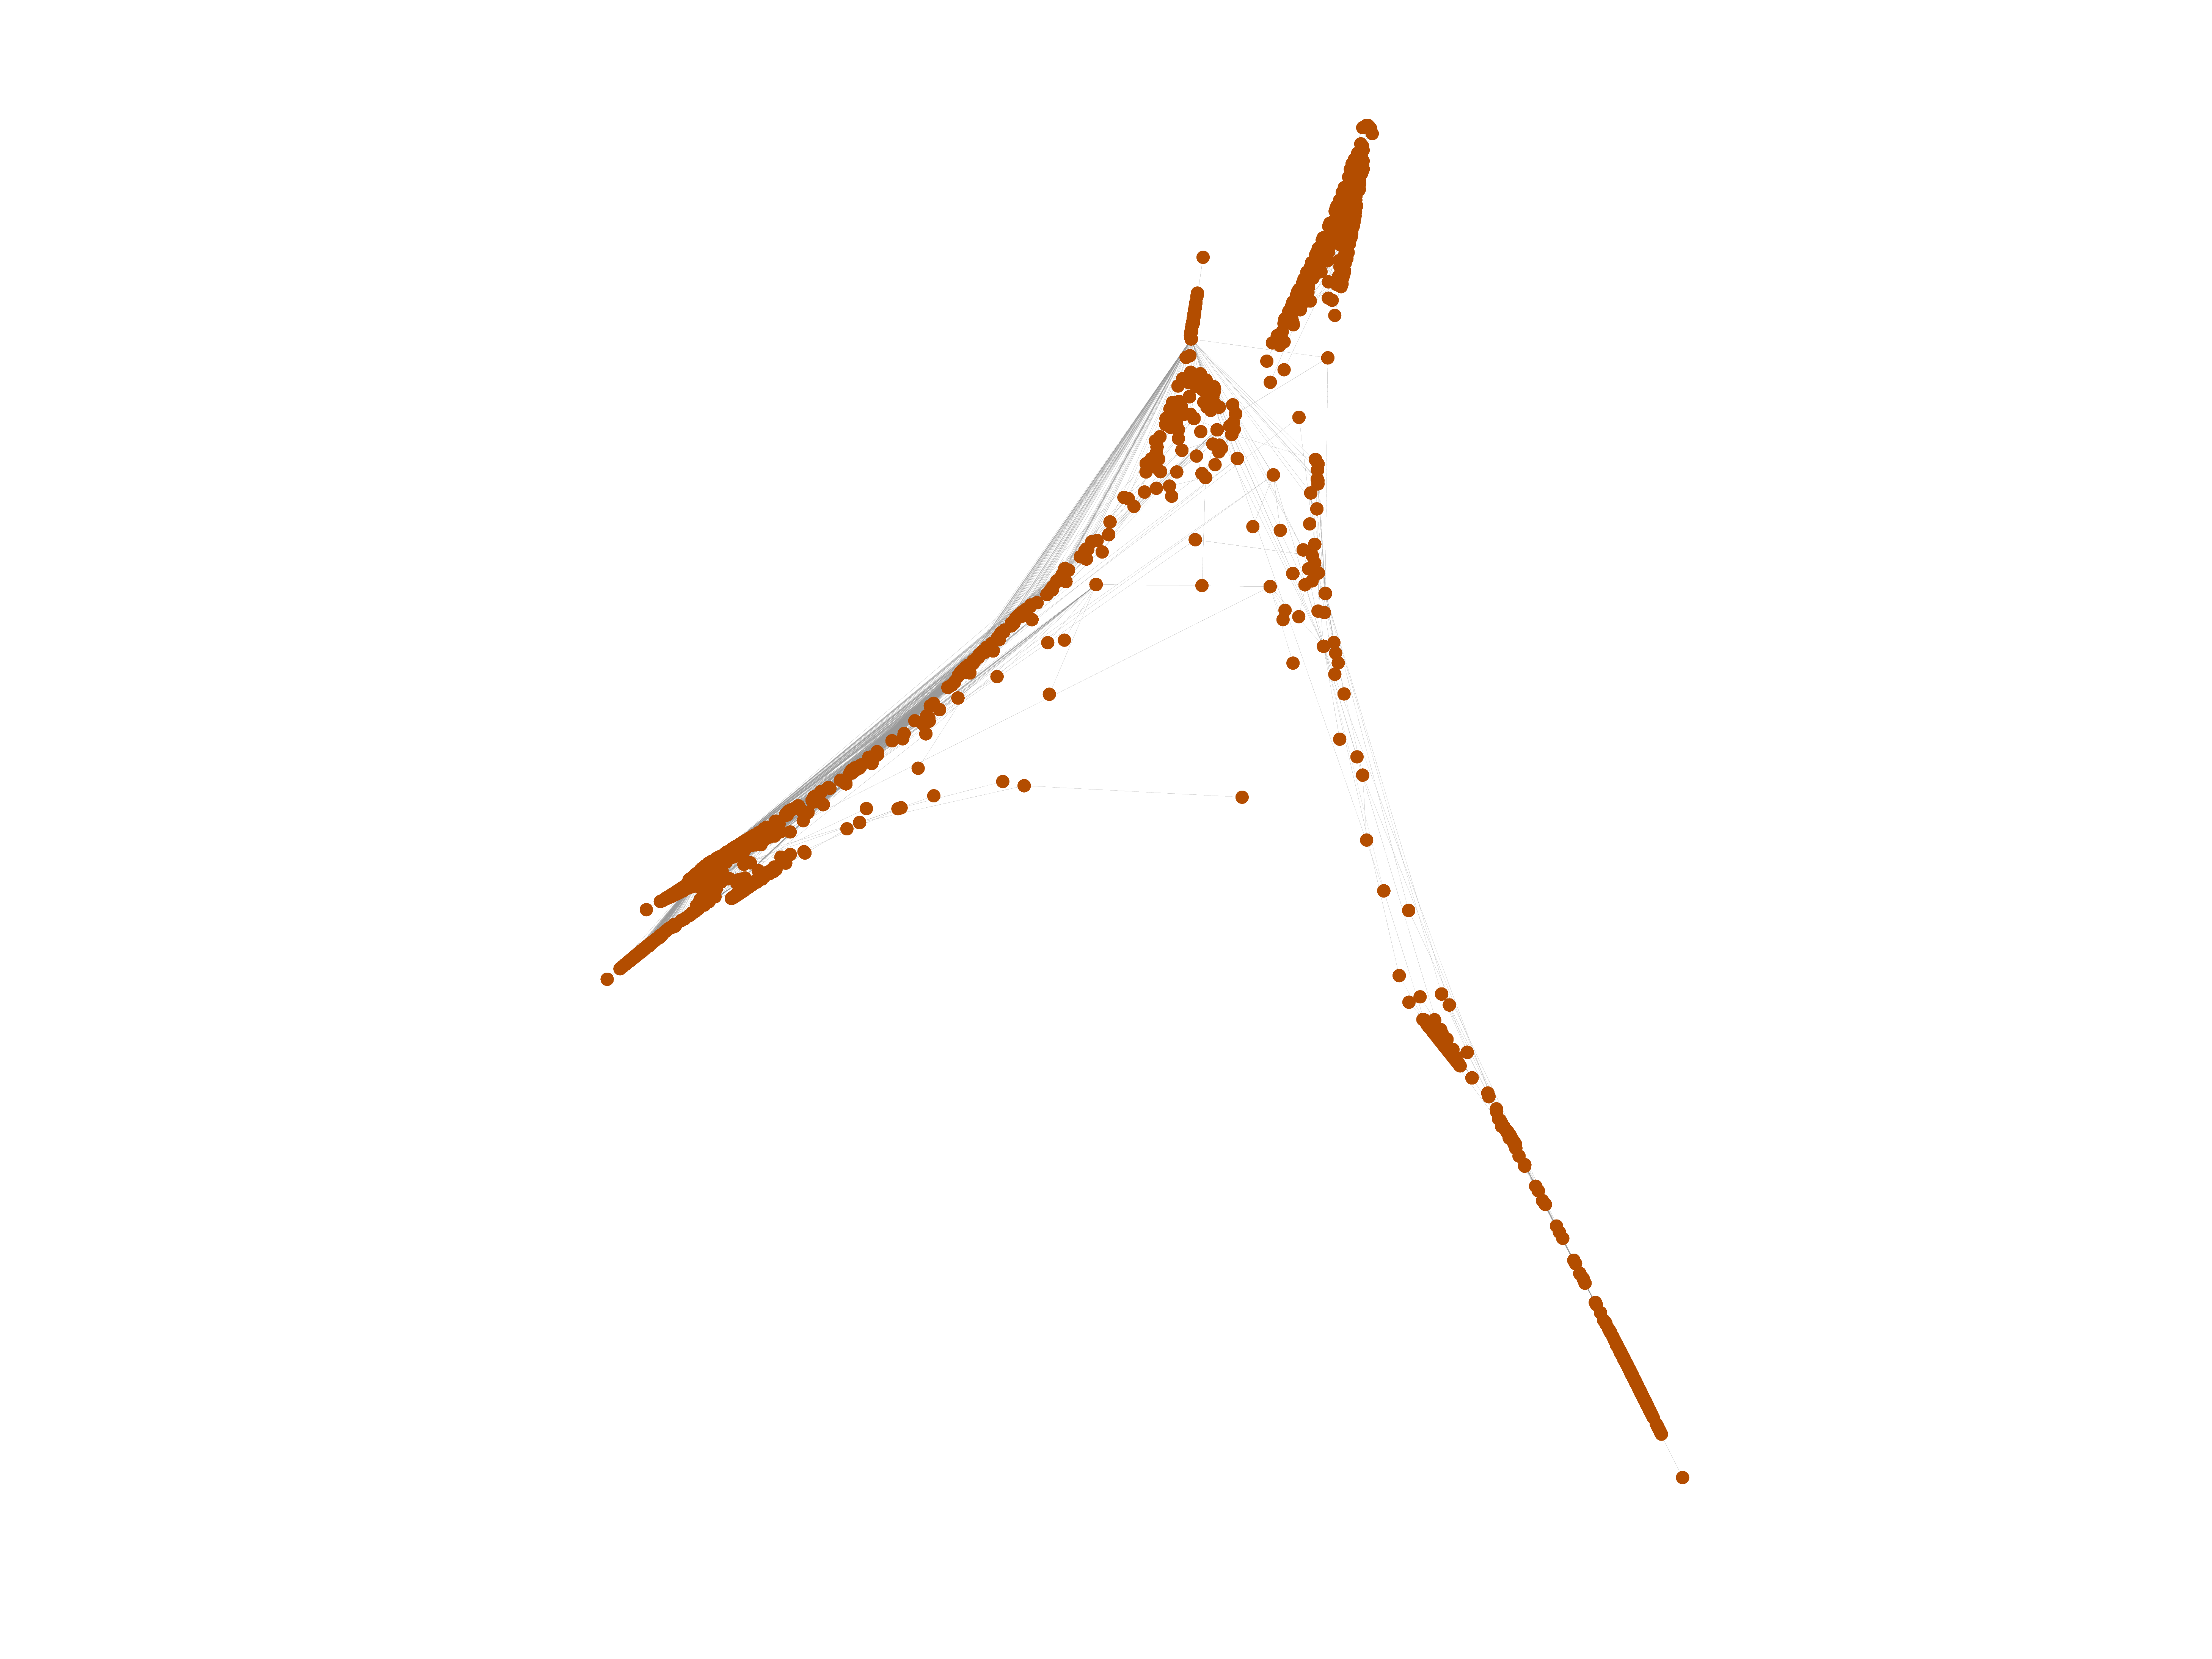
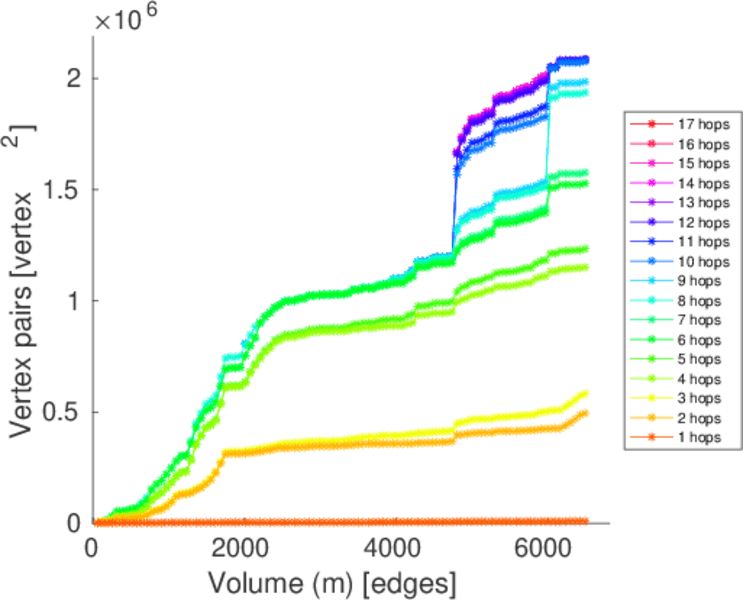
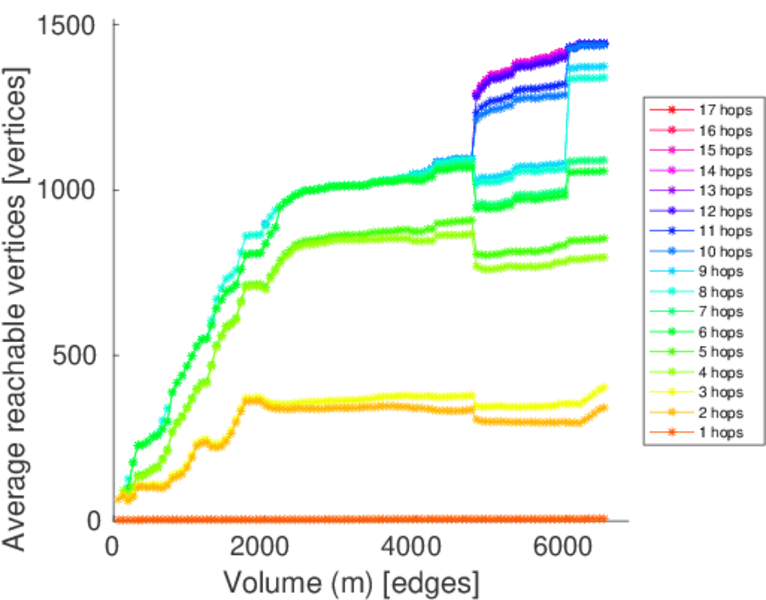
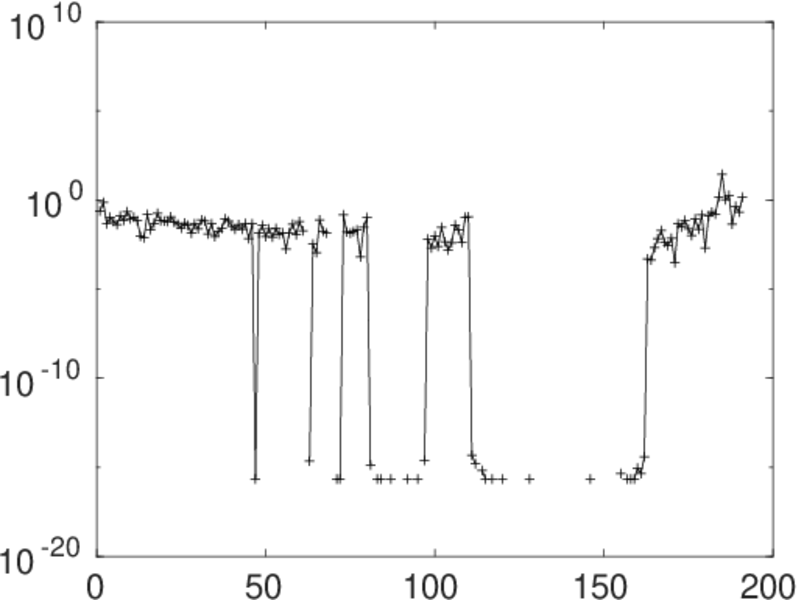
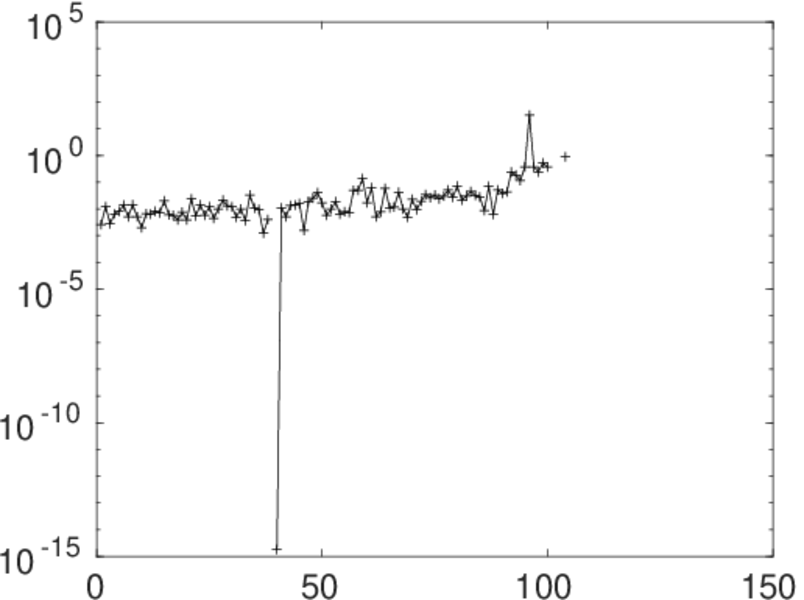
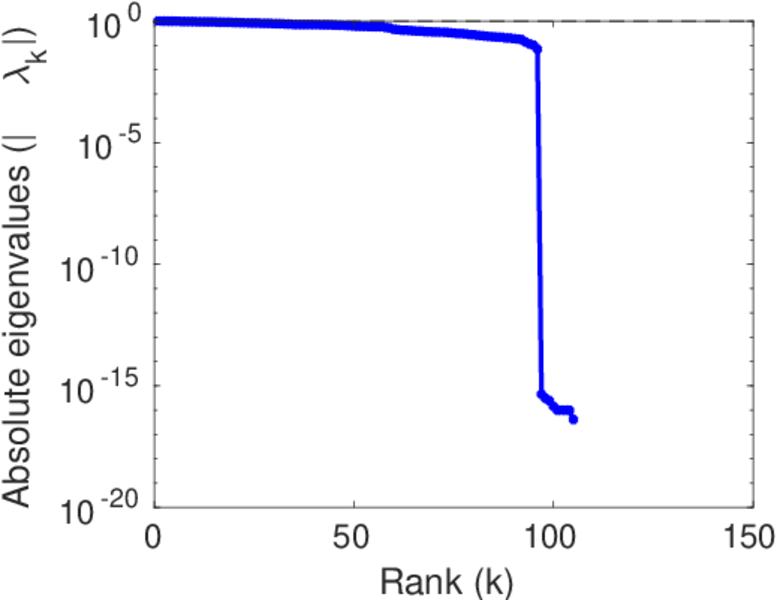
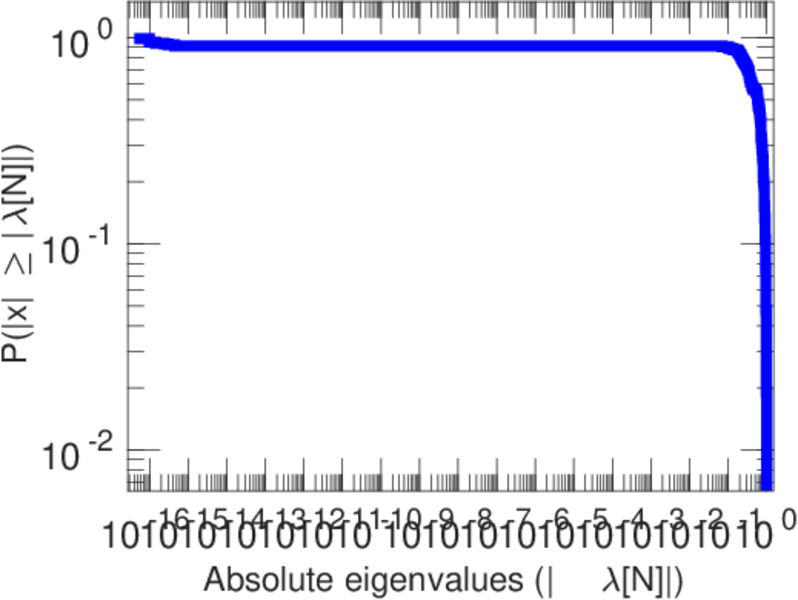
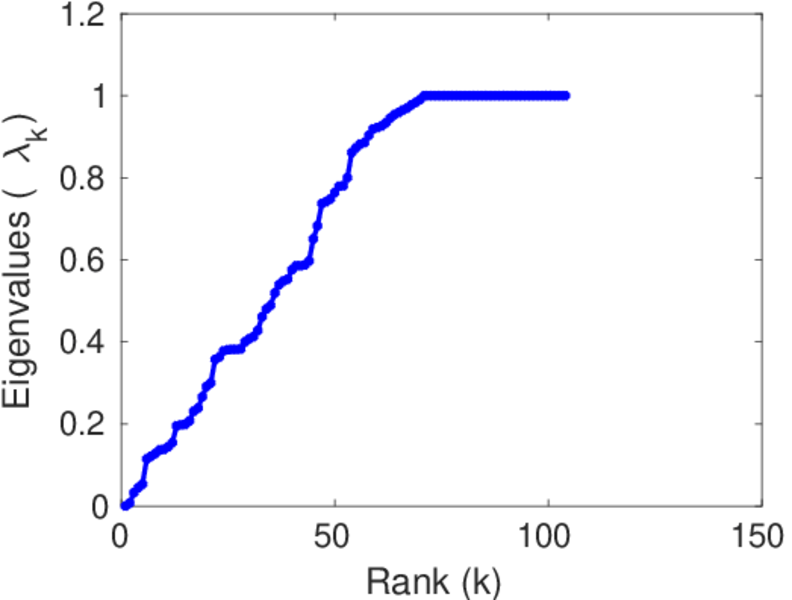
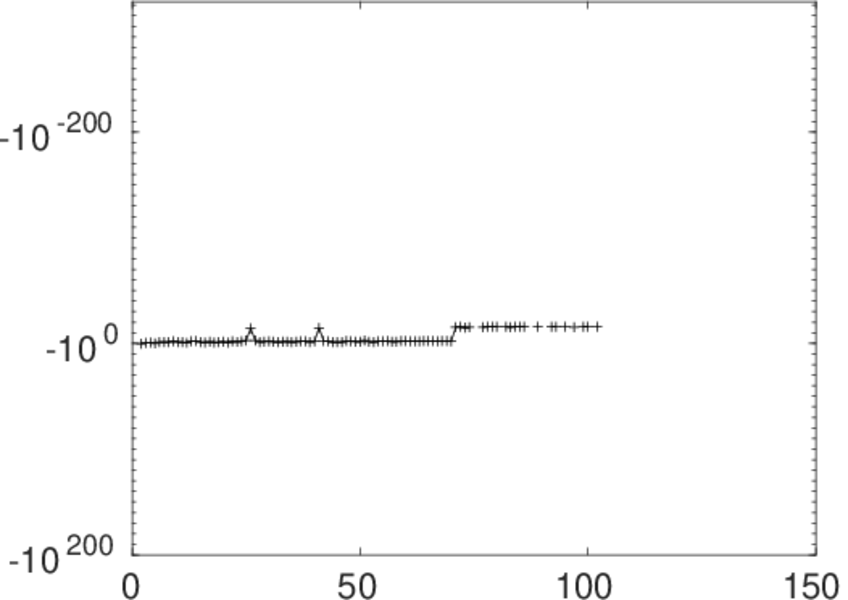
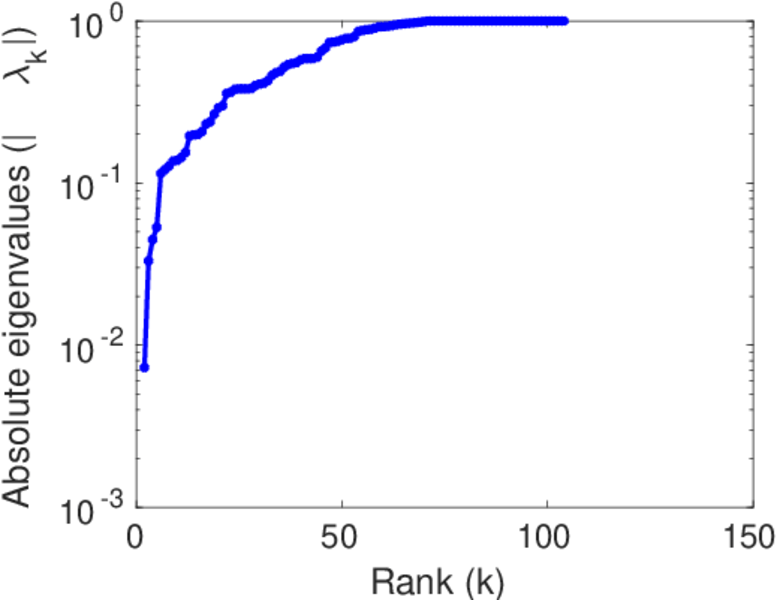
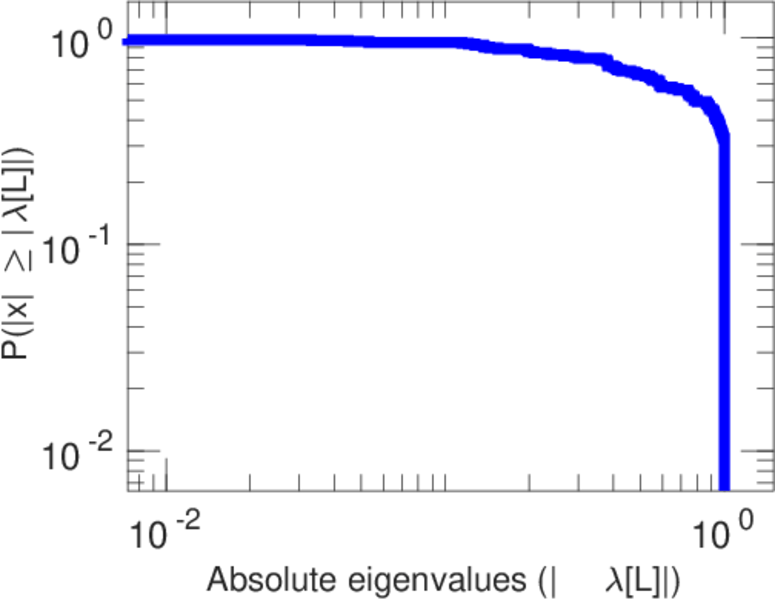
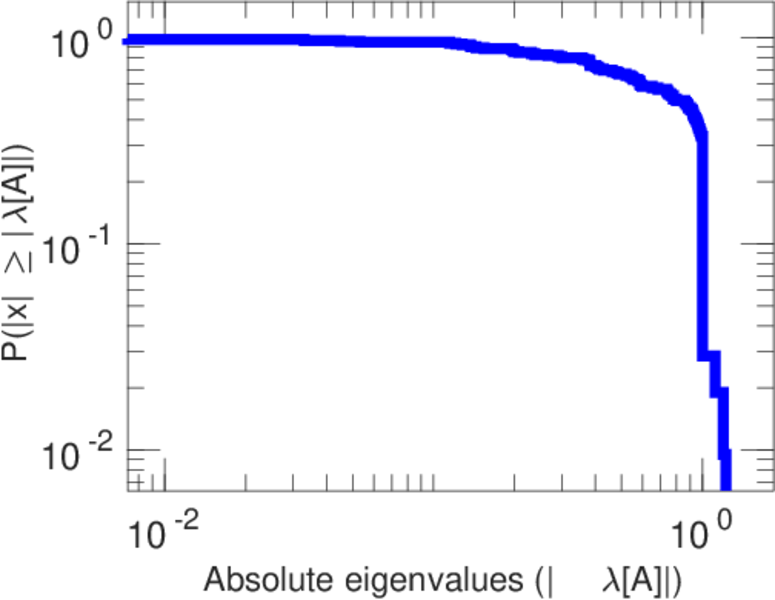
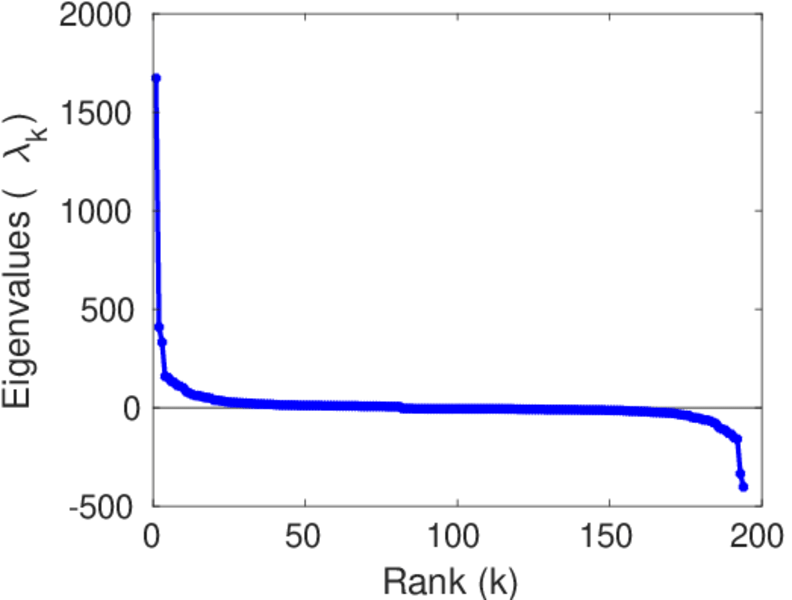
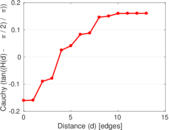
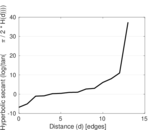
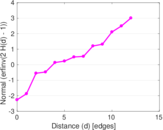
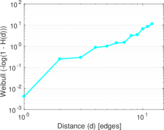
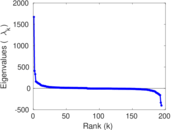
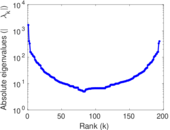
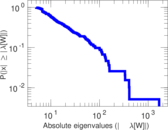
Plots


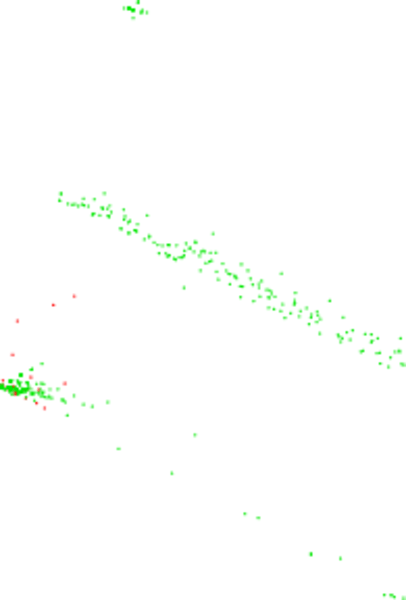
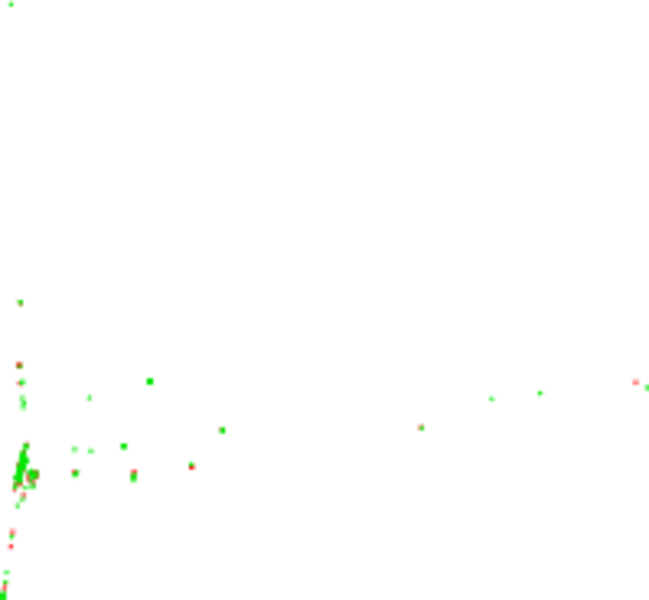
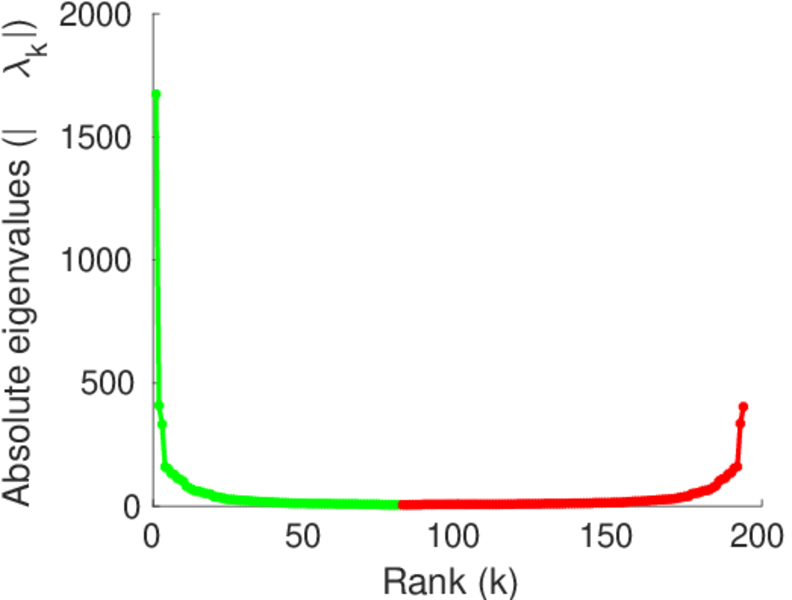
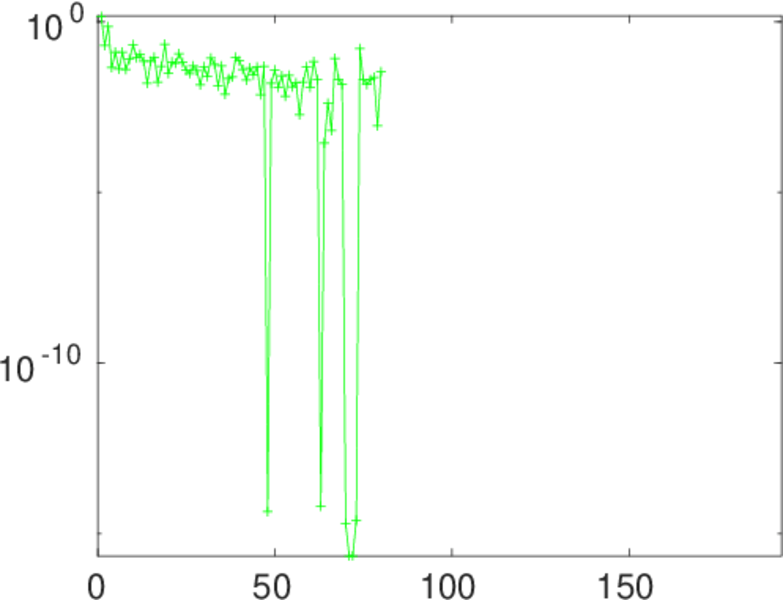
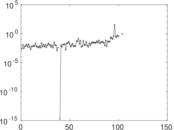
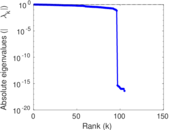
Matrix decompositions plots


Downloads
References
|
[1]
|
Jérôme Kunegis.
KONECT – The Koblenz Network Collection.
In Proc. Int. Conf. on World Wide Web Companion, pages
1343–1350, 2013.
[ http ]
|
|
[2]
|
Wikimedia Foundation.
Wikimedia downloads.
http://dumps.wikimedia.org/, January 2010.
|
 KONECT ‣ Networks ‣
Buy Me a Coffee
KONECT ‣ Networks ‣
Buy Me a Coffee