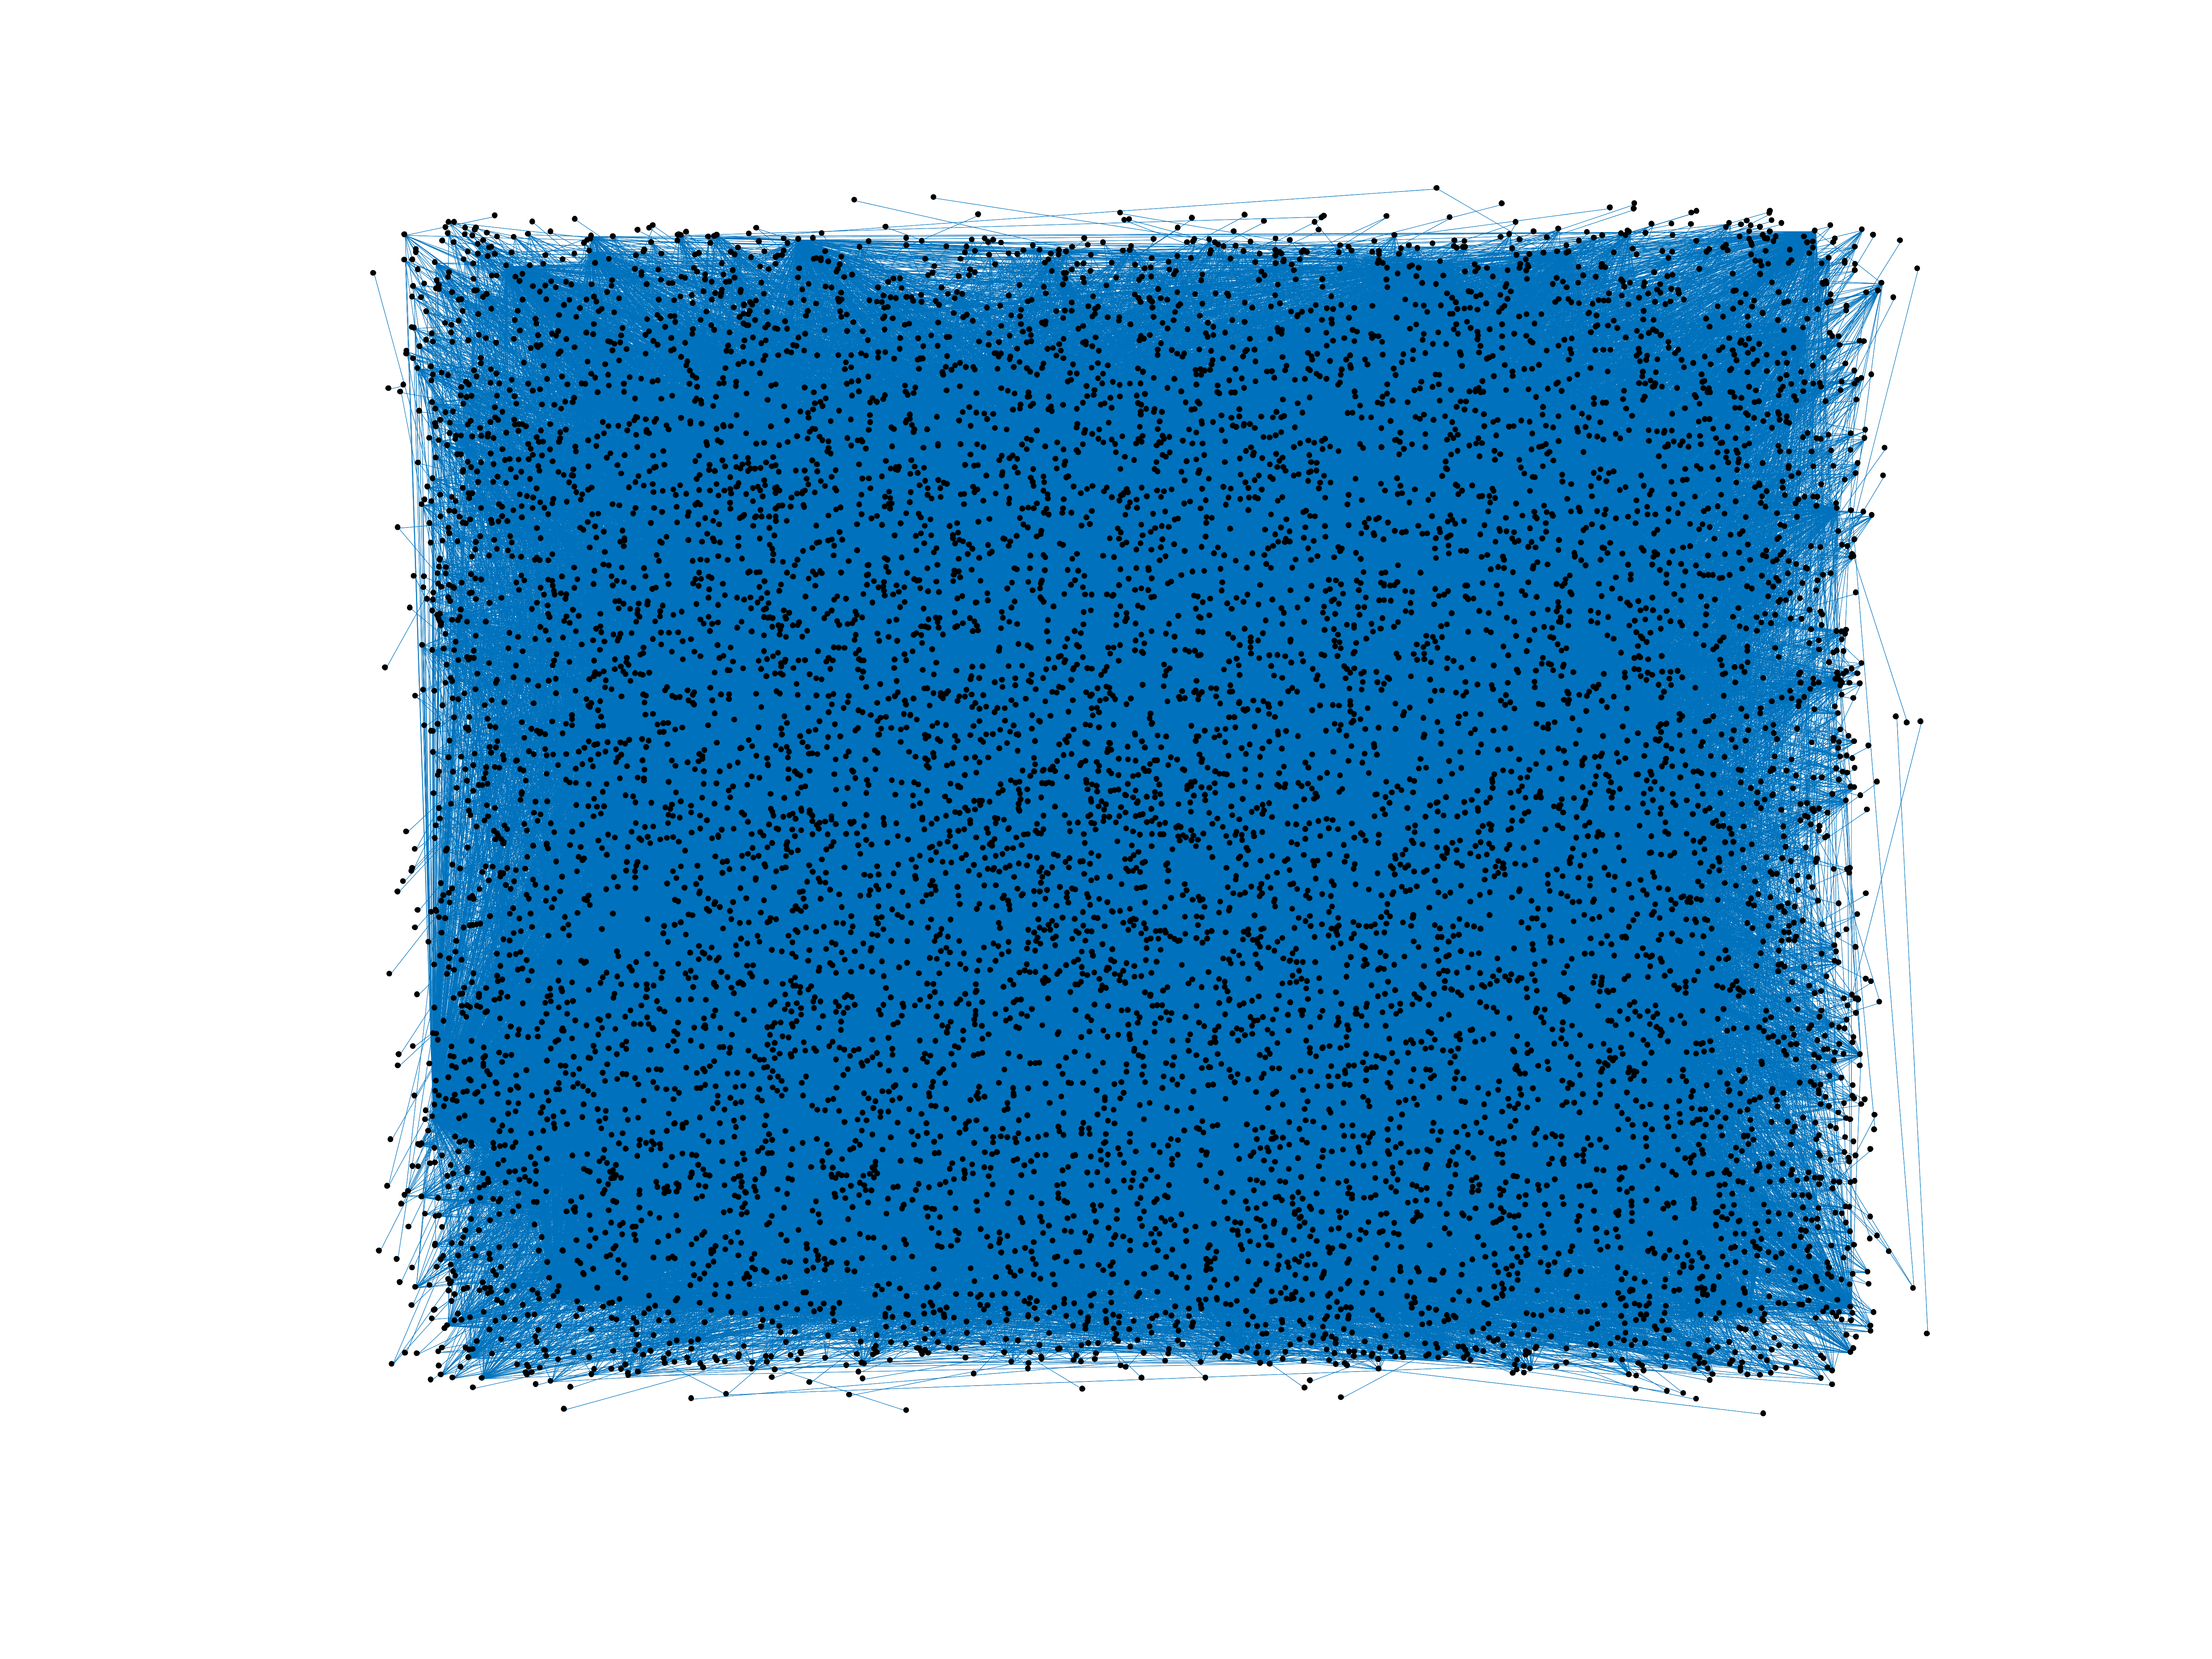
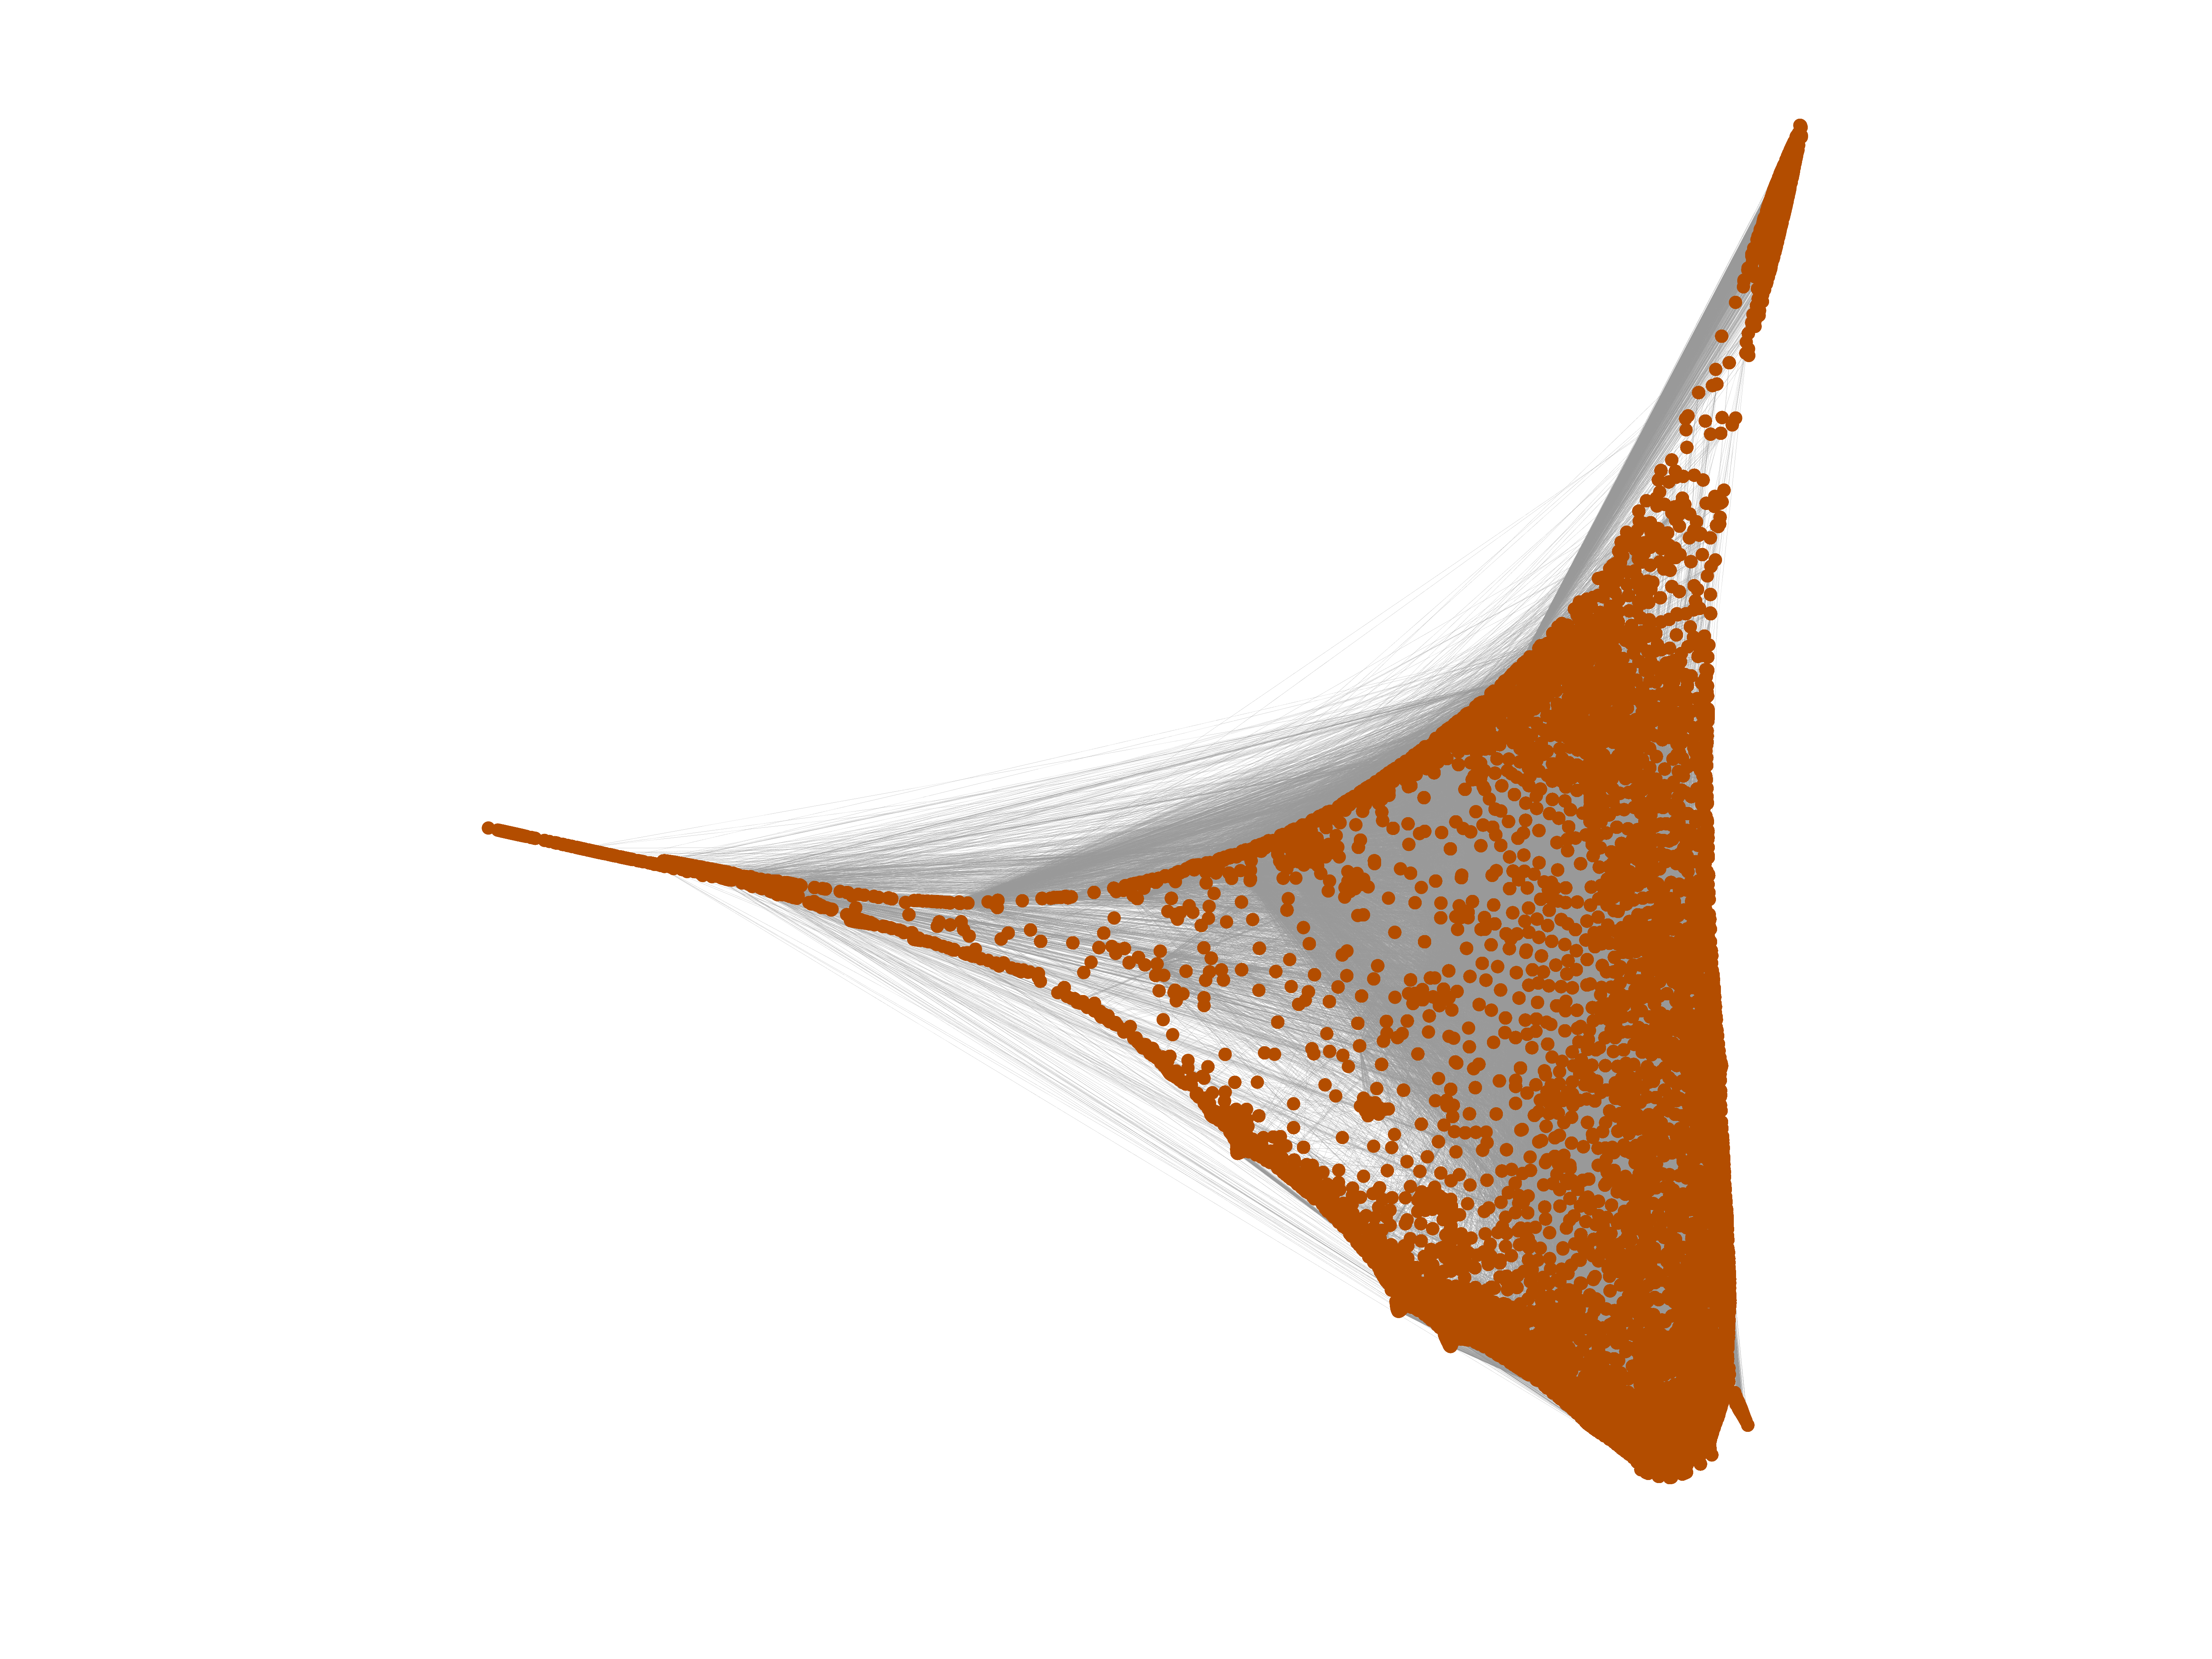
Wikipedia edits (rm)
This is the bipartite edit network of the Romansh Wikipedia. It contains users
and pages from the Romansh Wikipedia, connected by edit events. Each edge
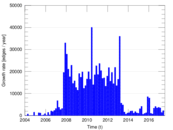
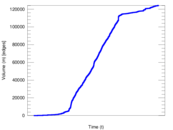
represents an edit. The dataset includes the timestamp of each edit.
Metadata
Statistics
| Size | n = | 9,312
|
| Left size | n1 = | 1,225
|
| Right size | n2 = | 8,087
|
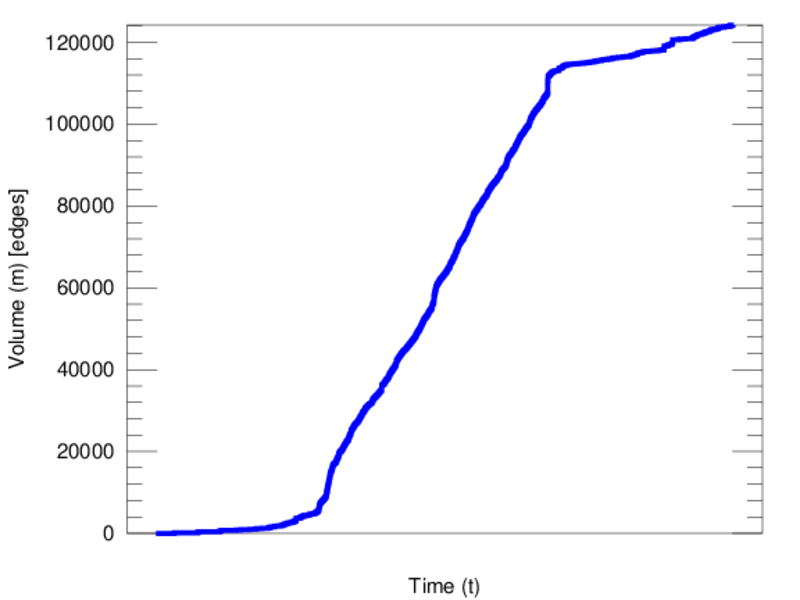
| Volume | m = | 124,234
|
| Unique edge count | m̿ = | 57,992
|
| Wedge count | s = | 40,701,179
|
| Claw count | z = | 34,226,575,331
|
| Cross count | x = | 28,122,684,465,394
|
| Square count | q = | 97,787,536
|
| 4-Tour count | T4 = | 945,241,832
|
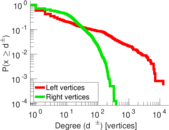
| Maximum degree | dmax = | 12,896
|
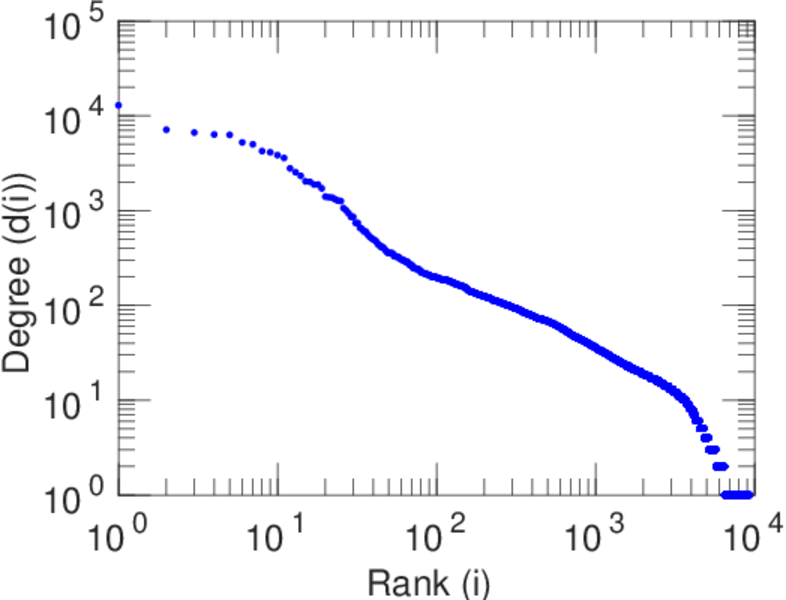
| Maximum left degree | d1max = | 12,896
|
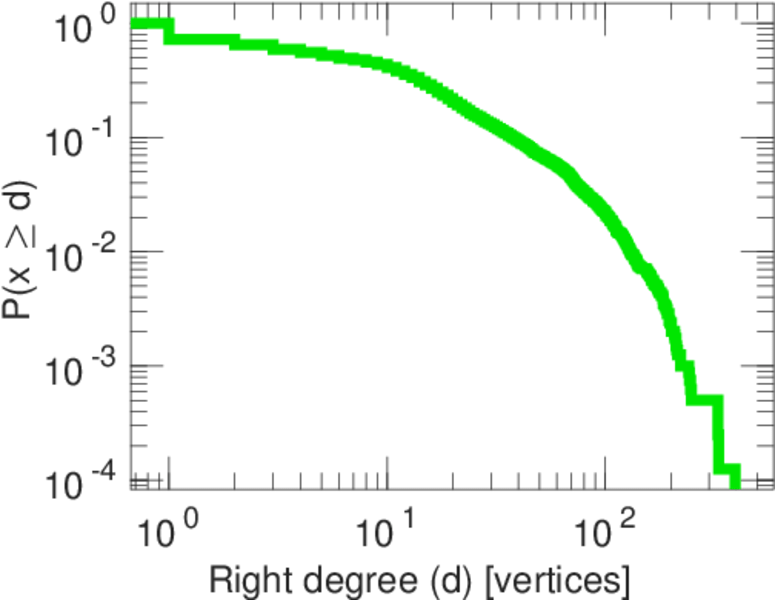
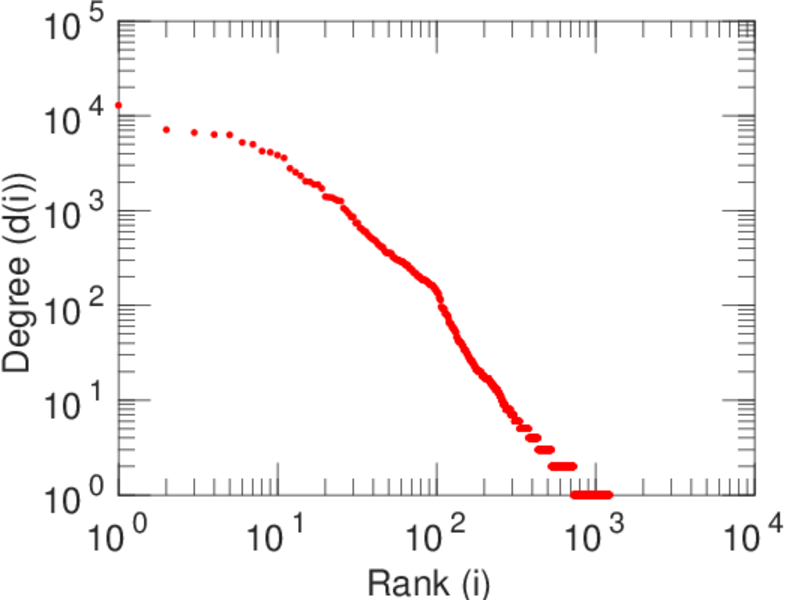
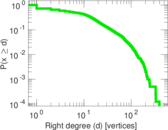
| Maximum right degree | d2max = | 394
|
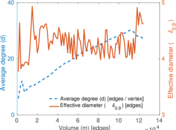
| Average degree | d = | 26.682 6
|
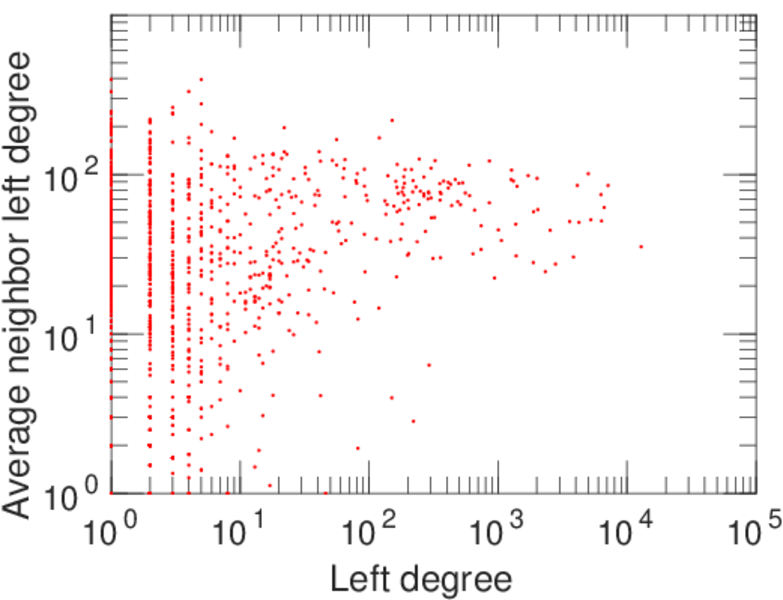
| Average left degree | d1 = | 101.416
|
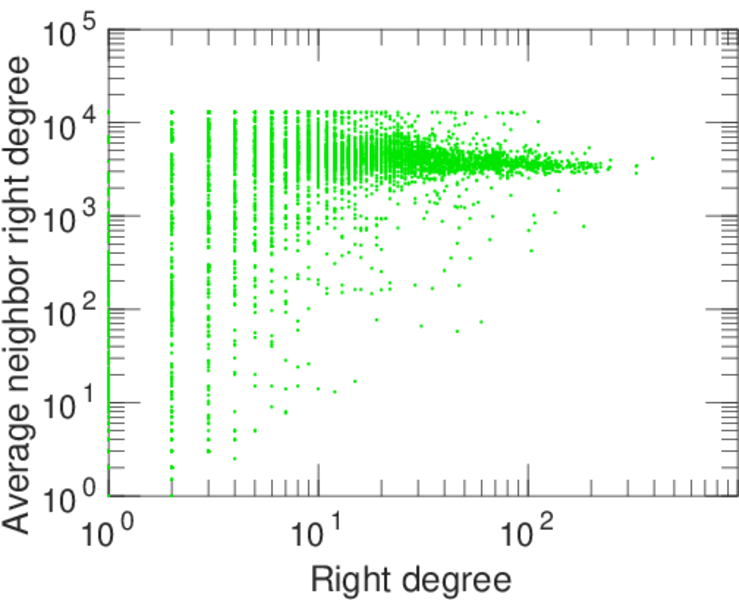
| Average right degree | d2 = | 15.362 2
|
| Fill | p = | 0.005 853 89
|
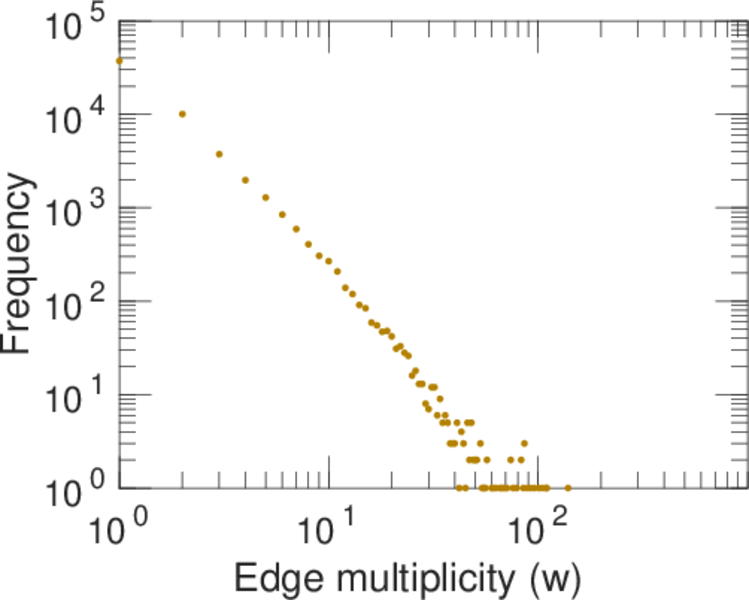
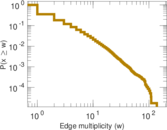
| Average edge multiplicity | m̃ = | 2.142 26
|
| Size of LCC | N = | 8,594
|
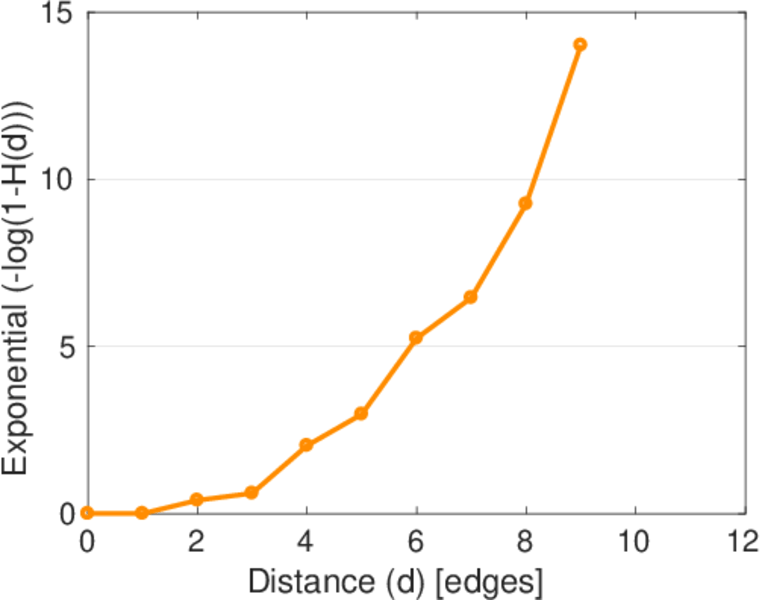
| Diameter | δ = | 12
|
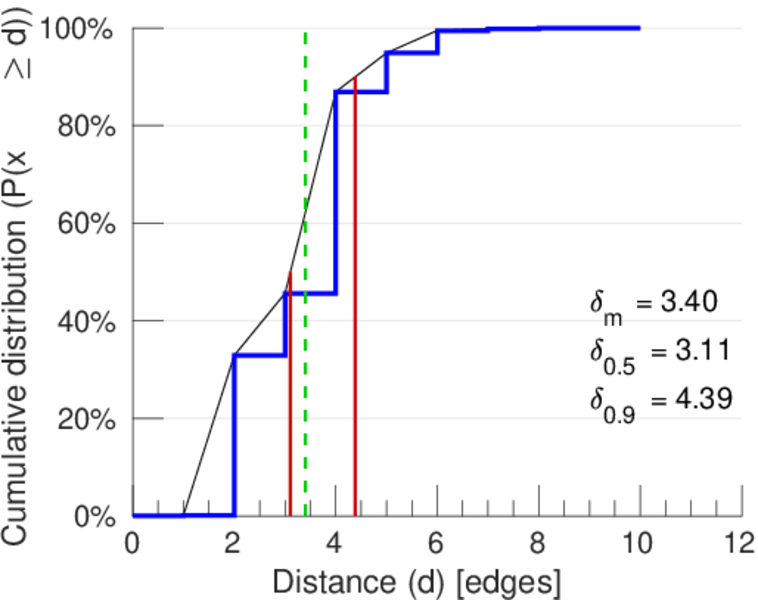
| 50-Percentile effective diameter | δ0.5 = | 3.106 29
|
| 90-Percentile effective diameter | δ0.9 = | 4.387 20
|
| Median distance | δM = | 4
|
| Mean distance | δm = | 3.402 58
|
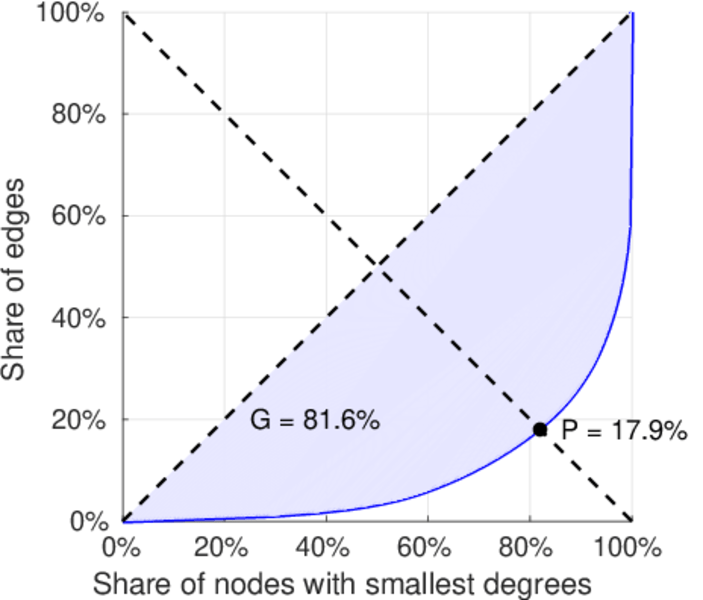
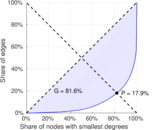
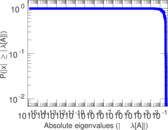
| Gini coefficient | G = | 0.812 624
|
| Balanced inequality ratio | P = | 0.183 102
|
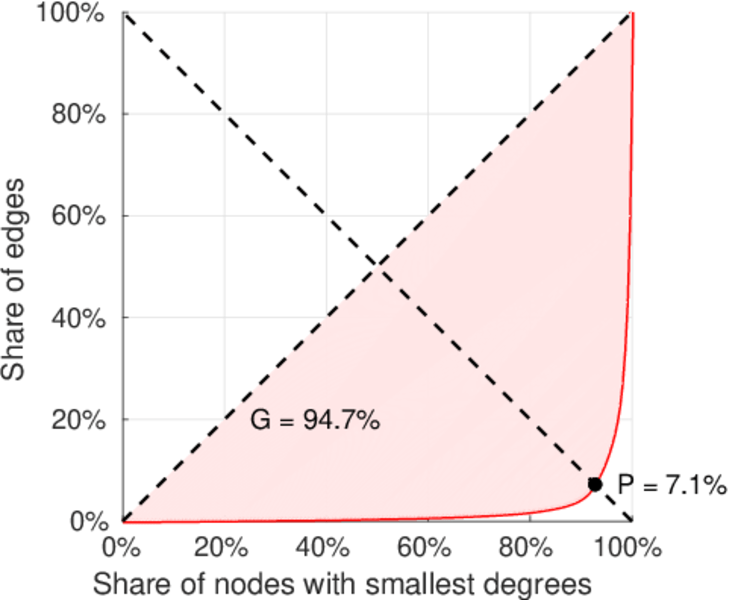
| Left balanced inequality ratio | P1 = | 0.070 705 3
|
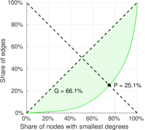
| Right balanced inequality ratio | P2 = | 0.251 018
|
| Relative edge distribution entropy | Her = | 0.779 176
|
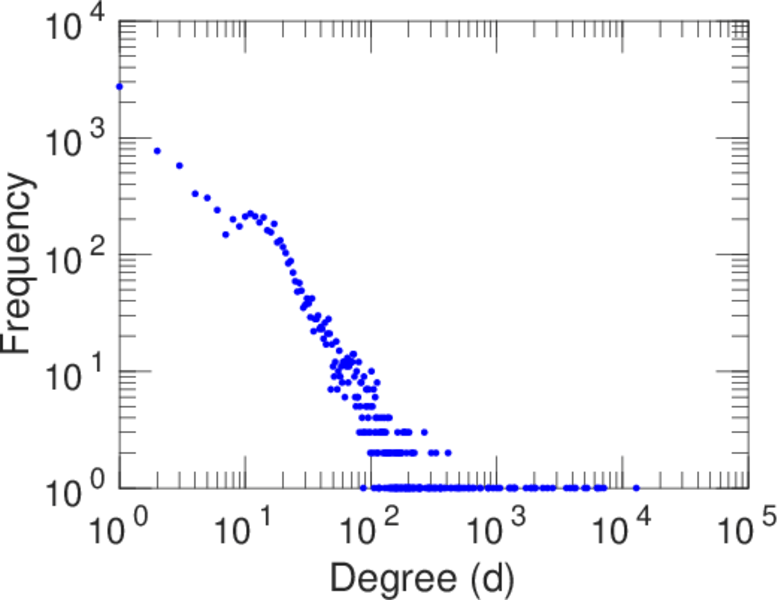
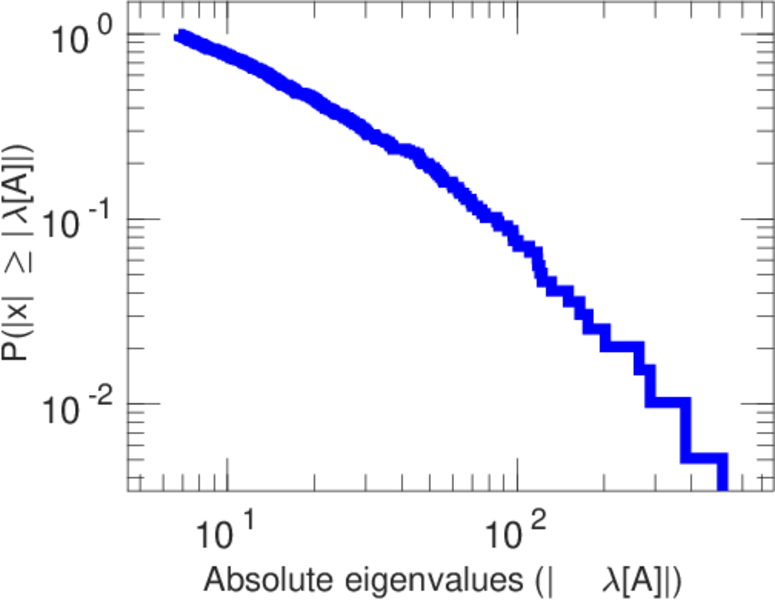
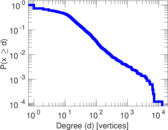
| Power law exponent | γ = | 1.800 10
|
| Tail power law exponent | γt = | 2.541 00
|
| Tail power law exponent with p | γ3 = | 2.541 00
|
| p-value | p = | 0.000 00
|
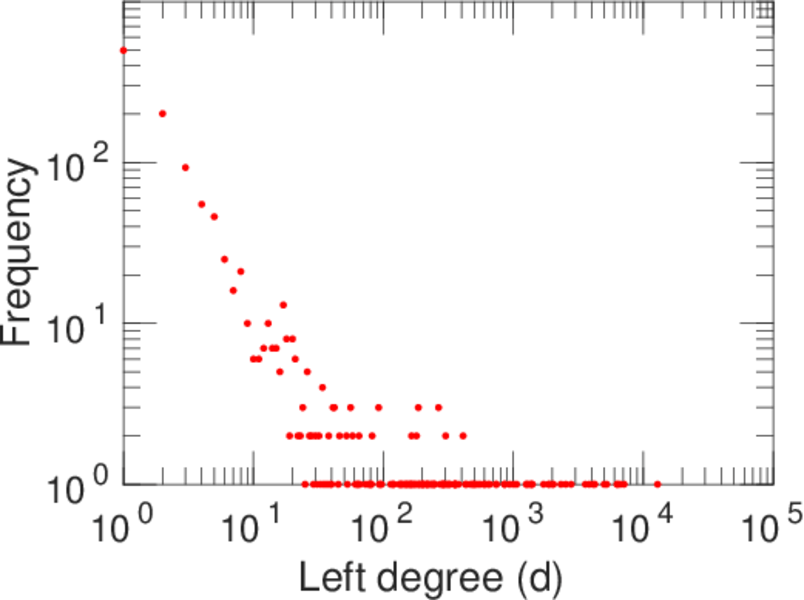
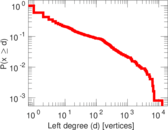
| Left tail power law exponent with p | γ3,1 = | 1.641 00
|
| Left p-value | p1 = | 0.000 00
|
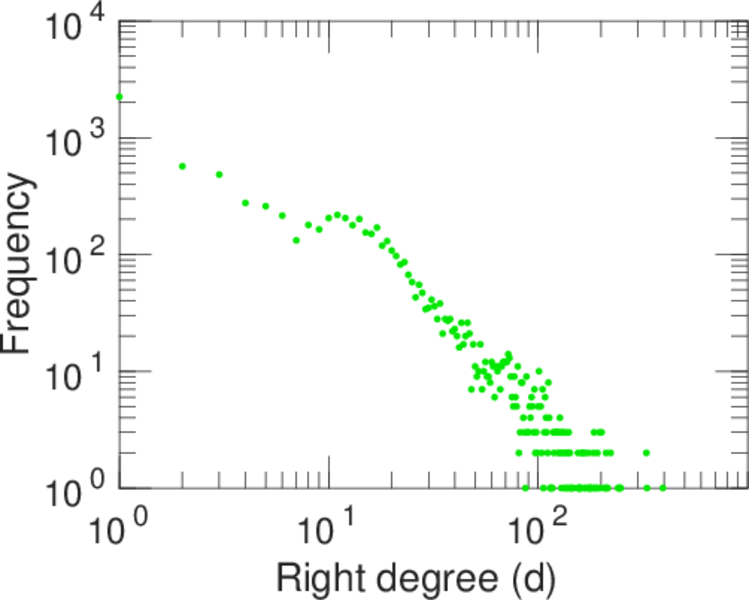
| Right tail power law exponent with p | γ3,2 = | 3.171 00
|
| Right p-value | p2 = | 0.000 00
|
| Degree assortativity | ρ = | −0.256 082
|
| Degree assortativity p-value | pρ = | 0.000 00
|
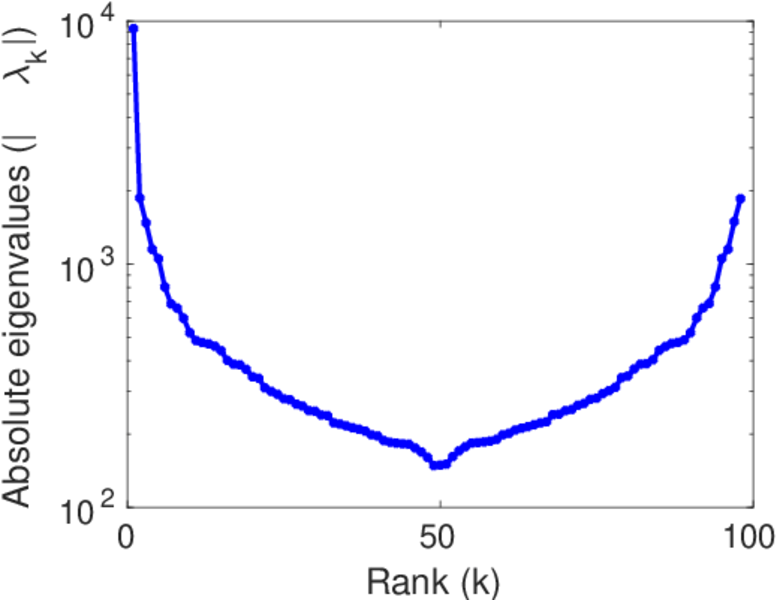
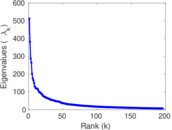
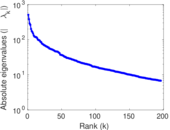
| Spectral norm | α = | 511.770
|
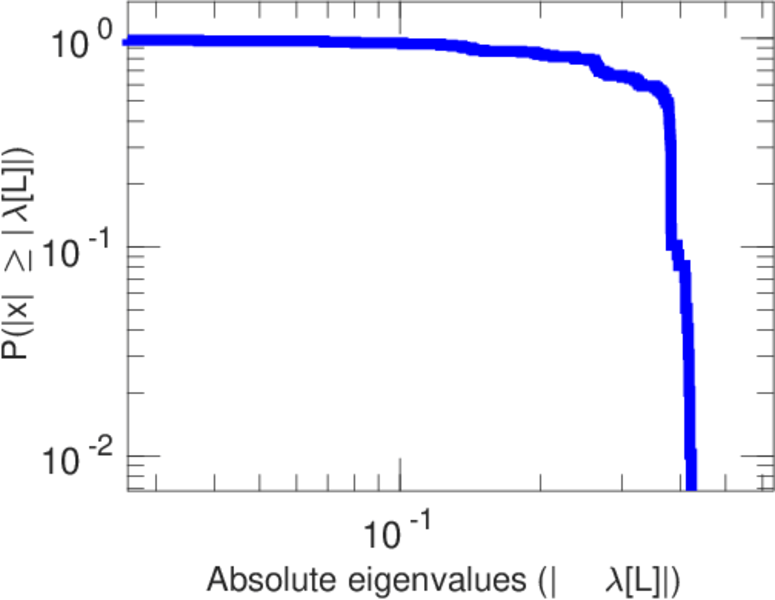
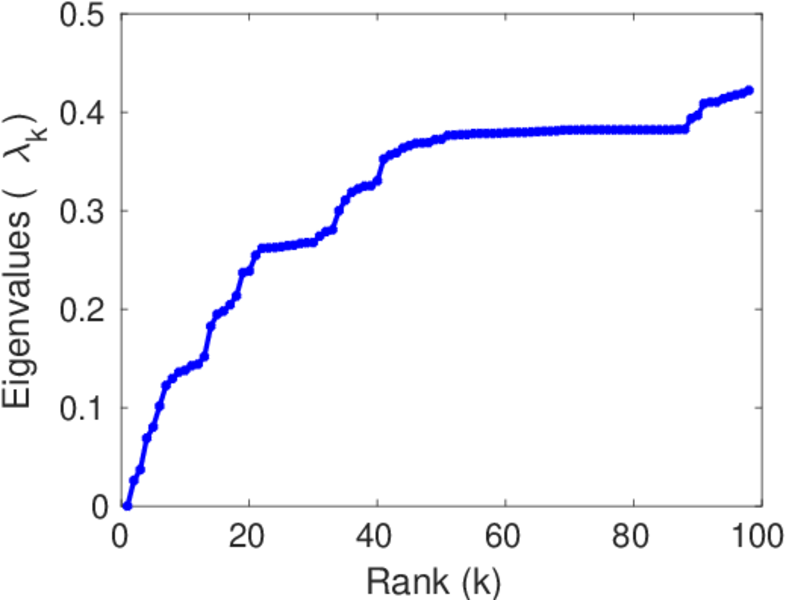
| Algebraic connectivity | a = | 0.026 058 5
|
| Spectral separation | |λ1[A] / λ2[A]| = | 1.341 62
|
| Controllability | C = | 6,944
|
| Relative controllability | Cr = | 0.753 636
|
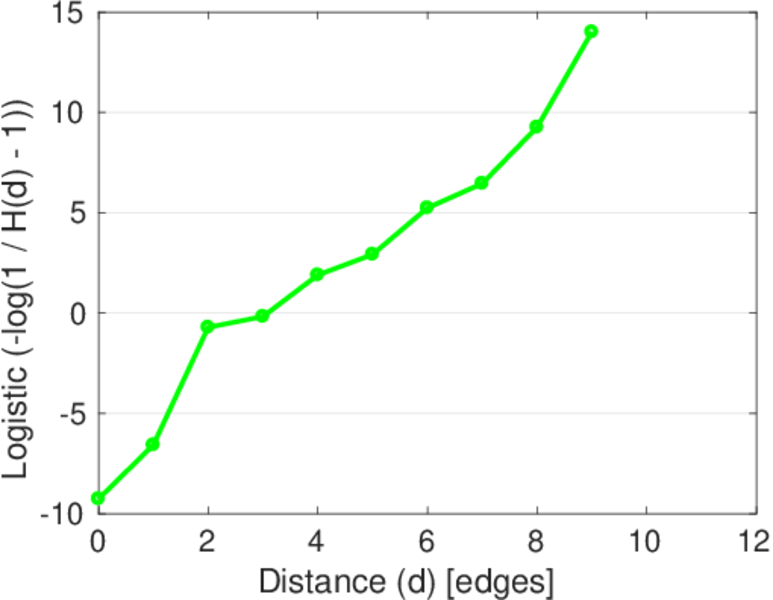
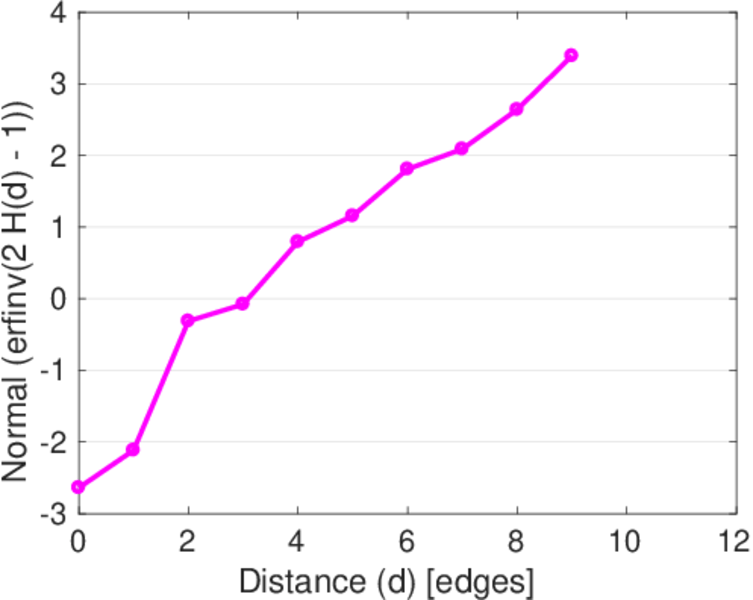
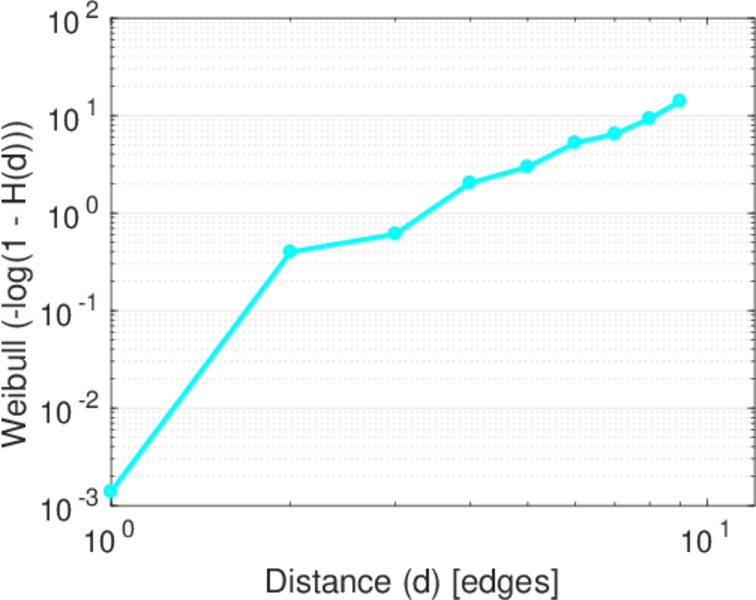
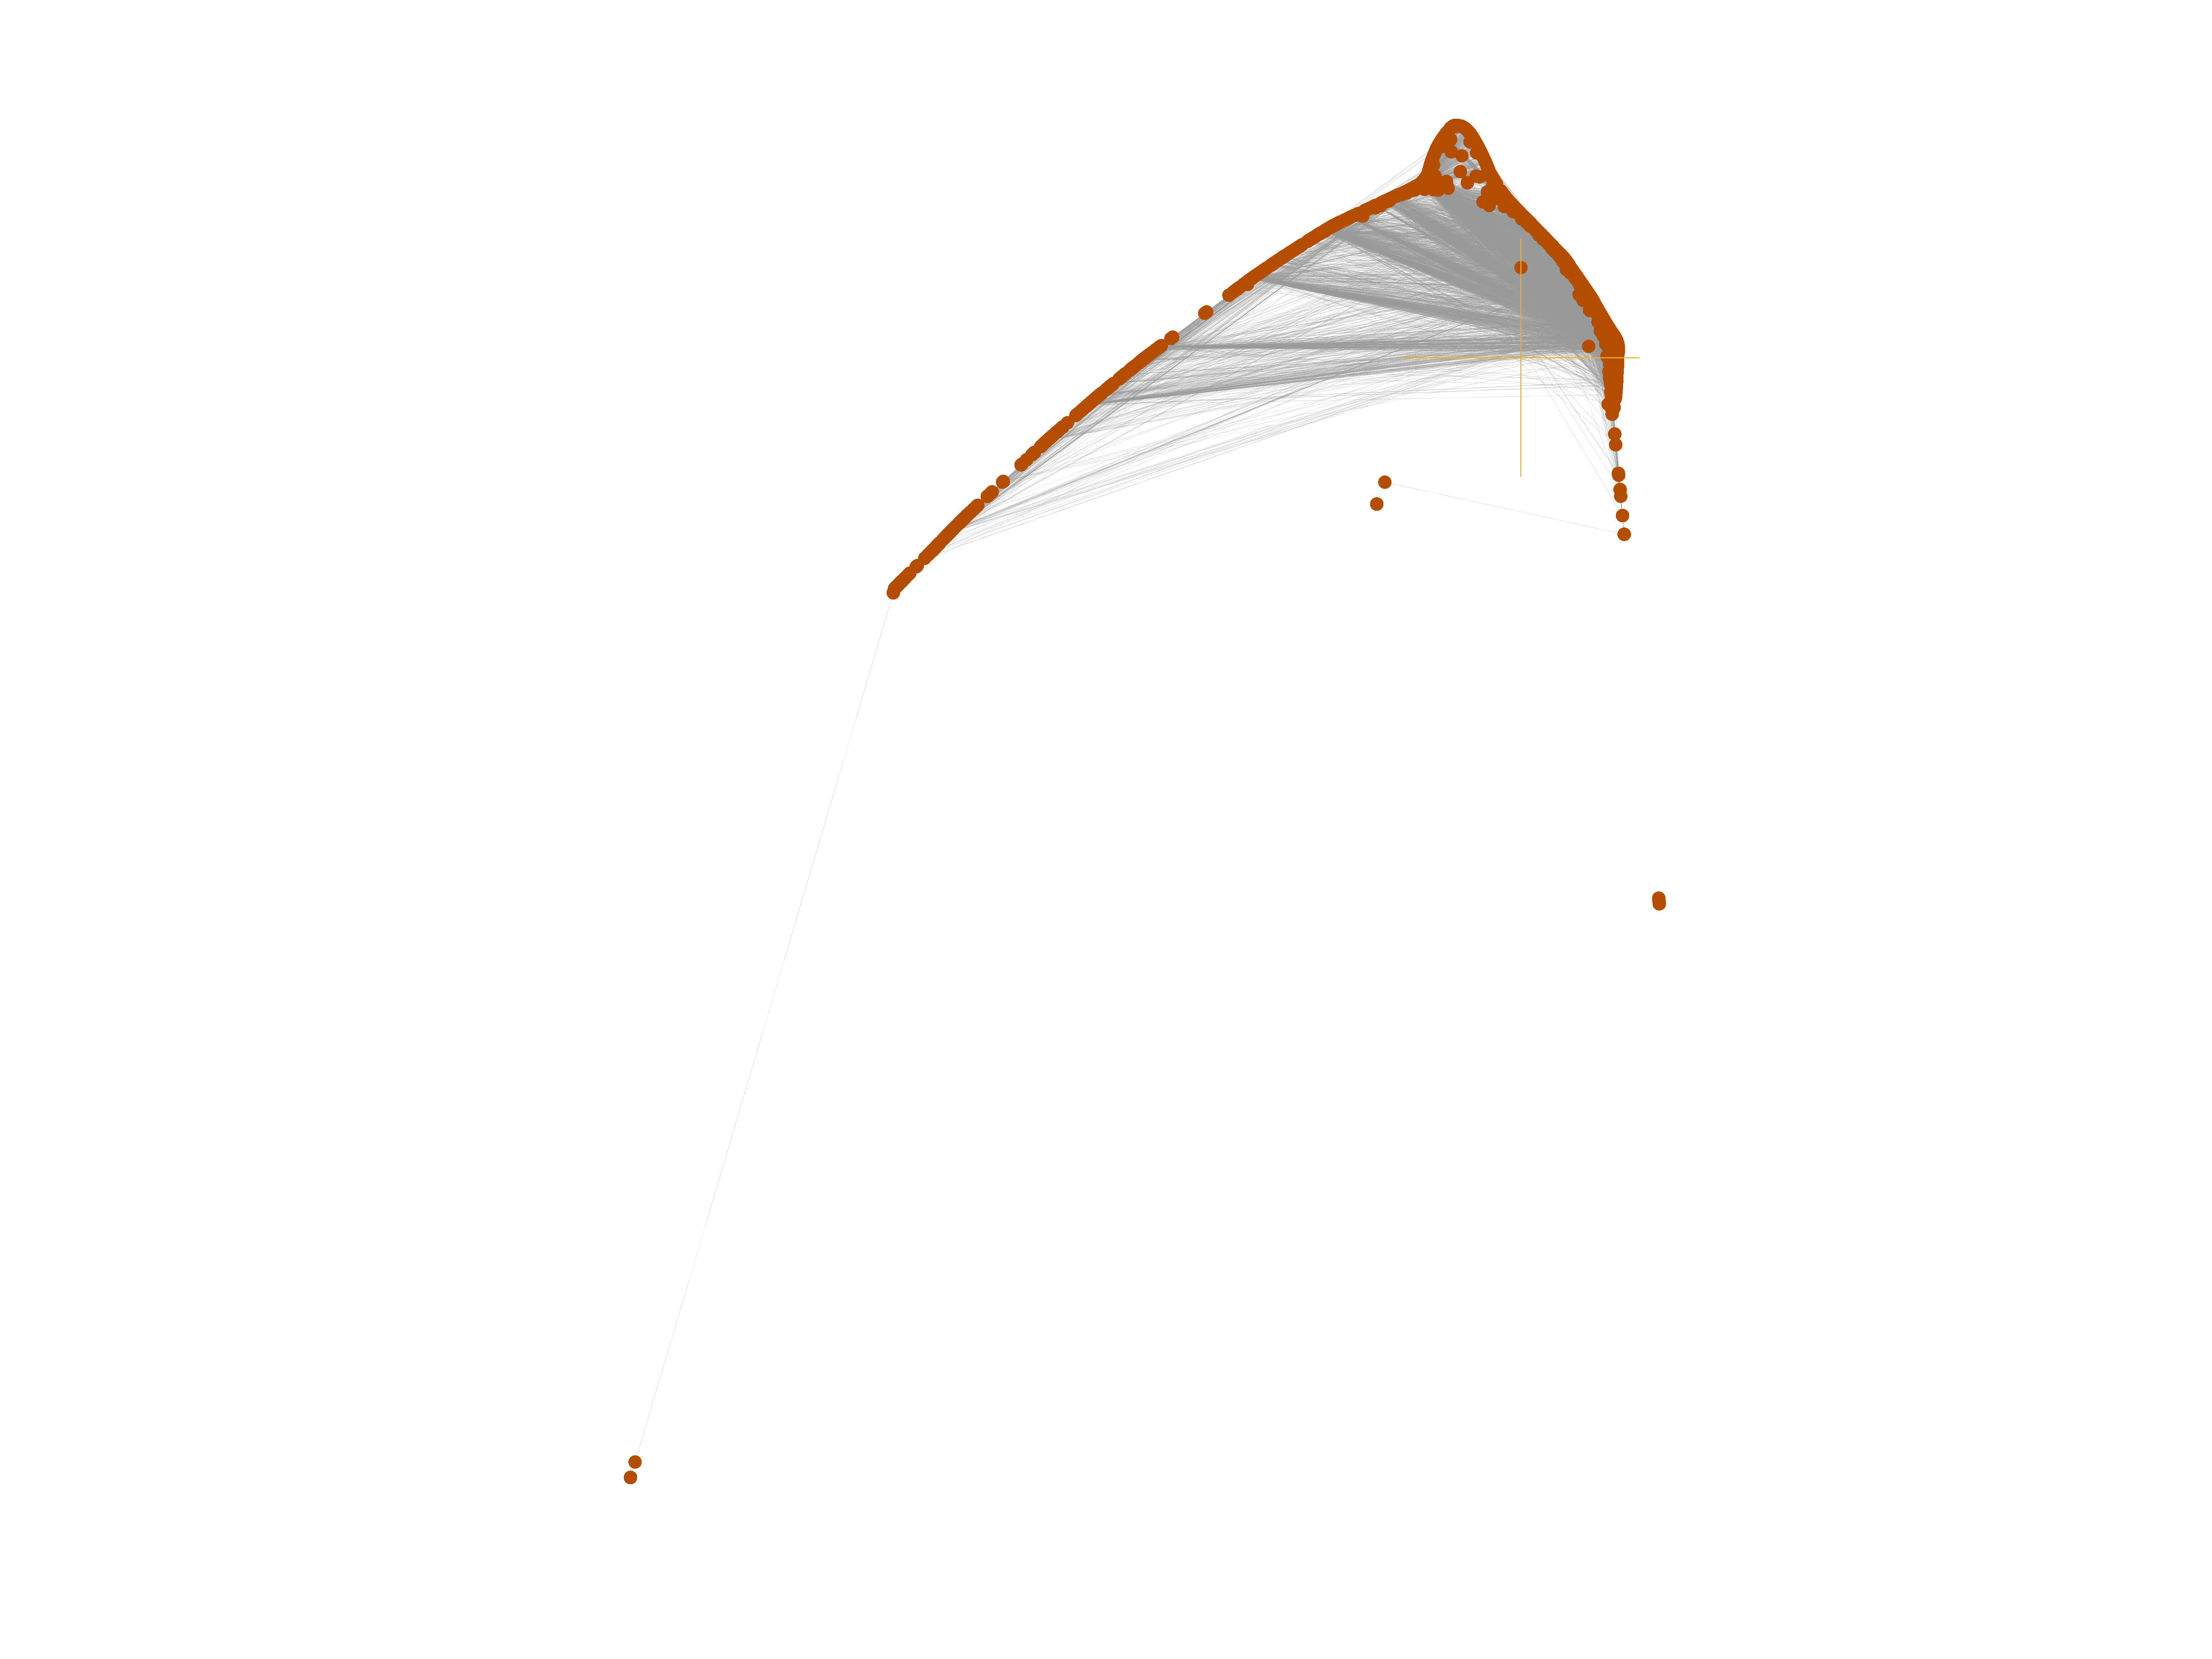
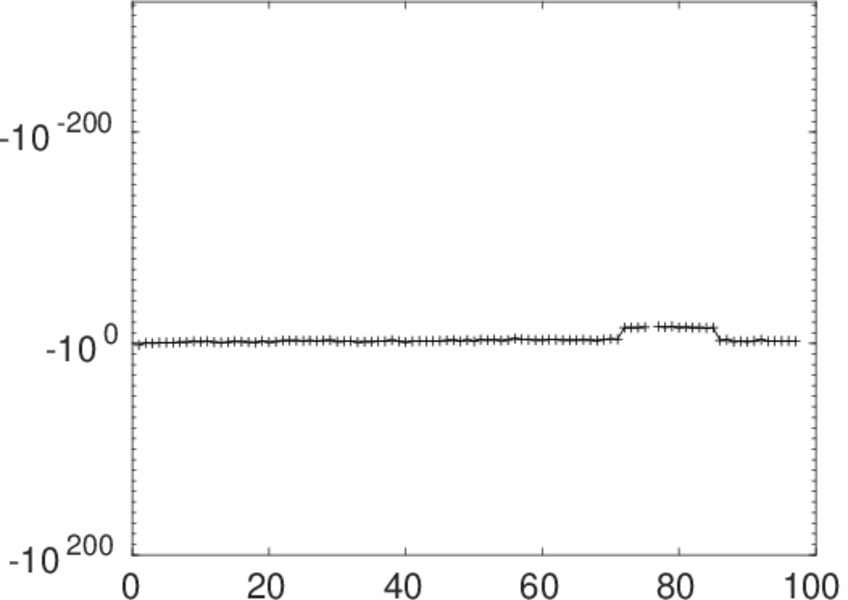
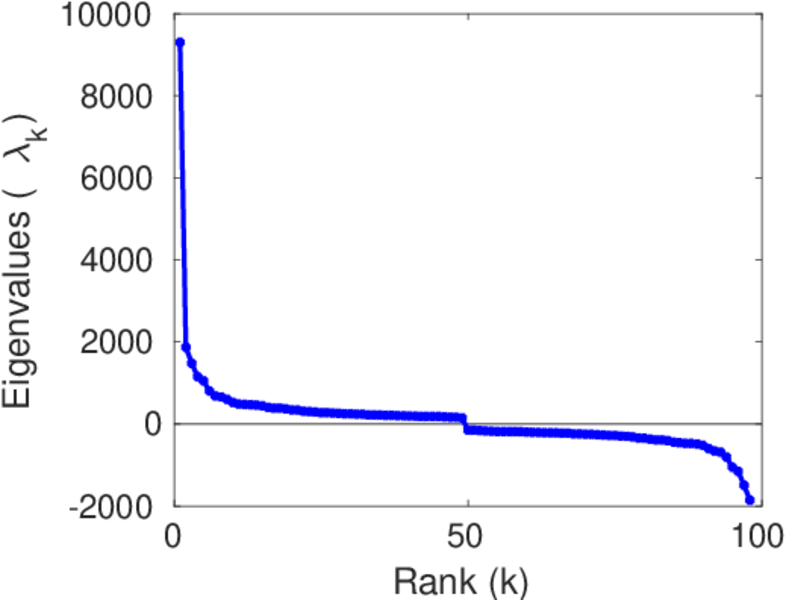
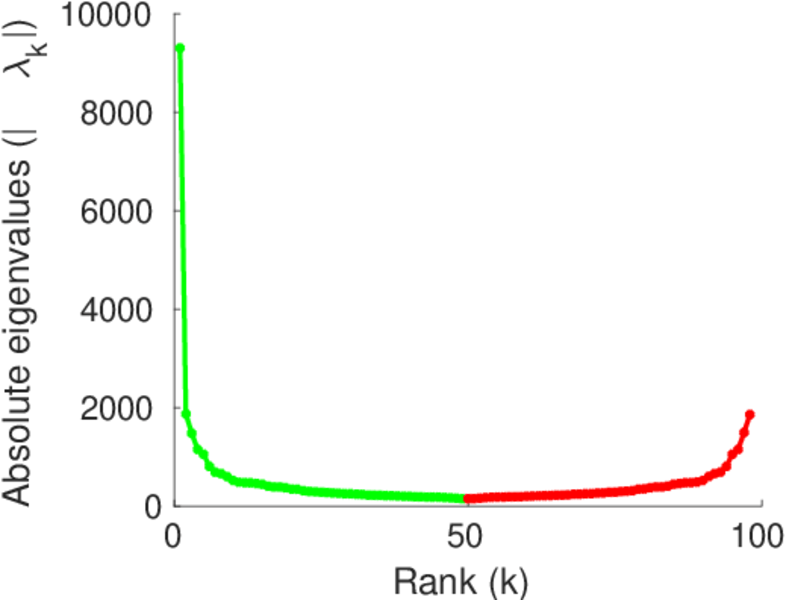
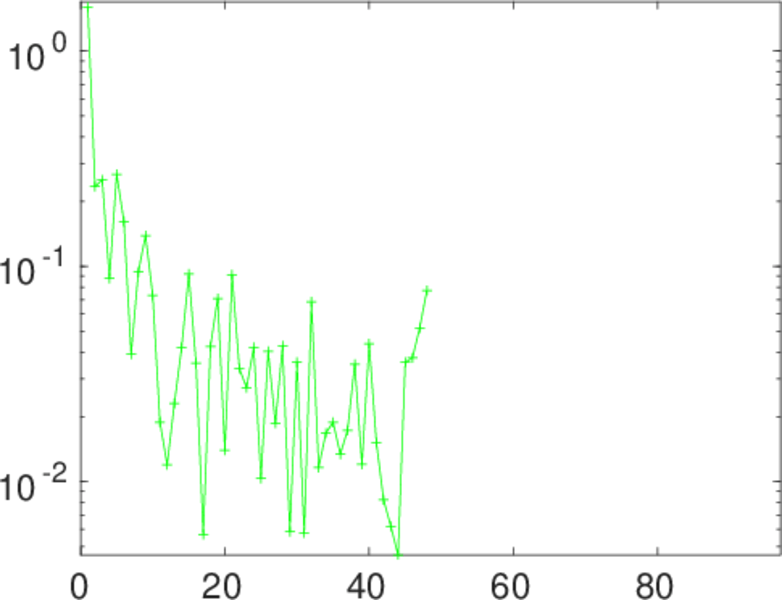
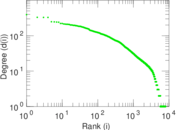
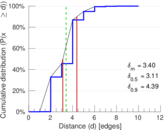
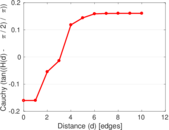
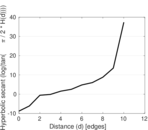
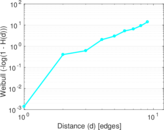
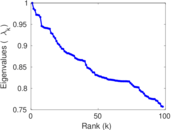
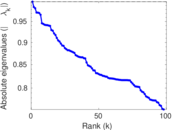
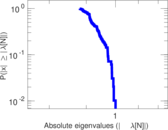
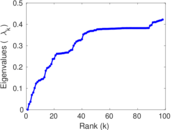
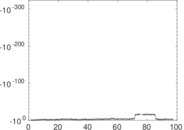
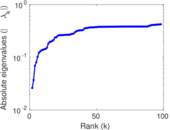
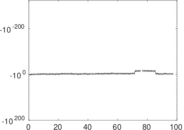
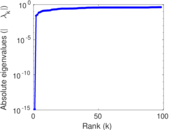
Plots


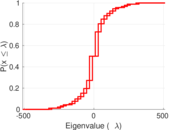
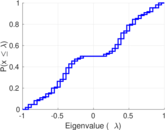
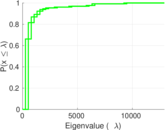


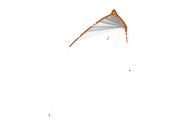


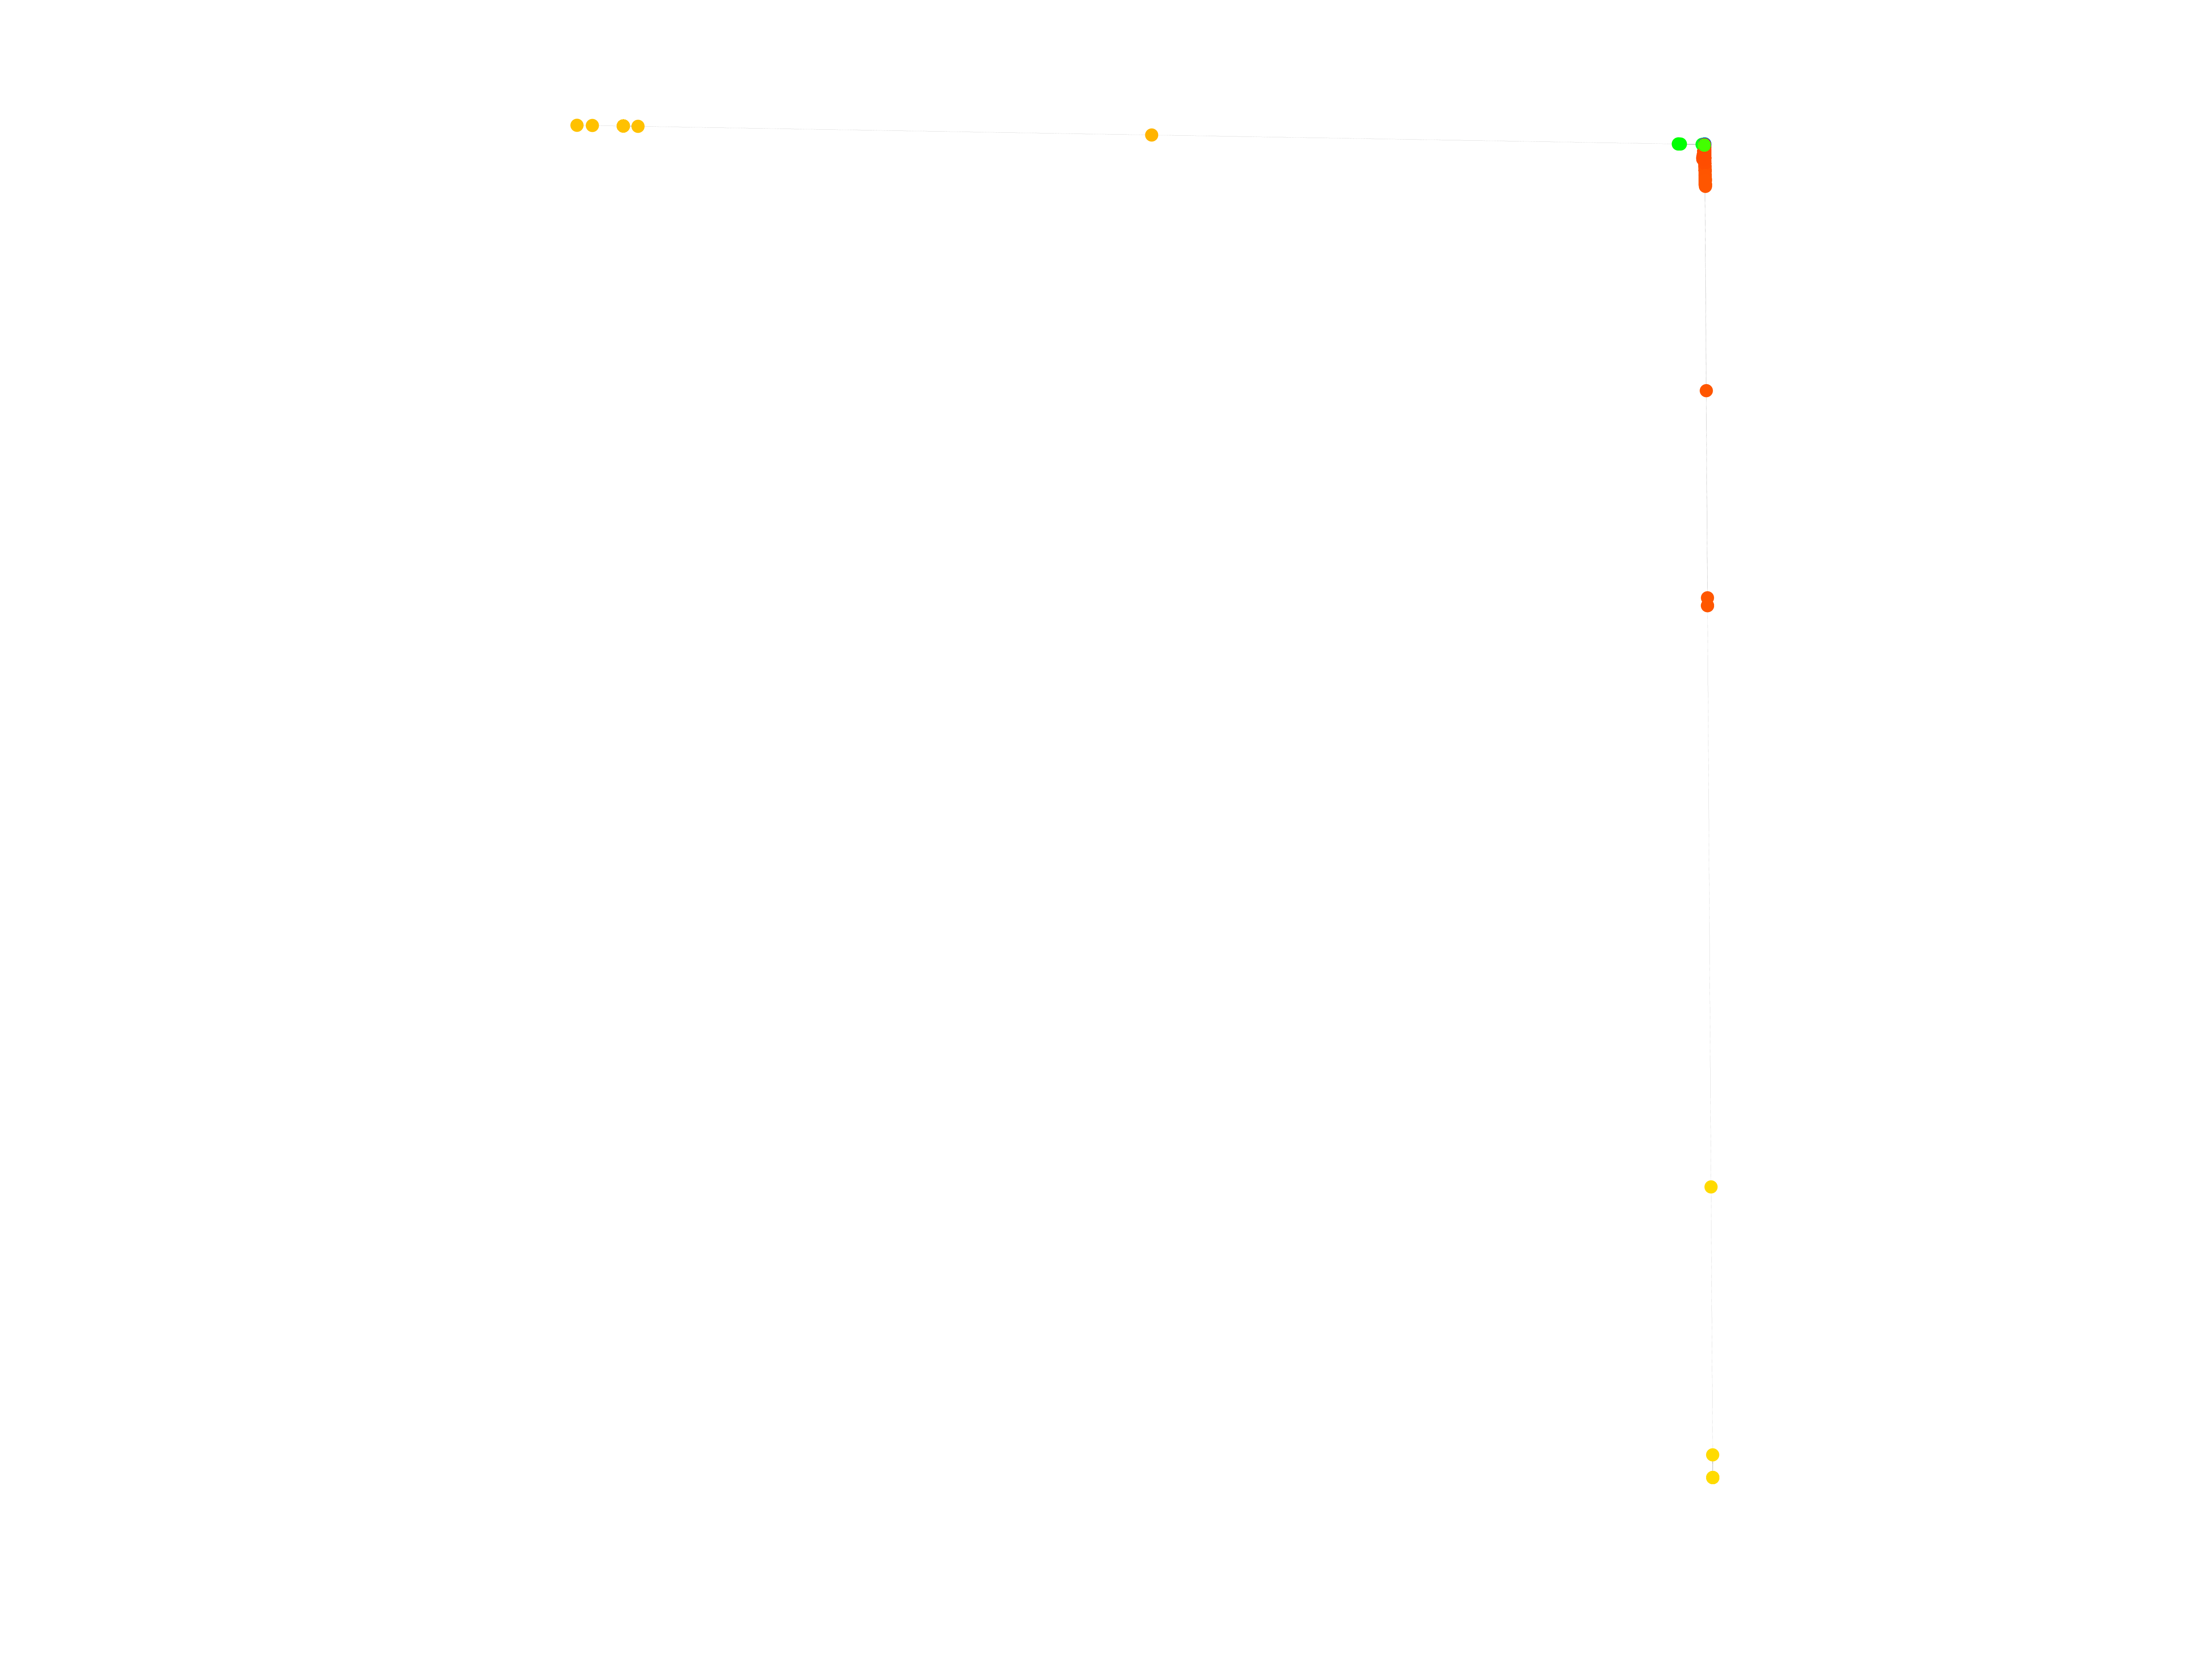
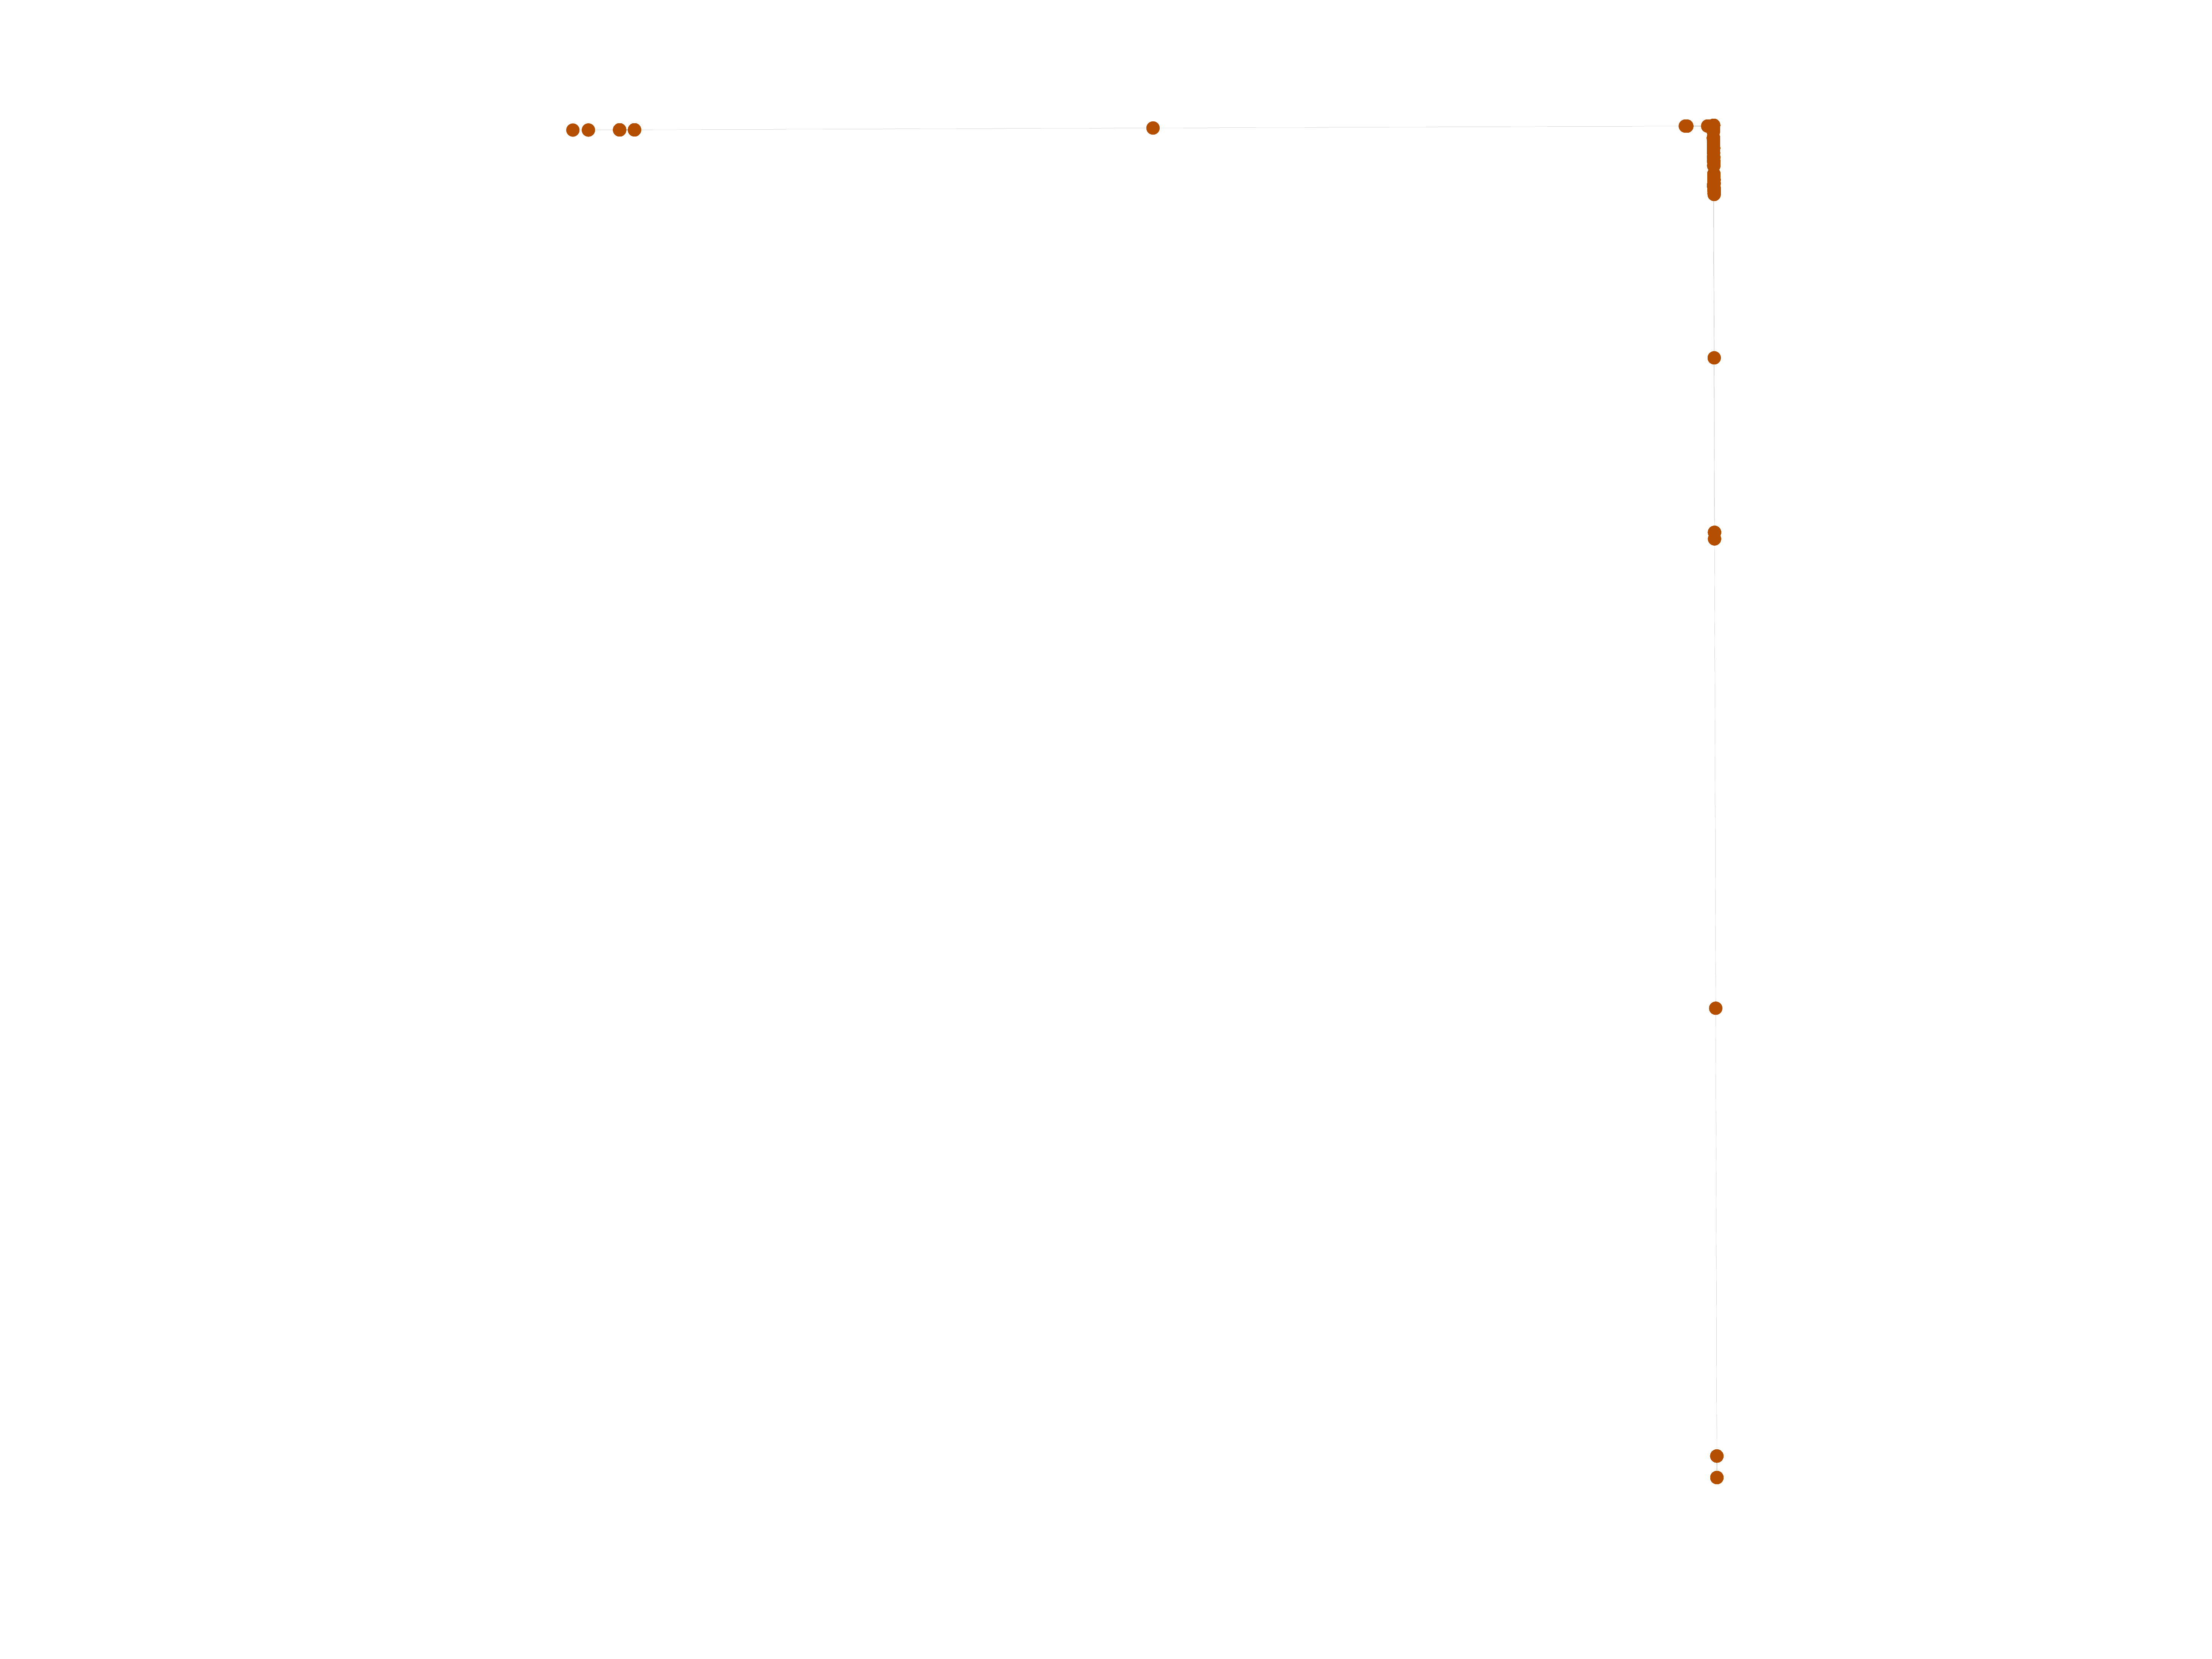
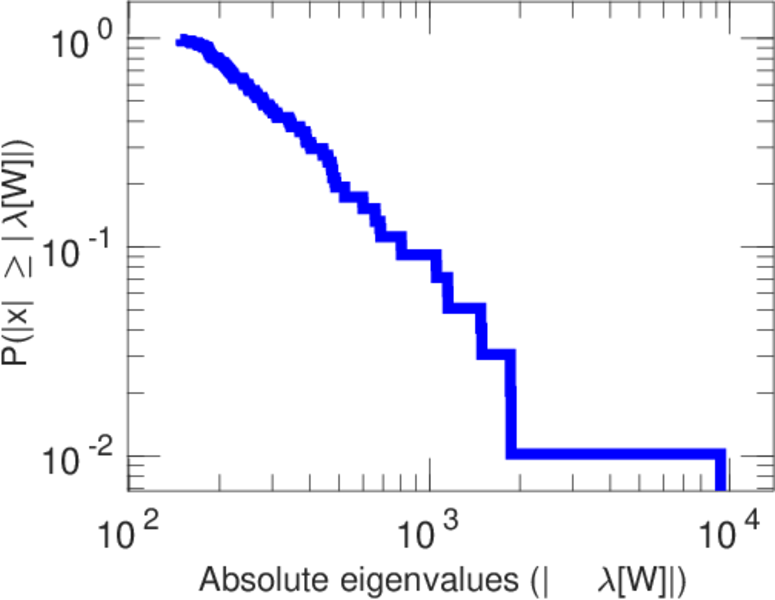
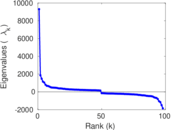
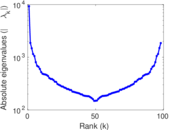
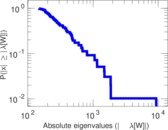
Matrix decompositions plots


Downloads
References
|
[1]
|
Jérôme Kunegis.
KONECT – The Koblenz Network Collection.
In Proc. Int. Conf. on World Wide Web Companion, pages
1343–1350, 2013.
[ http ]
|
|
[2]
|
Wikimedia Foundation.
Wikimedia downloads.
http://dumps.wikimedia.org/, January 2010.
|
 KONECT ‣ Networks ‣
Buy Me a Coffee
KONECT ‣ Networks ‣
Buy Me a Coffee