Wikipedia edits (rmy)
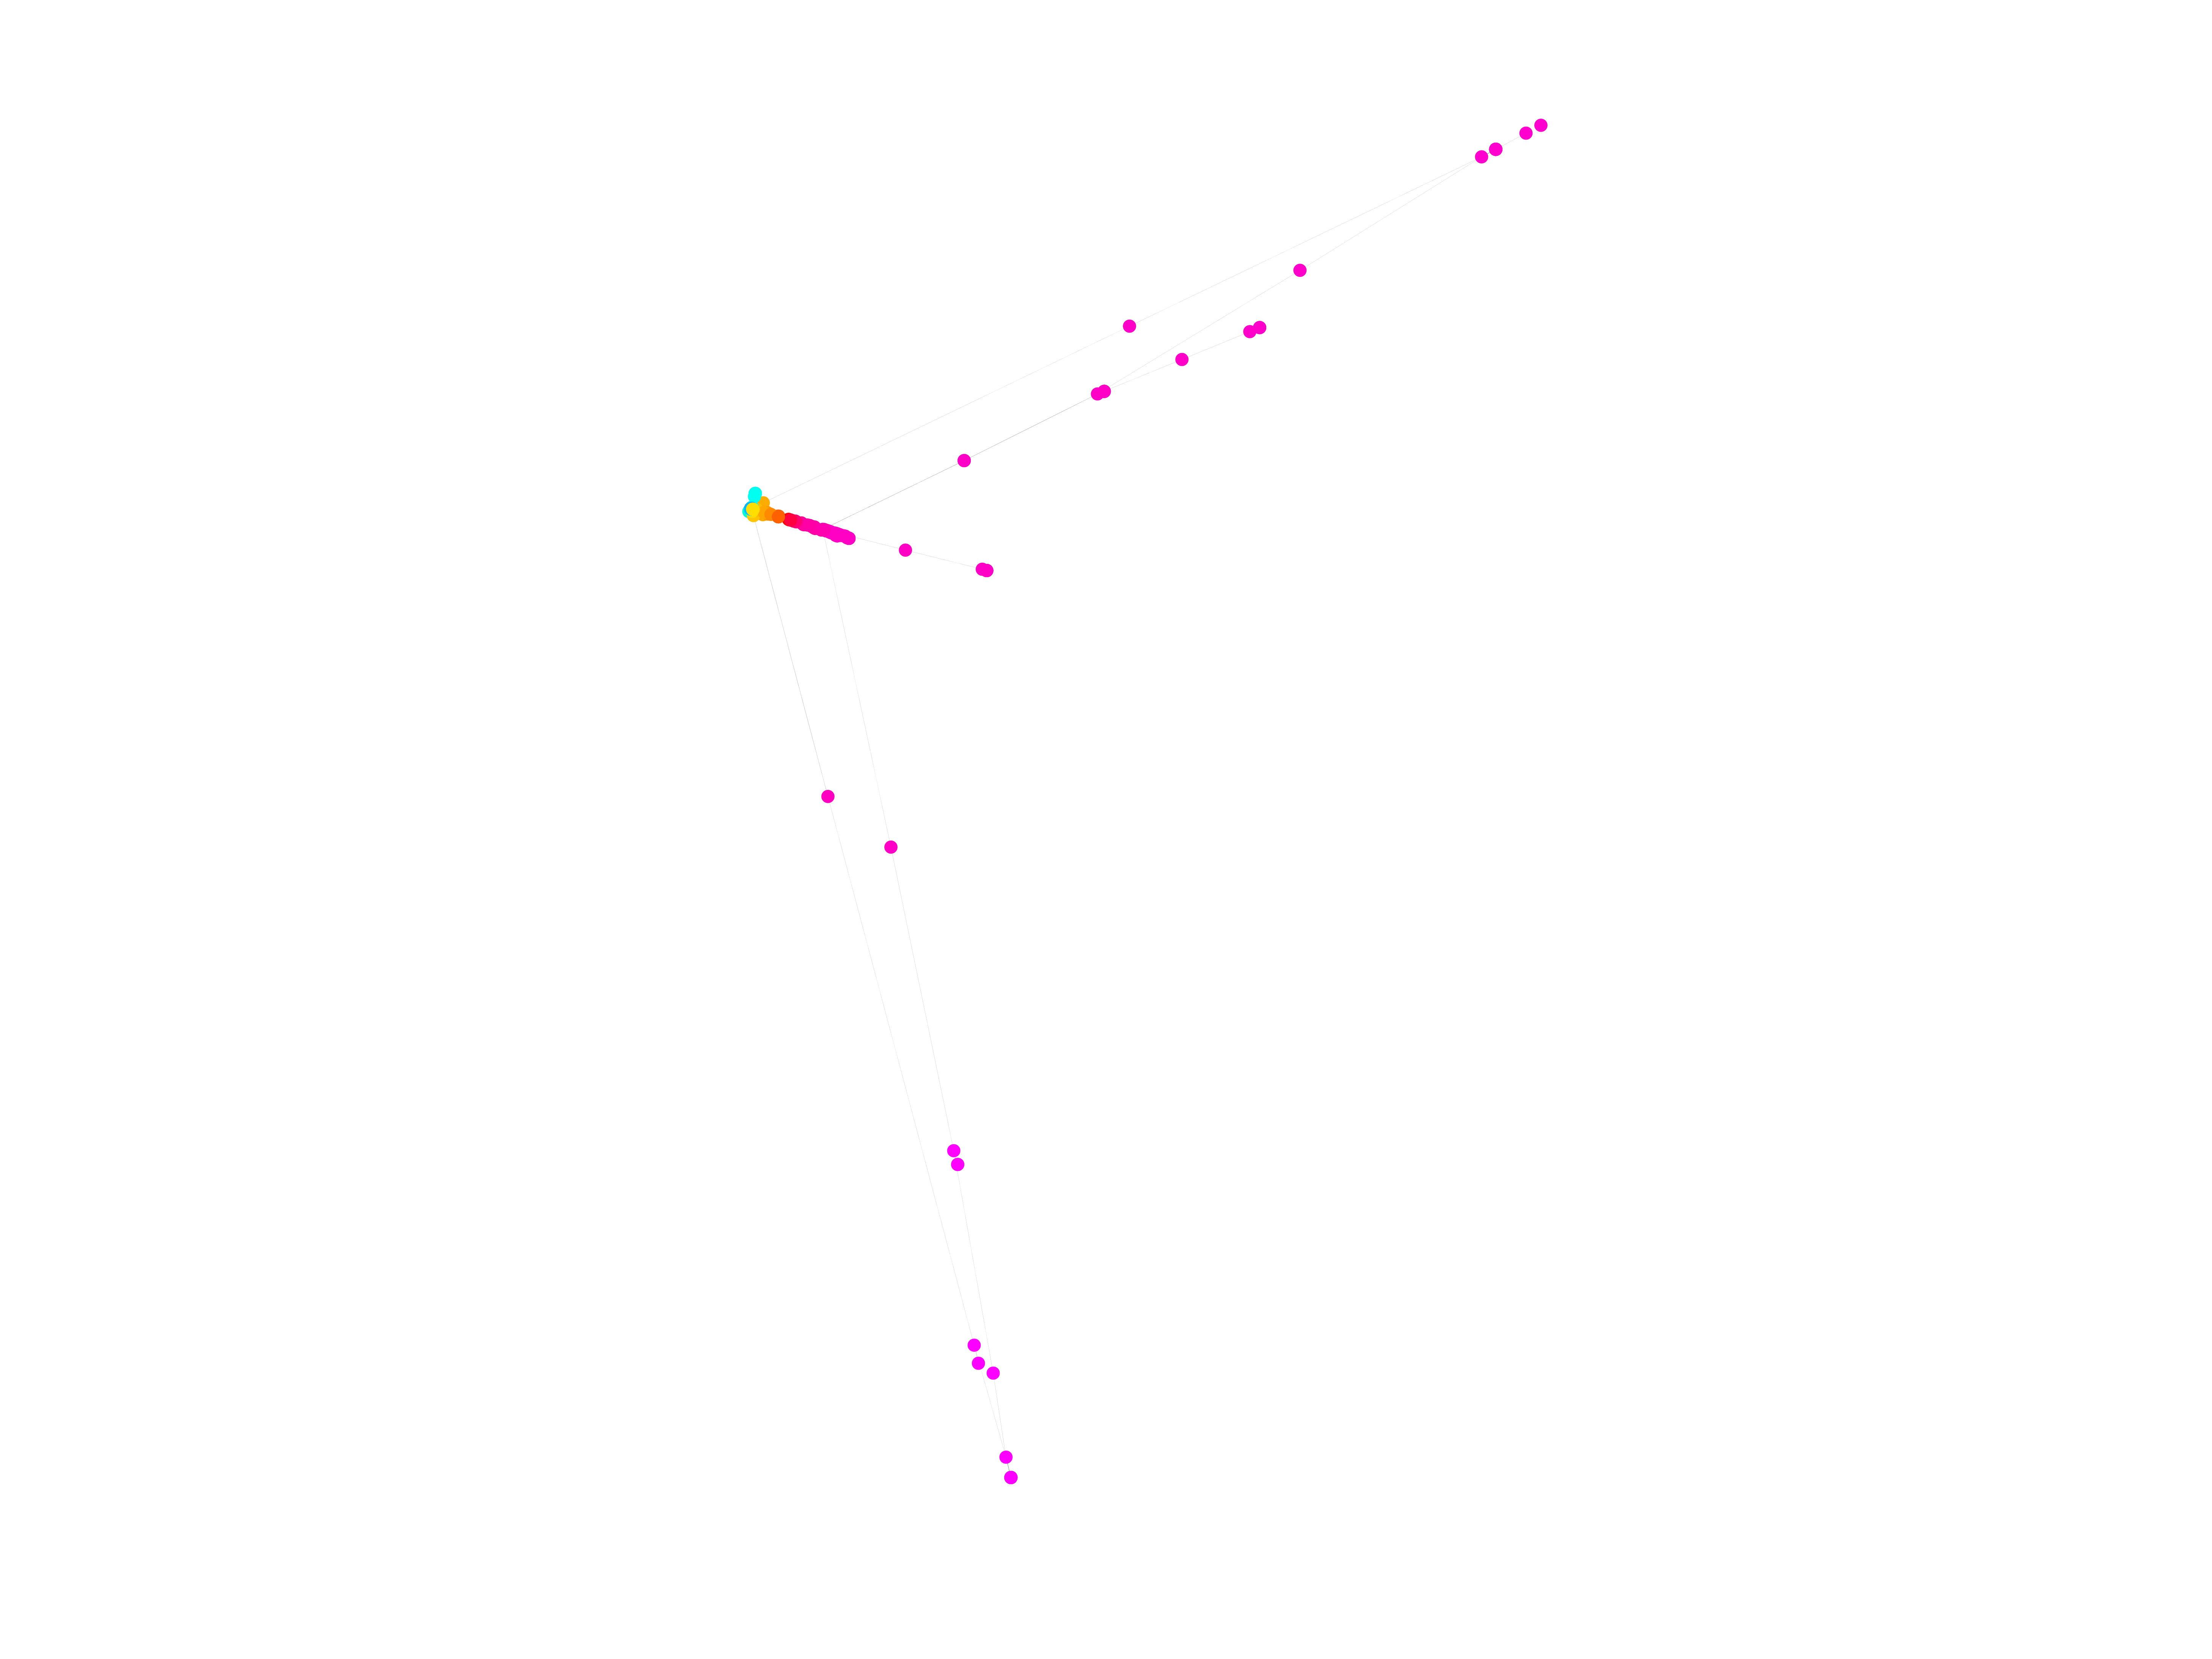
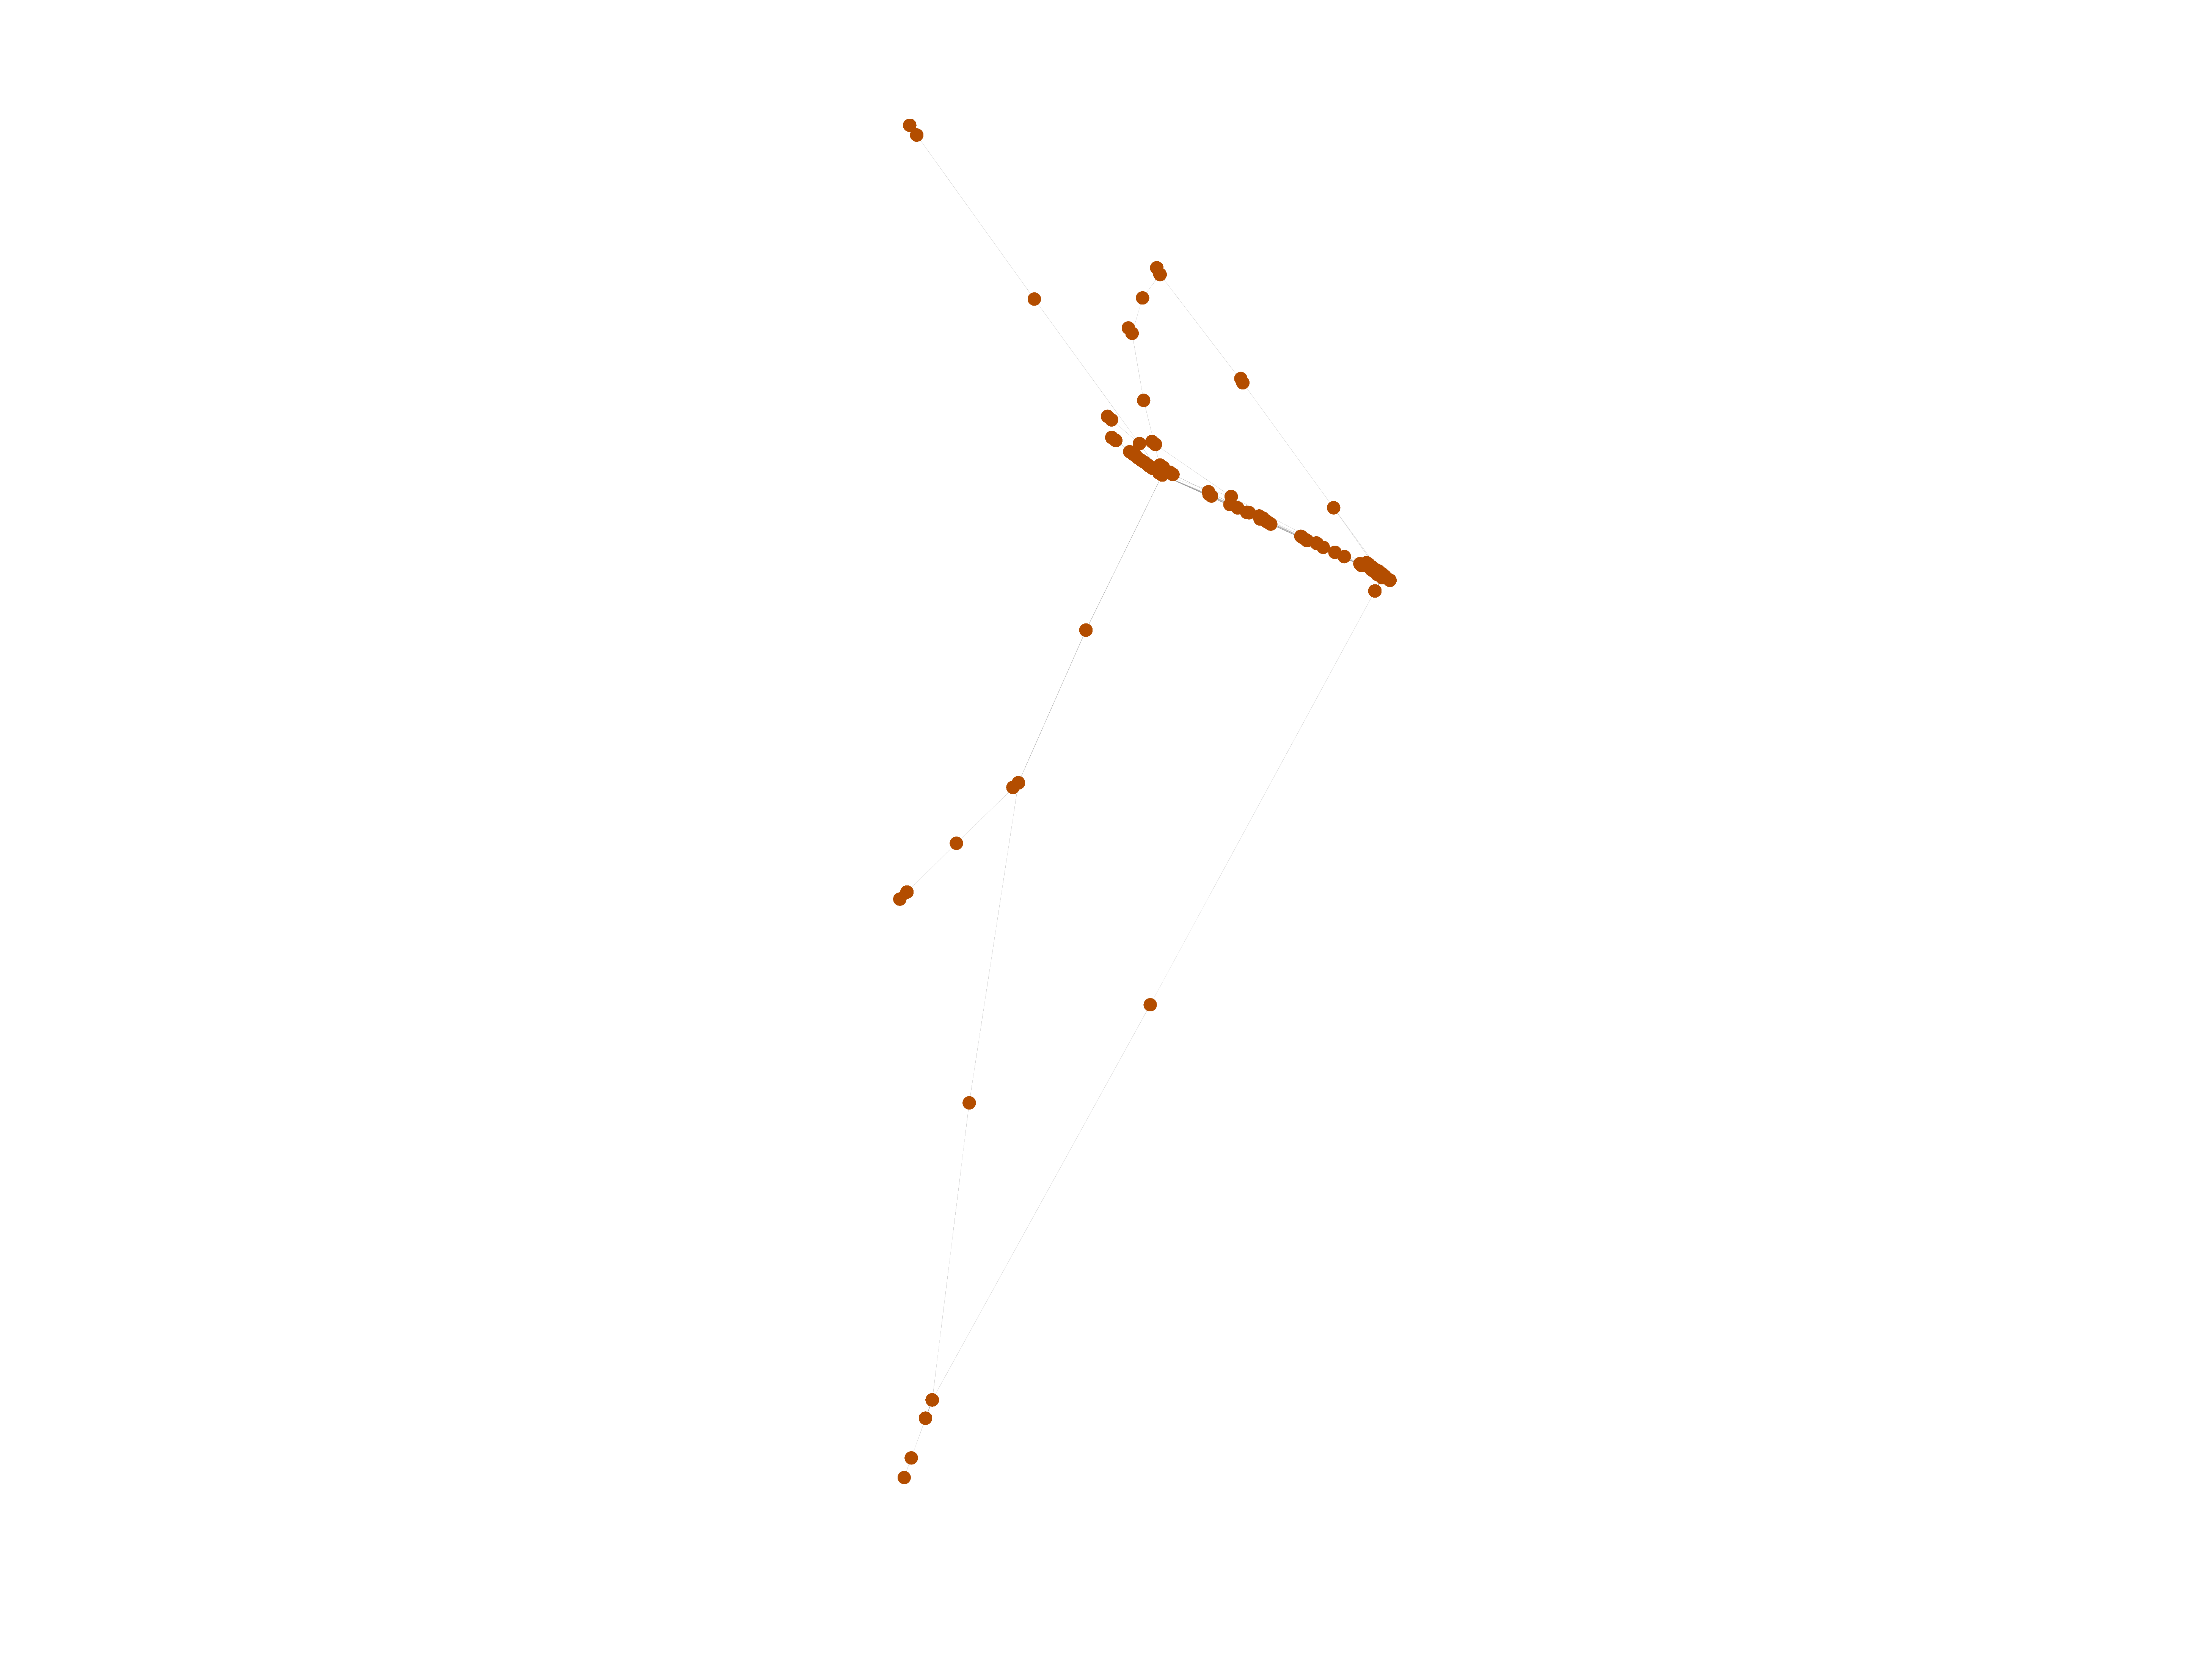
This is the bipartite edit network of the Romani Wikipedia. It contains users
and pages from the Romani Wikipedia, connected by edit events. Each edge
represents an edit. The dataset includes the timestamp of each edit.
Metadata
Statistics
| Size | n = | 3,197
|
| Left size | n1 = | 761
|
| Right size | n2 = | 2,436
|
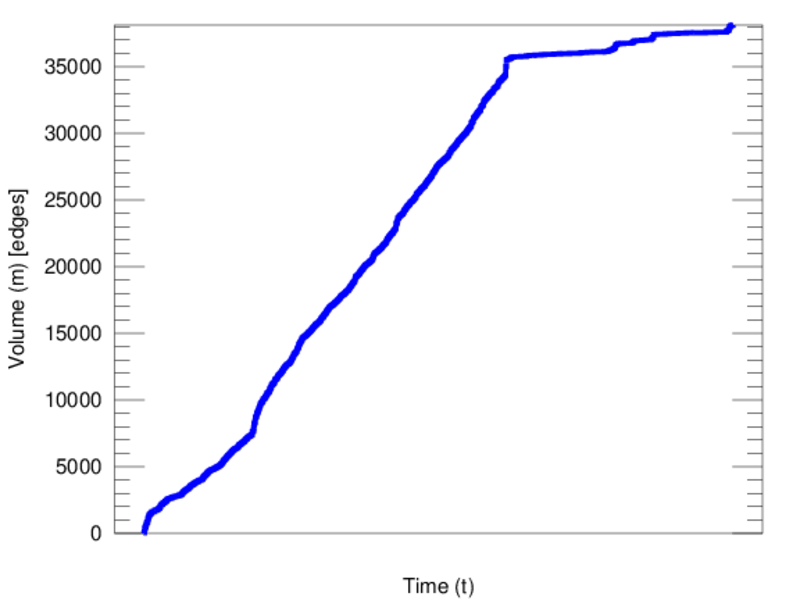
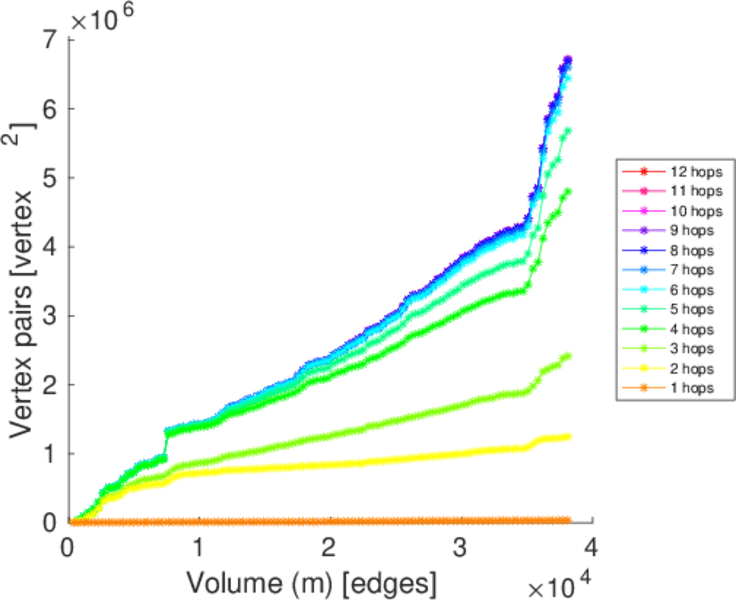
| Volume | m = | 38,114
|
| Unique edge count | m̿ = | 15,502
|
| Wedge count | s = | 2,274,806
|
| Claw count | z = | 320,616,065
|
| Cross count | x = | 42,933,372,690
|
| Square count | q = | 8,480,629
|
| 4-Tour count | T4 = | 76,984,420
|
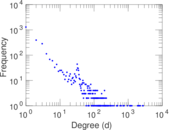
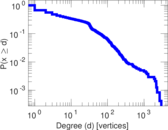
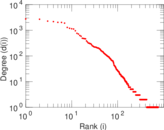
| Maximum degree | dmax = | 2,748
|
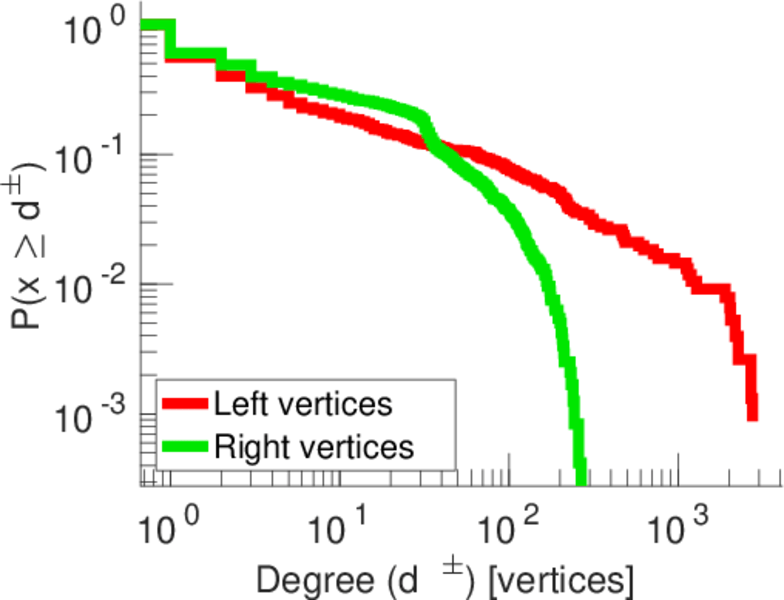
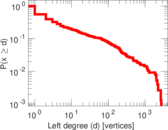
| Maximum left degree | d1max = | 2,748
|
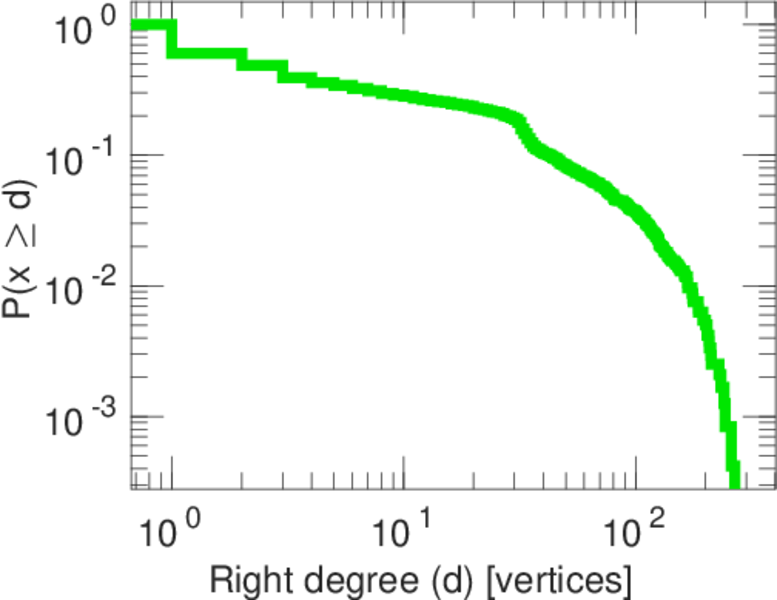
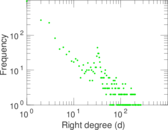
| Maximum right degree | d2max = | 267
|
| Average degree | d = | 23.843 6
|
| Average left degree | d1 = | 50.084 1
|
| Average right degree | d2 = | 15.646 1
|
| Fill | p = | 0.008 362 30
|
| Average edge multiplicity | m̃ = | 2.458 65
|
| Size of LCC | N = | 2,591
|
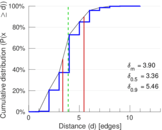
| Diameter | δ = | 12
|
| 50-Percentile effective diameter | δ0.5 = | 3.360 54
|
| 90-Percentile effective diameter | δ0.9 = | 5.459 14
|
| Median distance | δM = | 4
|
| Mean distance | δm = | 3.898 72
|
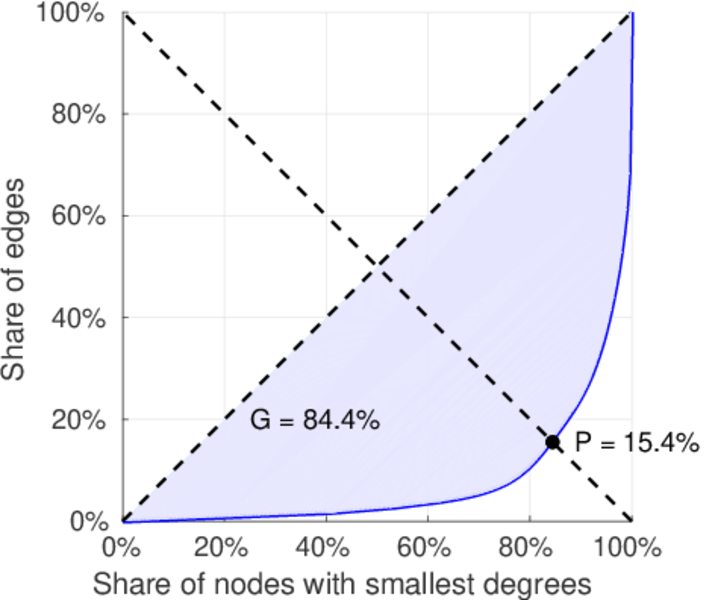
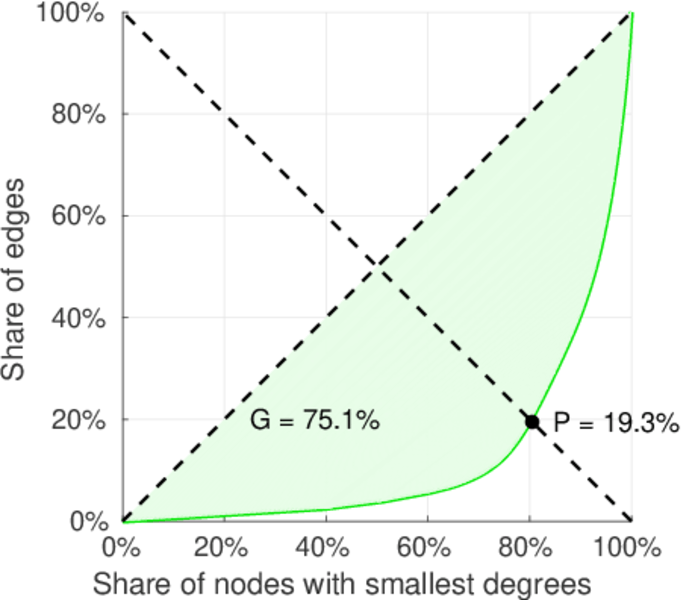
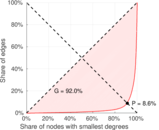
| Gini coefficient | G = | 0.828 237
|
| Balanced inequality ratio | P = | 0.168 836
|
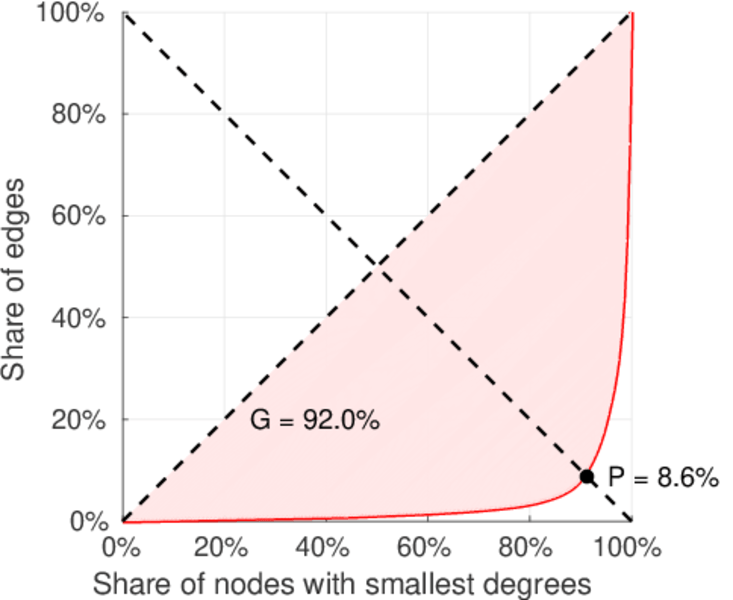
| Left balanced inequality ratio | P1 = | 0.086 293 8
|
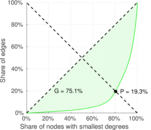
| Right balanced inequality ratio | P2 = | 0.193 498
|
| Relative edge distribution entropy | Her = | 0.807 683
|
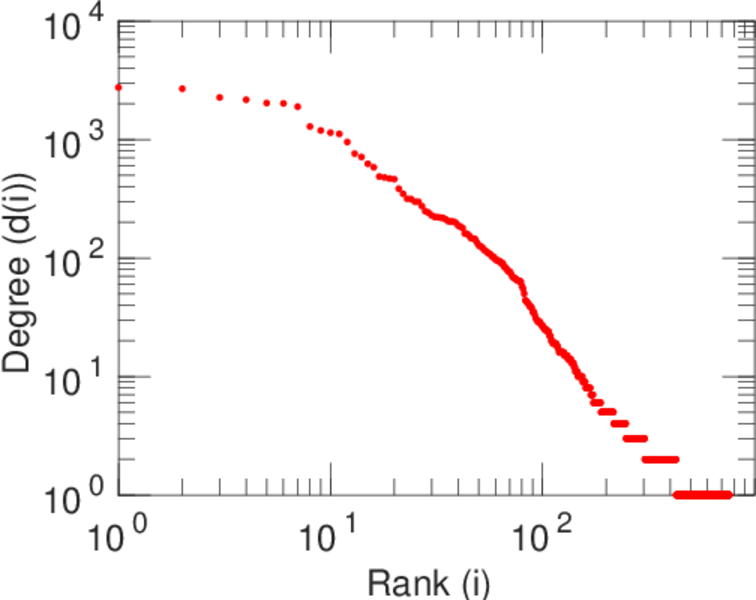
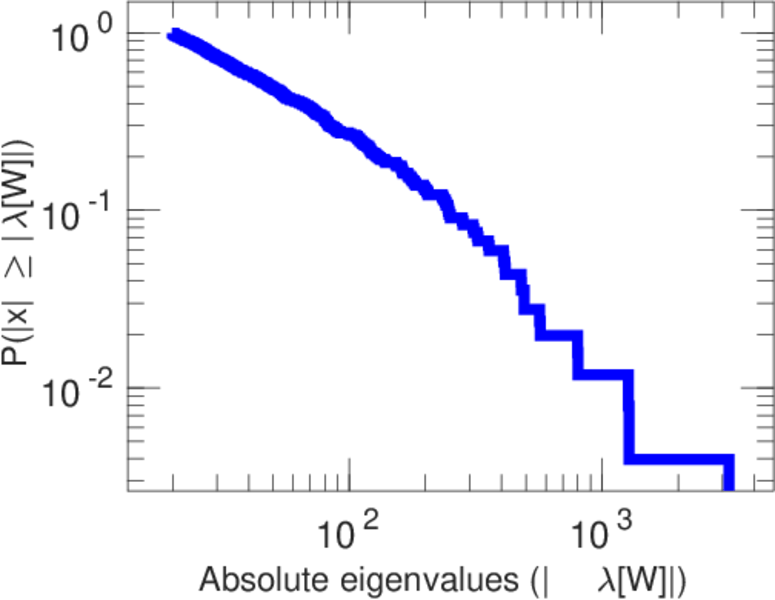
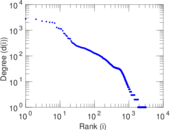
| Power law exponent | γ = | 2.019 41
|
| Tail power law exponent | γt = | 2.361 00
|
| Tail power law exponent with p | γ3 = | 2.361 00
|
| p-value | p = | 0.139 000
|
| Left tail power law exponent with p | γ3,1 = | 1.671 00
|
| Left p-value | p1 = | 0.000 00
|
| Right tail power law exponent with p | γ3,2 = | 3.731 00
|
| Right p-value | p2 = | 0.025 000 0
|
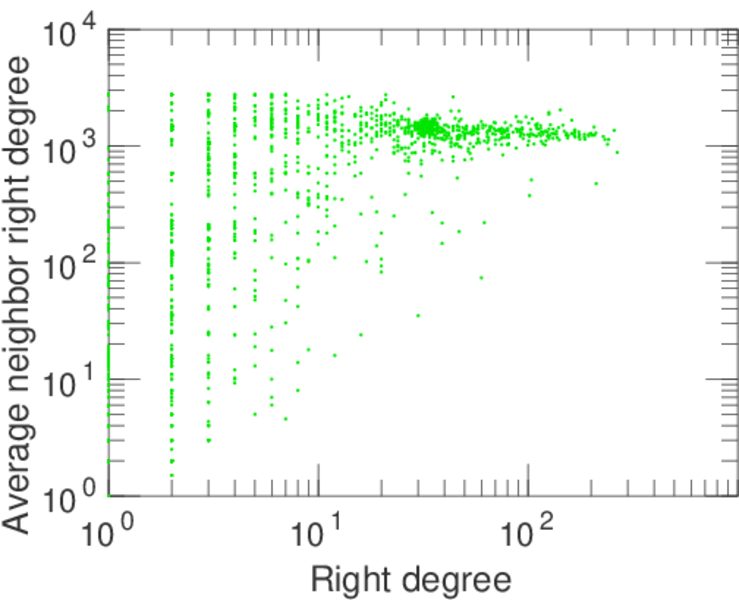
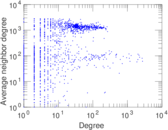
| Degree assortativity | ρ = | −0.114 880
|
| Degree assortativity p-value | pρ = | 1.068 55 × 10−46
|
| Spectral norm | α = | 340.038
|
| Algebraic connectivity | a = | 0.038 937 9
|
| Spectral separation | |λ1[A] / λ2[A]| = | 1.689 65
|
| Controllability | C = | 1,781
|
| Relative controllability | Cr = | 0.565 936
|
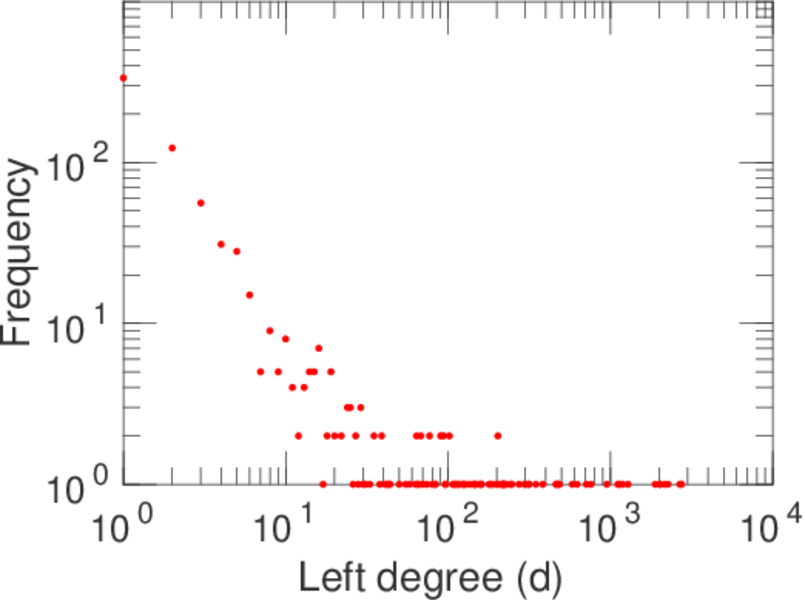
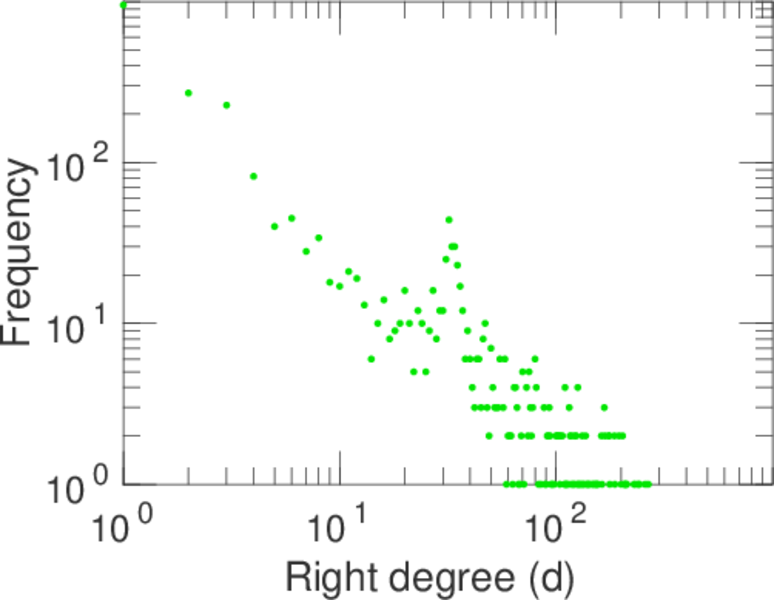
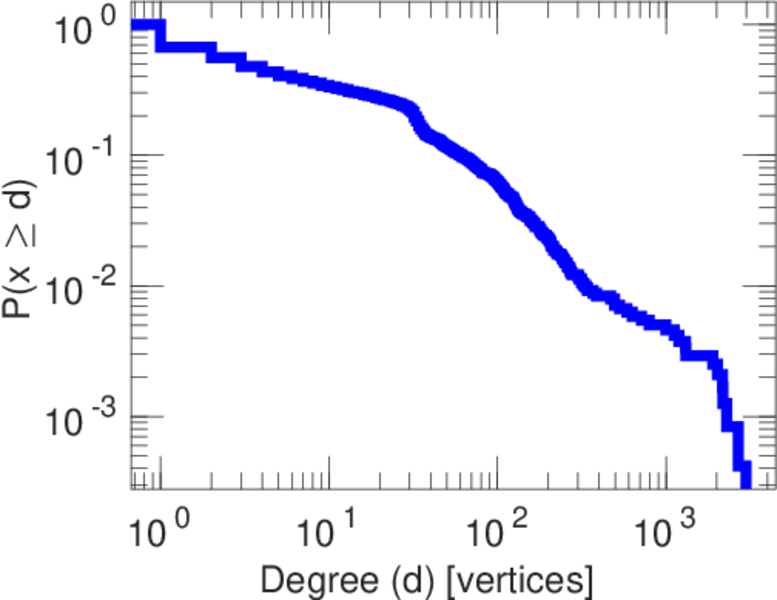
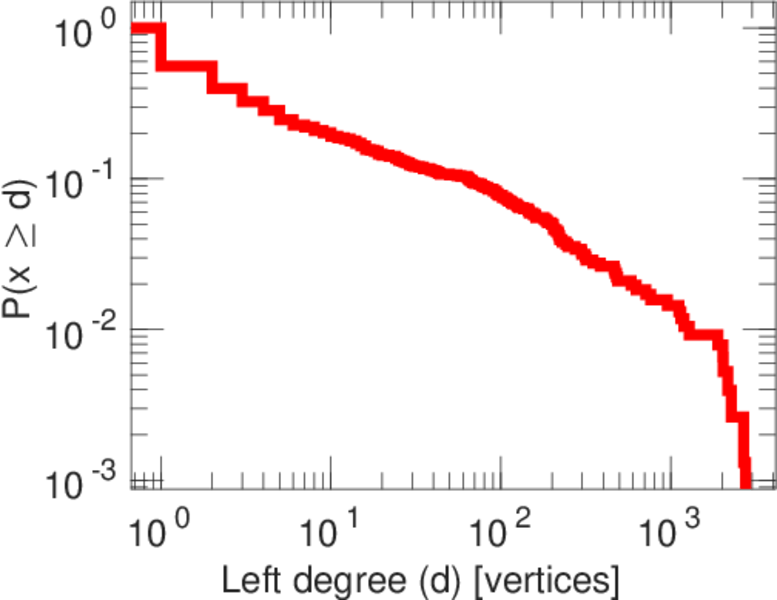
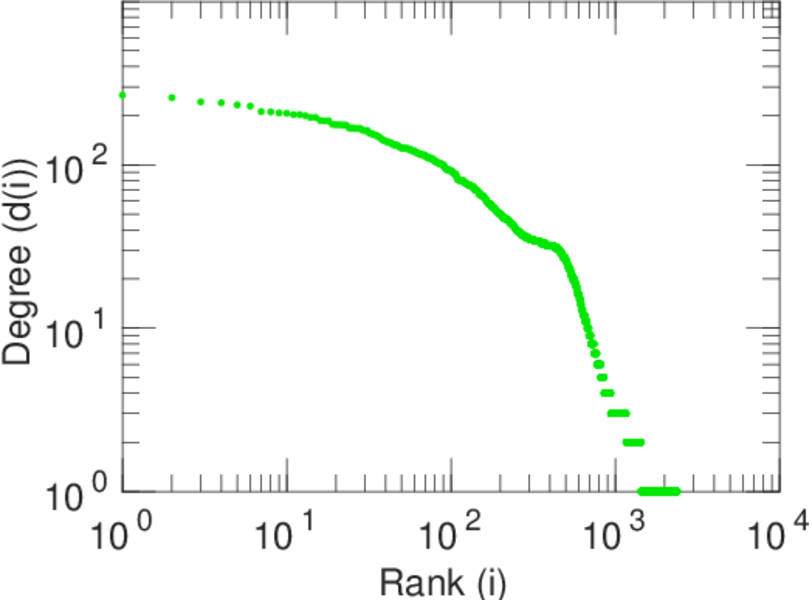
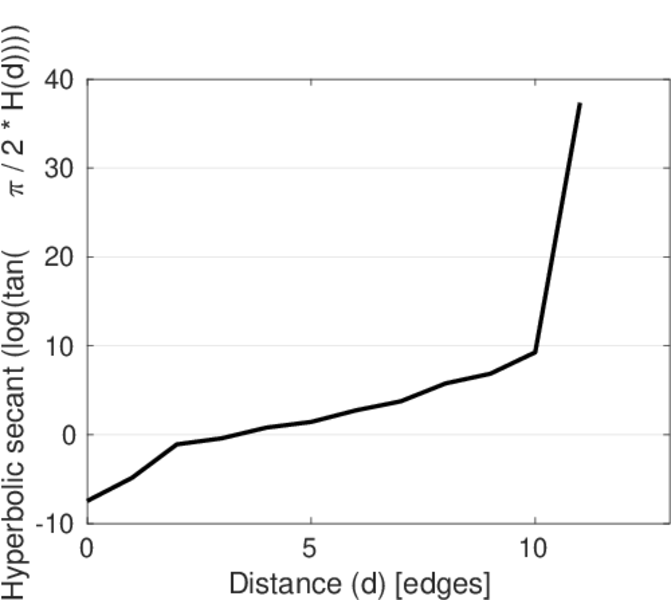
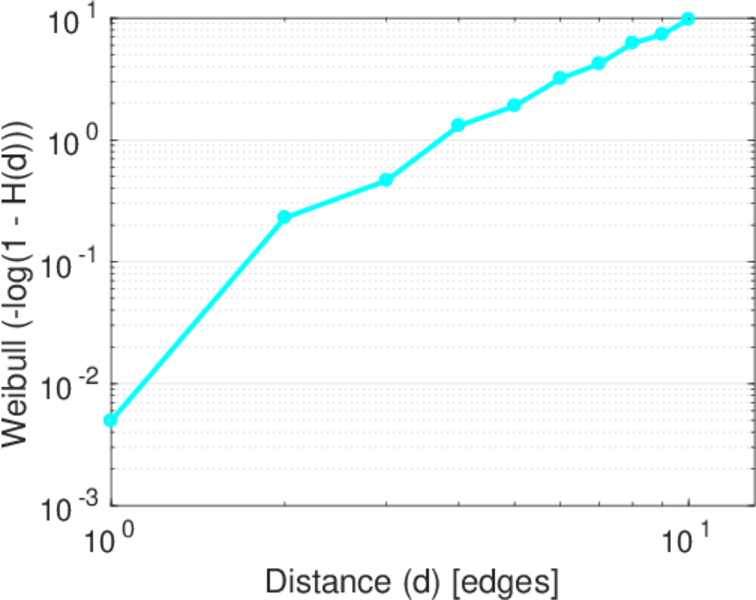
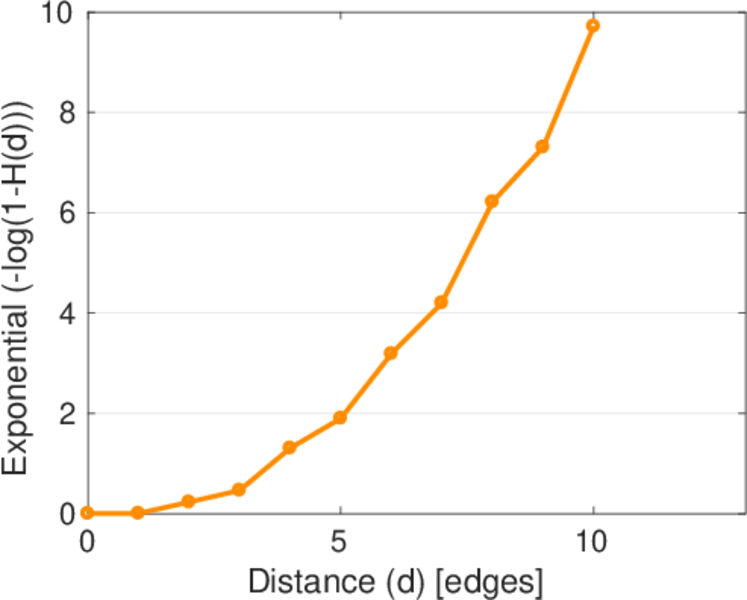
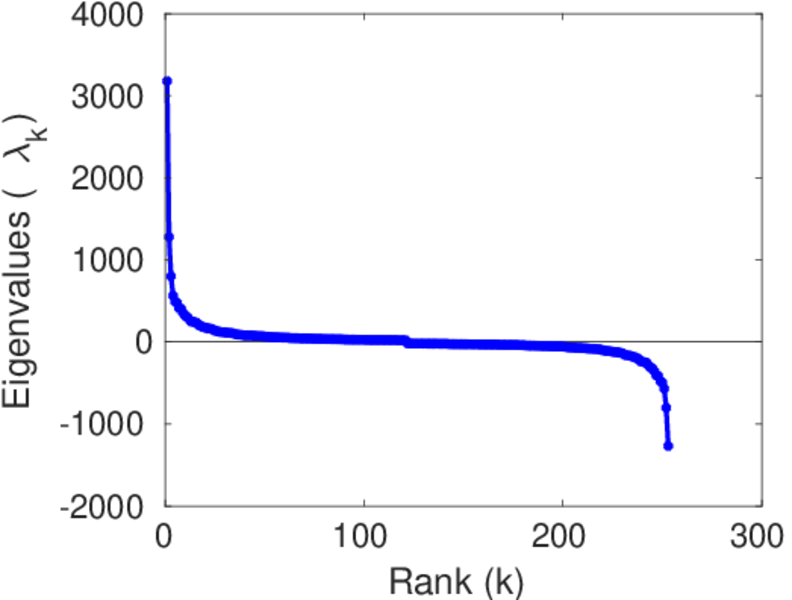
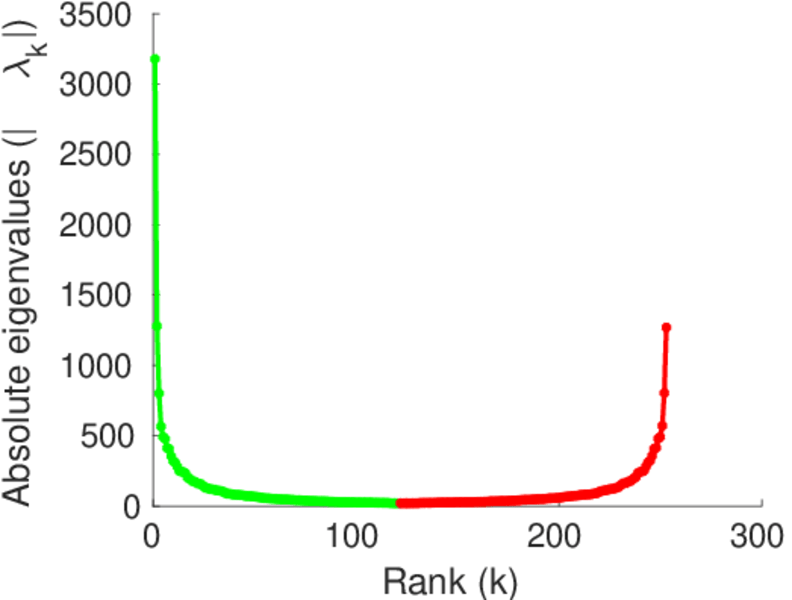
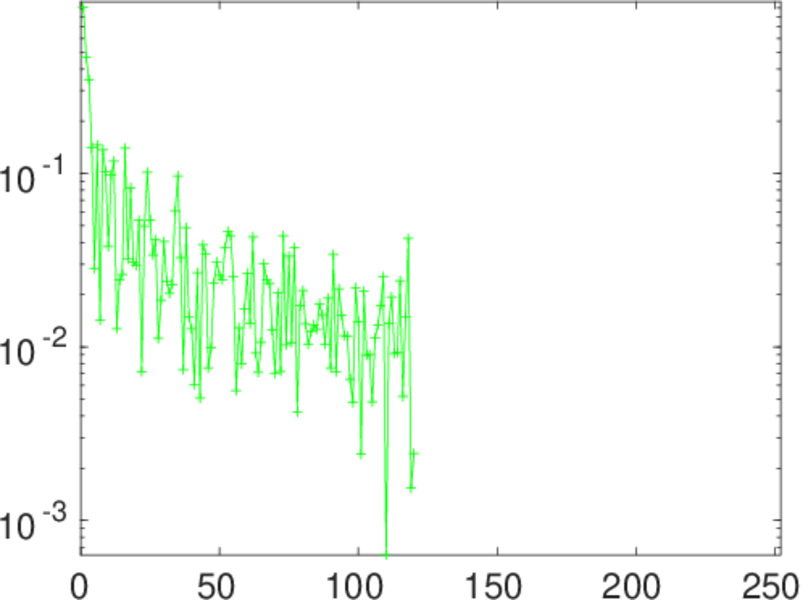
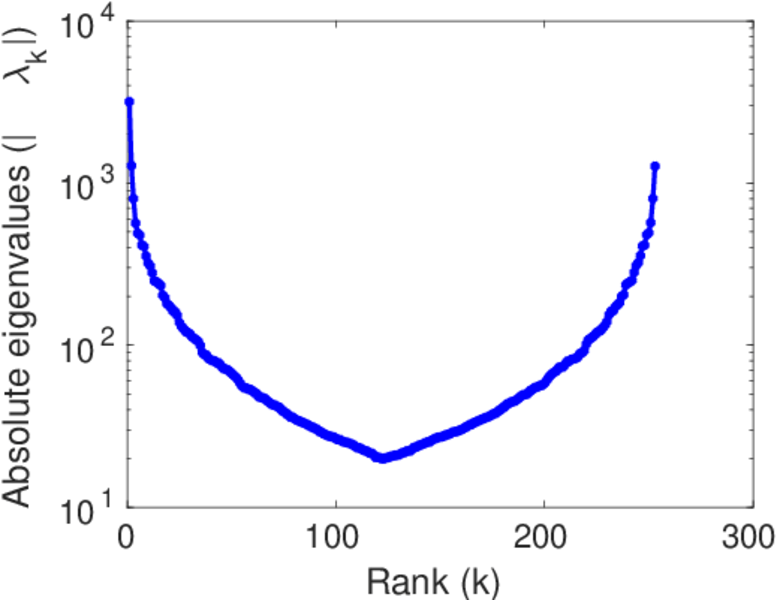
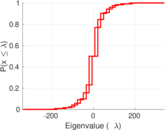
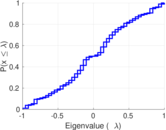
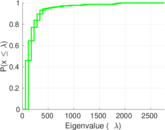
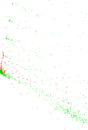
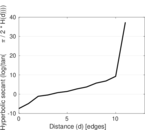
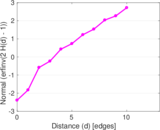
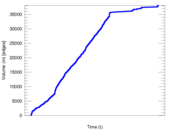
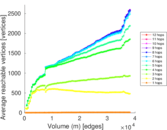
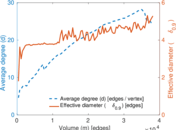
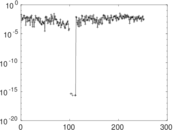
Plots


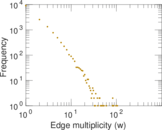
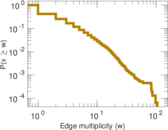
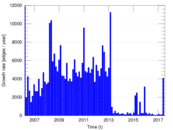


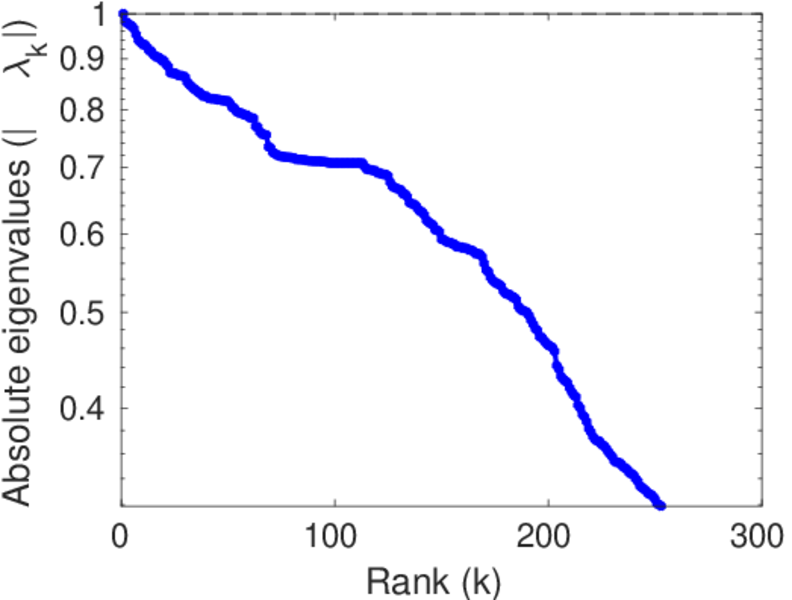
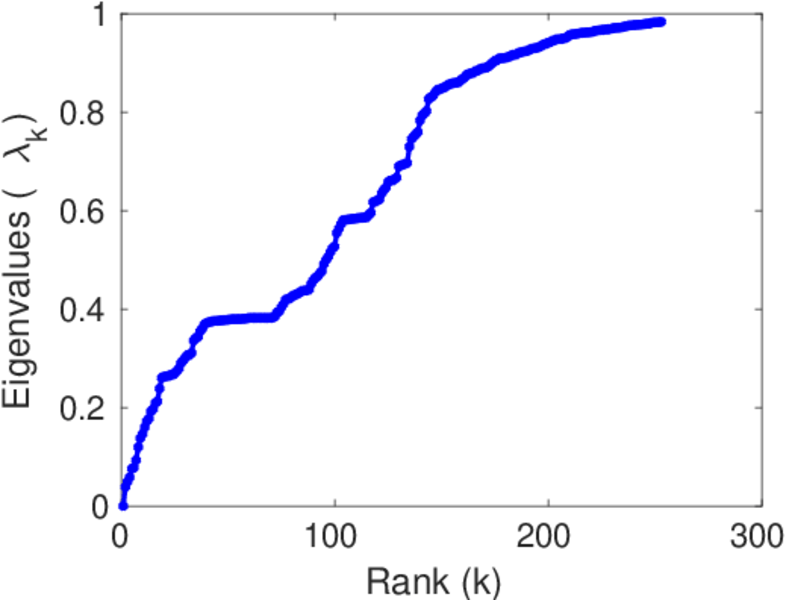
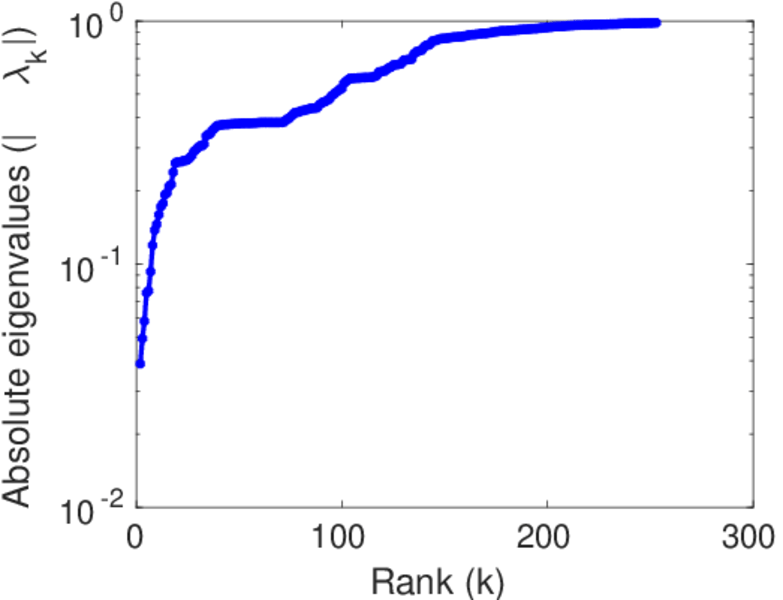
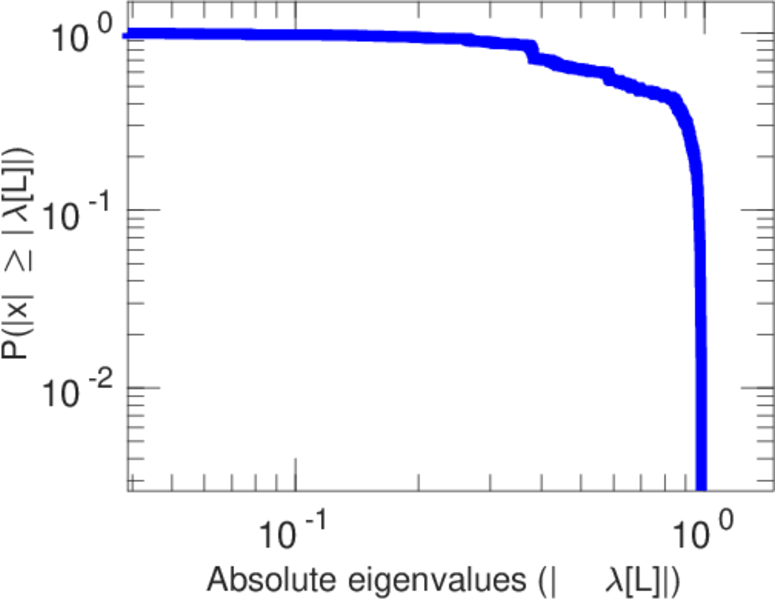
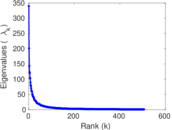
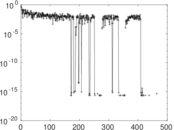
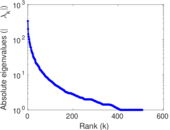
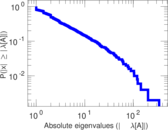
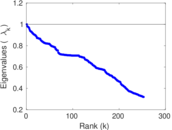
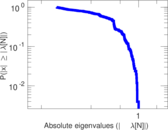
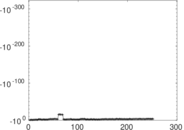
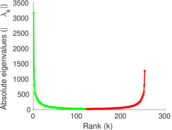
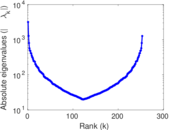
Matrix decompositions plots


Downloads
References
|
[1]
|
Jérôme Kunegis.
KONECT – The Koblenz Network Collection.
In Proc. Int. Conf. on World Wide Web Companion, pages
1343–1350, 2013.
[ http ]
|
|
[2]
|
Wikimedia Foundation.
Wikimedia downloads.
http://dumps.wikimedia.org/, January 2010.
|
 KONECT ‣ Networks ‣
Buy Me a Coffee
KONECT ‣ Networks ‣
Buy Me a Coffee