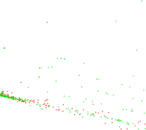
Wikipedia edits (rn)
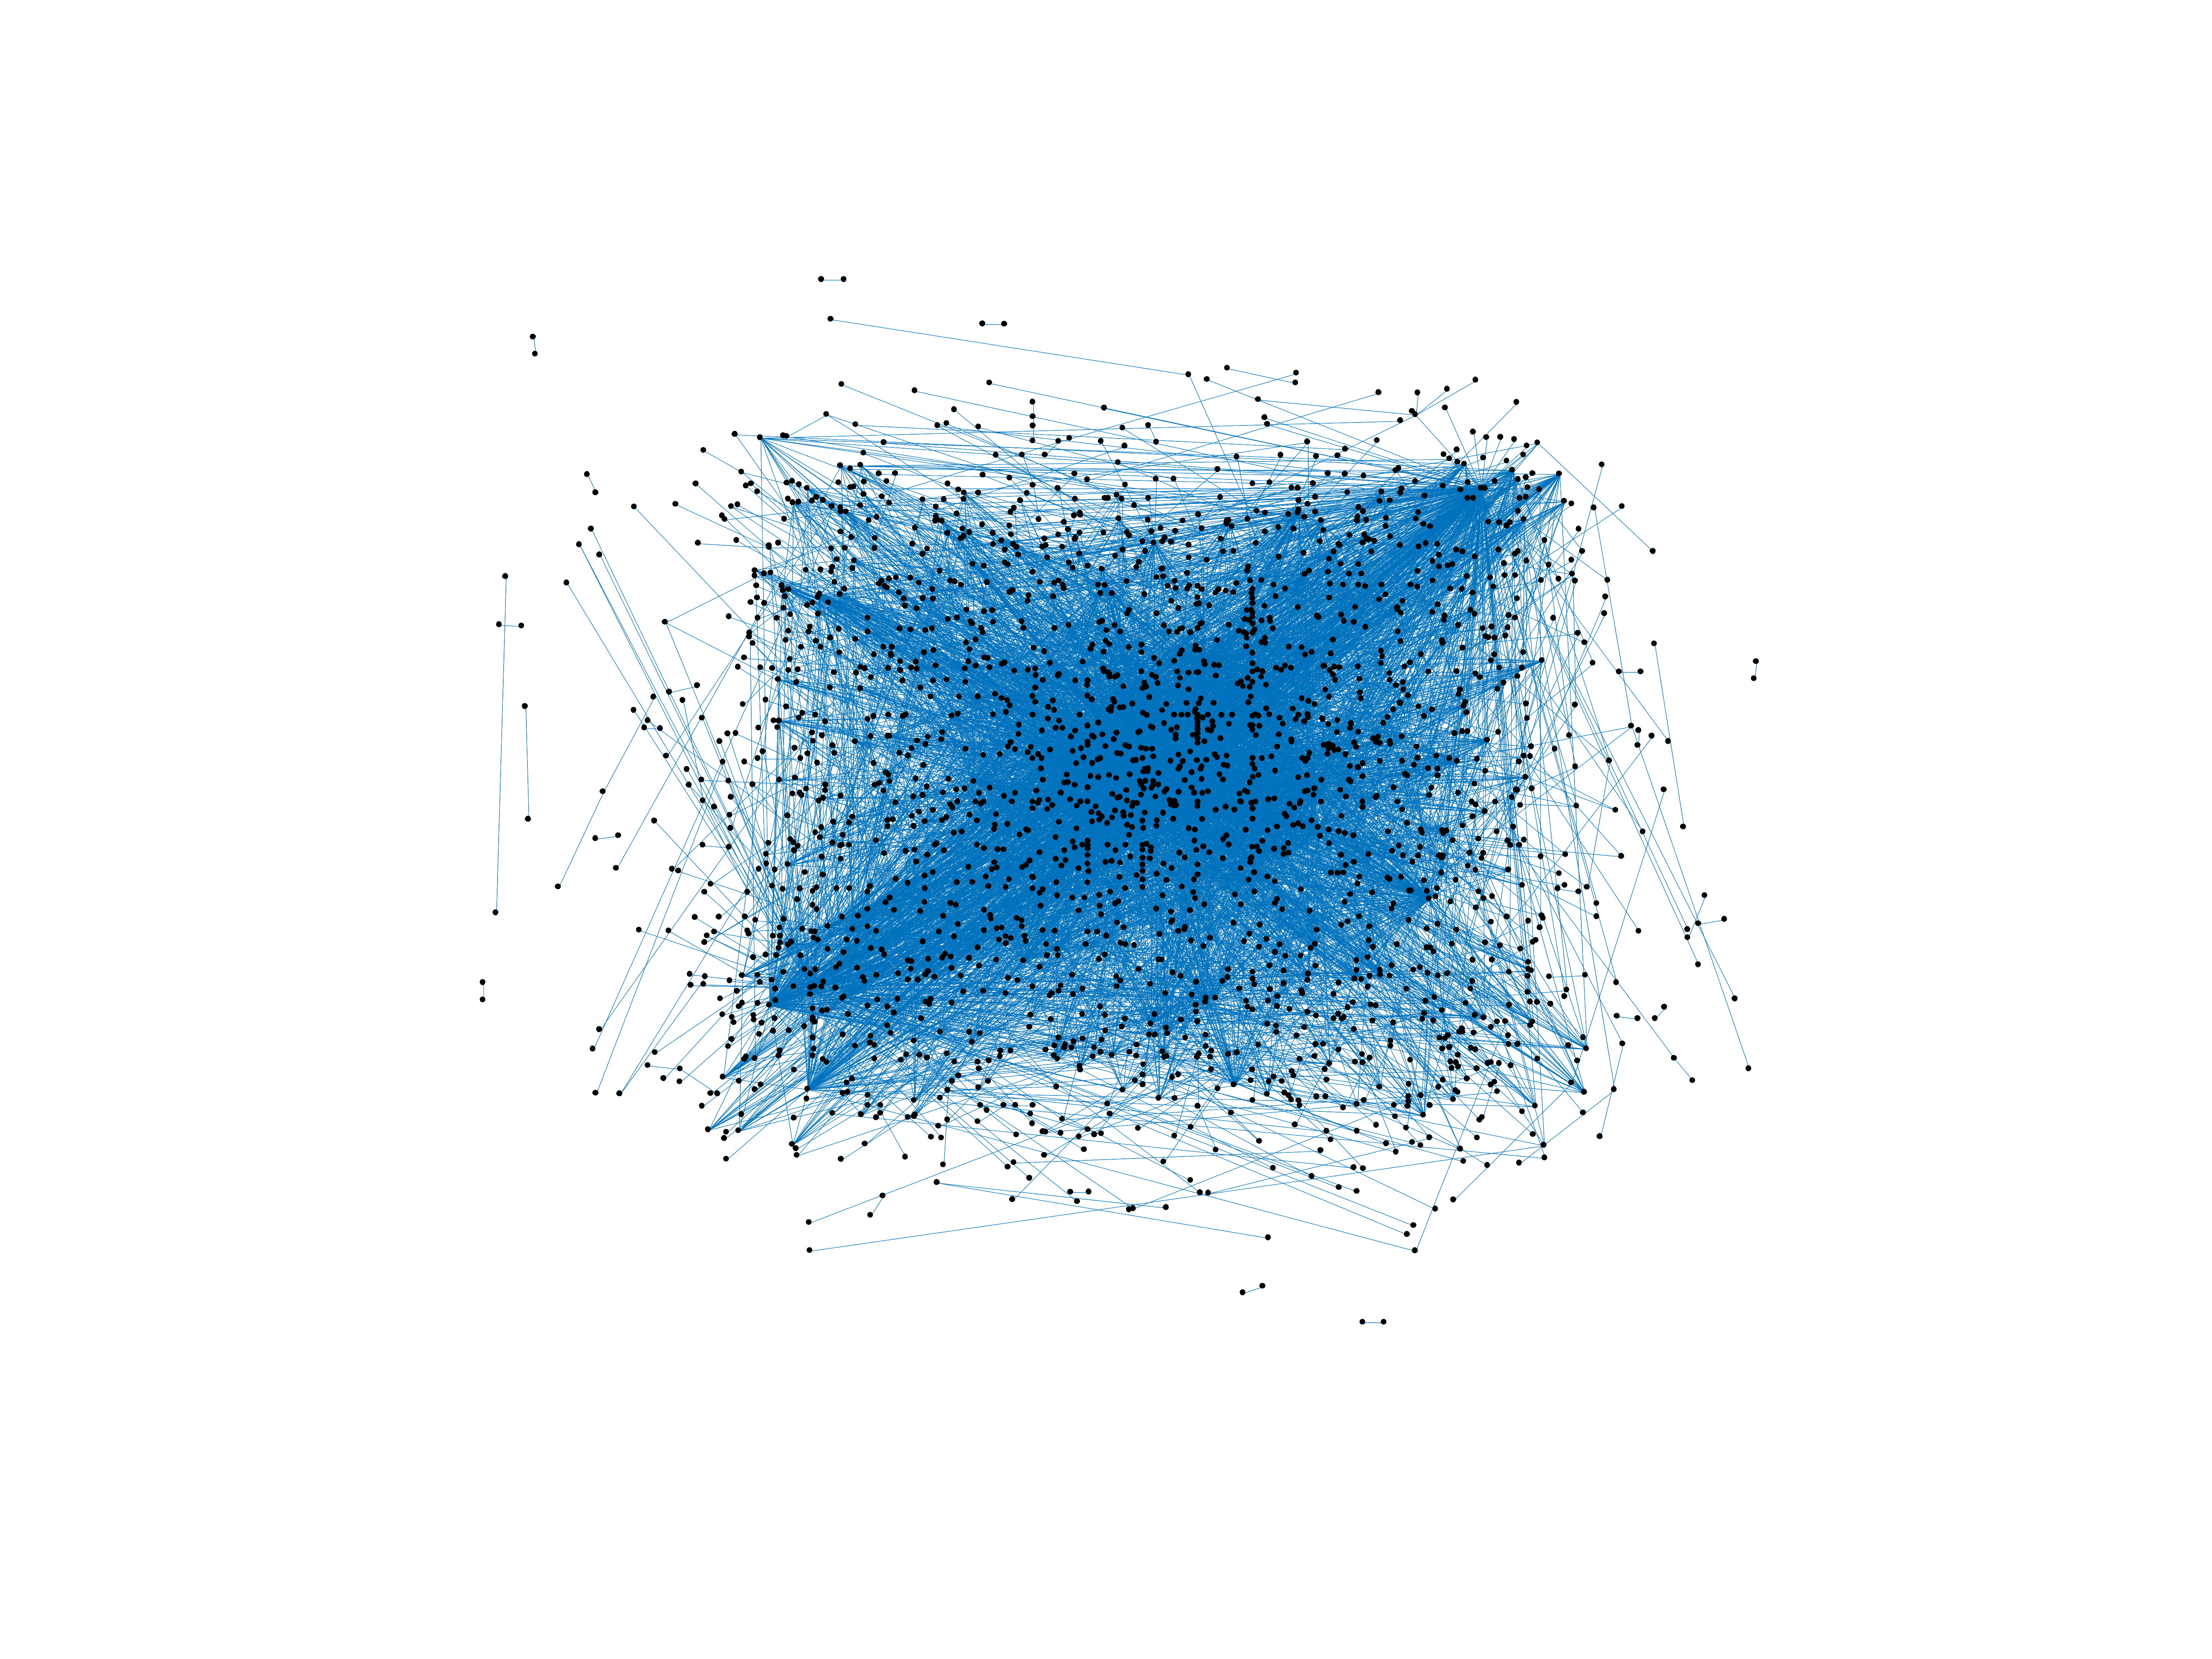
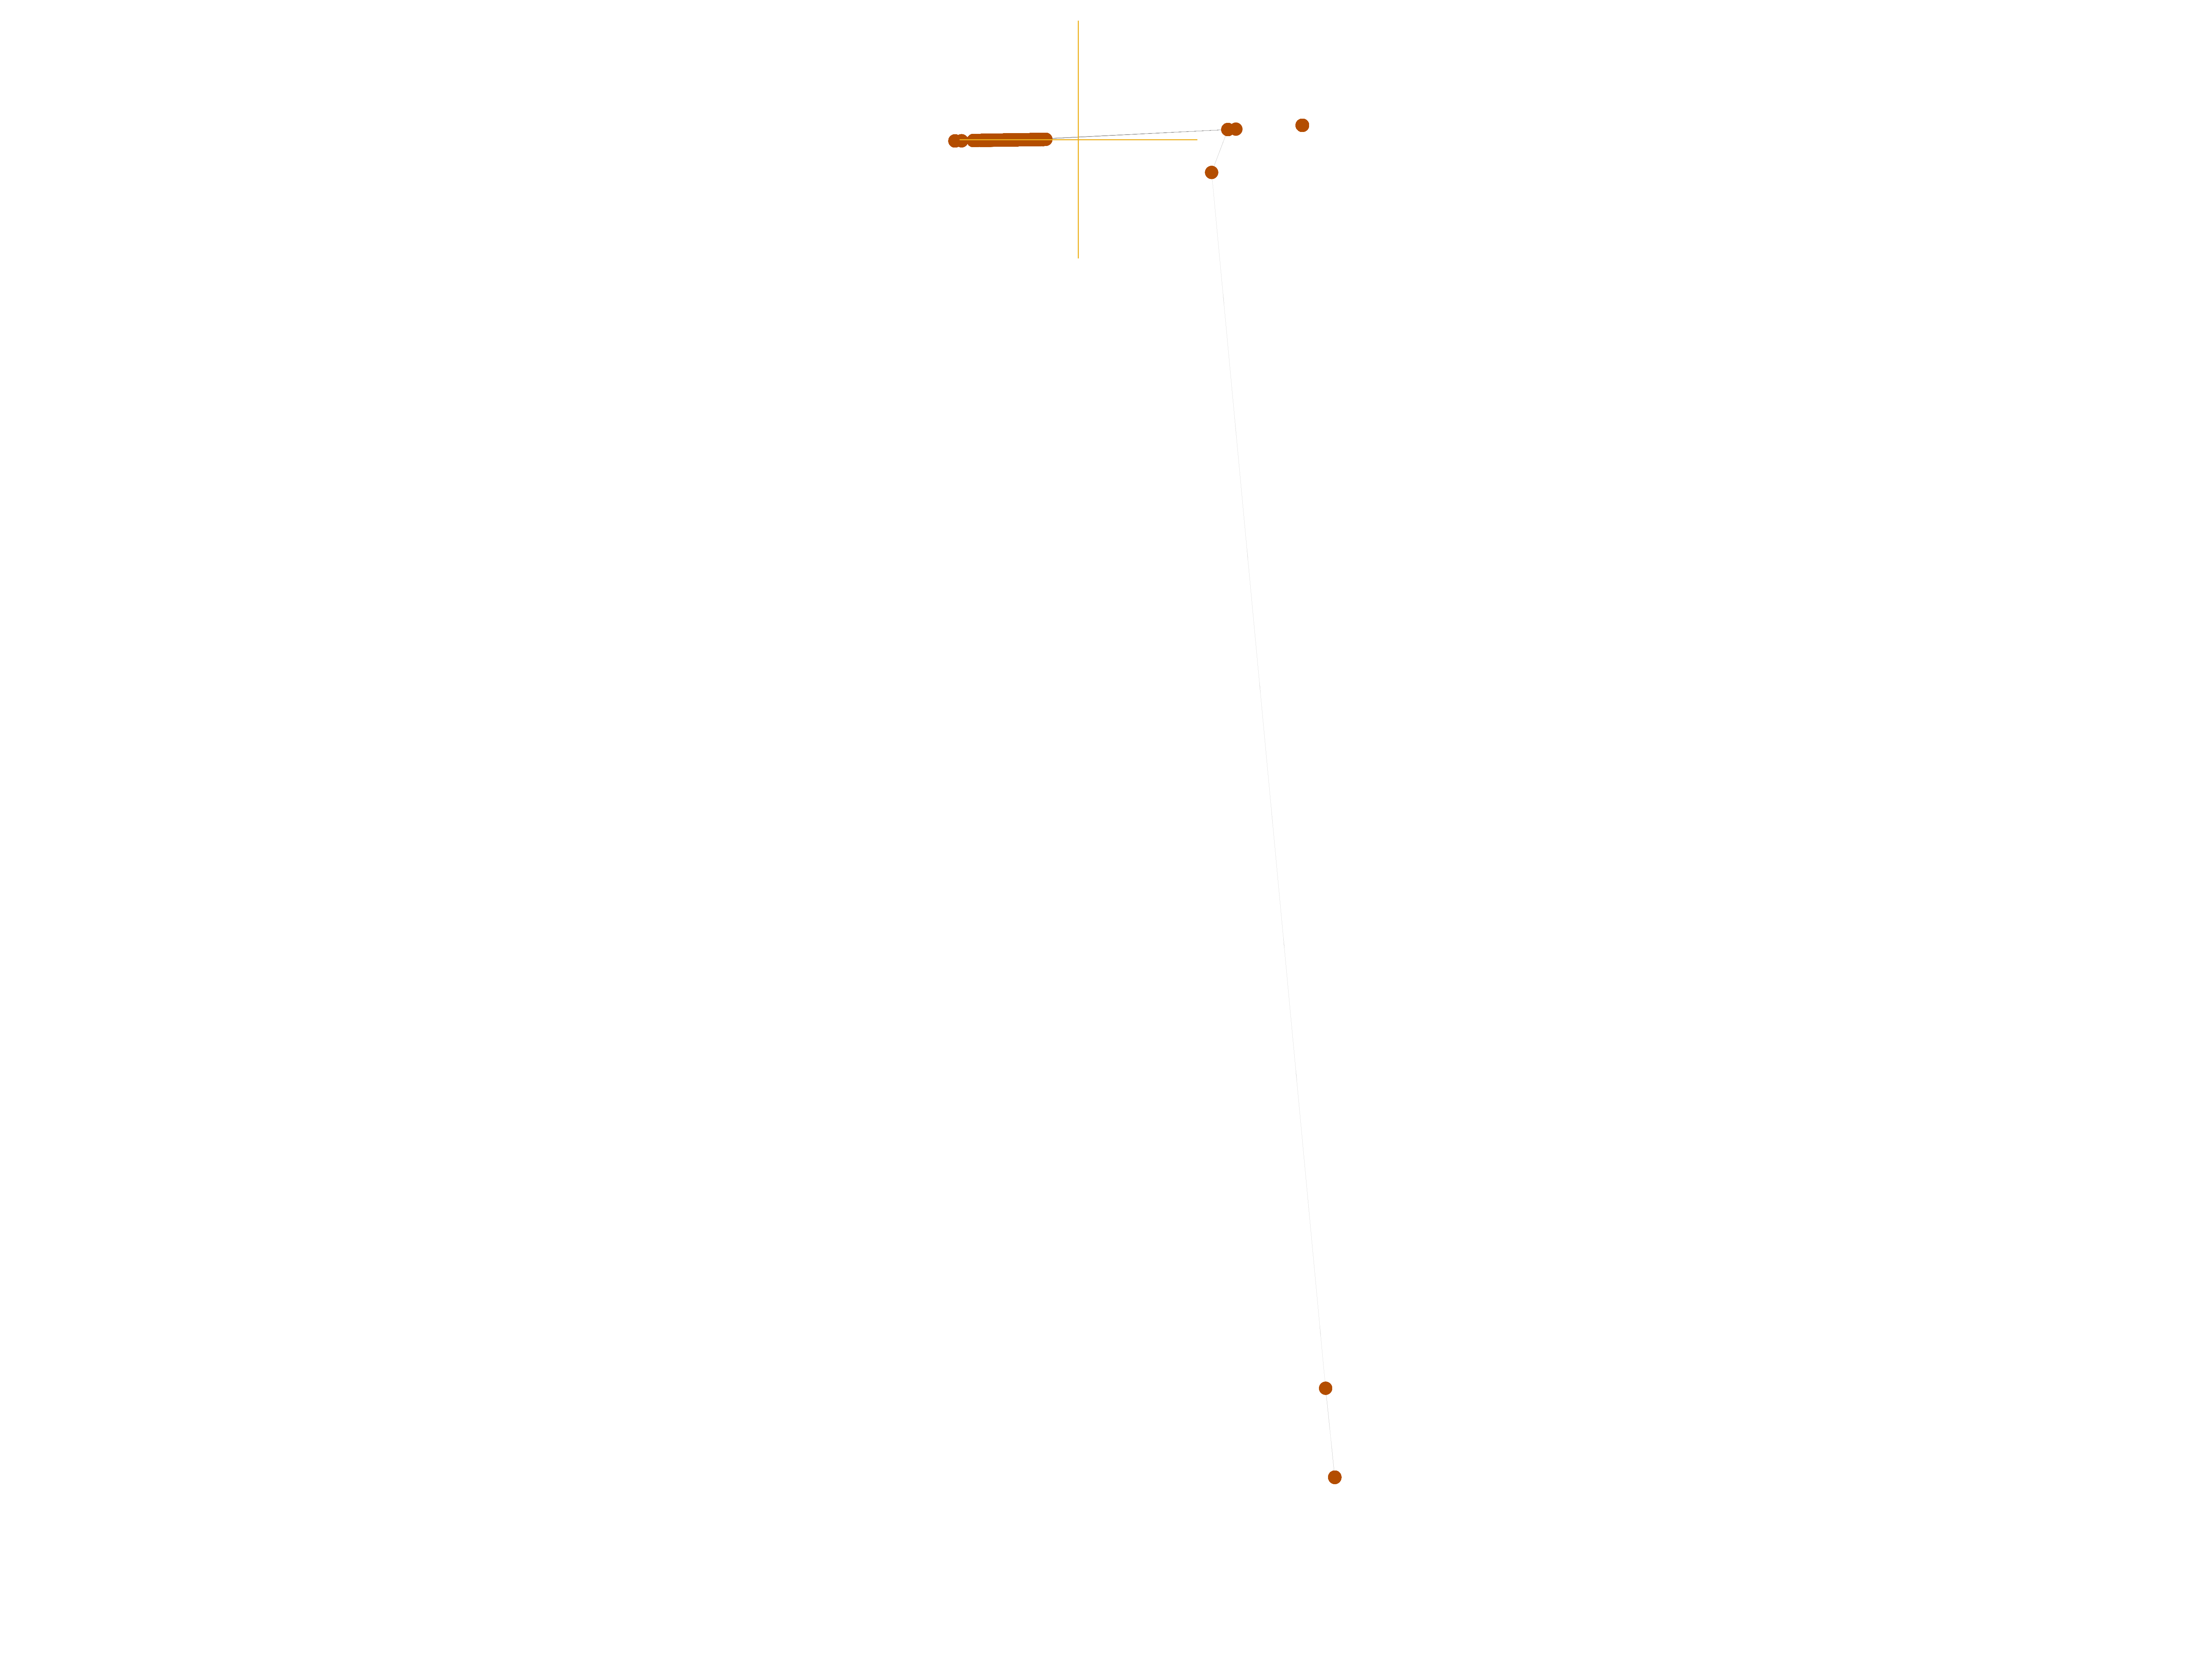
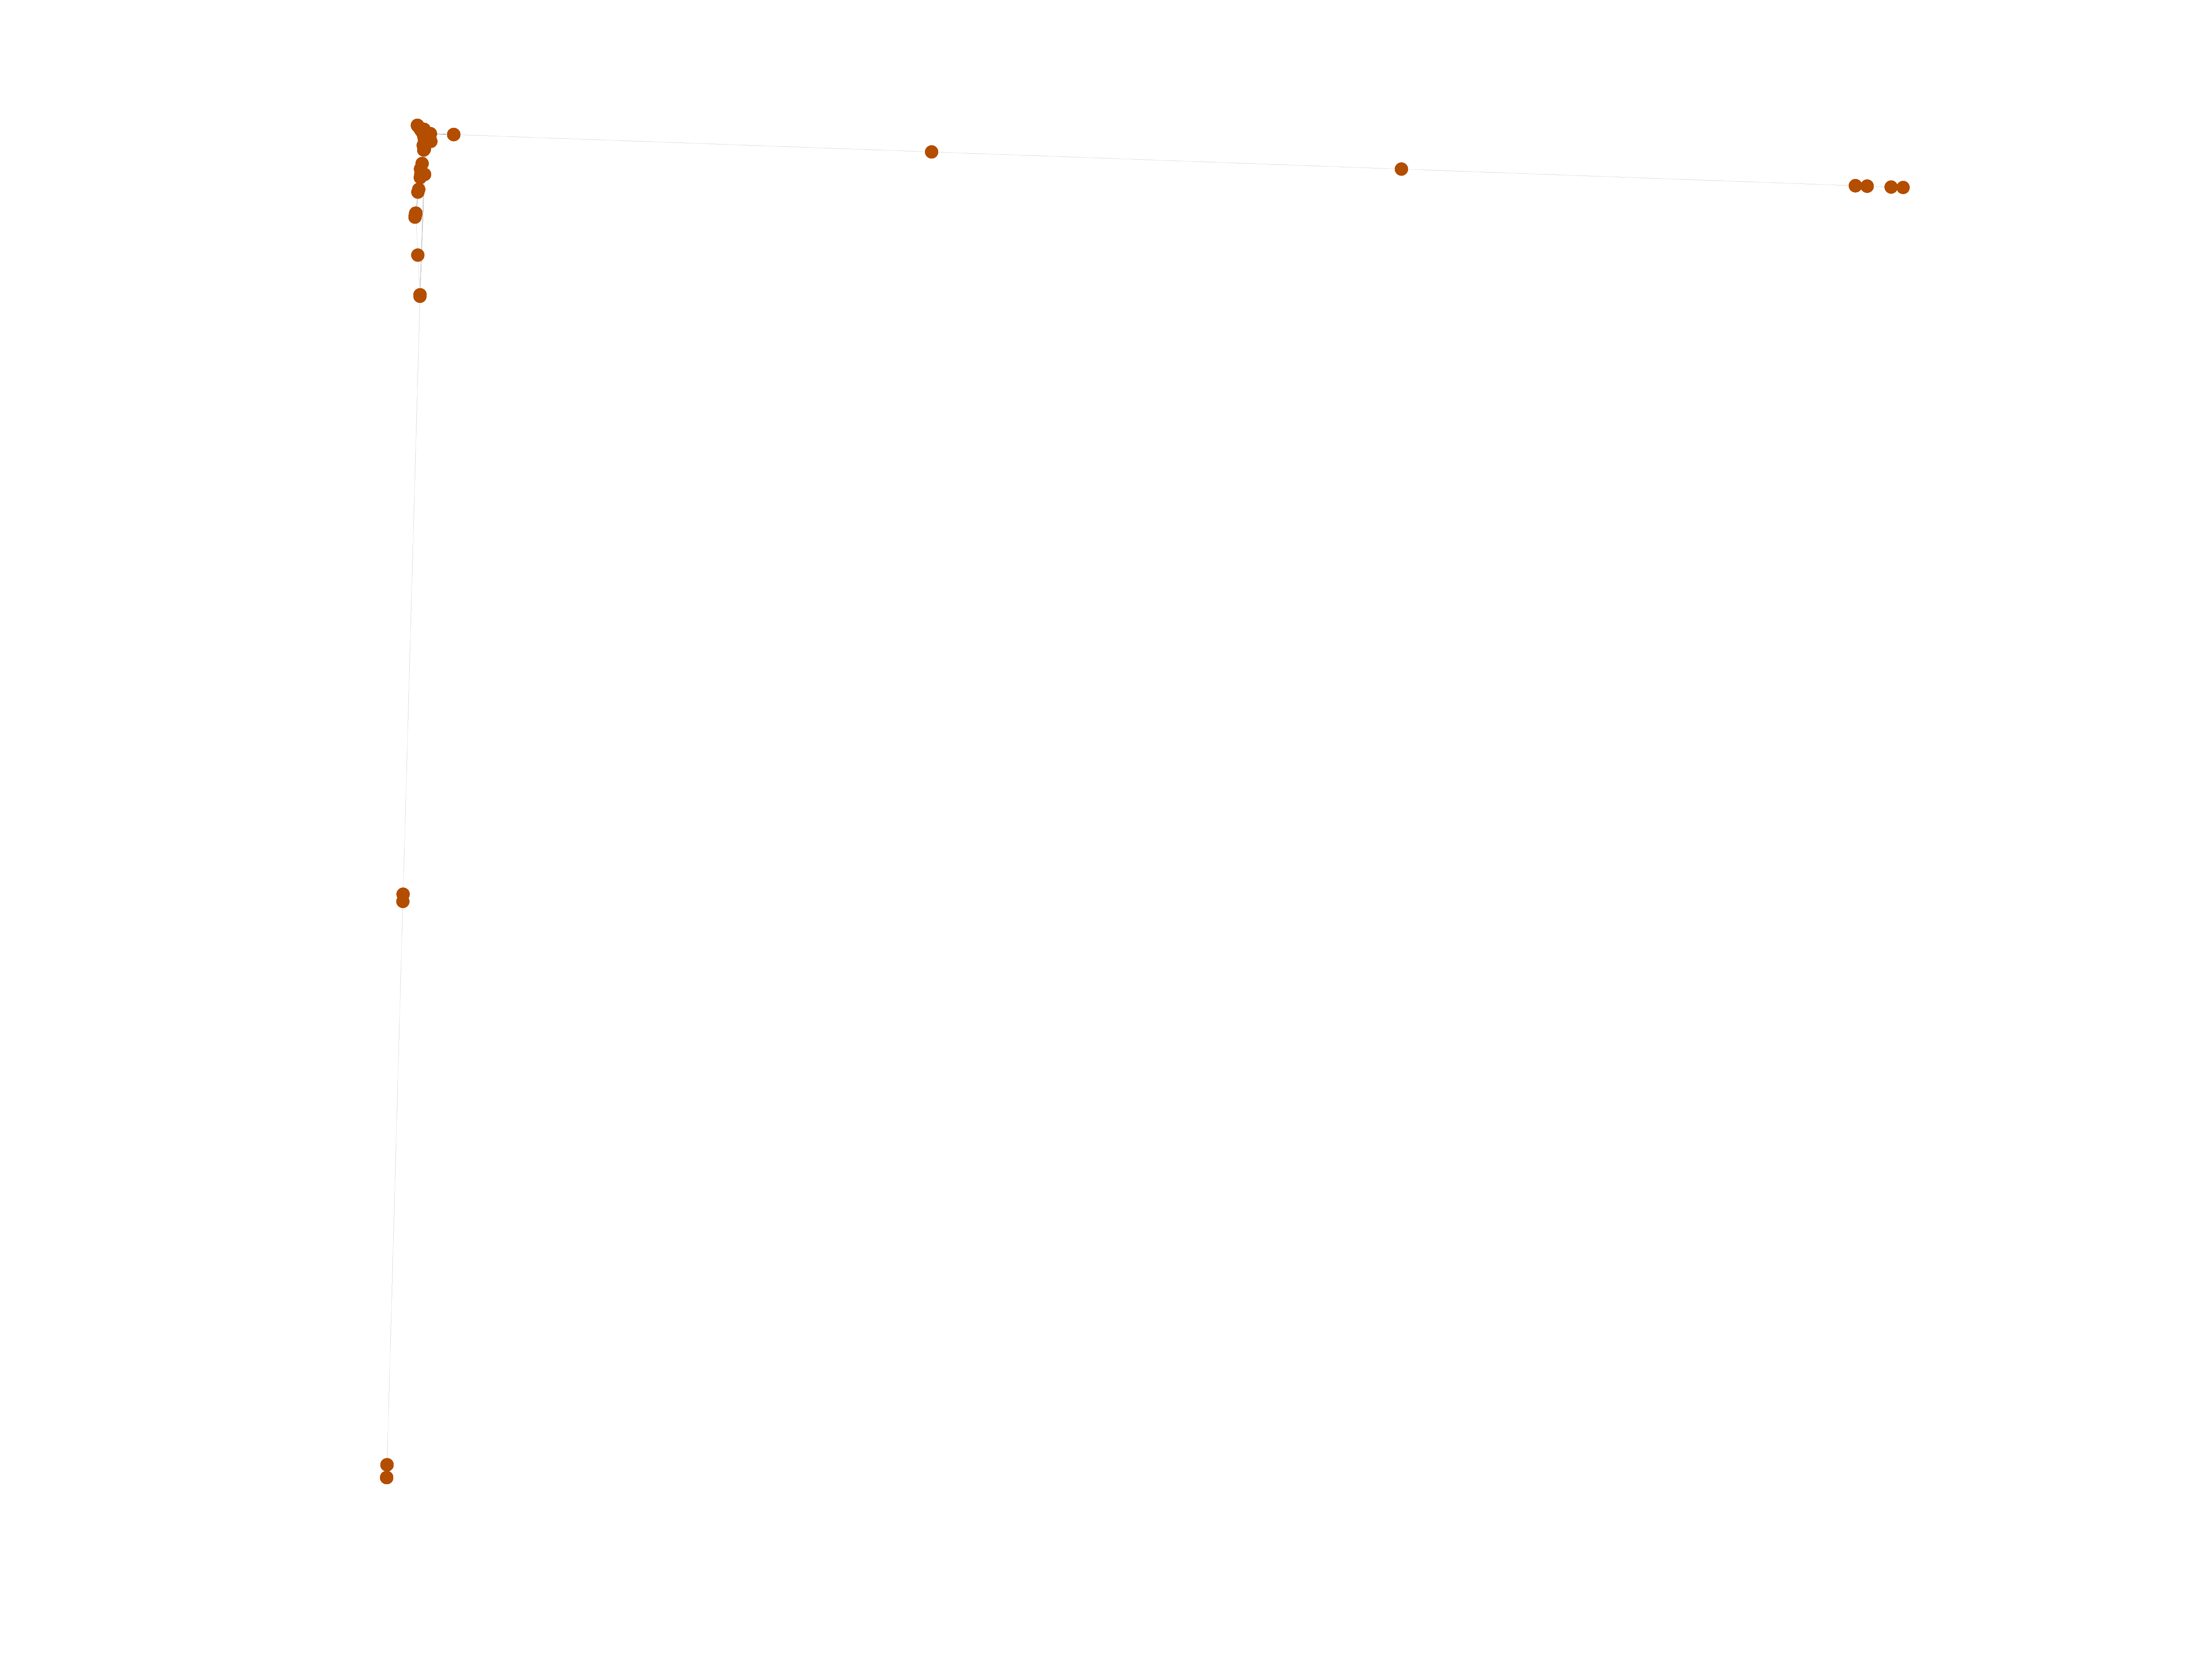
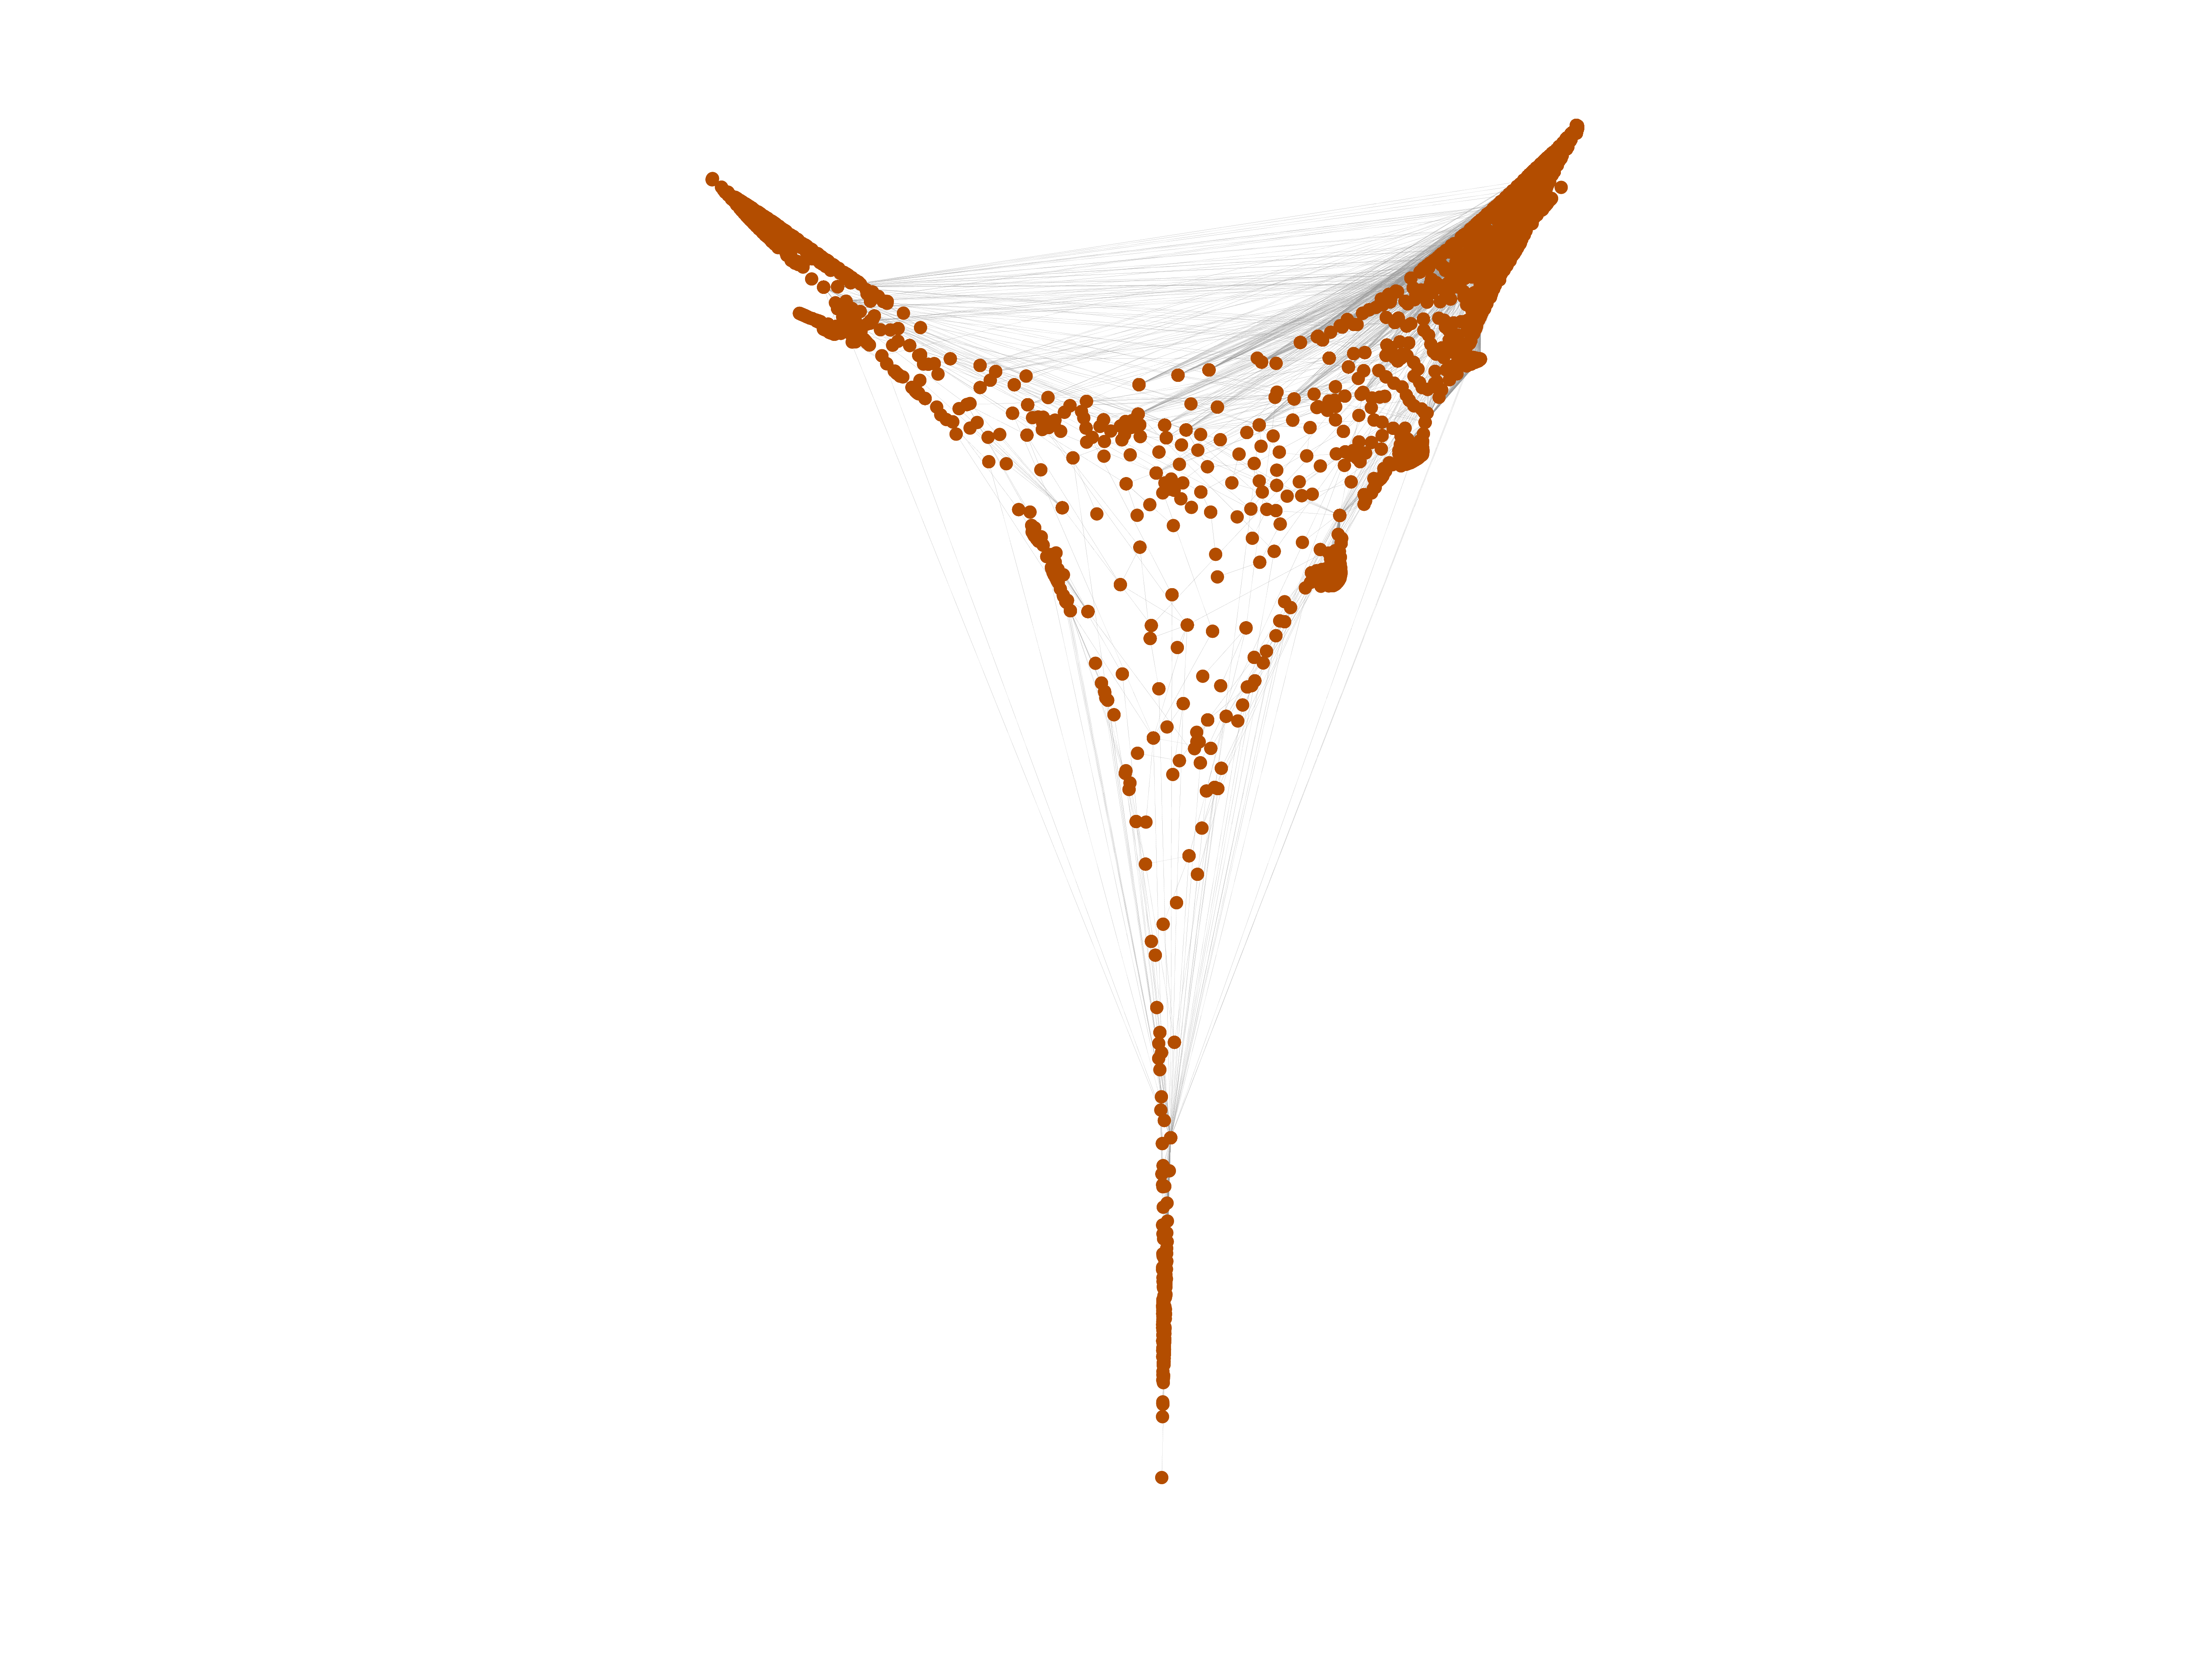
This is the bipartite edit network of the Rundi Wikipedia. It contains users
and pages from the Rundi Wikipedia, connected by edit events. Each edge
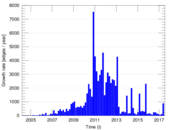
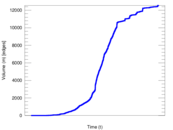
represents an edit. The dataset includes the timestamp of each edit.
Metadata
Statistics
| Size | n = | 2,313
|
| Left size | n1 = | 543
|
| Right size | n2 = | 1,770
|
| Volume | m = | 12,547
|
| Unique edge count | m̿ = | 5,997
|
| Wedge count | s = | 382,550
|
| Claw count | z = | 22,725,432
|
| Cross count | x = | 1,261,220,898
|
| Square count | q = | 720,331
|
| 4-Tour count | T4 = | 7,305,234
|
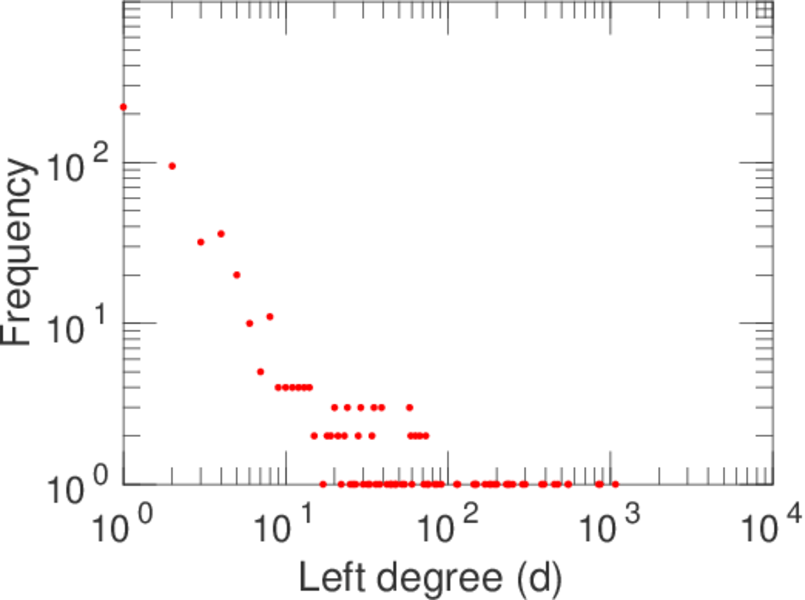
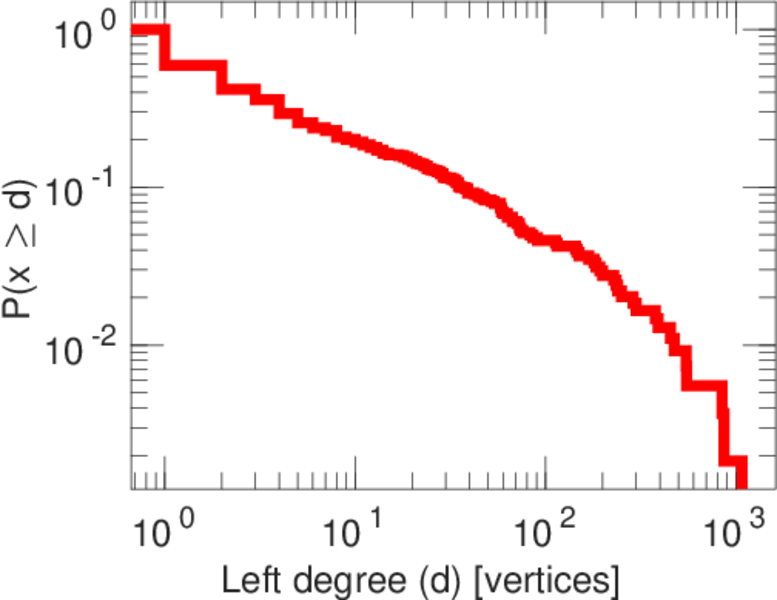
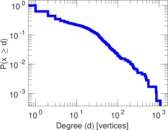
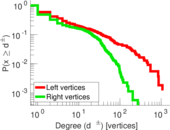
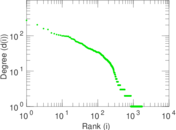
| Maximum degree | dmax = | 1,076
|
| Maximum left degree | d1max = | 1,076
|
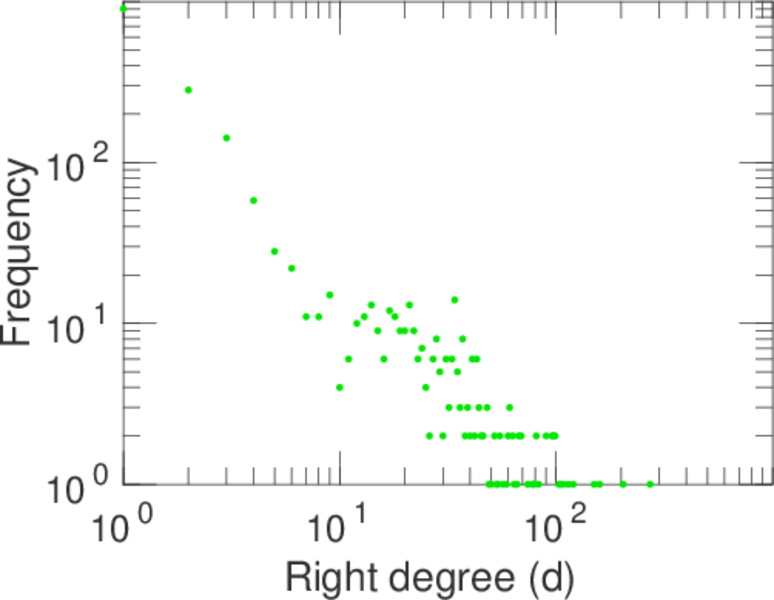
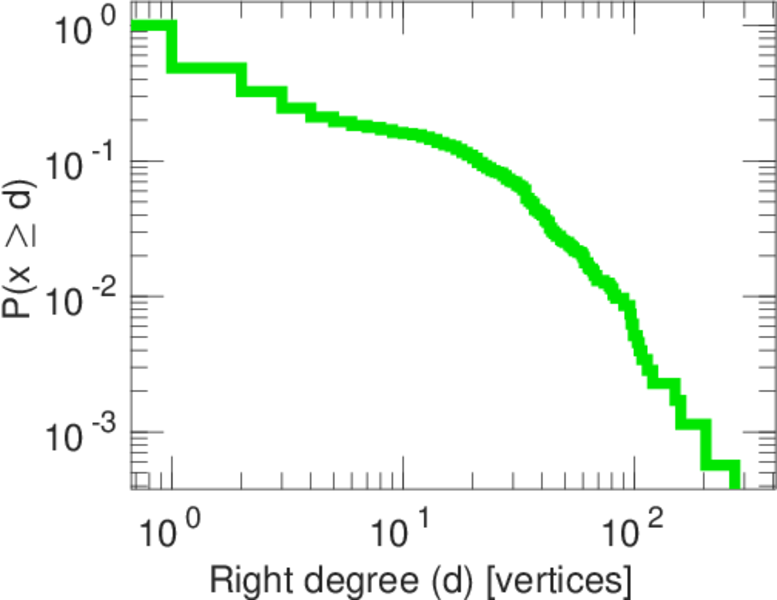
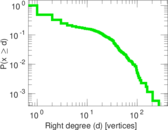
| Maximum right degree | d2max = | 272
|
| Average degree | d = | 10.849 1
|
| Average left degree | d1 = | 23.106 8
|
| Average right degree | d2 = | 7.088 70
|
| Fill | p = | 0.006 239 66
|
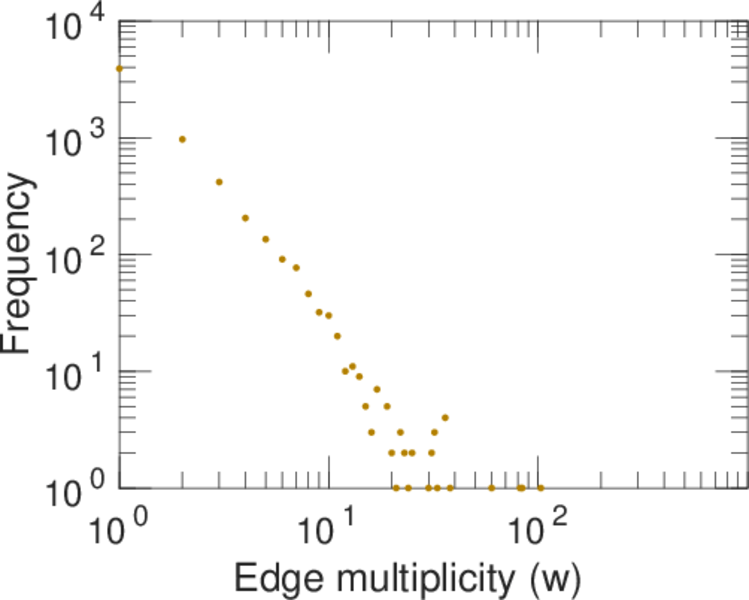
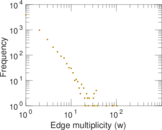
| Average edge multiplicity | m̃ = | 2.092 21
|
| Size of LCC | N = | 1,779
|
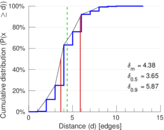
| Diameter | δ = | 14
|
| 50-Percentile effective diameter | δ0.5 = | 3.654 30
|
| 90-Percentile effective diameter | δ0.9 = | 5.868 97
|
| Median distance | δM = | 4
|
| Mean distance | δm = | 4.377 69
|
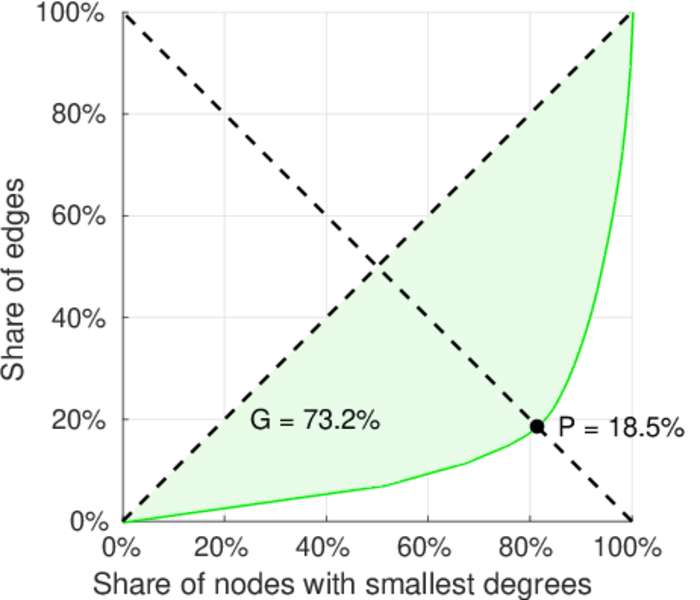
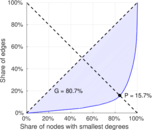
| Gini coefficient | G = | 0.800 638
|
| Balanced inequality ratio | P = | 0.164 063
|
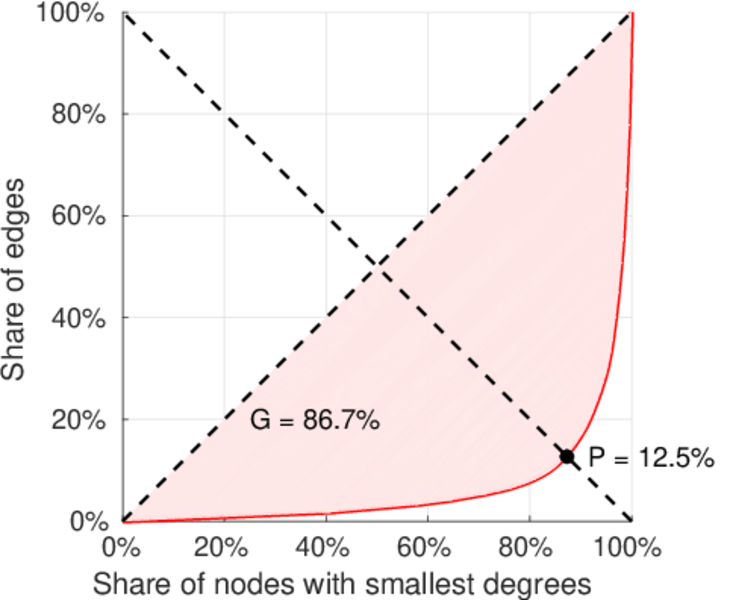
| Left balanced inequality ratio | P1 = | 0.125 369
|
| Right balanced inequality ratio | P2 = | 0.184 745
|
| Relative edge distribution entropy | Her = | 0.821 482
|
| Power law exponent | γ = | 2.545 50
|
| Tail power law exponent | γt = | 1.921 00
|
| Tail power law exponent with p | γ3 = | 1.921 00
|
| p-value | p = | 0.000 00
|
| Left tail power law exponent with p | γ3,1 = | 1.701 00
|
| Left p-value | p1 = | 0.146 000
|
| Right tail power law exponent with p | γ3,2 = | 4.031 00
|
| Right p-value | p2 = | 0.144 000
|
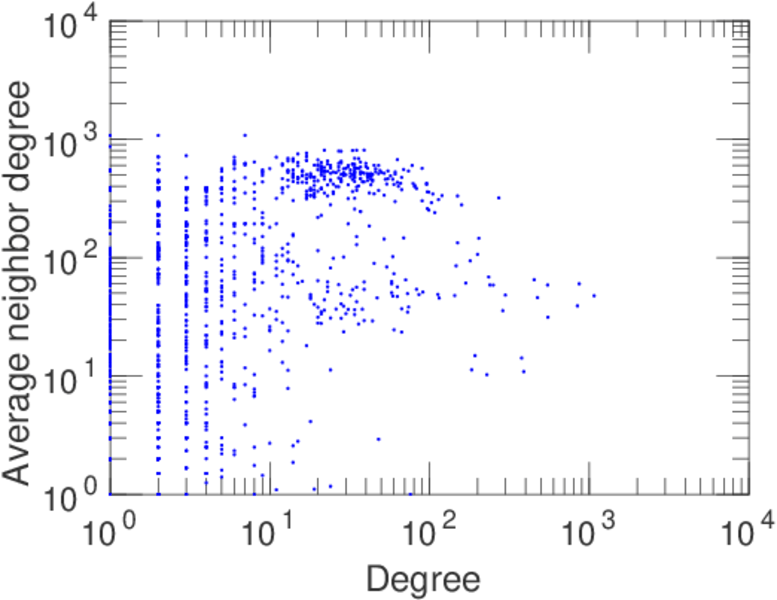
| Degree assortativity | ρ = | −0.134 027
|
| Degree assortativity p-value | pρ = | 1.926 54 × 10−25
|
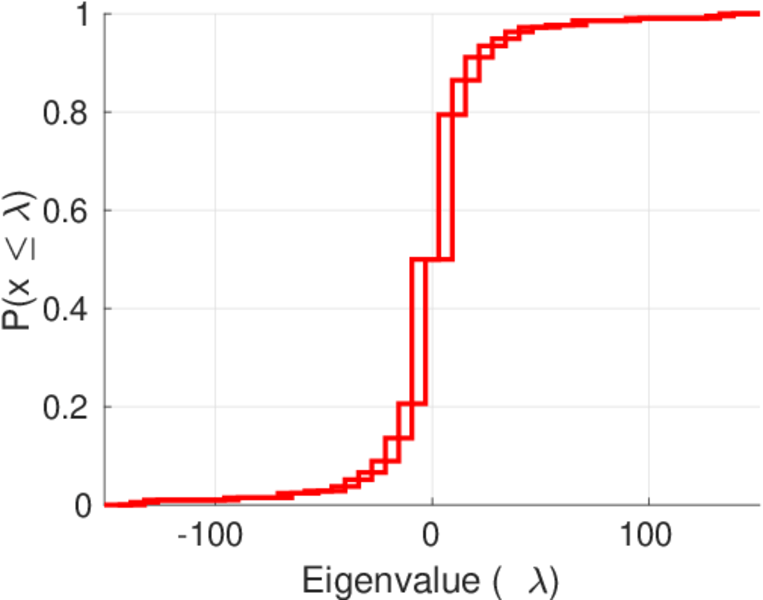
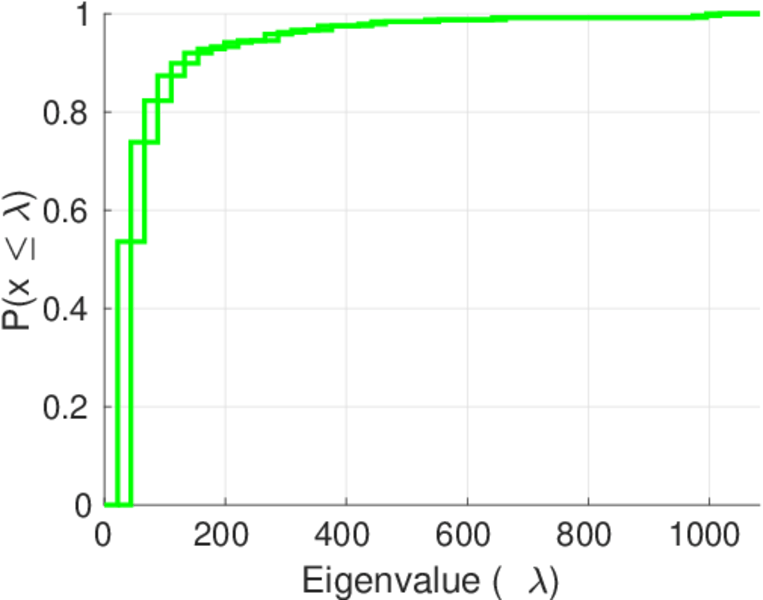
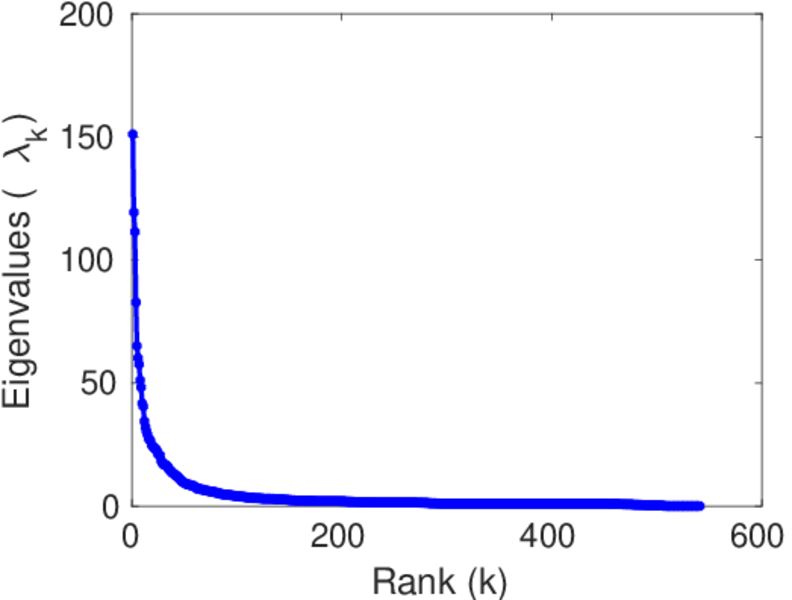
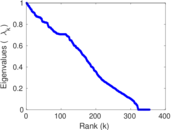
| Spectral norm | α = | 150.972
|
| Algebraic connectivity | a = | 0.015 920 4
|
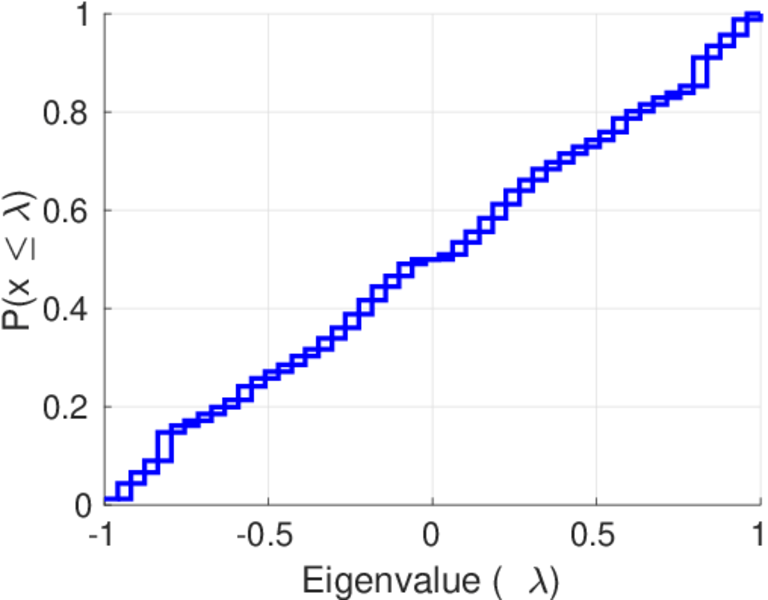
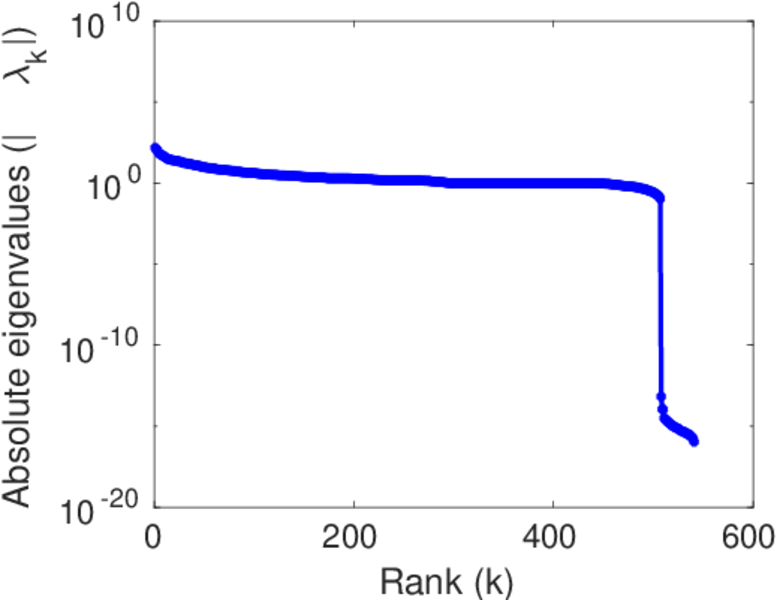
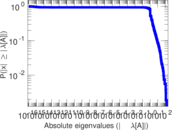
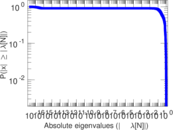
| Spectral separation | |λ1[A] / λ2[A]| = | 1.265 39
|
| Controllability | C = | 1,284
|
| Relative controllability | Cr = | 0.558 747
|
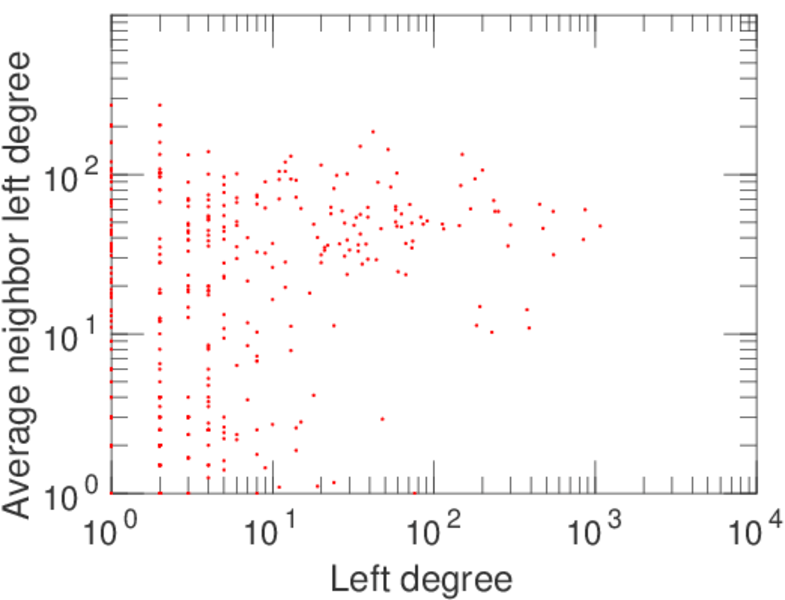
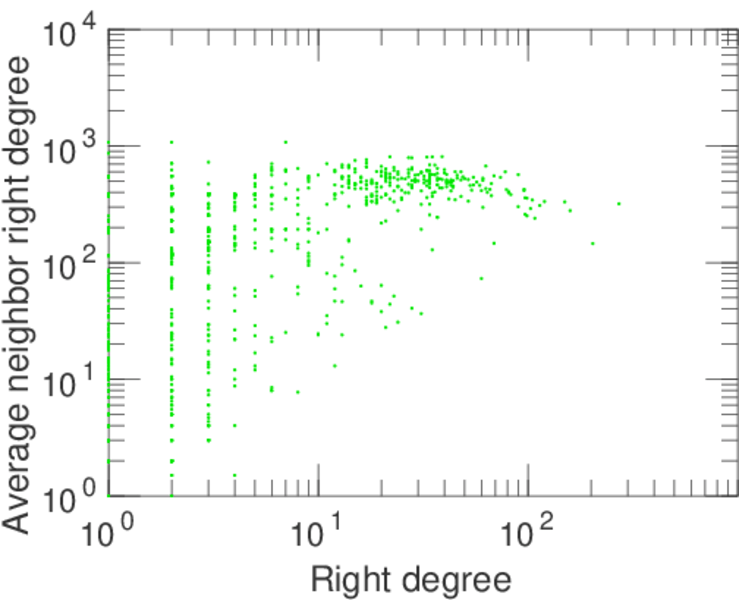
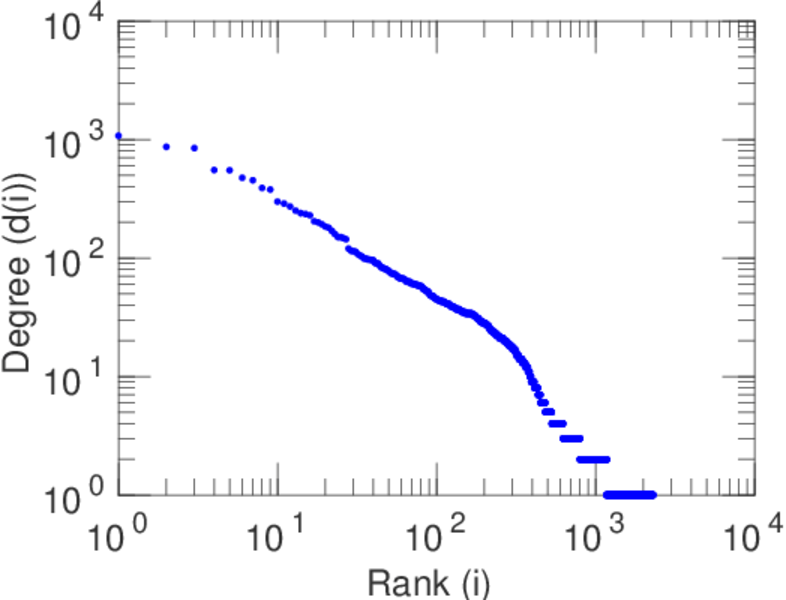
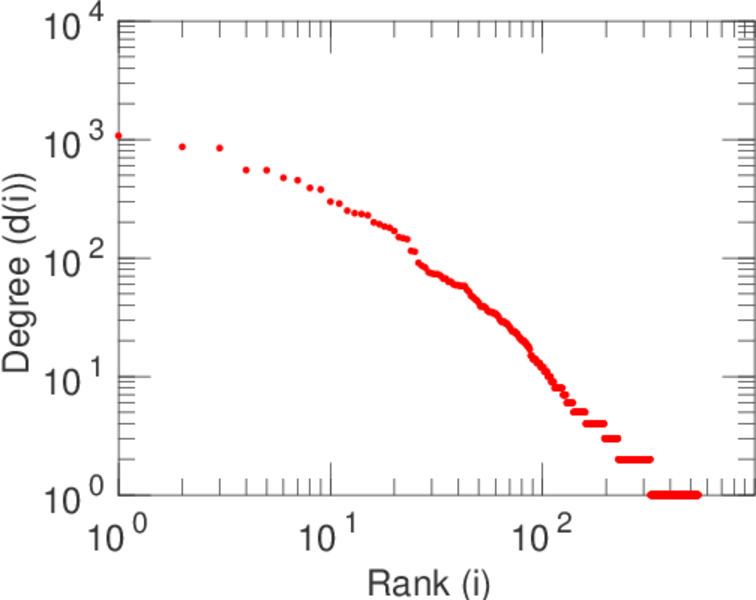
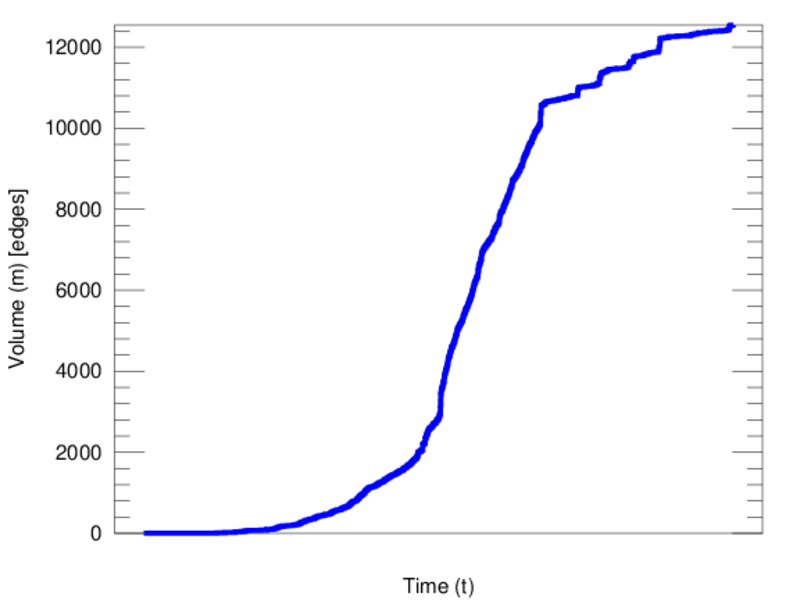
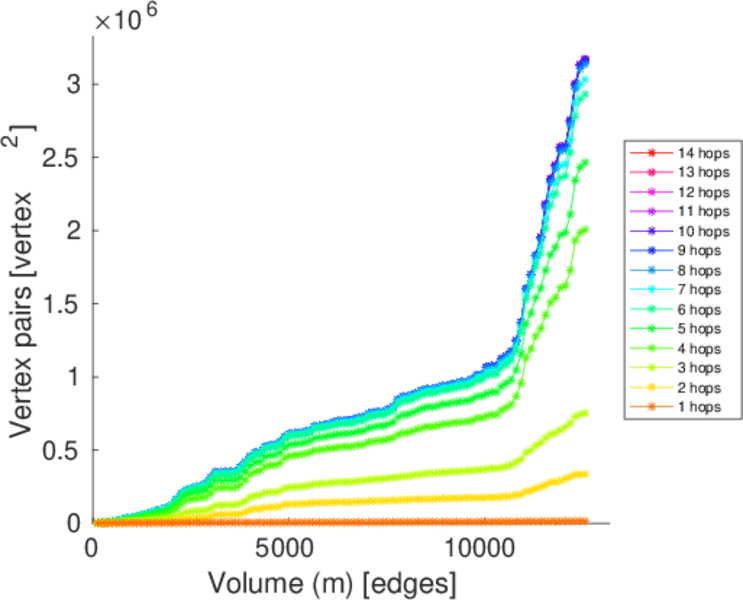
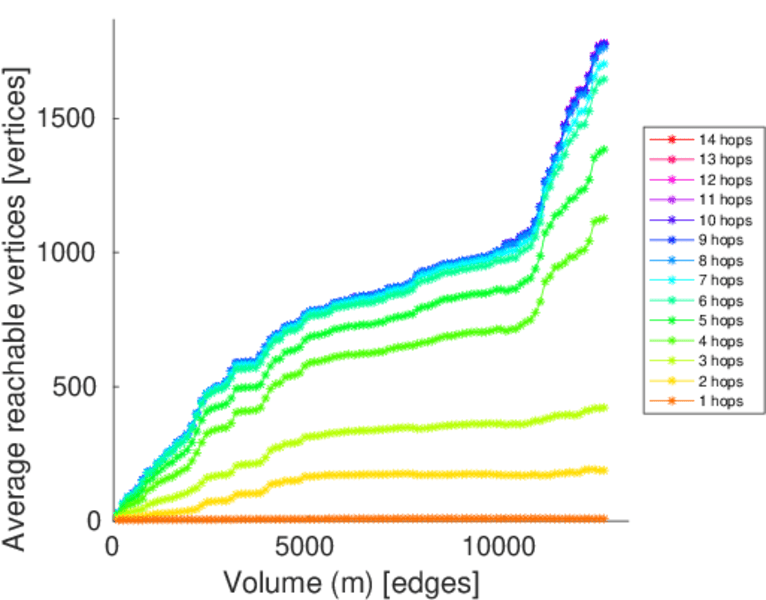
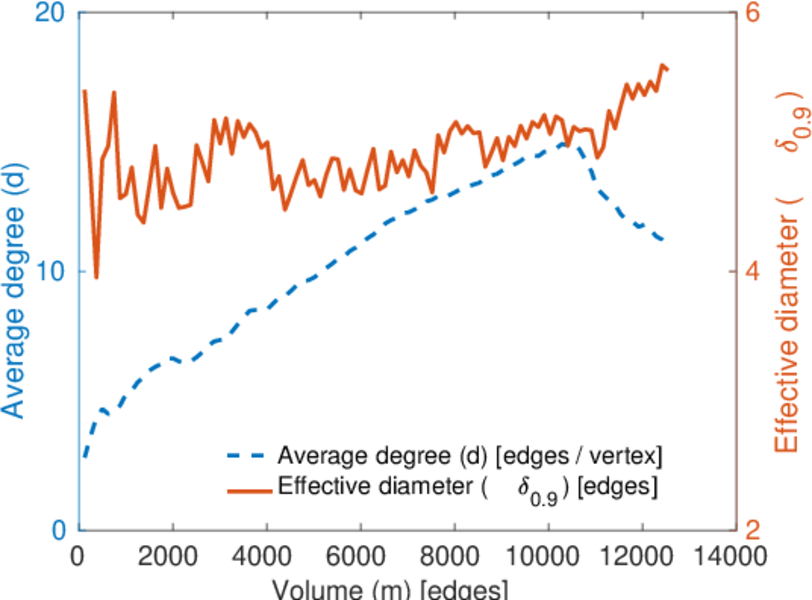
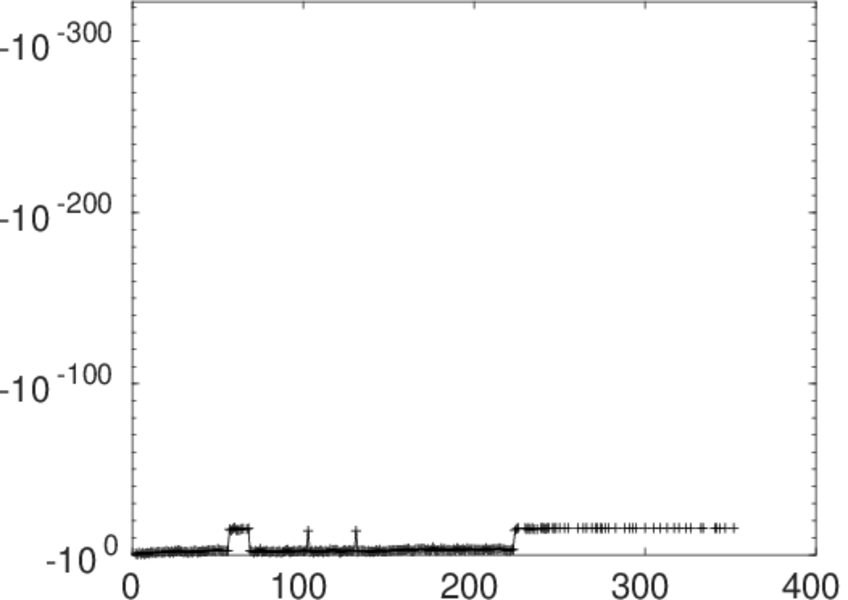
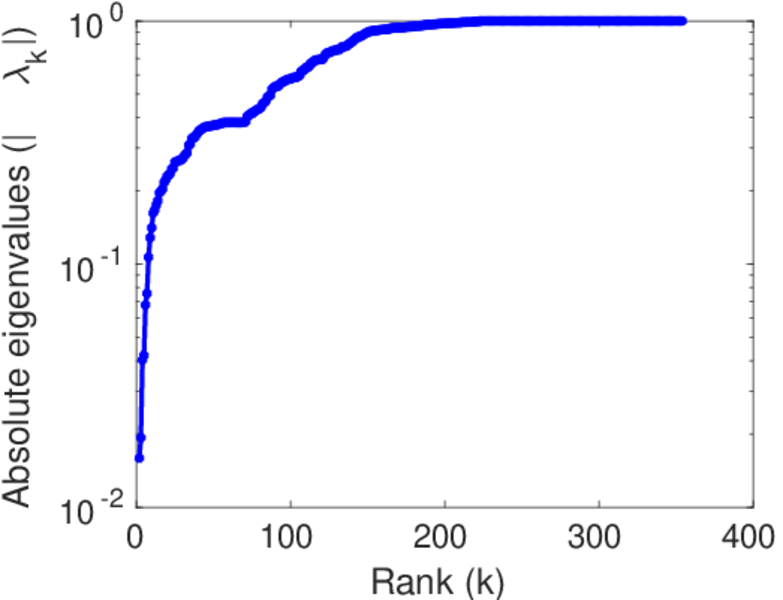
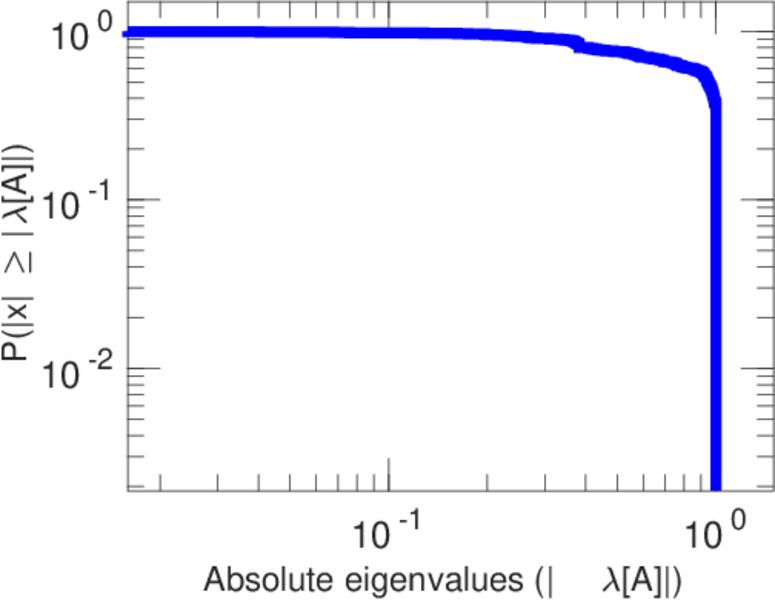
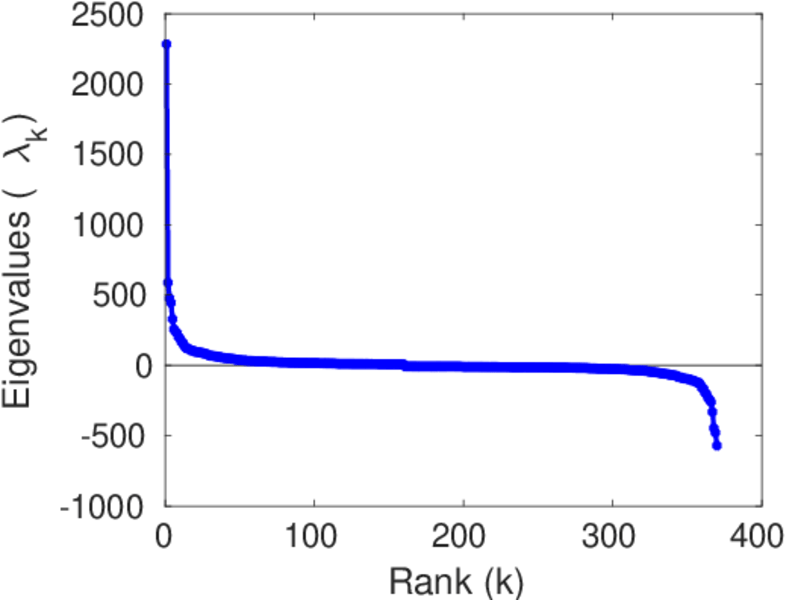
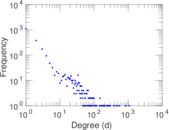
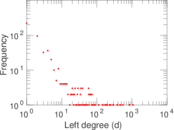
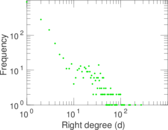
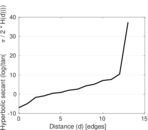
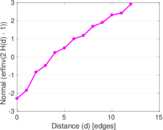
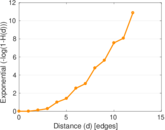
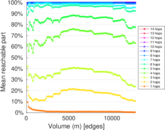
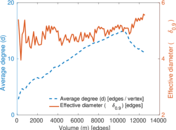
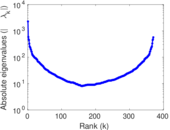
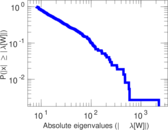
Plots


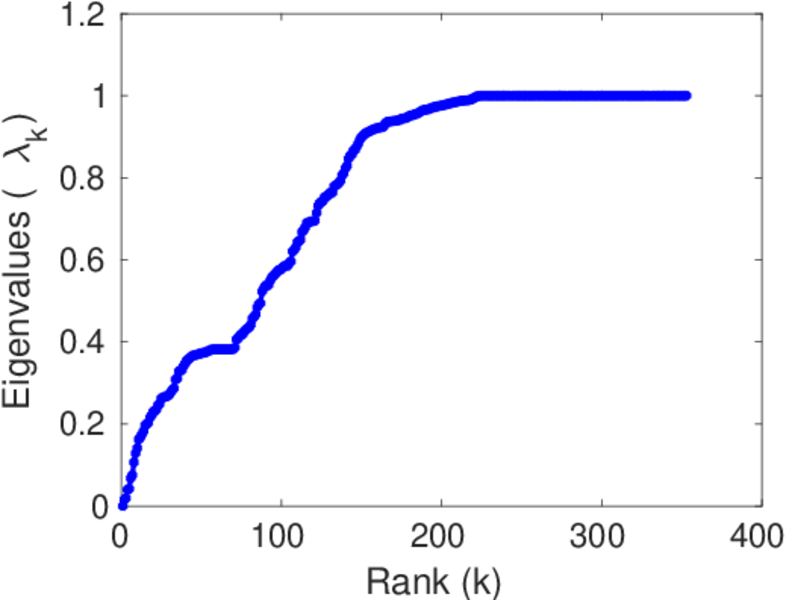
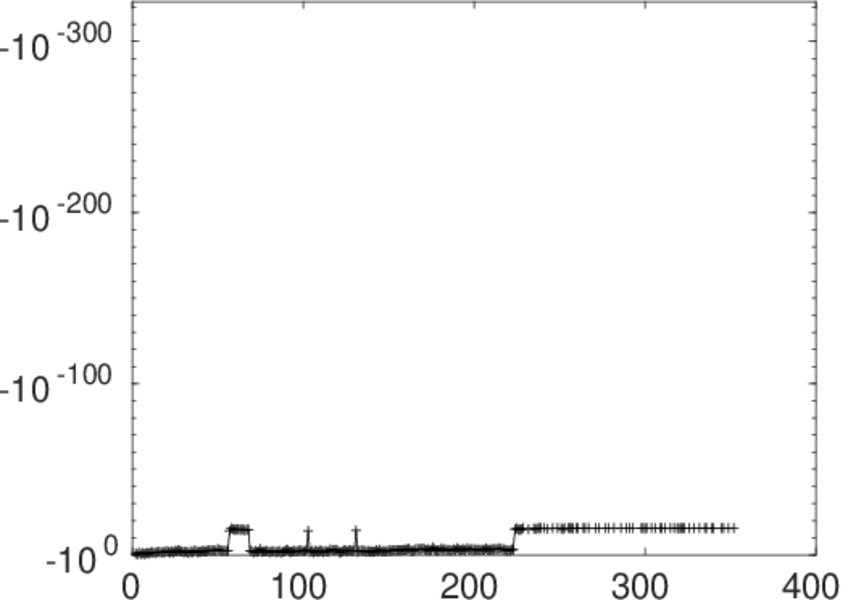
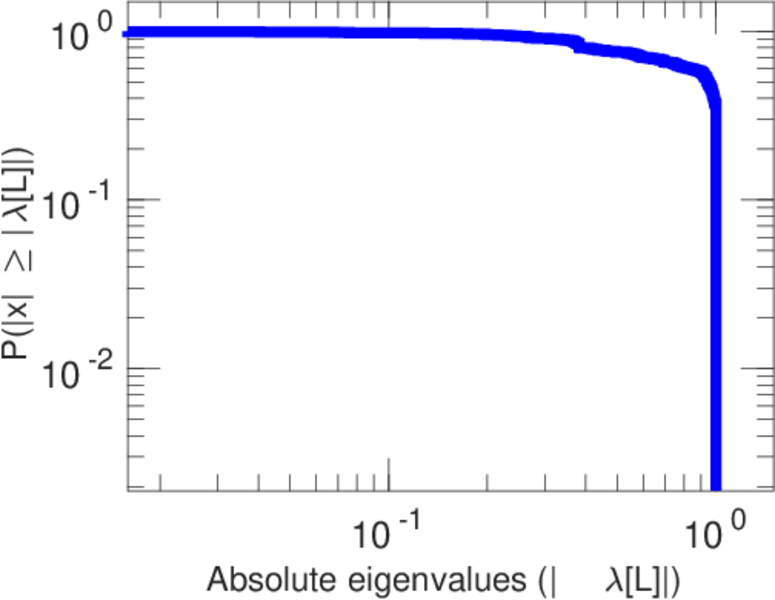
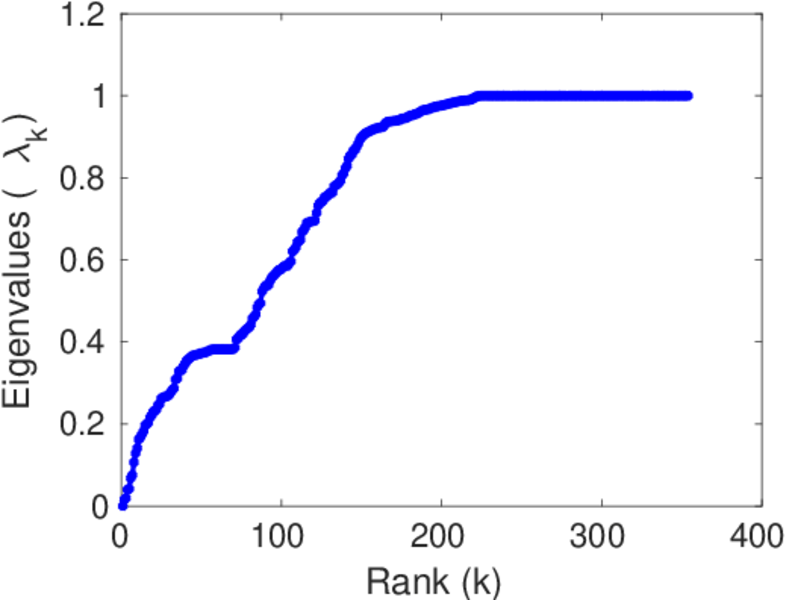
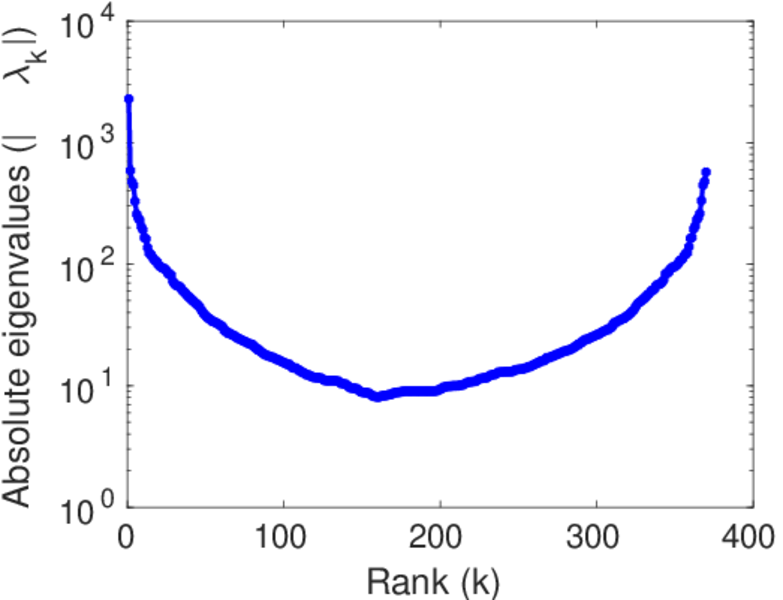
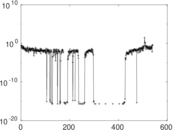
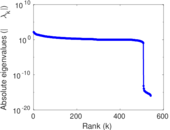
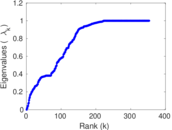
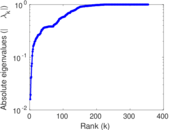
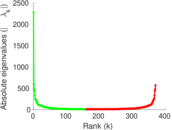
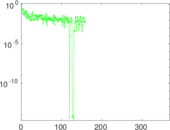
Matrix decompositions plots


Downloads
References
|
[1]
|
Jérôme Kunegis.
KONECT – The Koblenz Network Collection.
In Proc. Int. Conf. on World Wide Web Companion, pages
1343–1350, 2013.
[ http ]
|
|
[2]
|
Wikimedia Foundation.
Wikimedia downloads.
http://dumps.wikimedia.org/, January 2010.
|
 KONECT ‣ Networks ‣
Buy Me a Coffee
KONECT ‣ Networks ‣
Buy Me a Coffee