Wikipedia edits (roa-rup)
This is the bipartite edit network of the Aromanian Wikipedia. It contains
users and pages from the Aromanian Wikipedia, connected by edit events. Each
edge represents an edit. The dataset includes the timestamp of each edit.
Metadata
Statistics
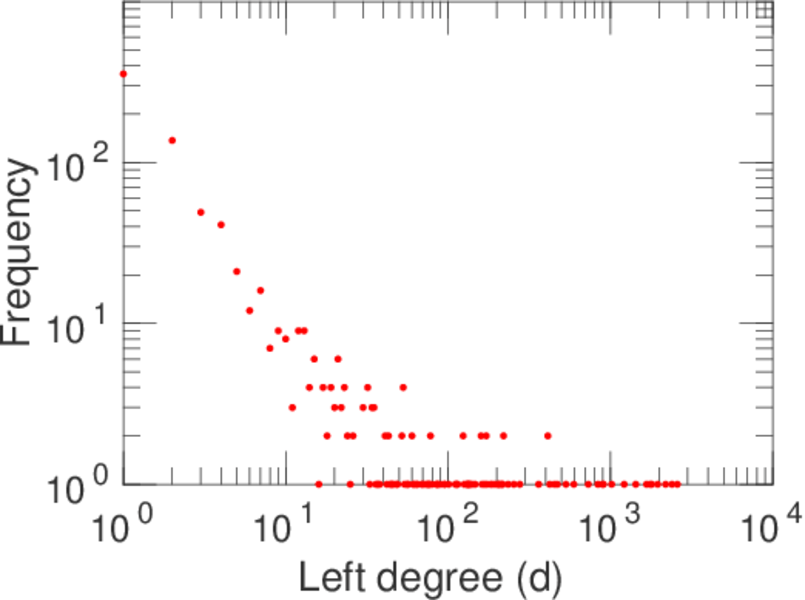
| Size | n = | 4,609
|
| Left size | n1 = | 831
|
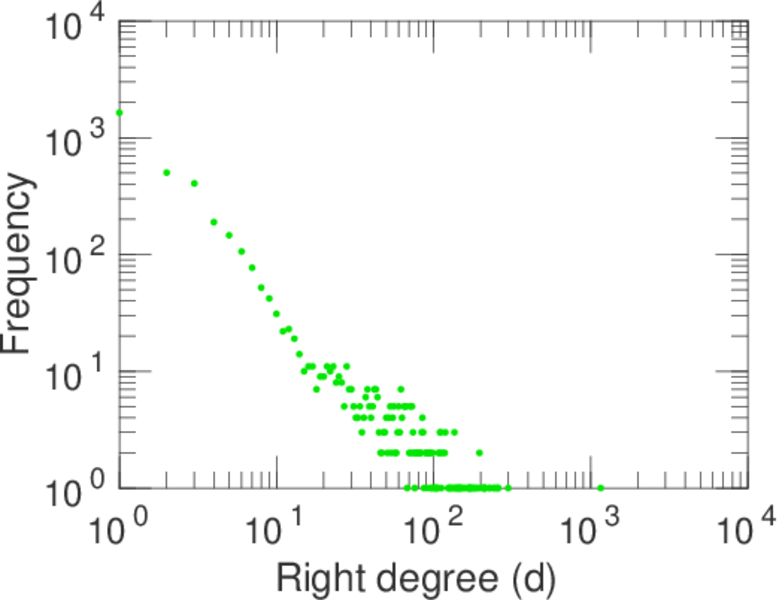
| Right size | n2 = | 3,778
|
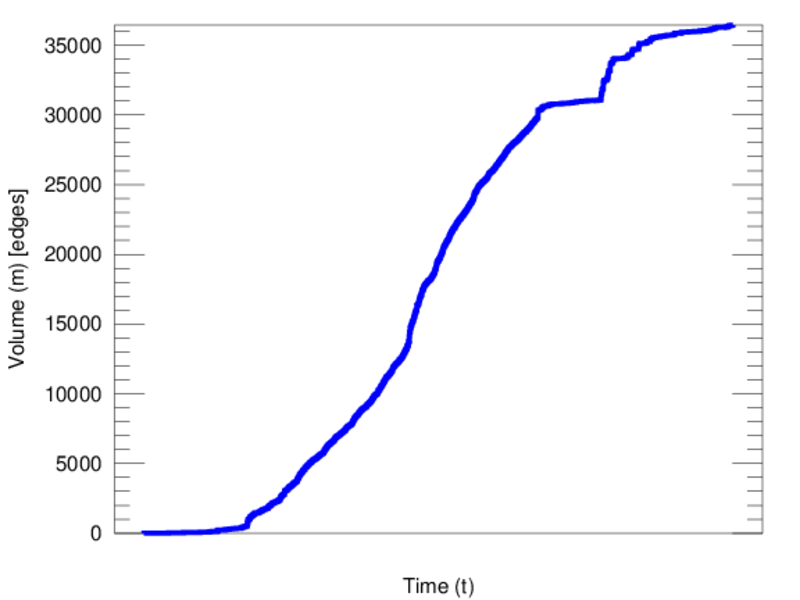
| Volume | m = | 36,438
|
| Unique edge count | m̿ = | 14,075
|
| Wedge count | s = | 2,031,666
|
| Claw count | z = | 389,825,600
|
| Cross count | x = | 79,709,319,436
|
| Square count | q = | 3,816,728
|
| 4-Tour count | T4 = | 38,690,594
|
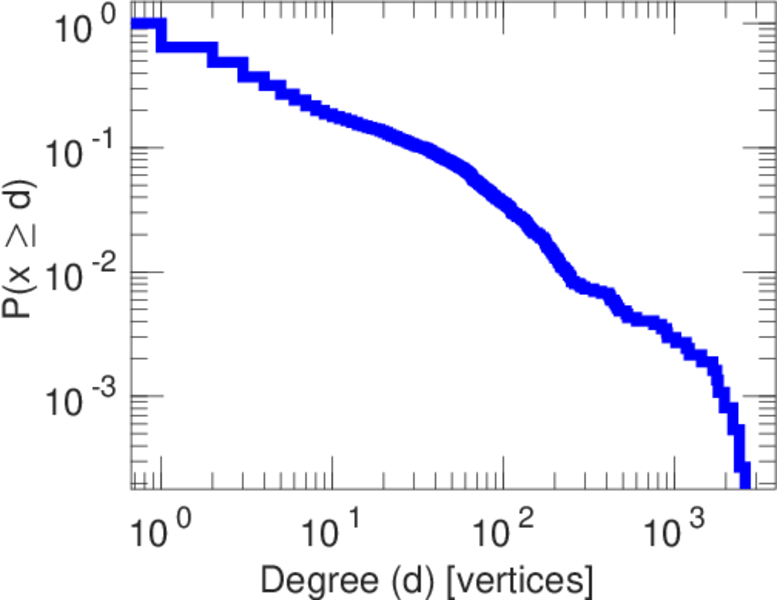
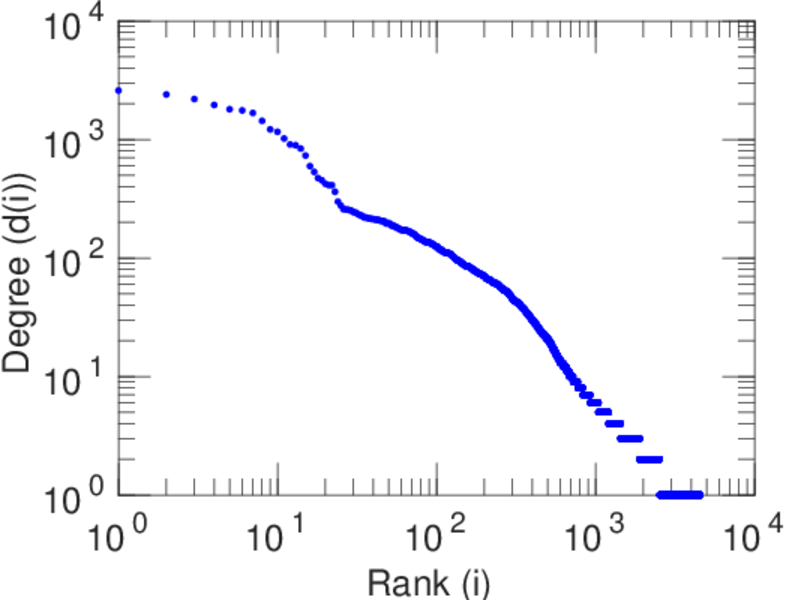
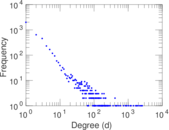
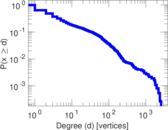
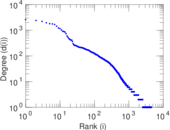
| Maximum degree | dmax = | 2,590
|
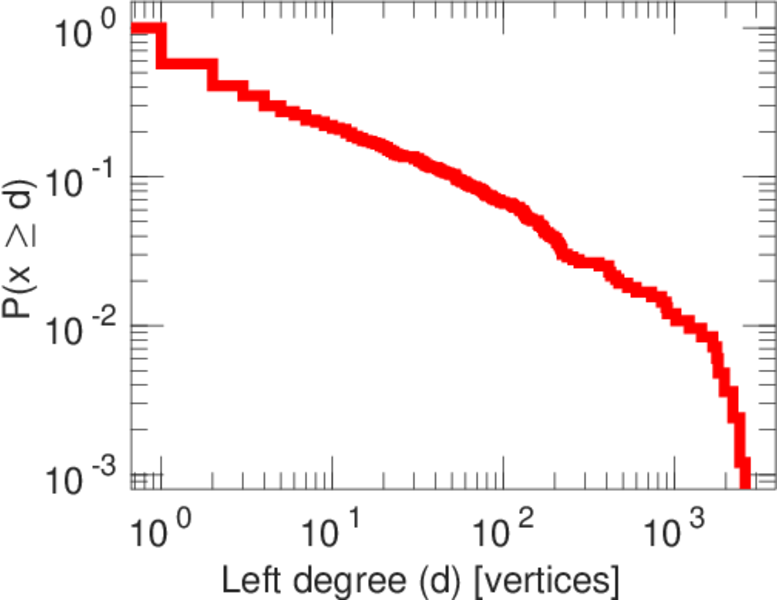
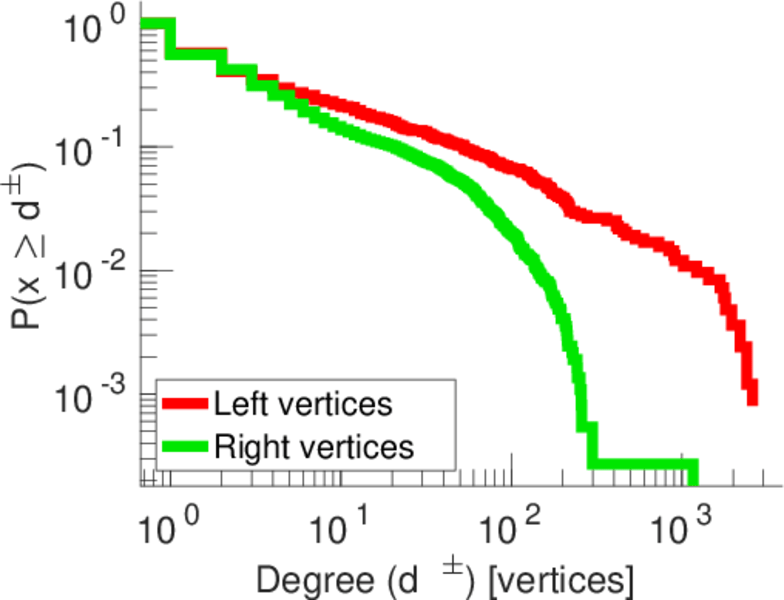
| Maximum left degree | d1max = | 2,590
|
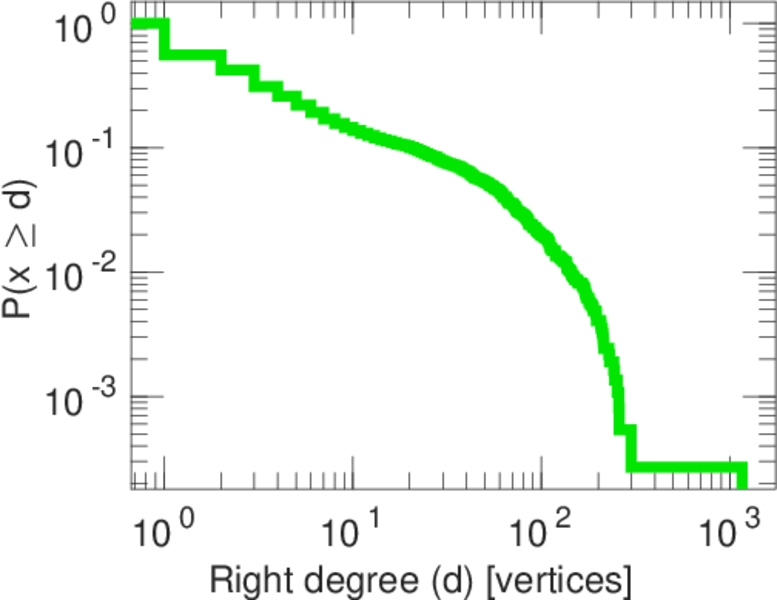
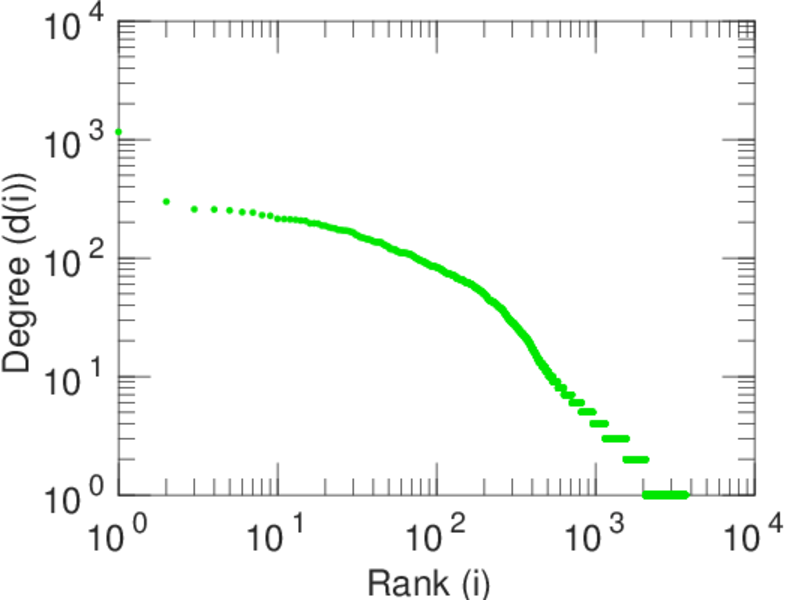
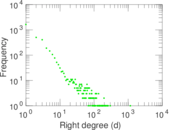
| Maximum right degree | d2max = | 1,160
|
| Average degree | d = | 15.811 7
|
| Average left degree | d1 = | 43.848 4
|
| Average right degree | d2 = | 9.644 79
|
| Fill | p = | 0.004 483 17
|
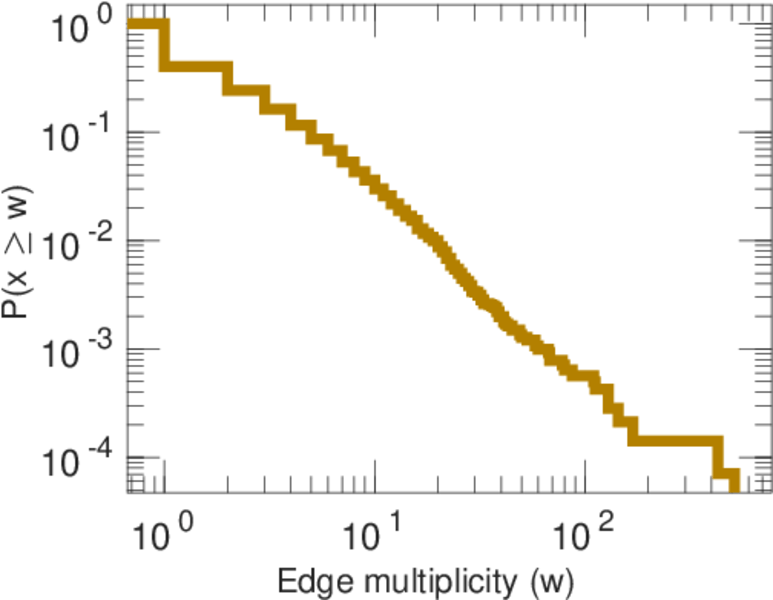
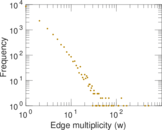
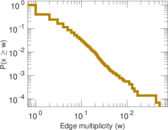
| Average edge multiplicity | m̃ = | 2.588 85
|
| Size of LCC | N = | 3,925
|
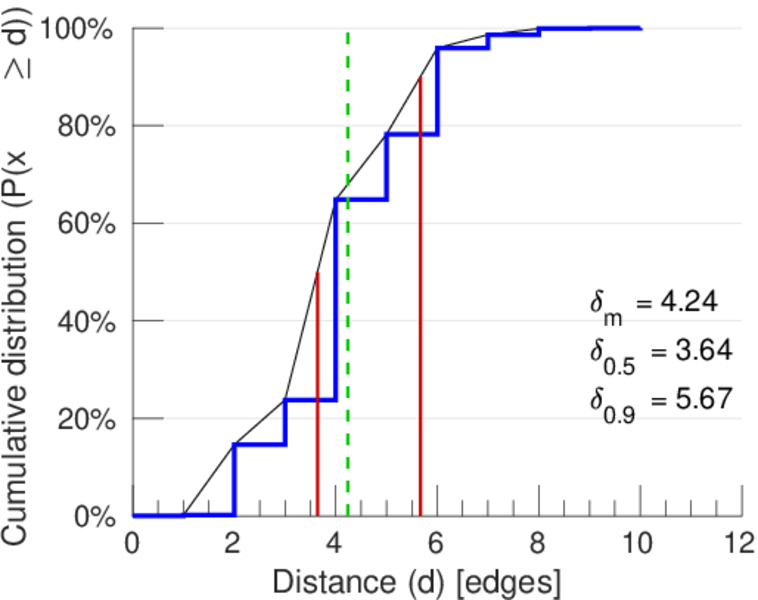
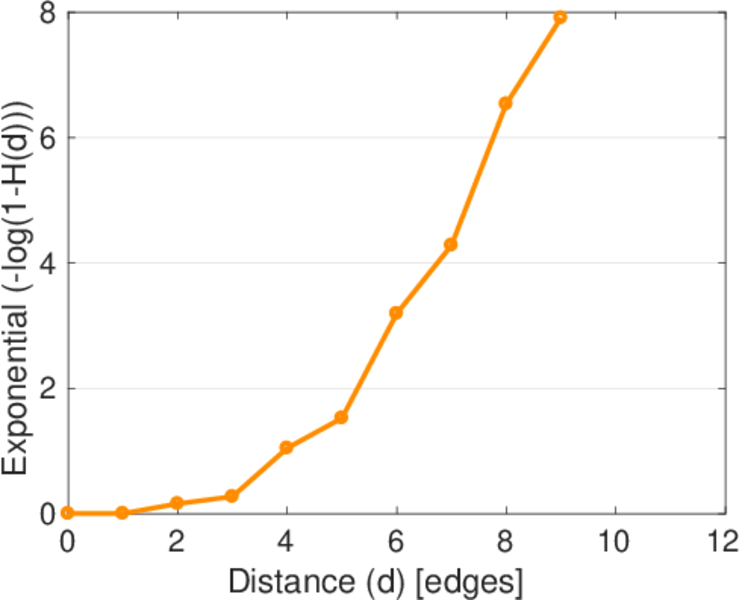
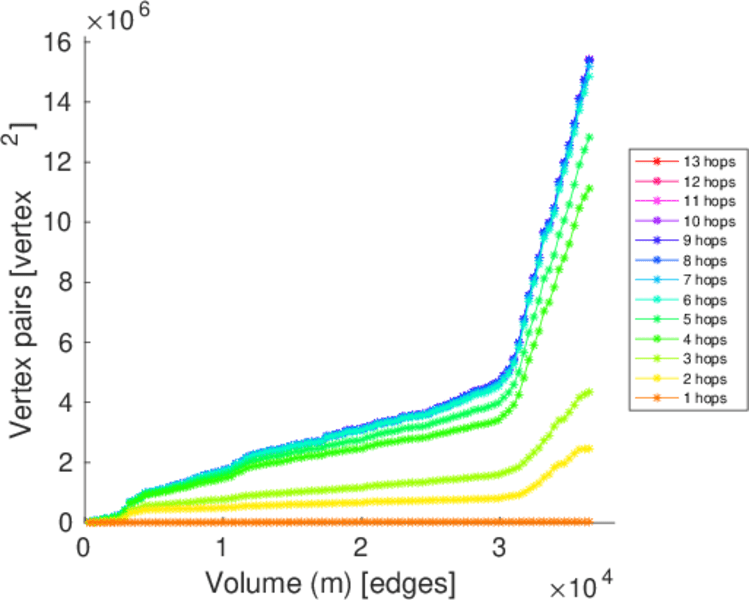
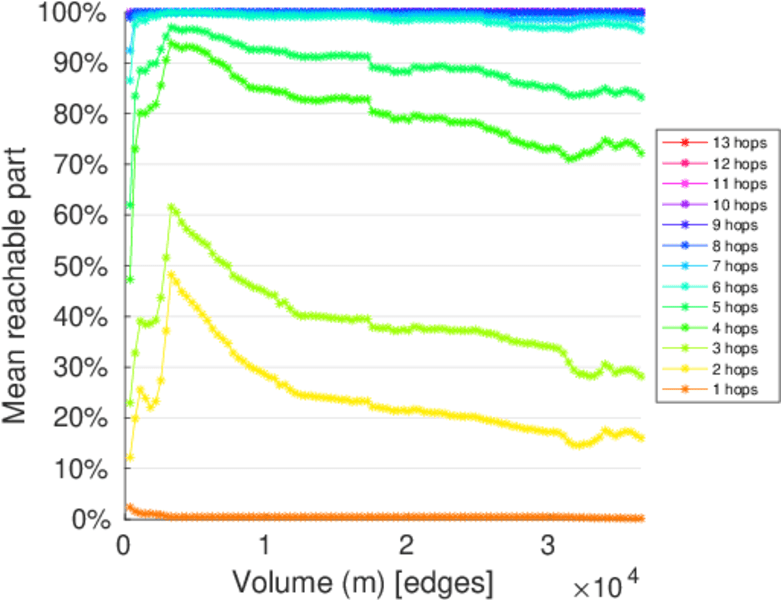
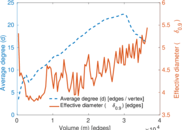
| Diameter | δ = | 12
|
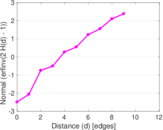
| 50-Percentile effective diameter | δ0.5 = | 3.639 19
|
| 90-Percentile effective diameter | δ0.9 = | 5.667 25
|
| Median distance | δM = | 4
|
| Mean distance | δm = | 4.241 08
|
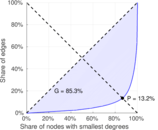
| Gini coefficient | G = | 0.851 652
|
| Balanced inequality ratio | P = | 0.136 396
|
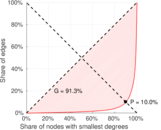
| Left balanced inequality ratio | P1 = | 0.099 621 3
|
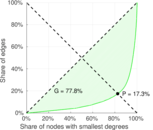
| Right balanced inequality ratio | P2 = | 0.172 540
|
| Relative edge distribution entropy | Her = | 0.800 042
|
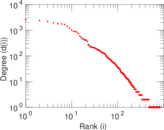
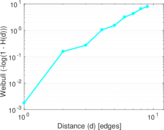
| Power law exponent | γ = | 2.475 79
|
| Tail power law exponent | γt = | 2.401 00
|
| Tail power law exponent with p | γ3 = | 2.401 00
|
| p-value | p = | 0.407 000
|
| Left tail power law exponent with p | γ3,1 = | 1.591 00
|
| Left p-value | p1 = | 0.004 000 00
|
| Right tail power law exponent with p | γ3,2 = | 1.961 00
|
| Right p-value | p2 = | 0.000 00
|
| Degree assortativity | ρ = | −0.315 384
|
| Degree assortativity p-value | pρ = | 1.482 20 × 10−322
|
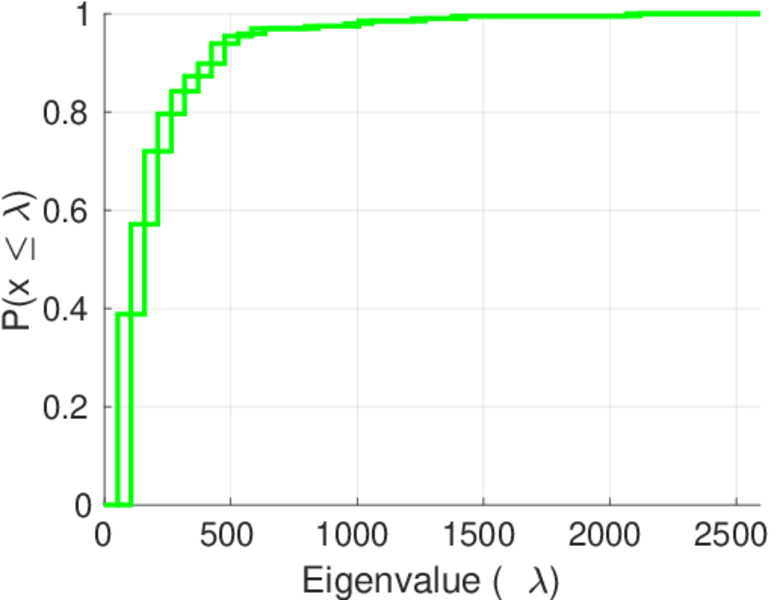
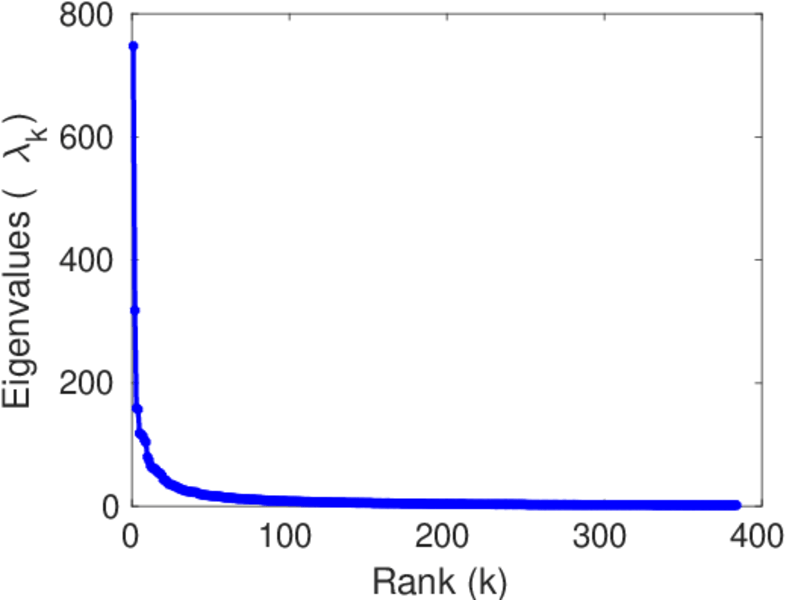
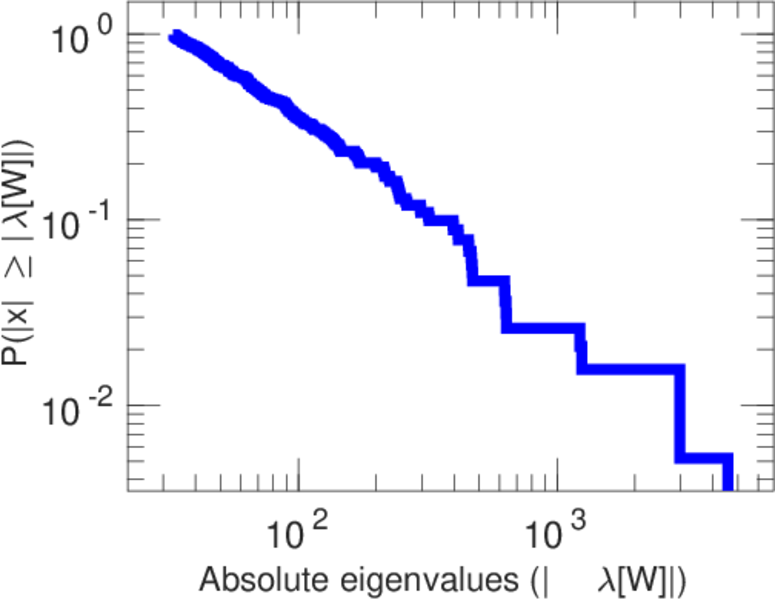
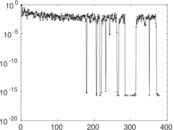
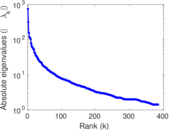
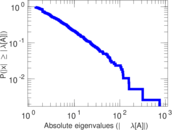
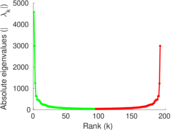
| Spectral norm | α = | 747.404
|
| Algebraic connectivity | a = | 0.036 432 3
|
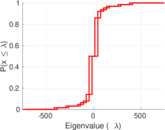
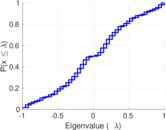
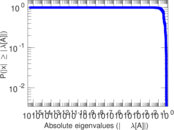
| Spectral separation | |λ1[A] / λ2[A]| = | 2.351 94
|
| Controllability | C = | 3,006
|
| Relative controllability | Cr = | 0.664 456
|
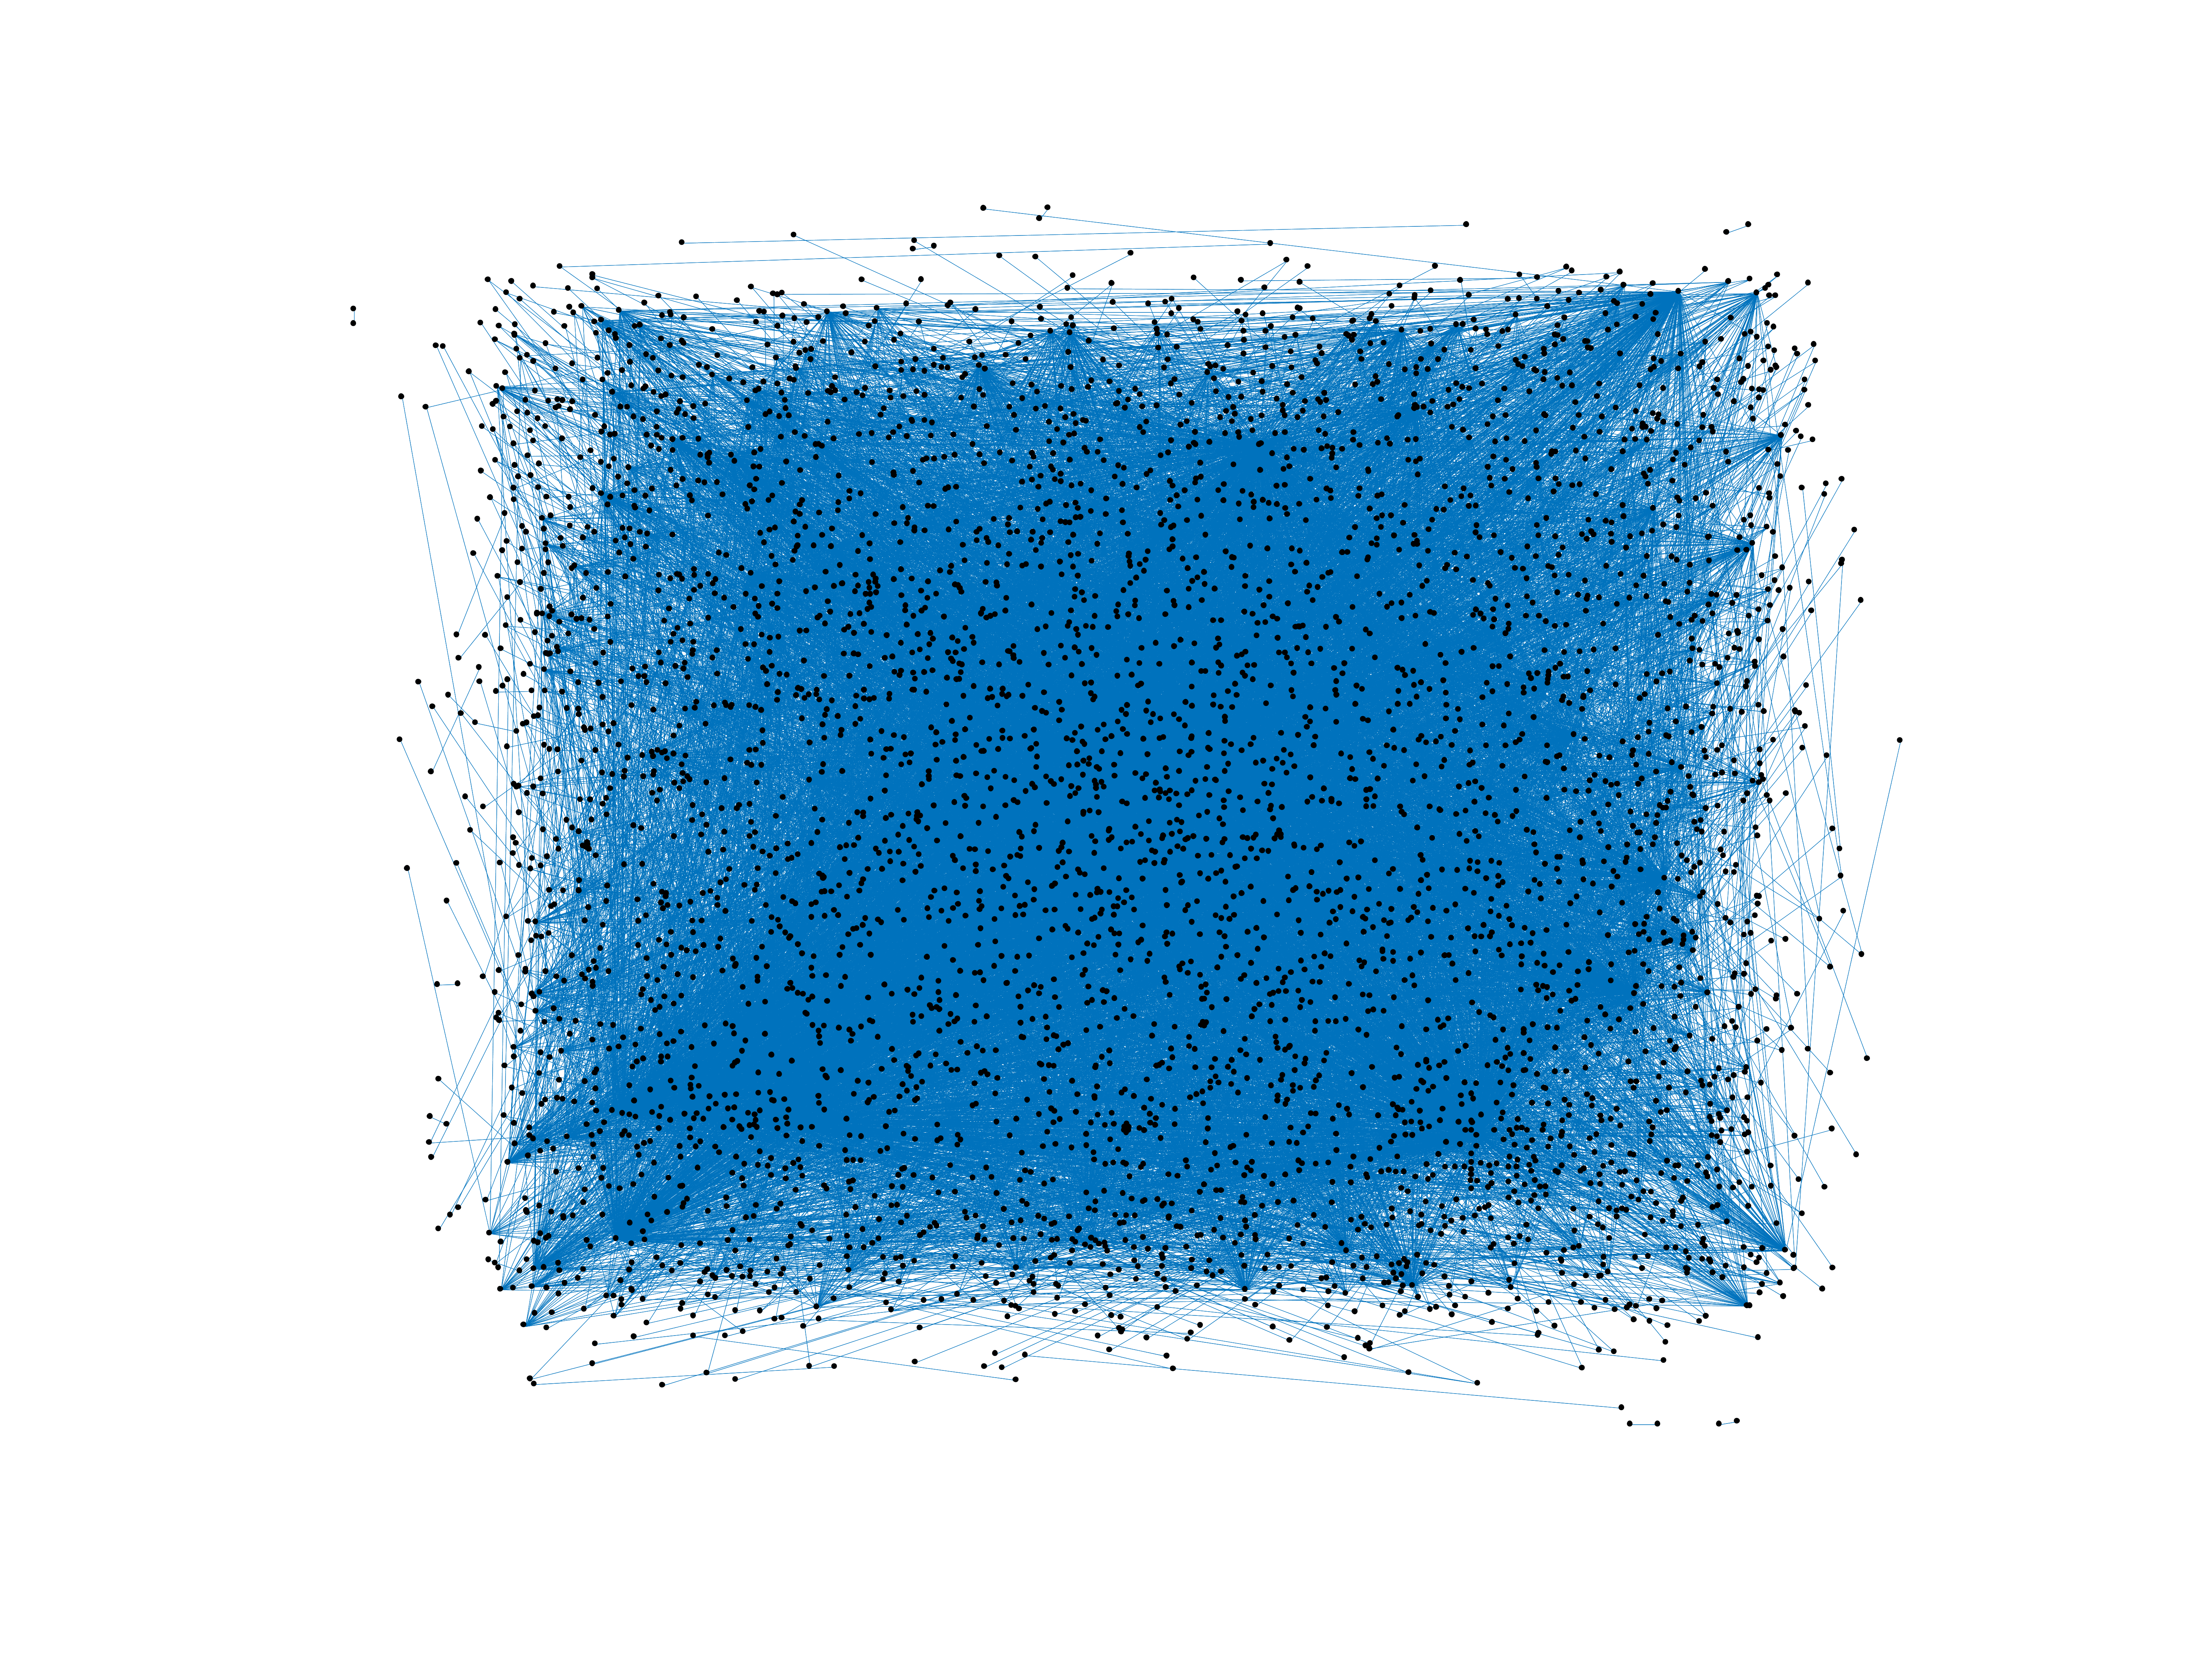
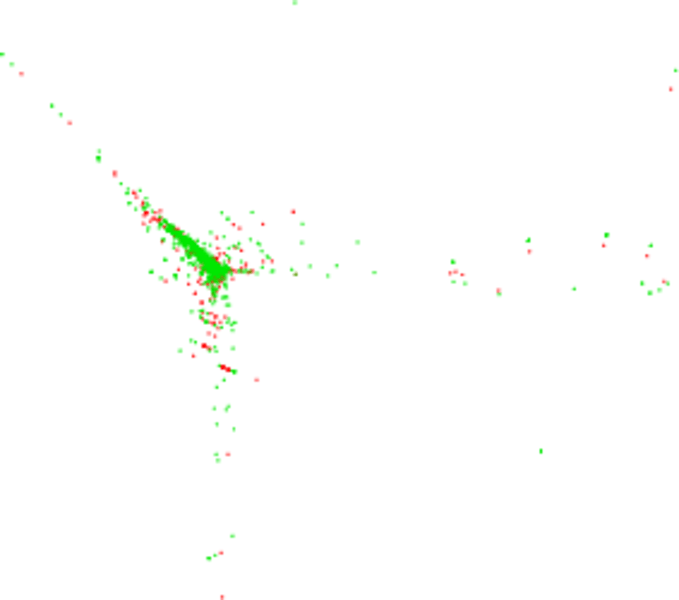
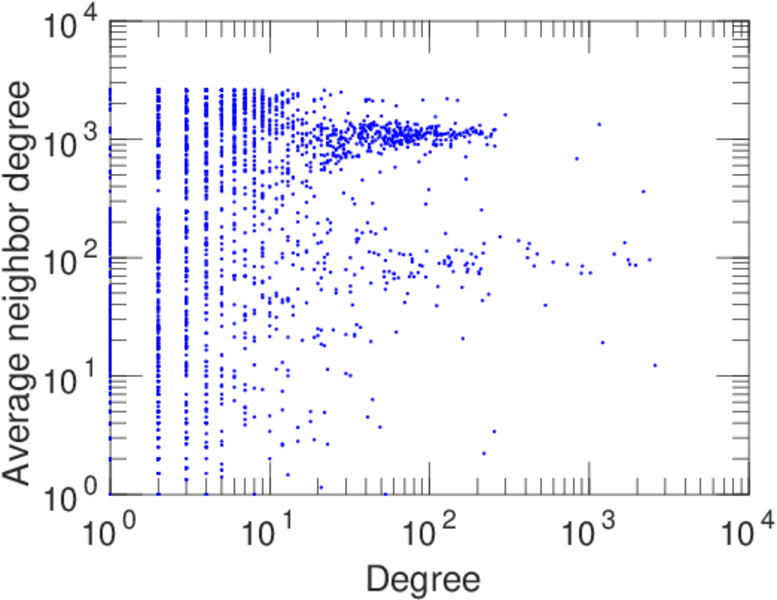
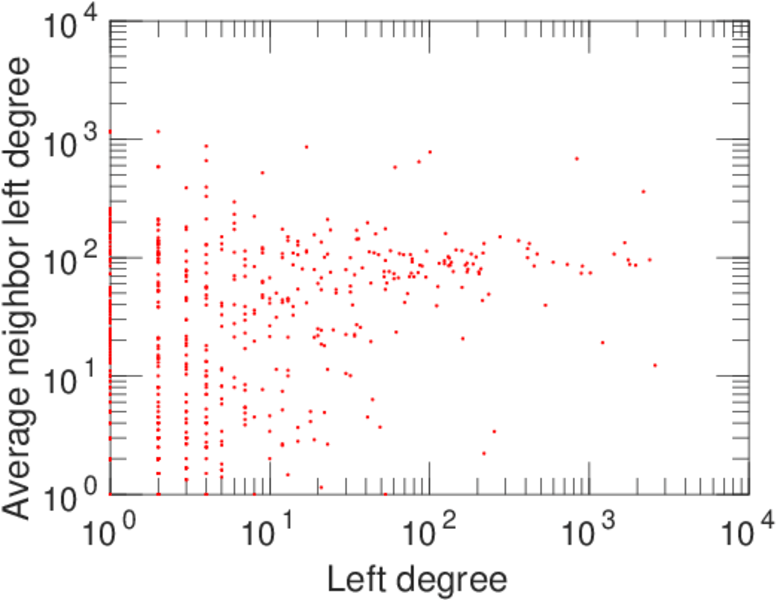
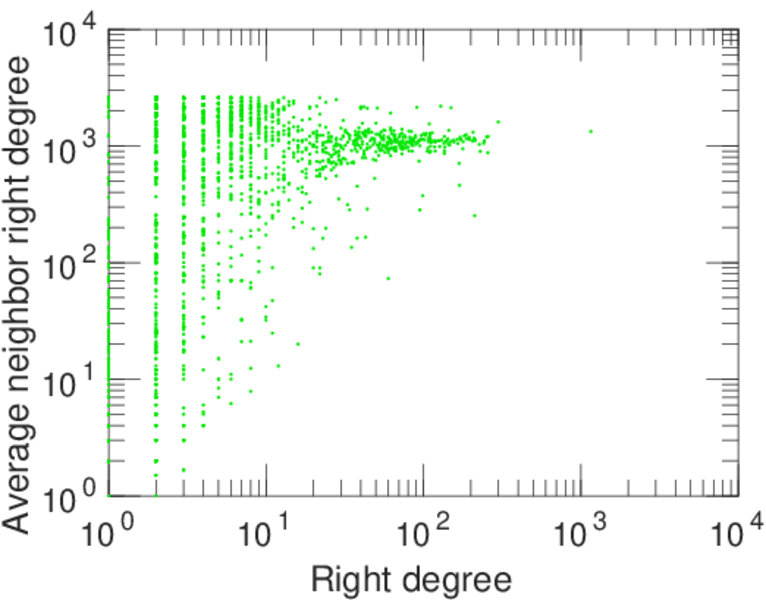
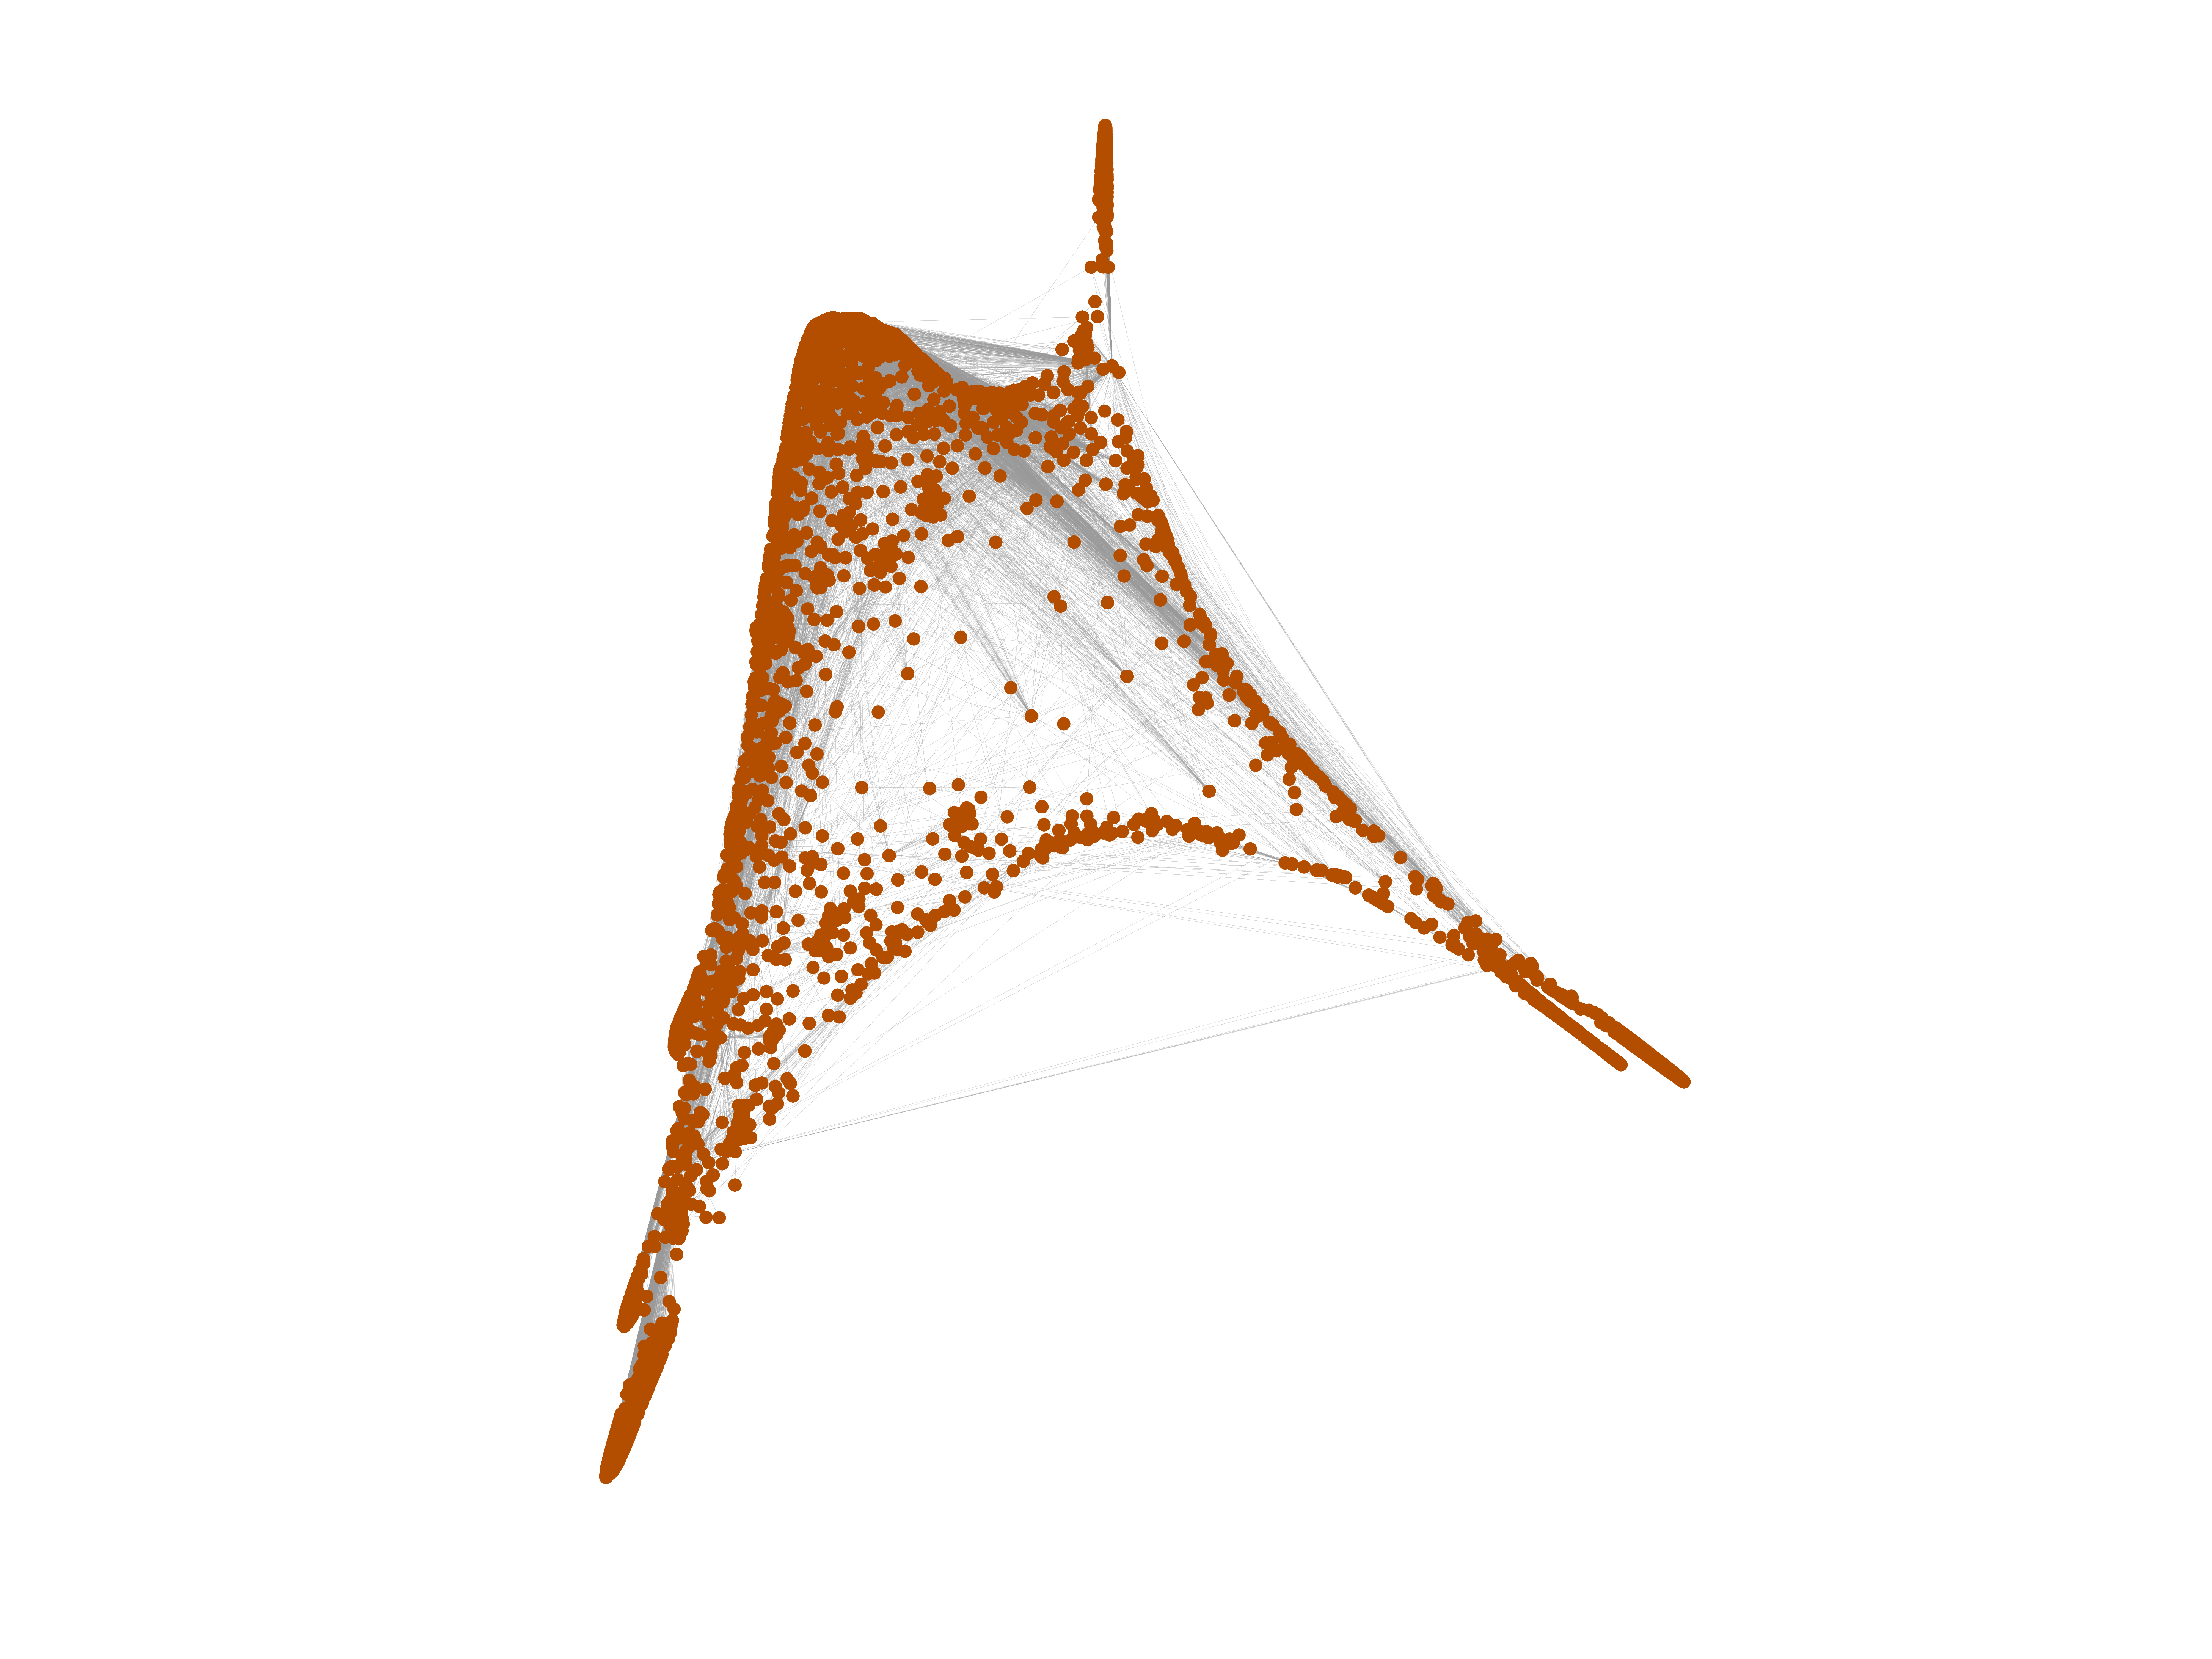
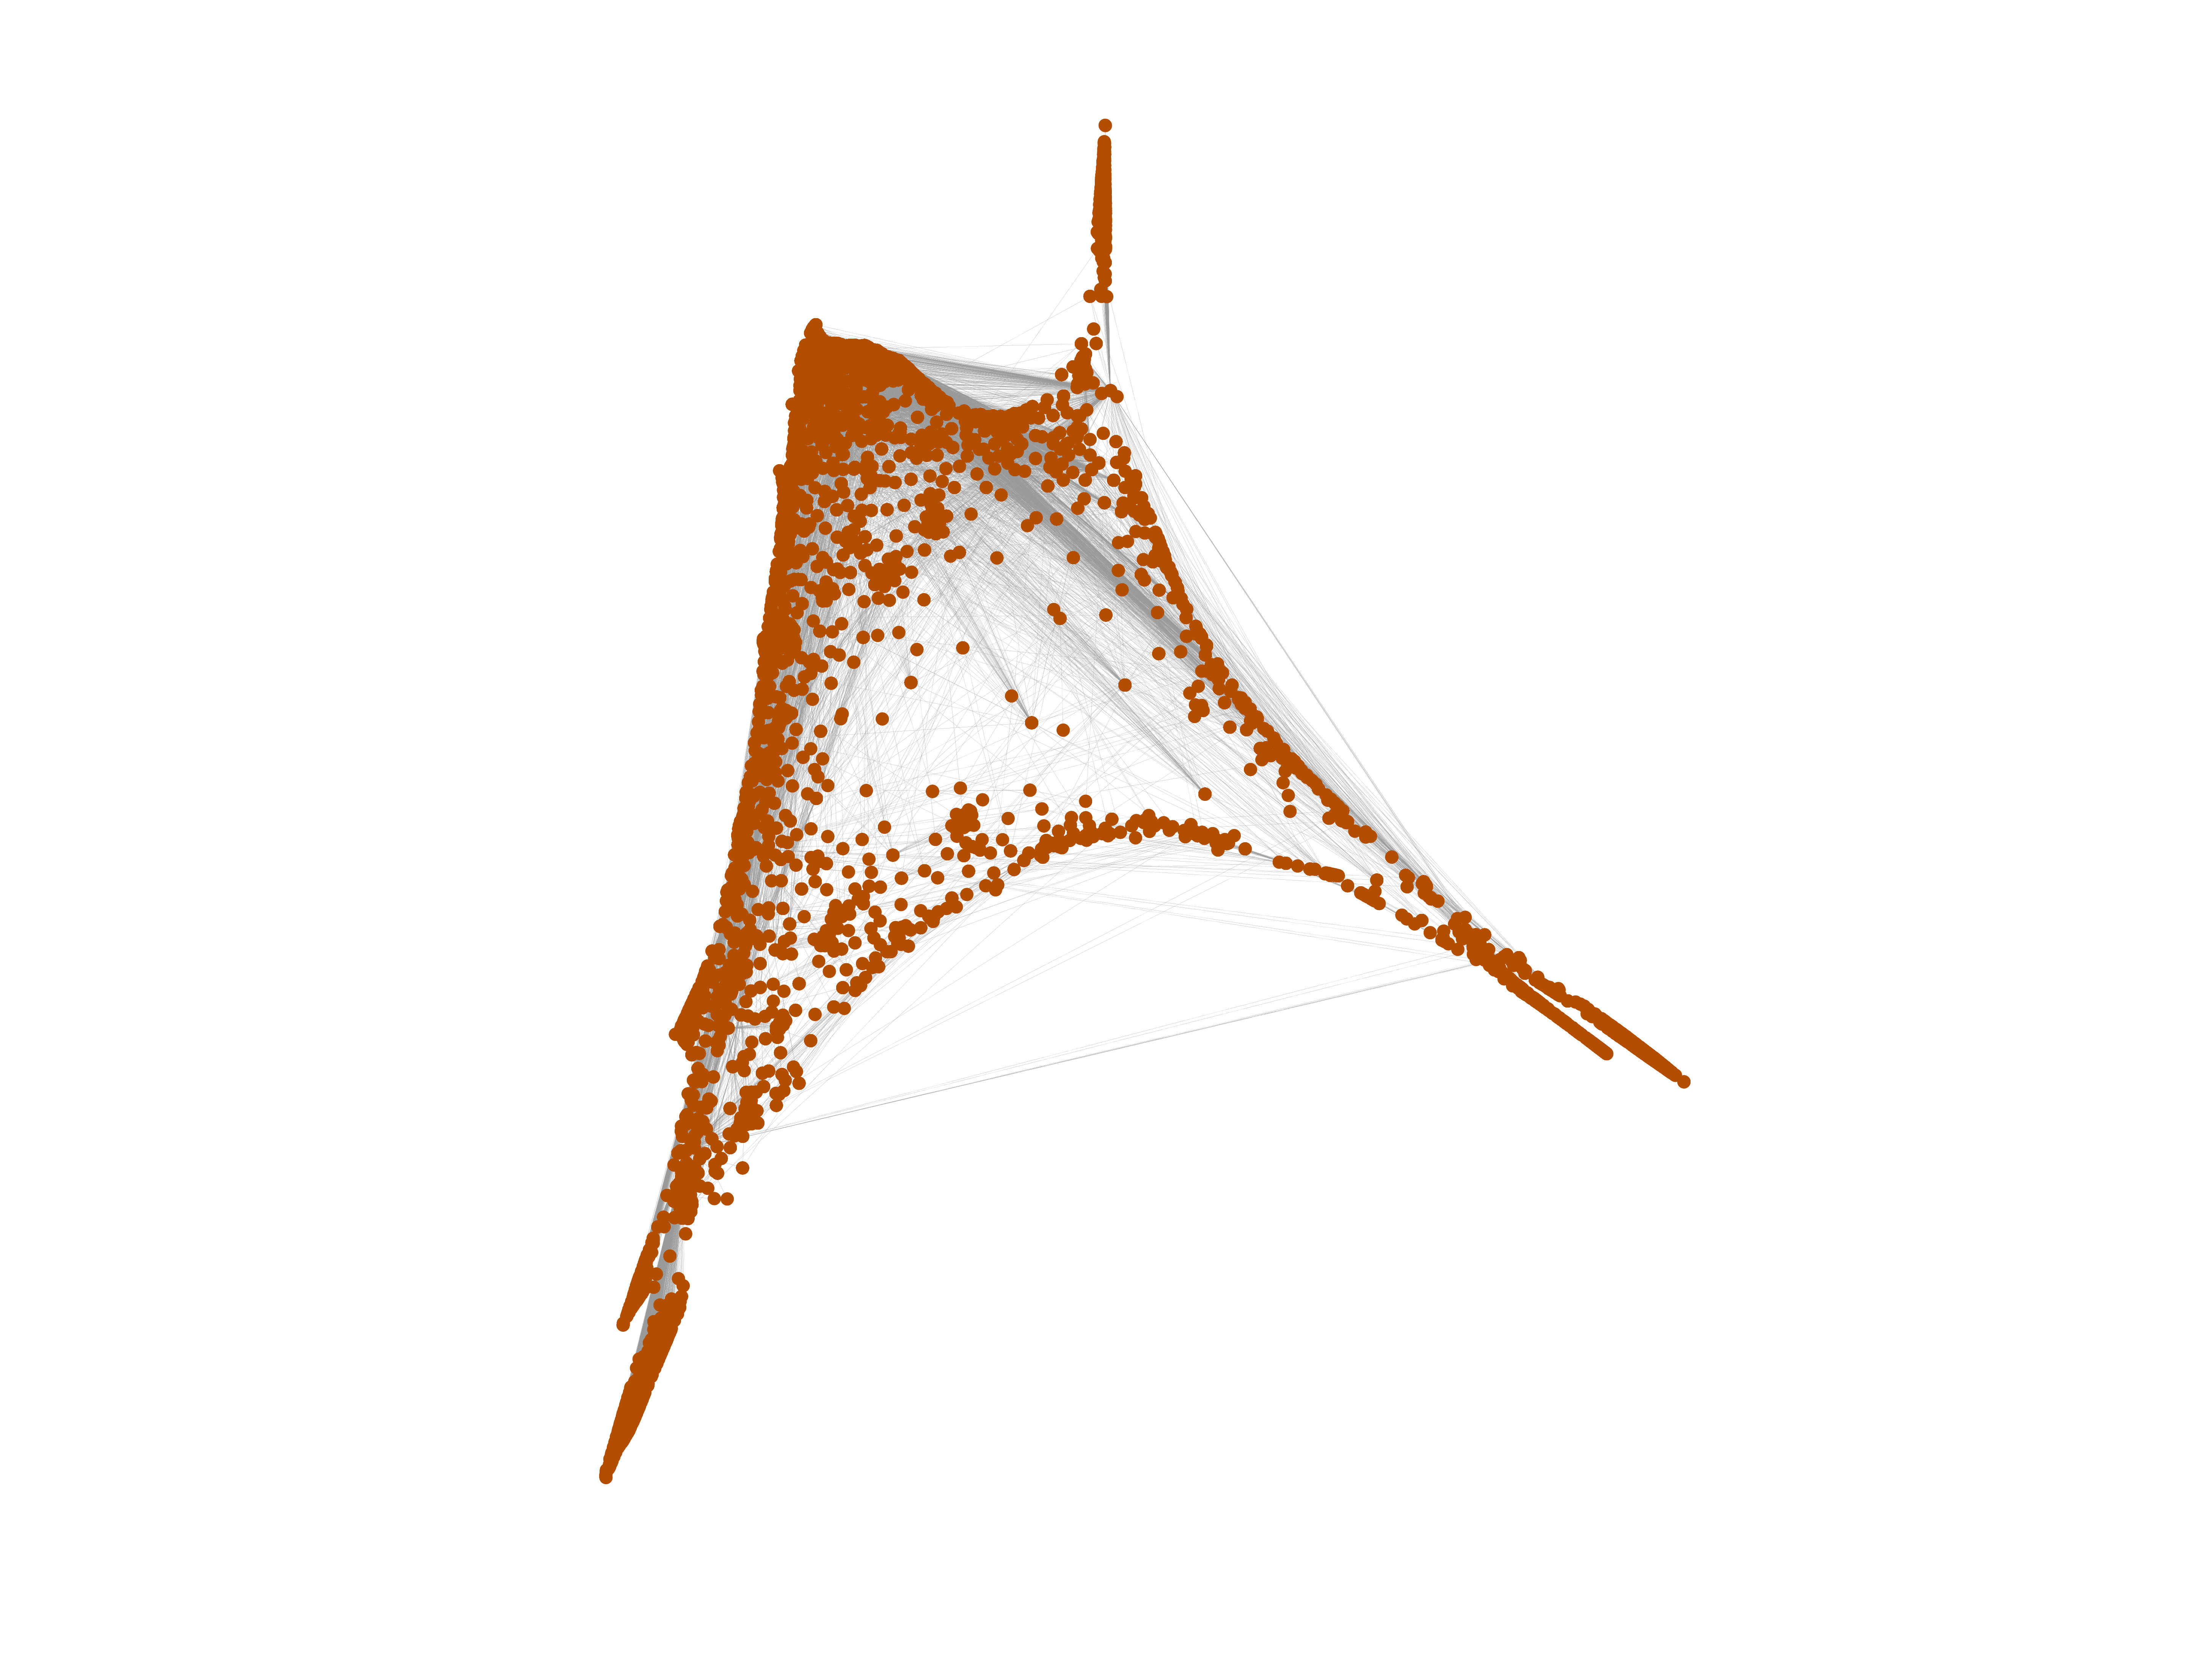
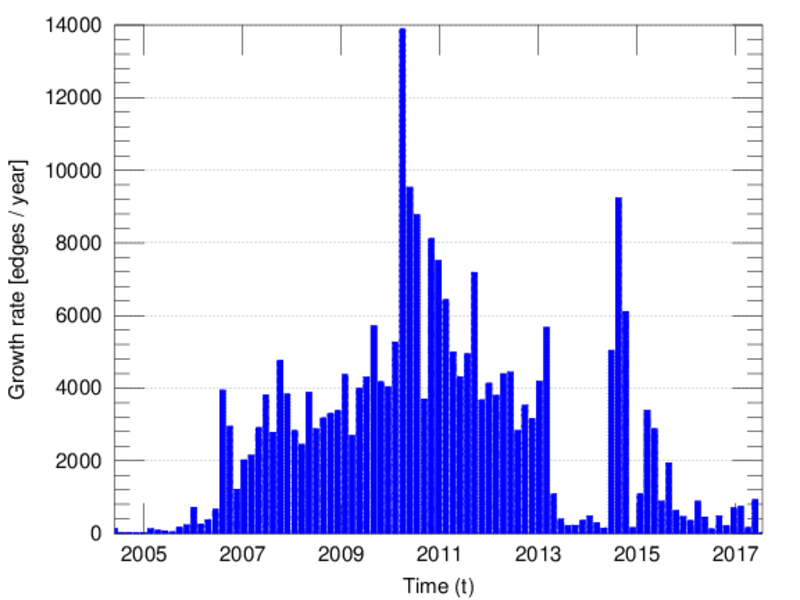
Plots


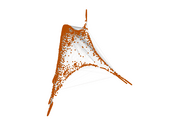
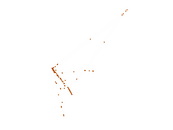
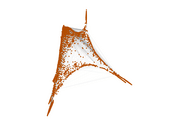


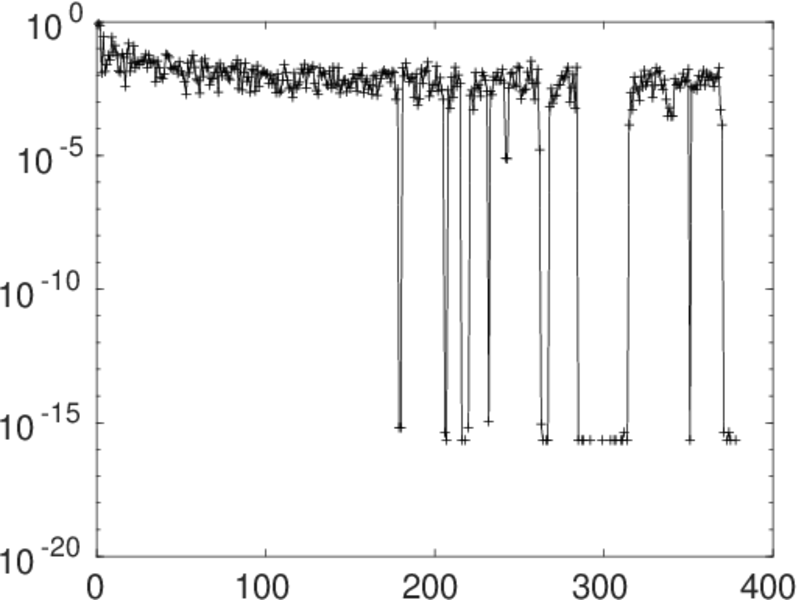
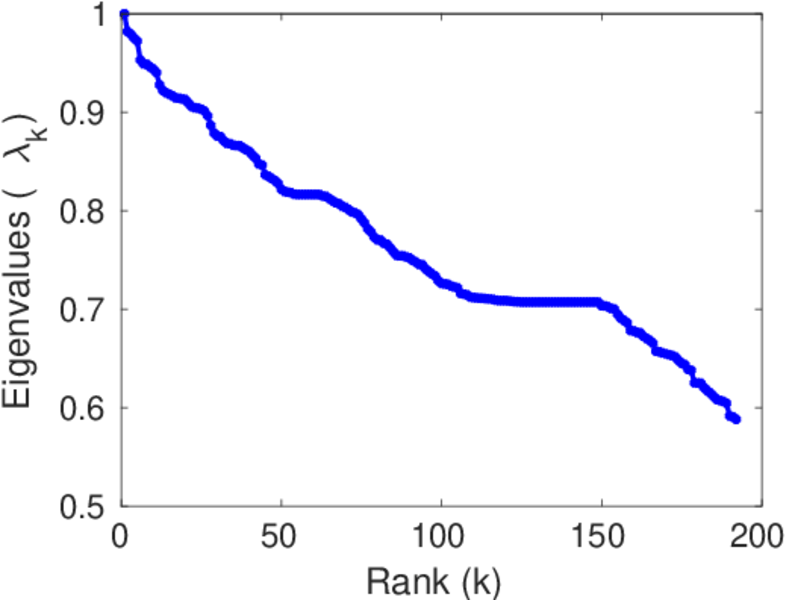
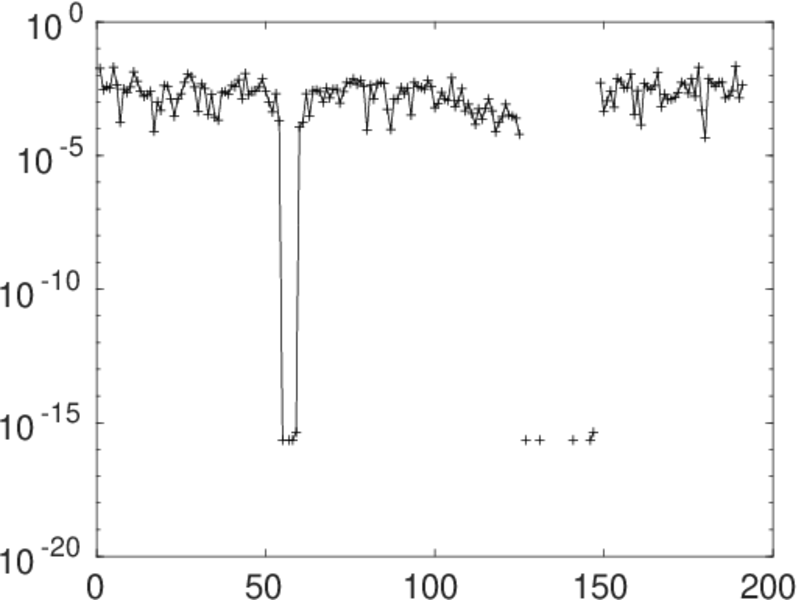
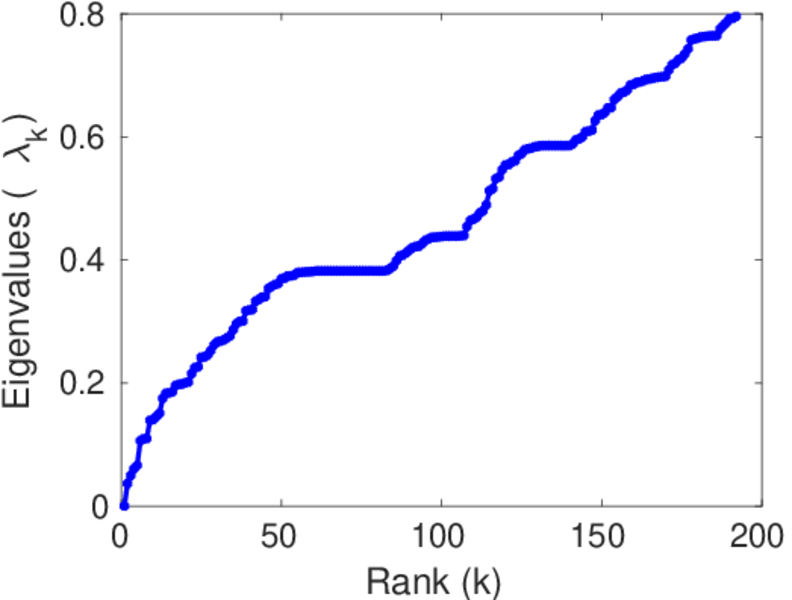
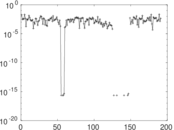
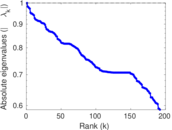
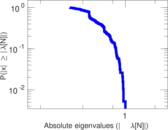
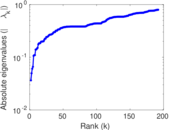
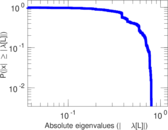
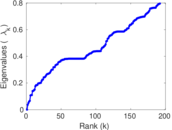
Matrix decompositions plots


Downloads
References
|
[1]
|
Jérôme Kunegis.
KONECT – The Koblenz Network Collection.
In Proc. Int. Conf. on World Wide Web Companion, pages
1343–1350, 2013.
[ http ]
|
|
[2]
|
Wikimedia Foundation.
Wikimedia downloads.
http://dumps.wikimedia.org/, January 2010.
|
 KONECT ‣ Networks ‣
Buy Me a Coffee
KONECT ‣ Networks ‣
Buy Me a Coffee