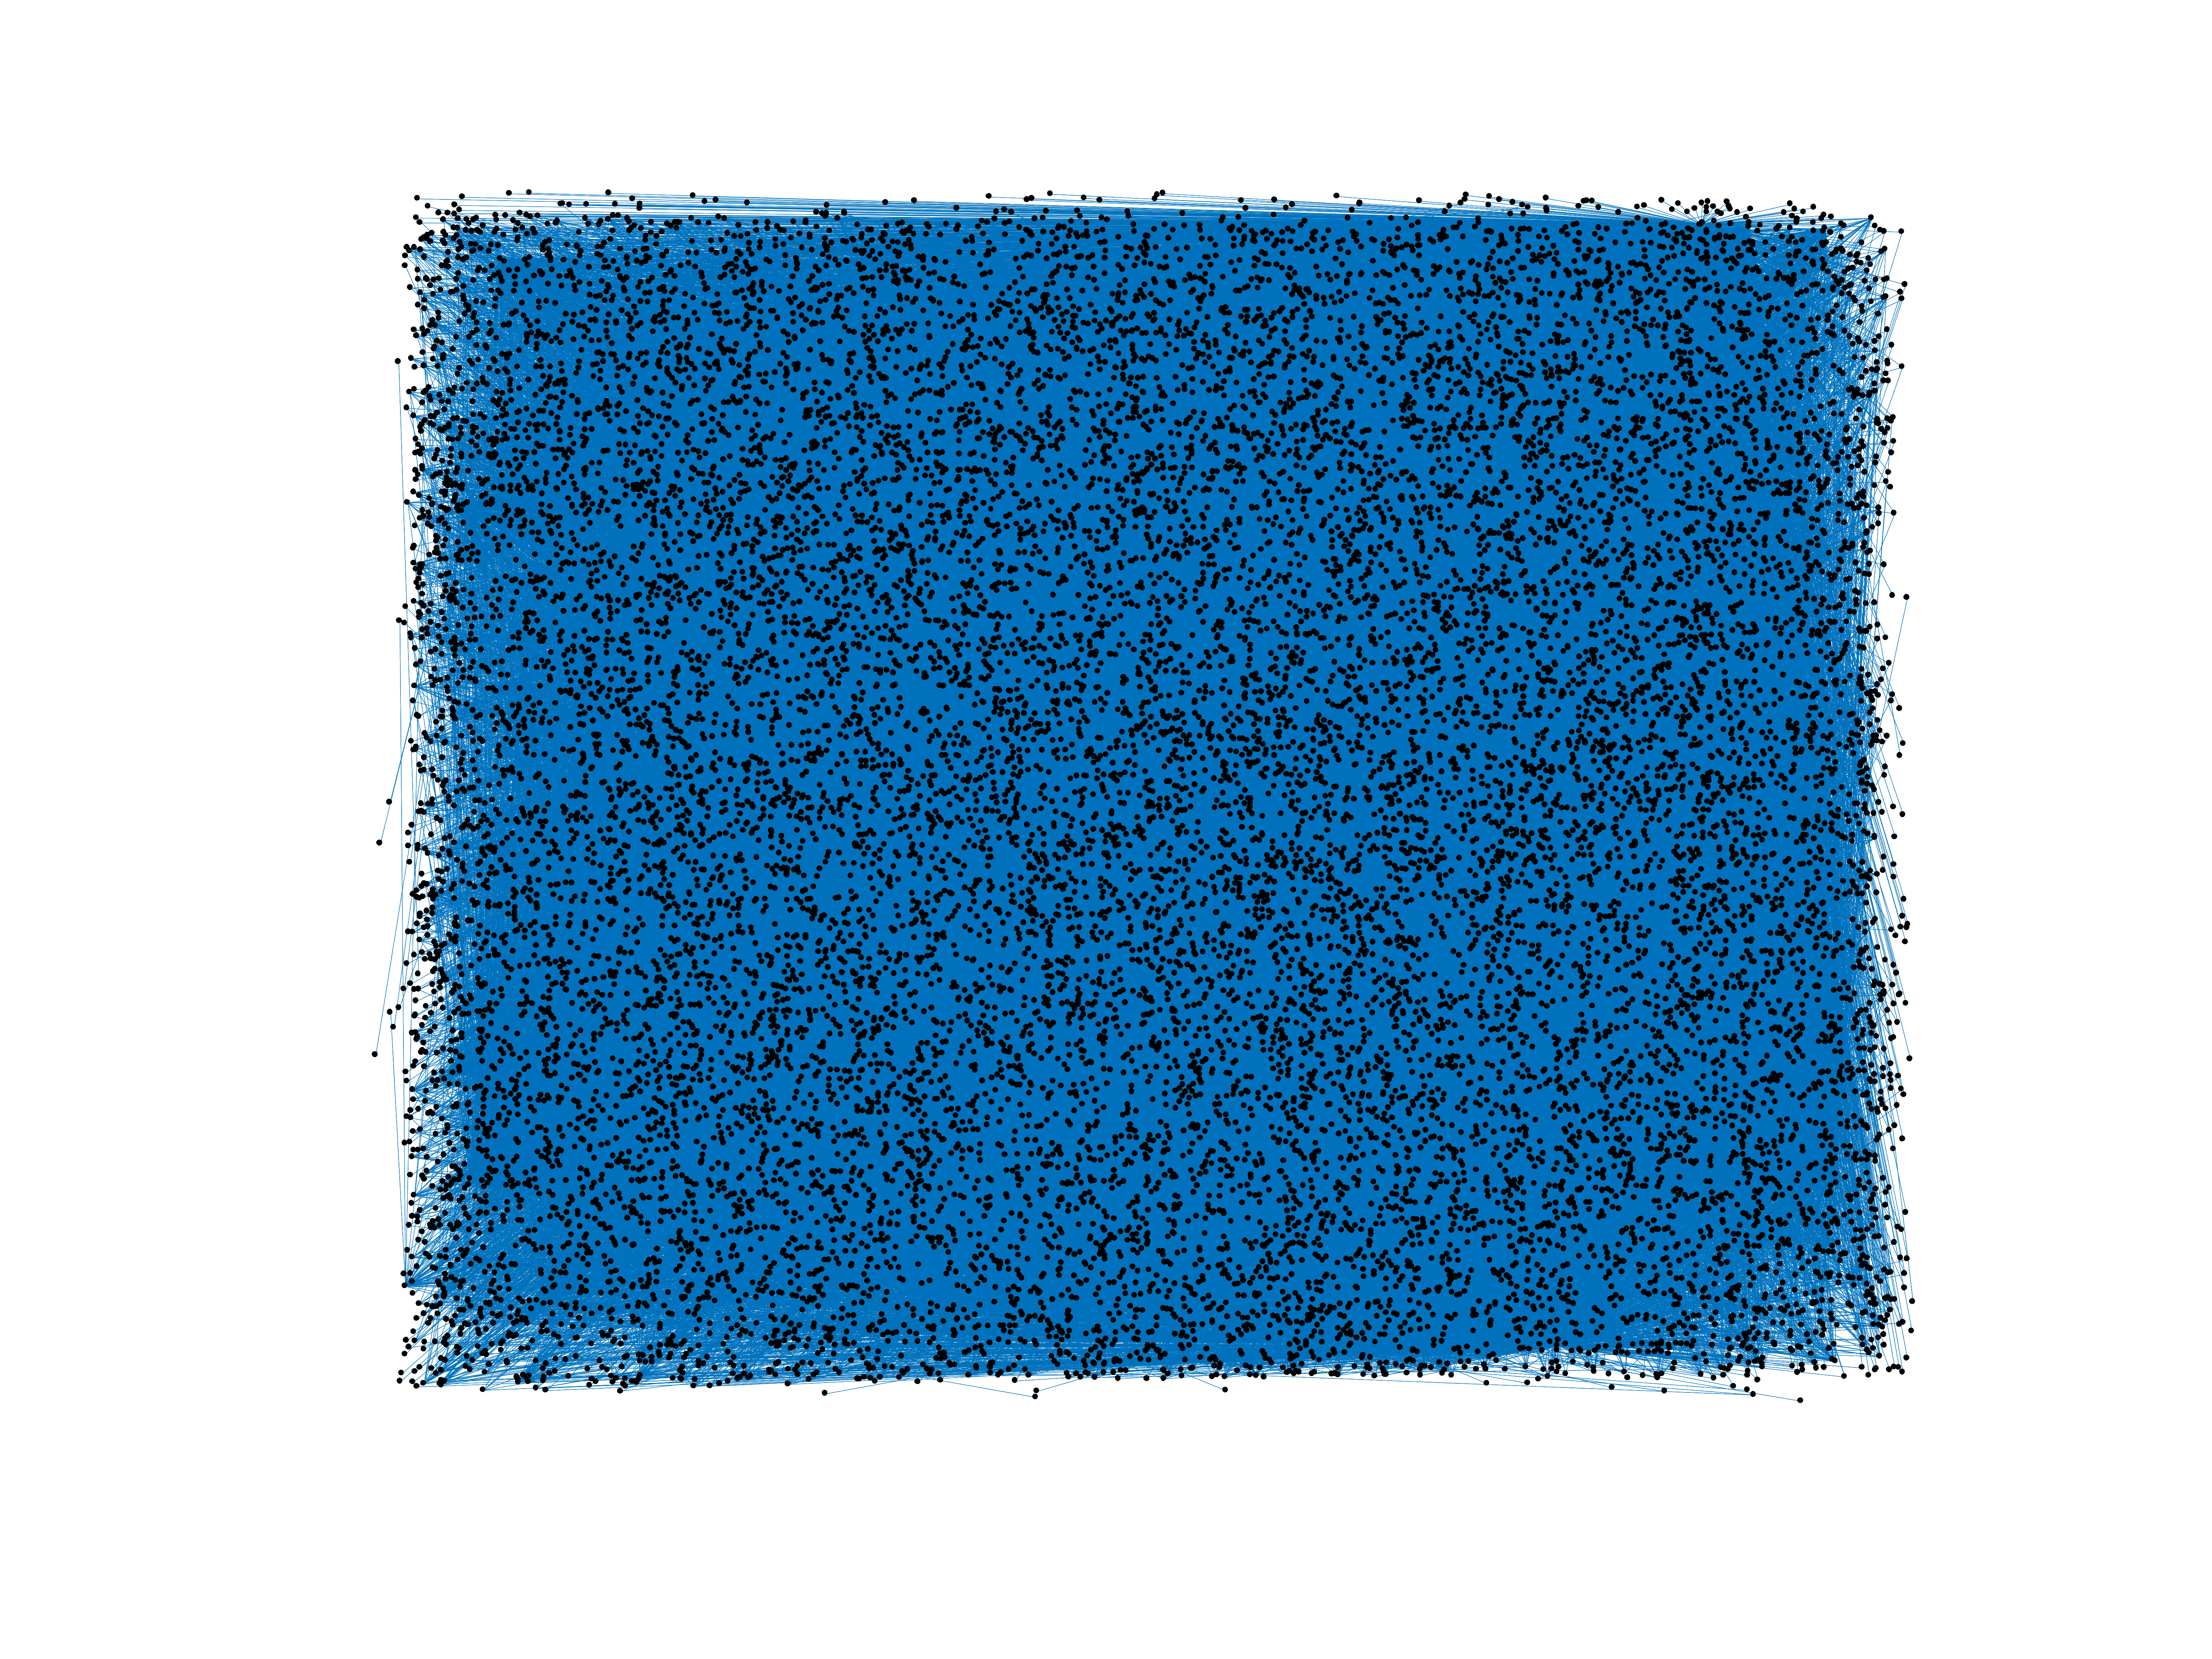
Wikipedia edits (roa-tara)
This is the bipartite edit network of the tarandíne Wikipedia. It contains
users and pages from the tarandíne Wikipedia, connected by edit events. Each
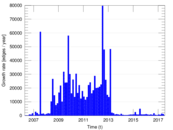
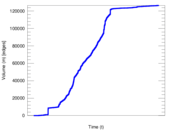
edge represents an edit. The dataset includes the timestamp of each edit.
Metadata
Statistics
| Size | n = | 18,036
|
| Left size | n1 = | 866
|
| Right size | n2 = | 17,170
|
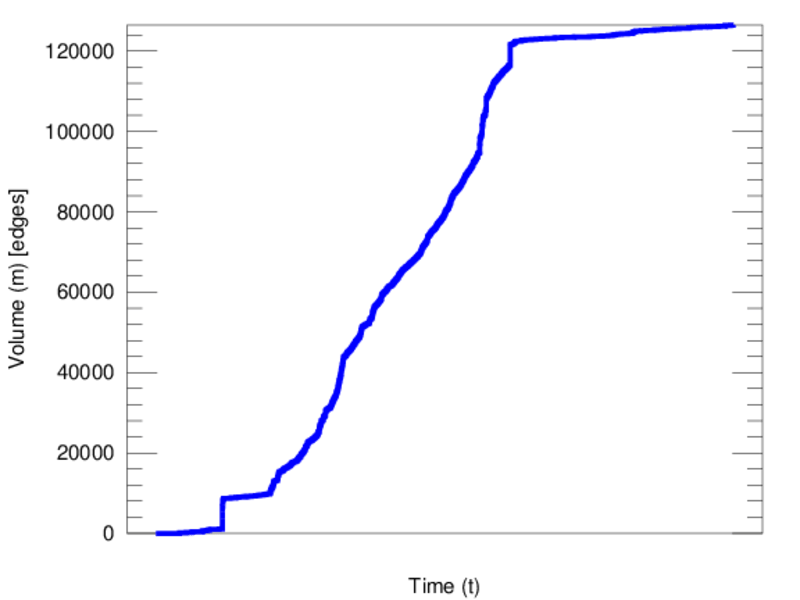
| Volume | m = | 126,492
|
| Unique edge count | m̿ = | 75,855
|
| Wedge count | s = | 175,777,552
|
| Claw count | z = | 479,237,908,968
|
| Cross count | x = | 1,174,353,853,204,264
|
| Square count | q = | 190,319,729
|
| 4-Tour count | T4 = | 2,225,886,066
|
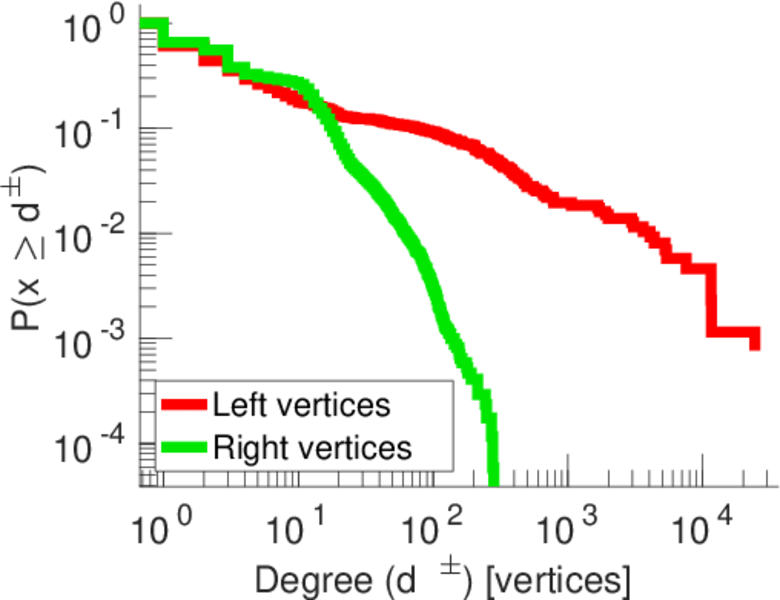
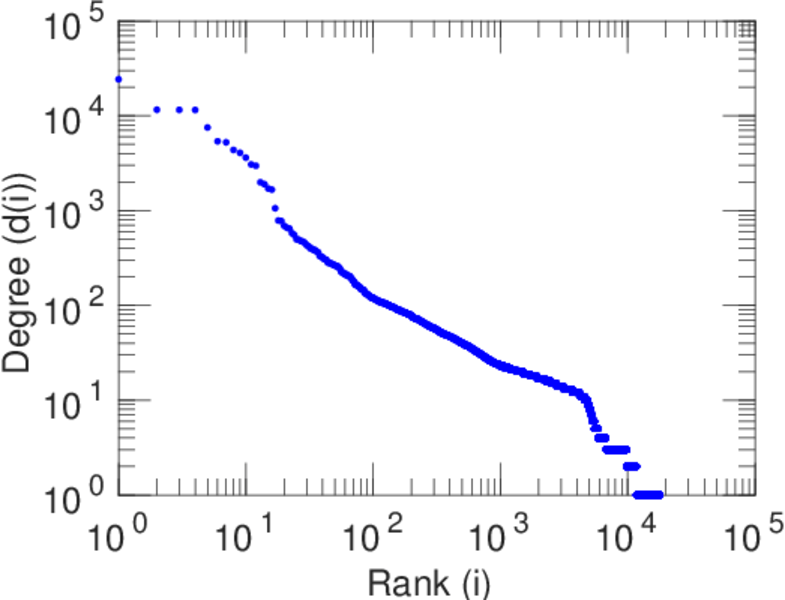
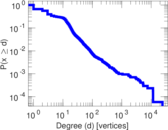
| Maximum degree | dmax = | 24,271
|
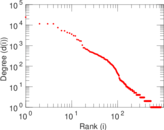
| Maximum left degree | d1max = | 24,271
|
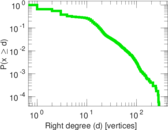
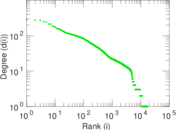
| Maximum right degree | d2max = | 282
|
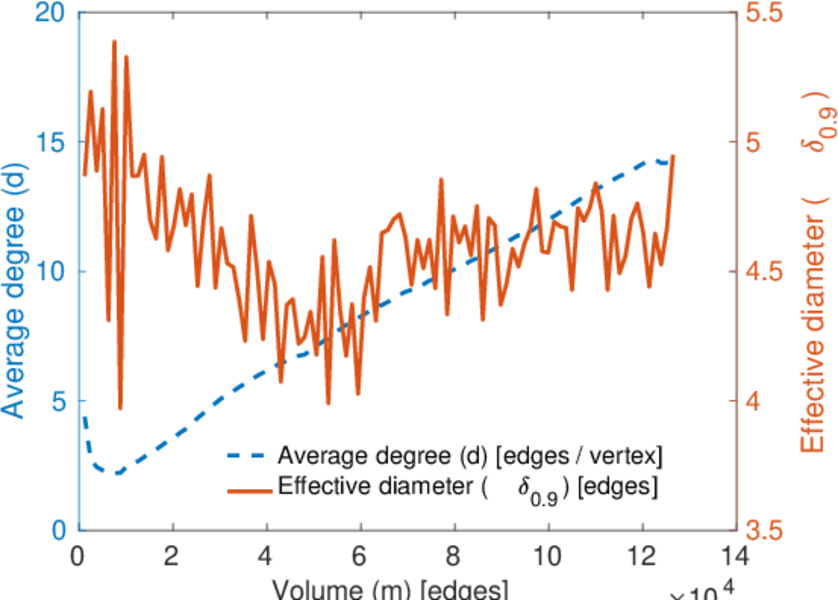
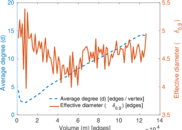
| Average degree | d = | 14.026 6
|
| Average left degree | d1 = | 146.065
|
| Average right degree | d2 = | 7.367 04
|
| Fill | p = | 0.005 101 48
|
| Average edge multiplicity | m̃ = | 1.667 55
|
| Size of LCC | N = | 17,463
|
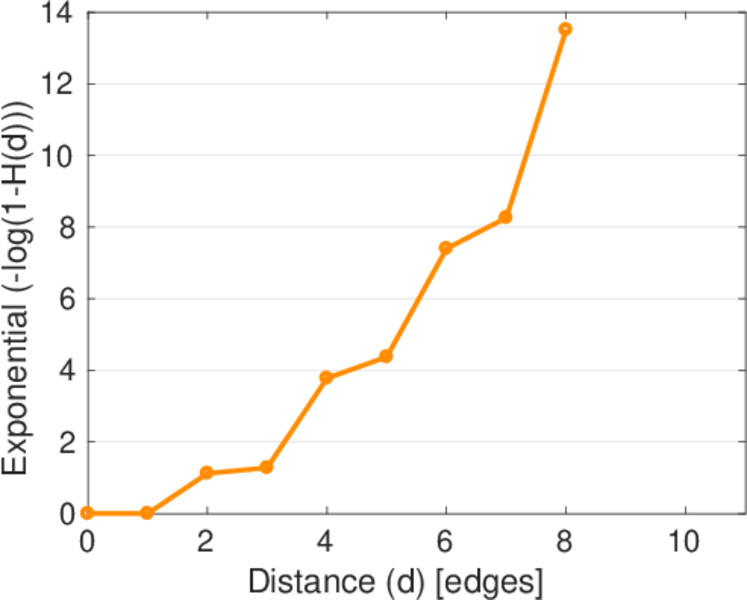
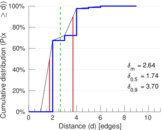
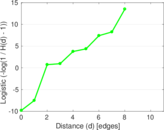
| Diameter | δ = | 11
|
| 50-Percentile effective diameter | δ0.5 = | 1.741 00
|
| 90-Percentile effective diameter | δ0.9 = | 3.697 89
|
| Median distance | δM = | 2
|
| Mean distance | δm = | 2.639 37
|
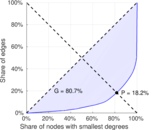
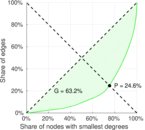
| Gini coefficient | G = | 0.807 557
|
| Balanced inequality ratio | P = | 0.182 964
|
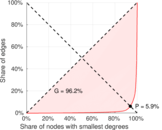
| Left balanced inequality ratio | P1 = | 0.059 181 6
|
| Right balanced inequality ratio | P2 = | 0.245 597
|
| Relative edge distribution entropy | Her = | 0.725 413
|
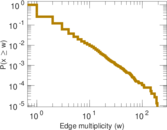
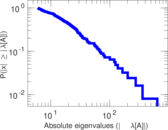
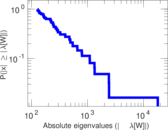
| Power law exponent | γ = | 2.022 73
|
| Tail power law exponent | γt = | 3.241 00
|
| Tail power law exponent with p | γ3 = | 3.241 00
|
| p-value | p = | 0.000 00
|
| Left tail power law exponent with p | γ3,1 = | 1.621 00
|
| Left p-value | p1 = | 0.000 00
|
| Right tail power law exponent with p | γ3,2 = | 4.871 00
|
| Right p-value | p2 = | 0.034 000 0
|
| Degree assortativity | ρ = | −0.483 502
|
| Degree assortativity p-value | pρ = | 0.000 00
|
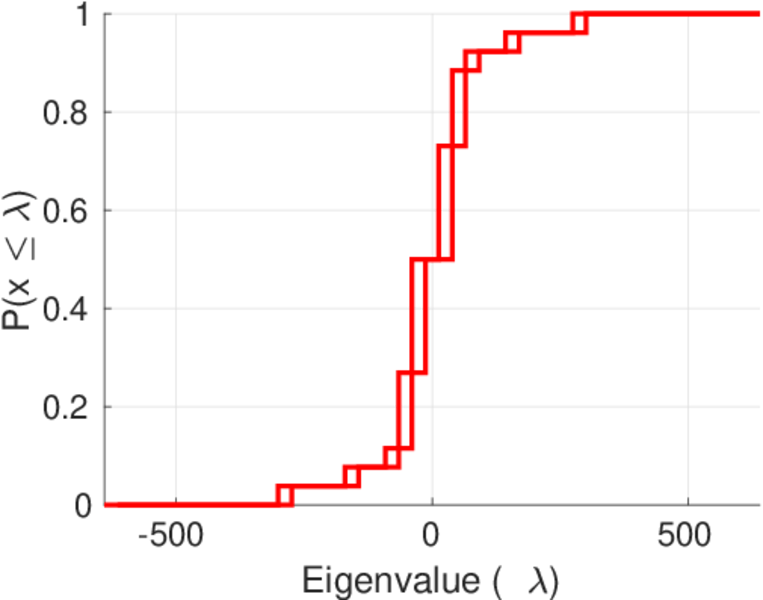
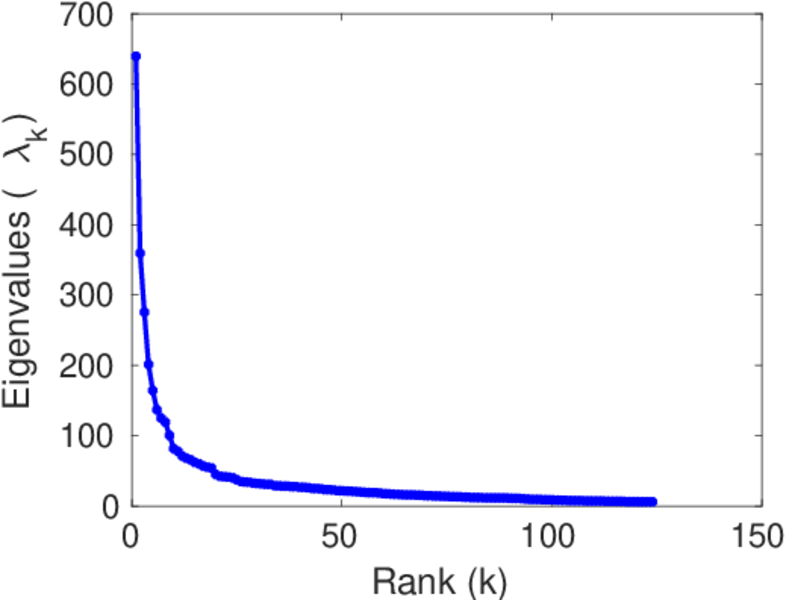
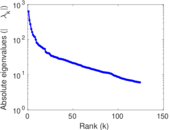
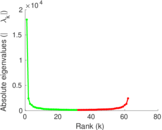
| Spectral norm | α = | 639.348
|
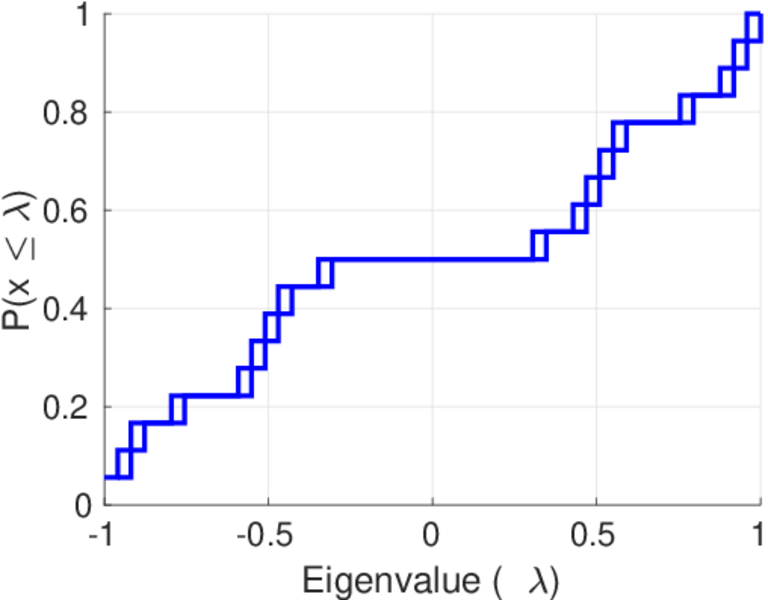
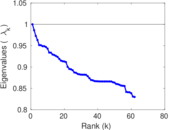
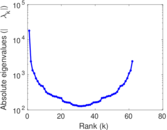
| Algebraic connectivity | a = | 0.029 331 2
|
| Spectral separation | |λ1[A] / λ2[A]| = | 1.778 79
|
| Controllability | C = | 16,254
|
| Relative controllability | Cr = | 0.907 740
|
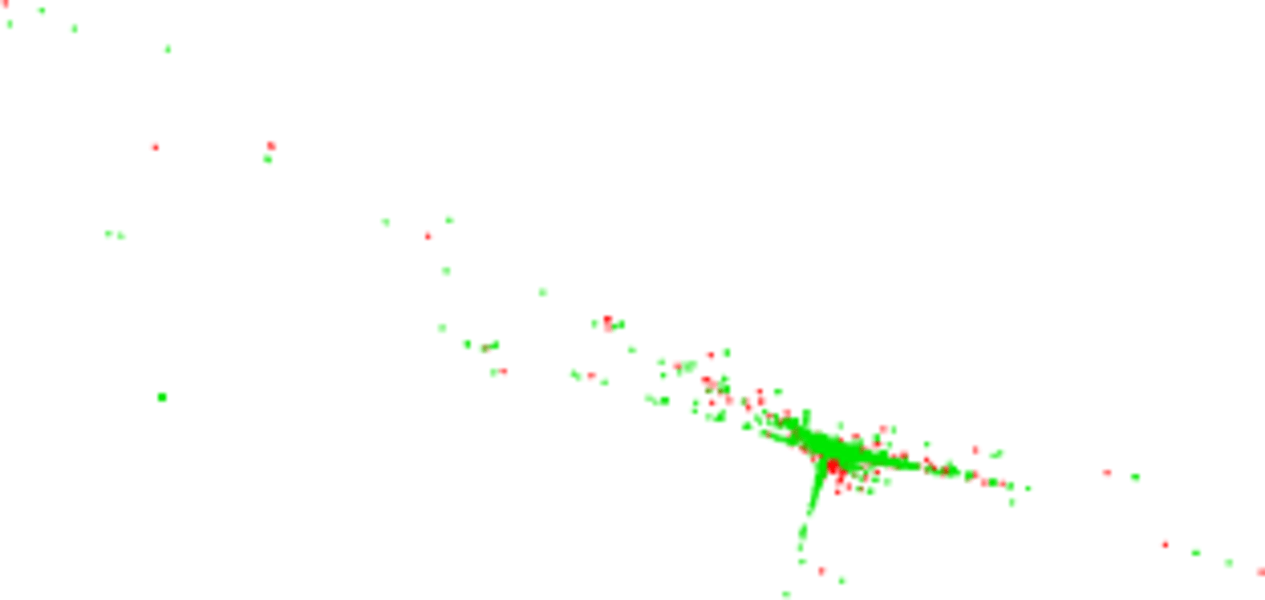
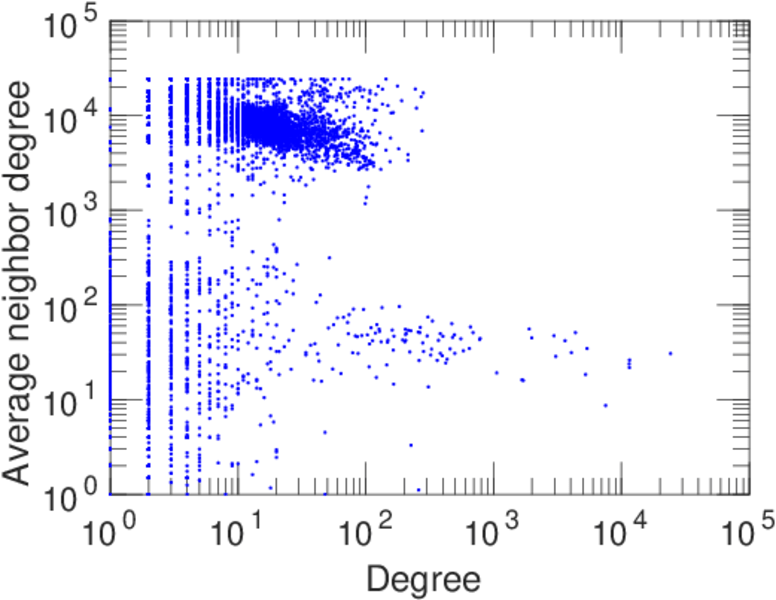
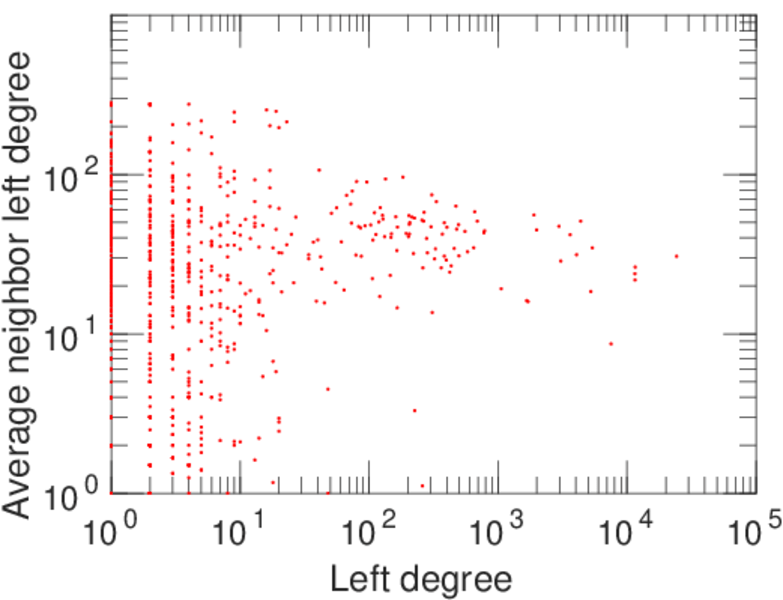
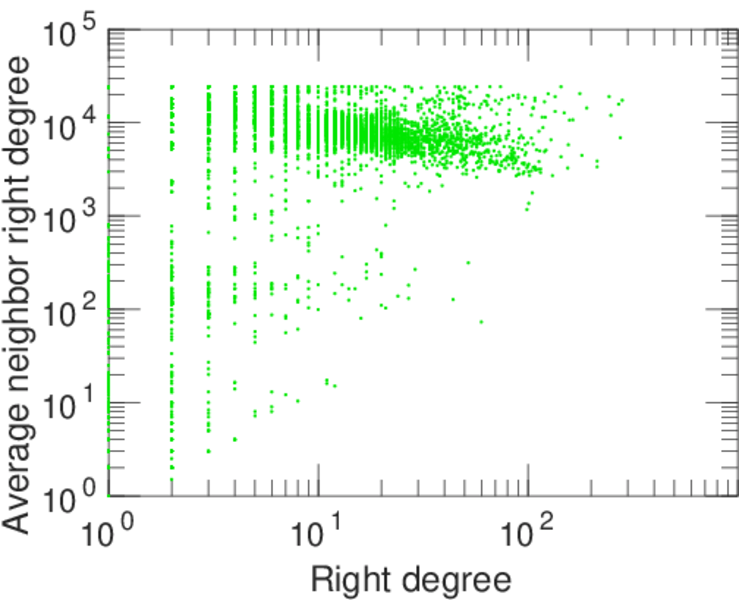
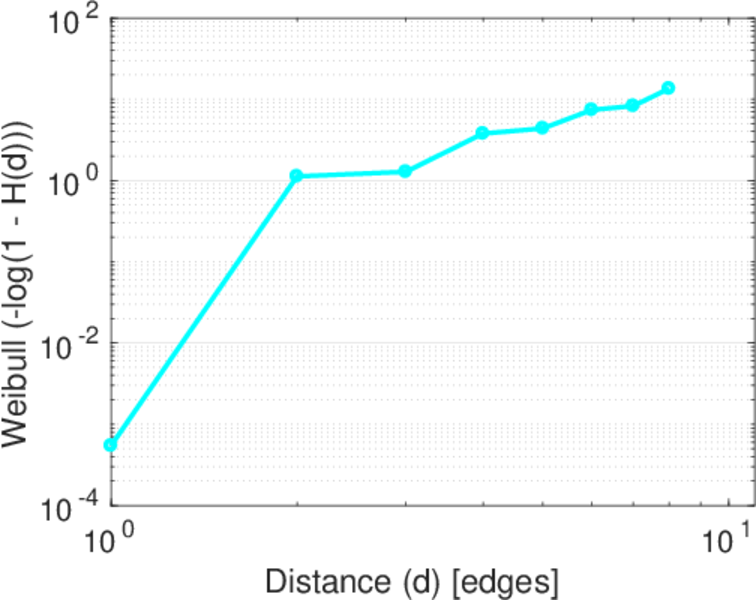
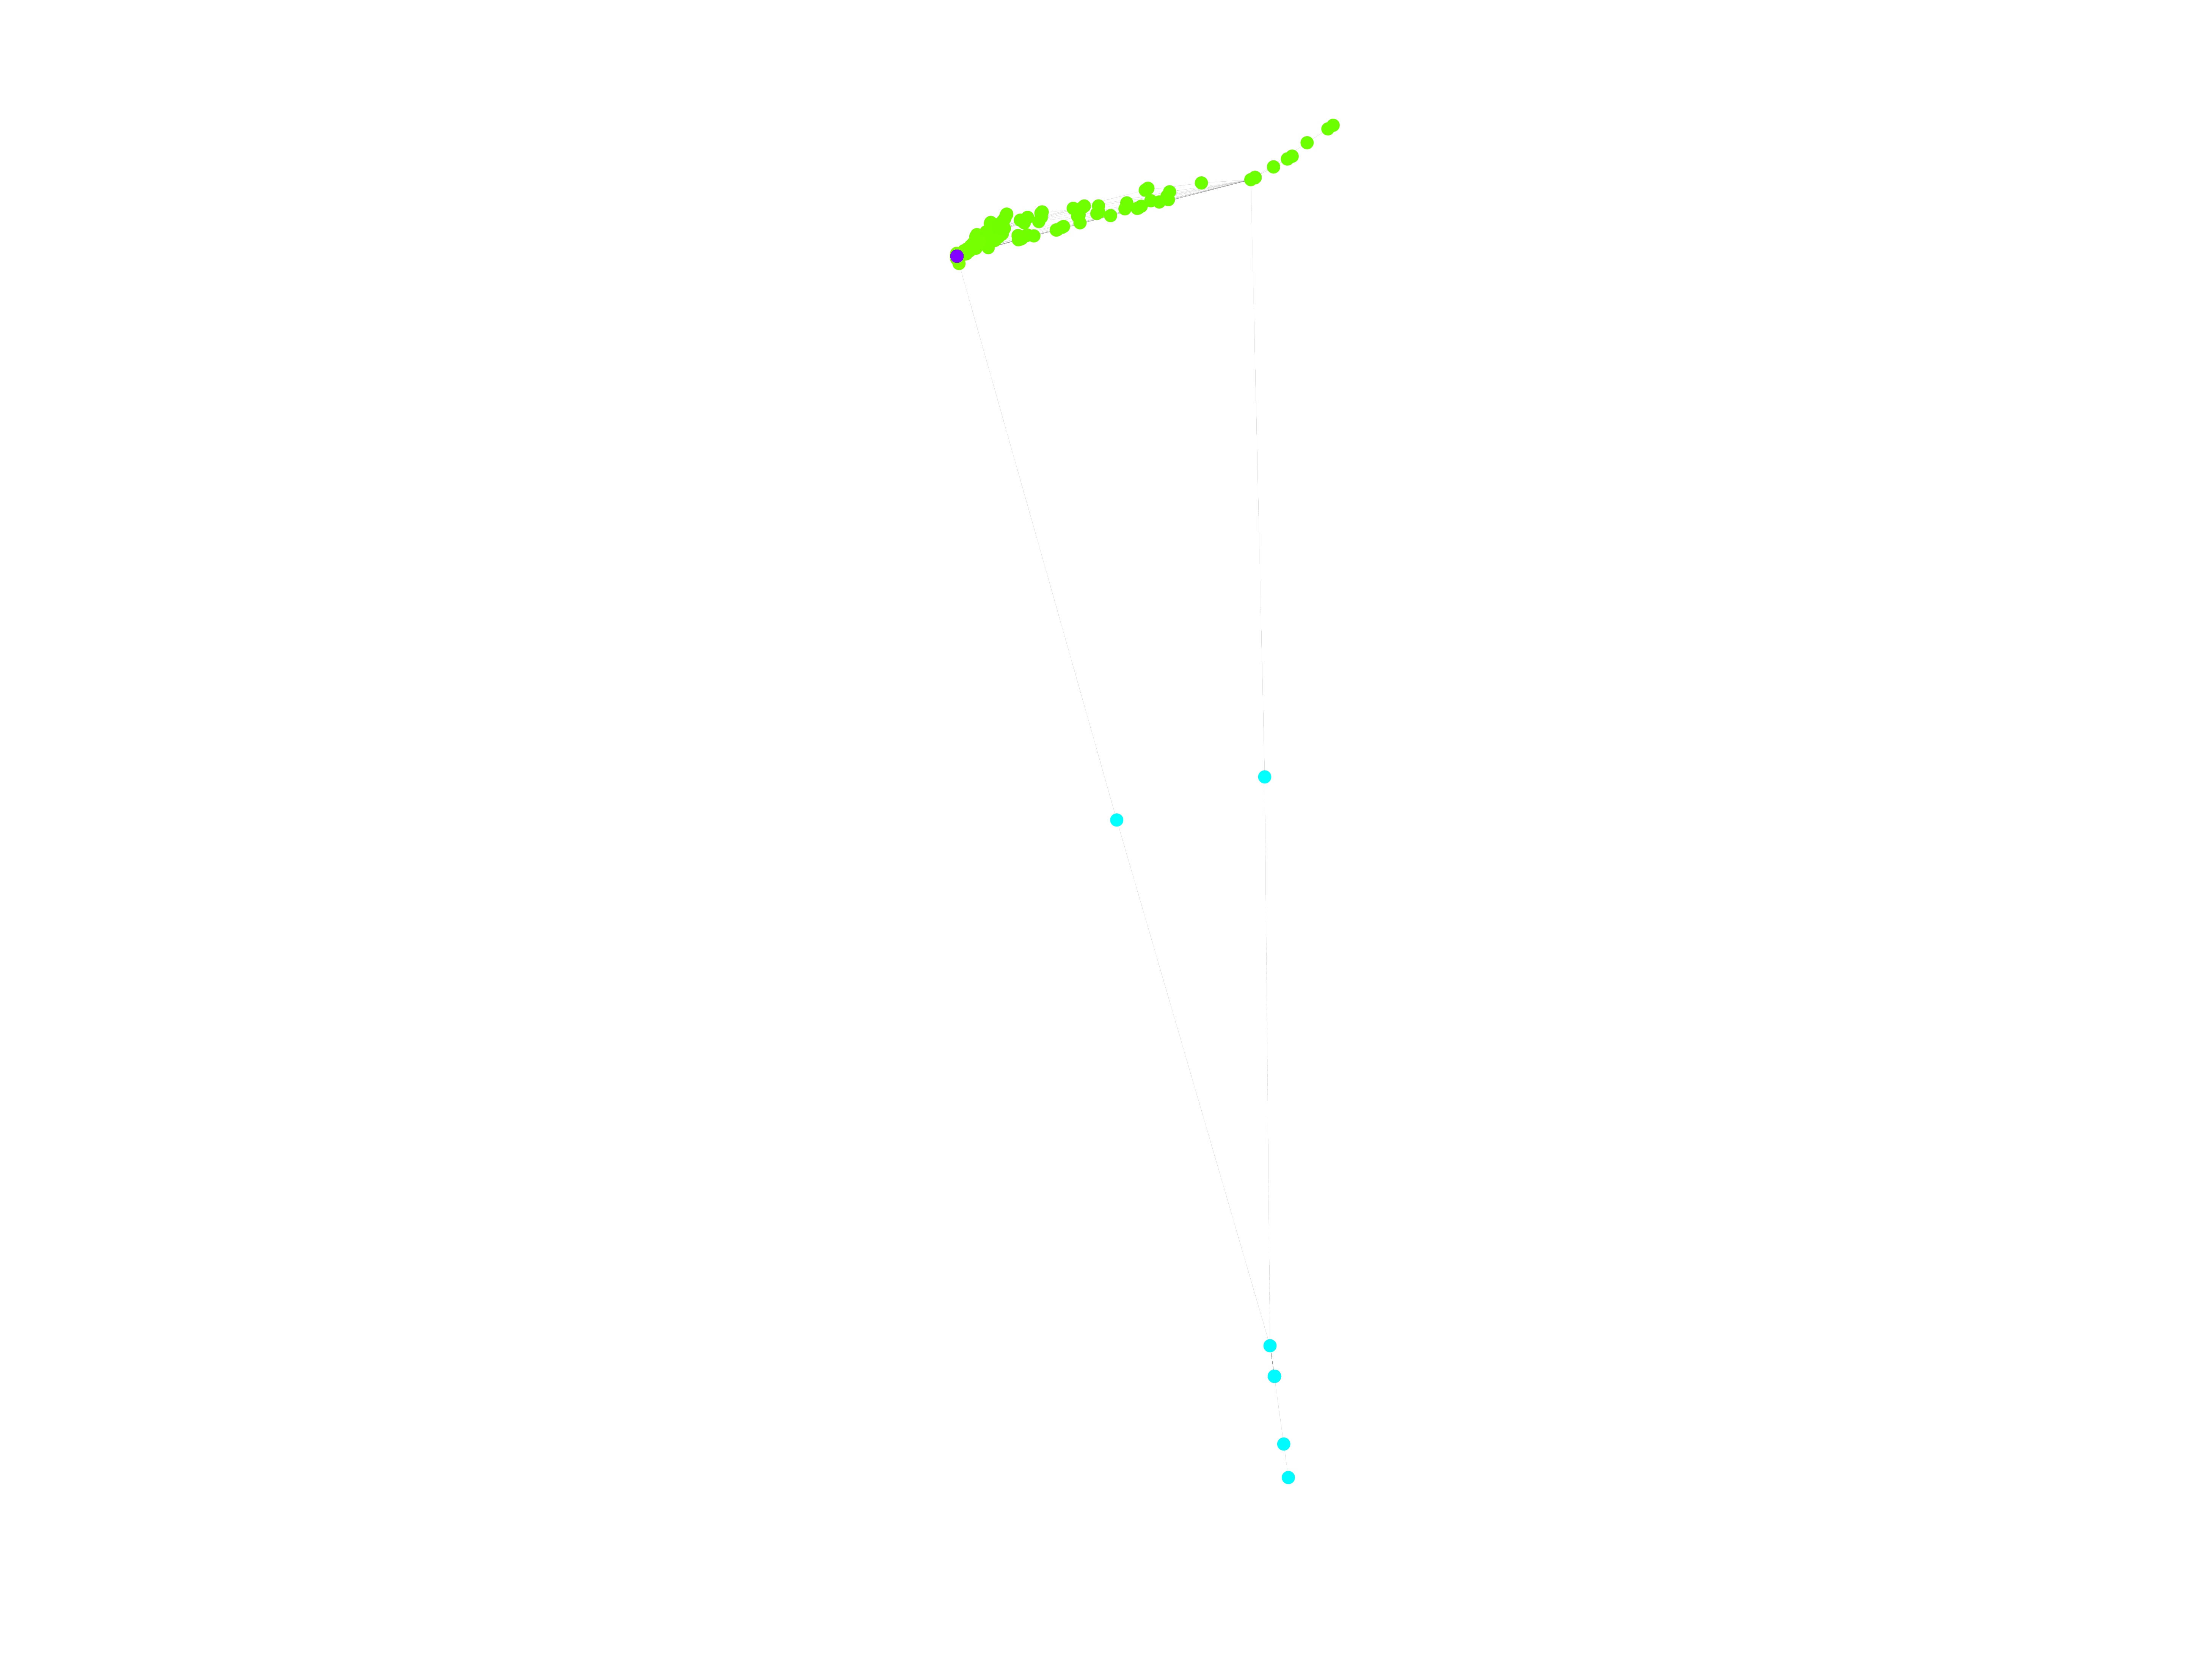
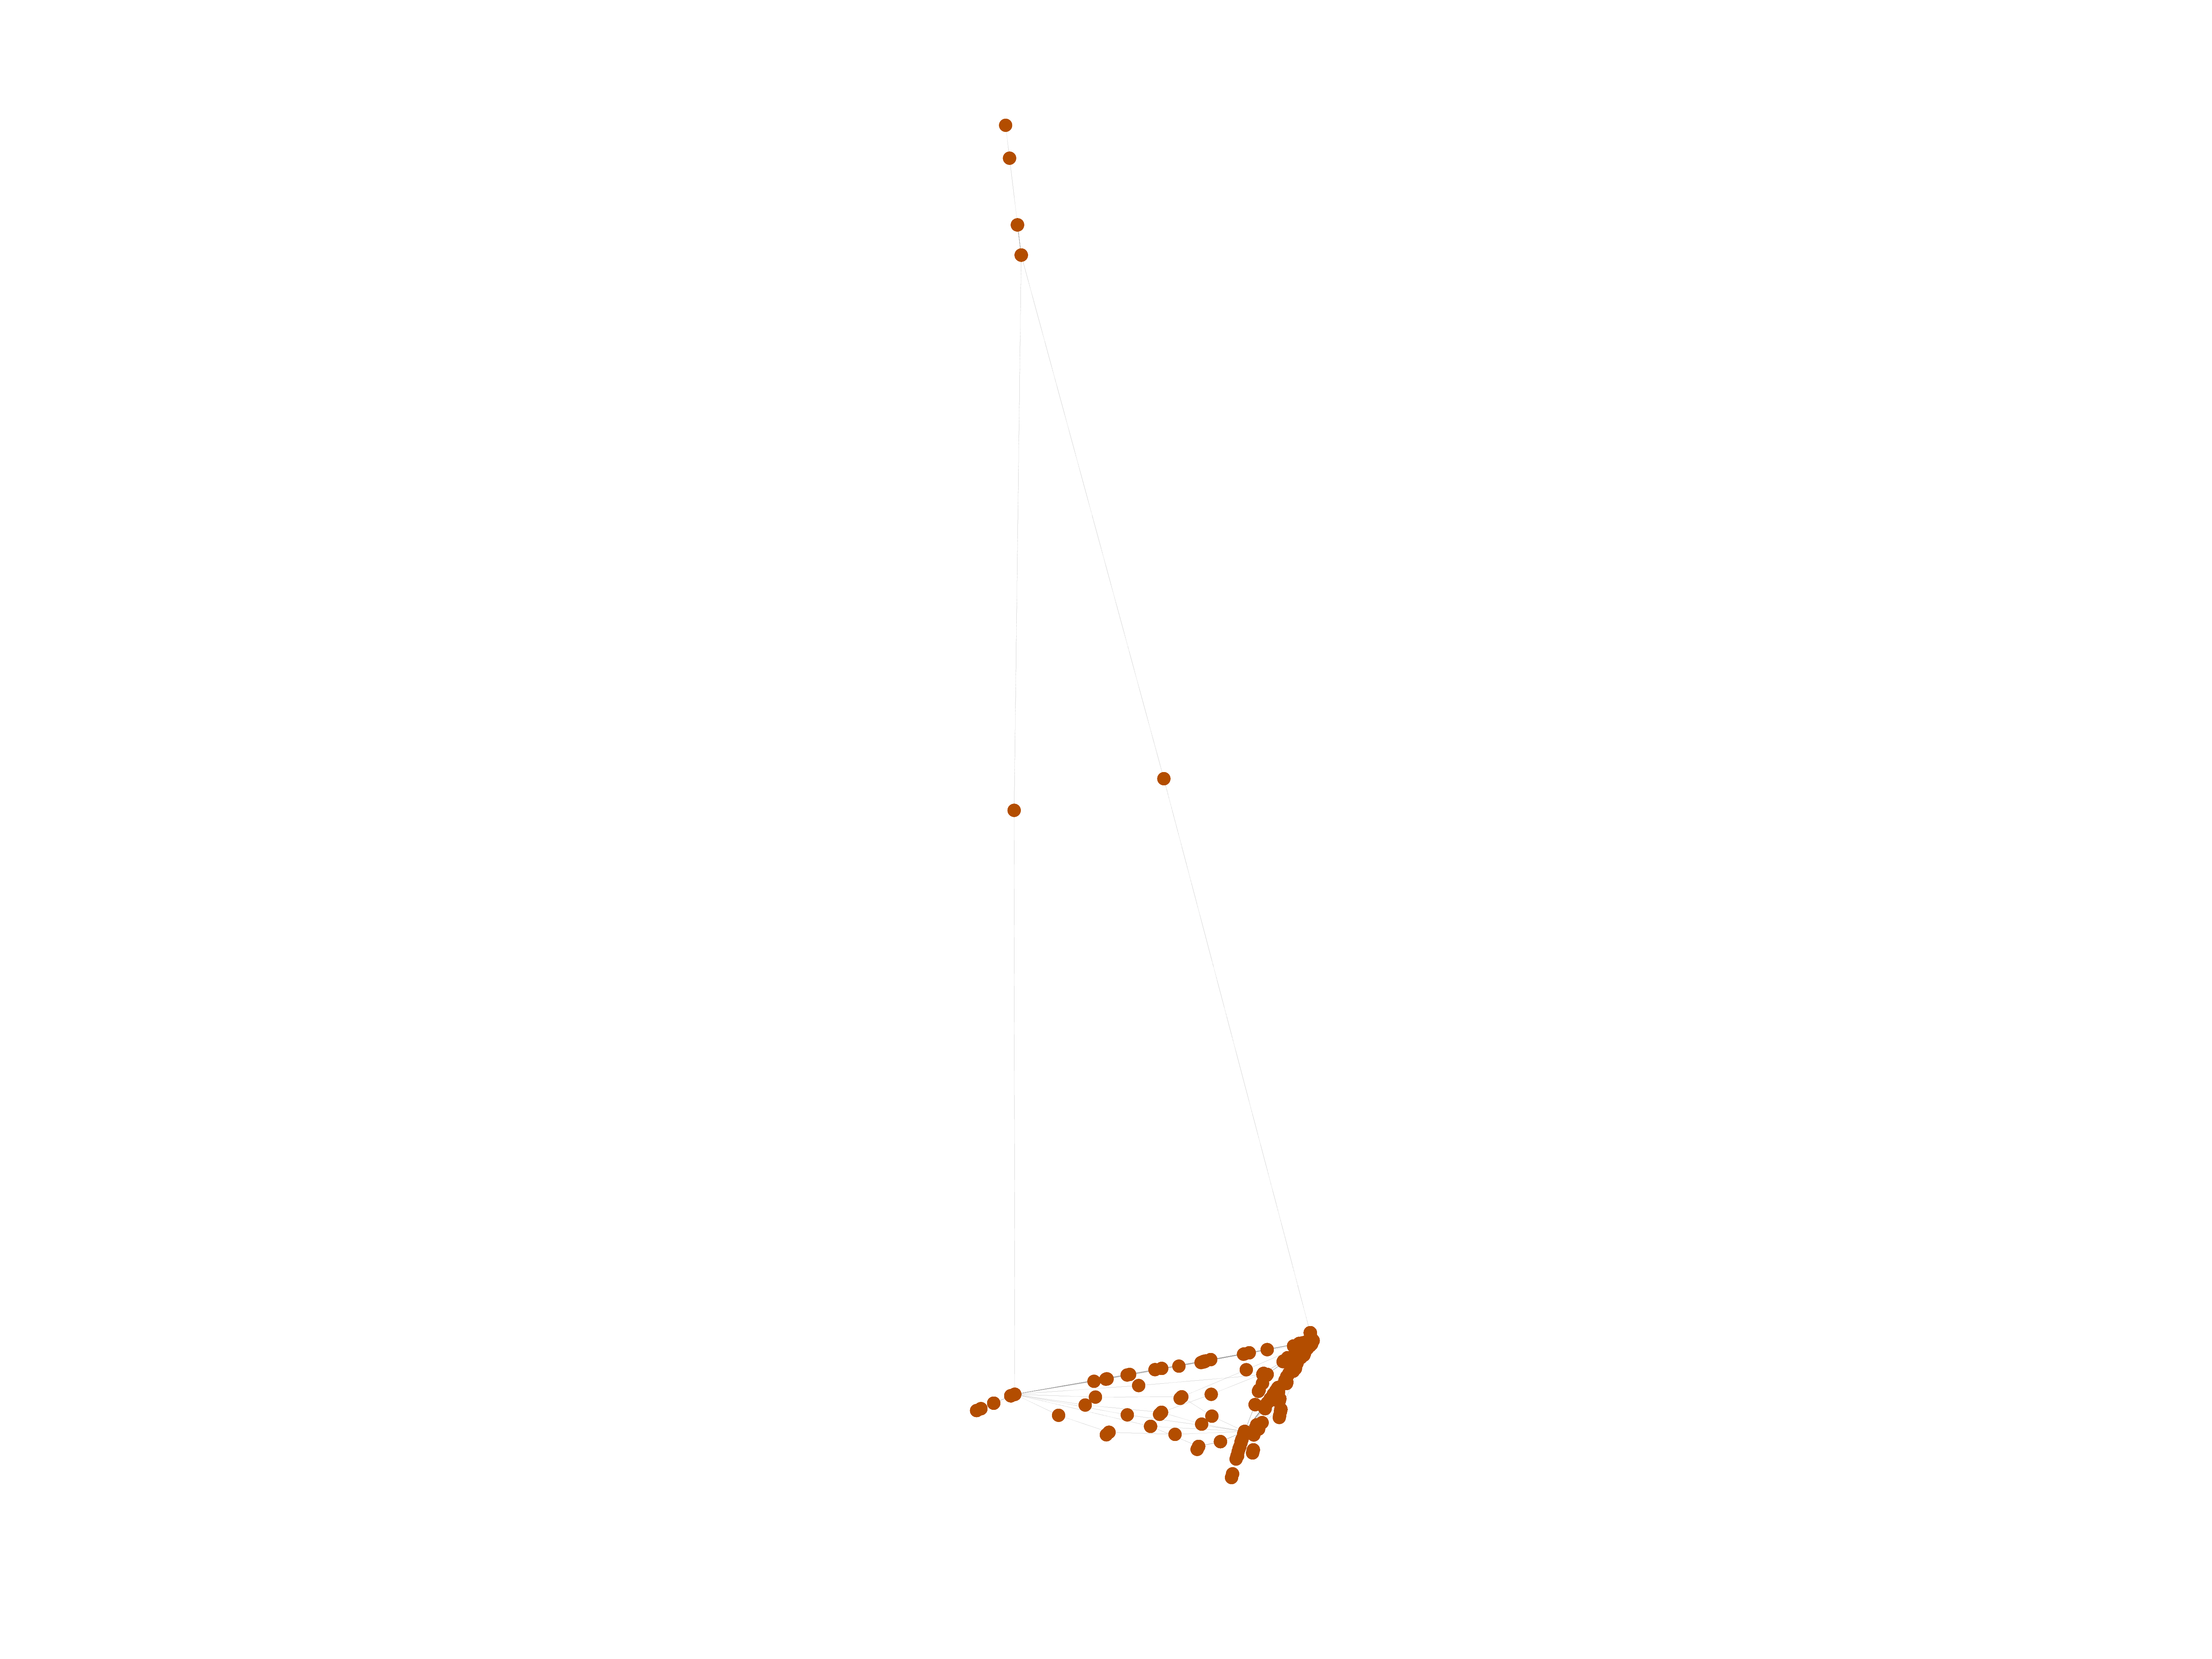
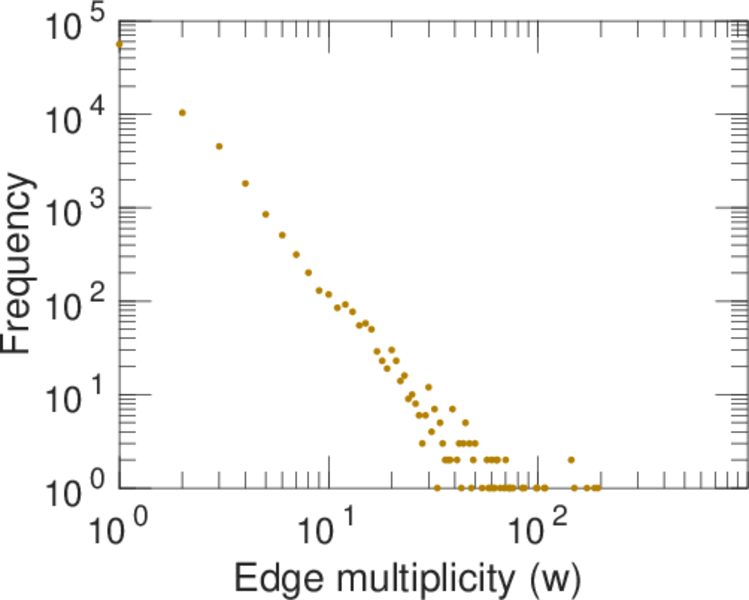
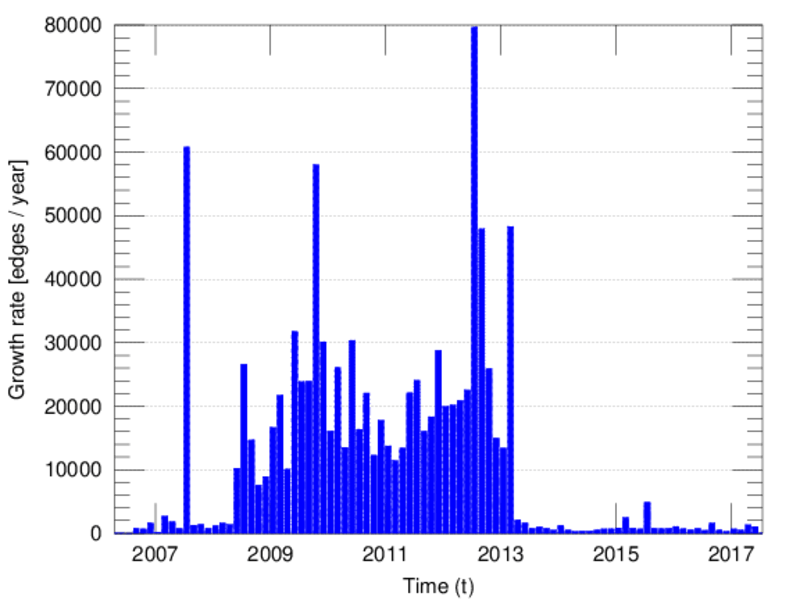
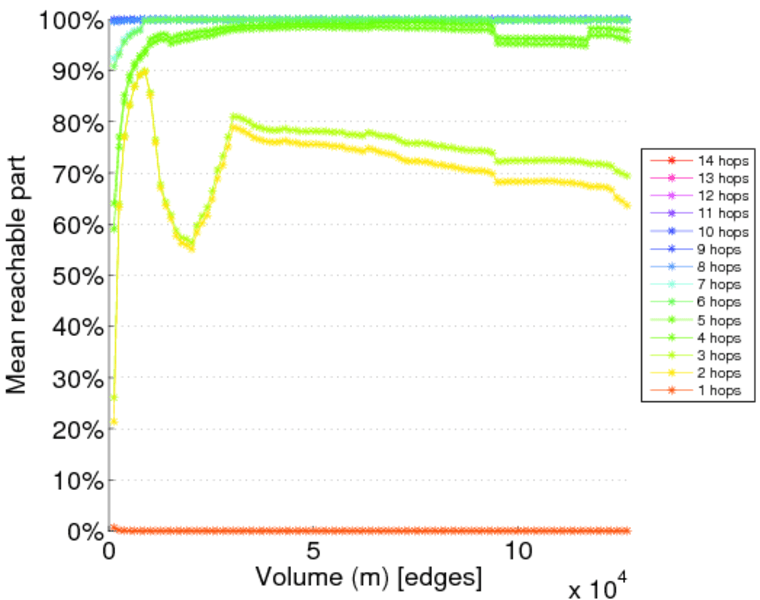
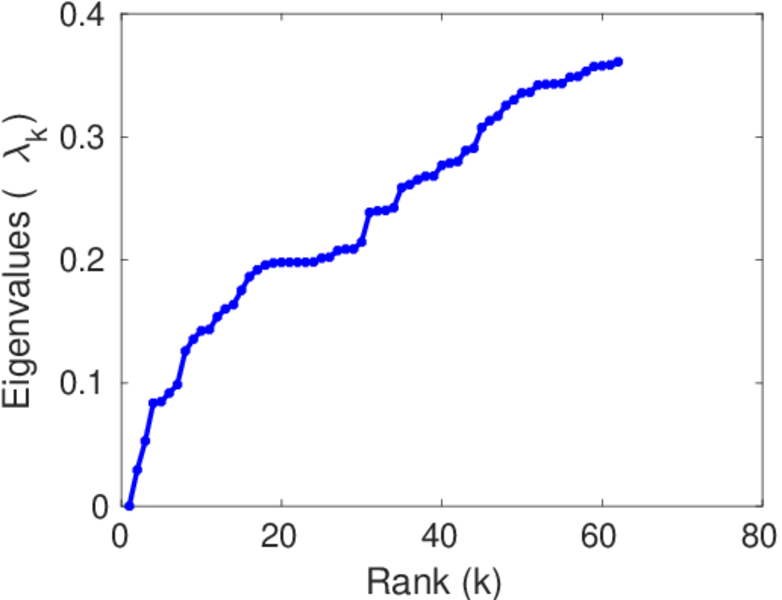
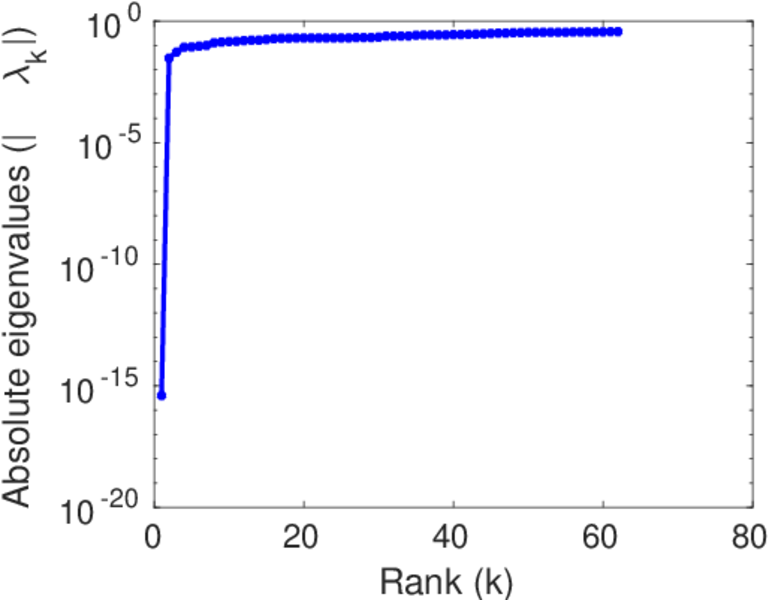
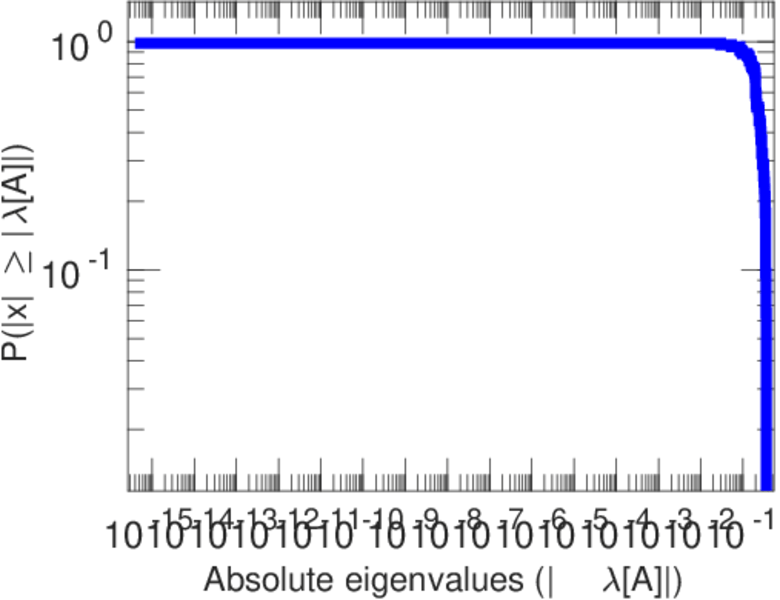
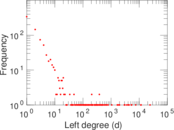
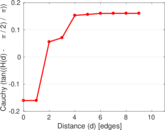
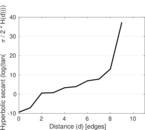
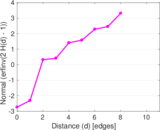
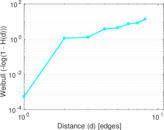
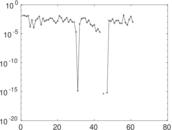
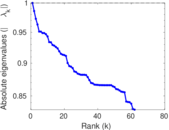
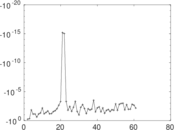
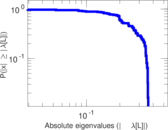
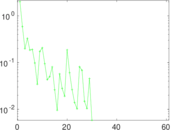
Plots


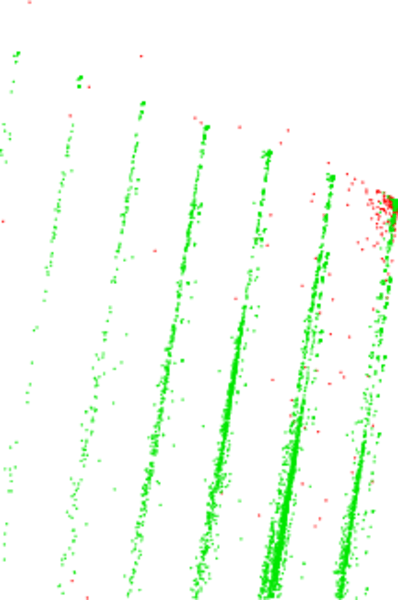
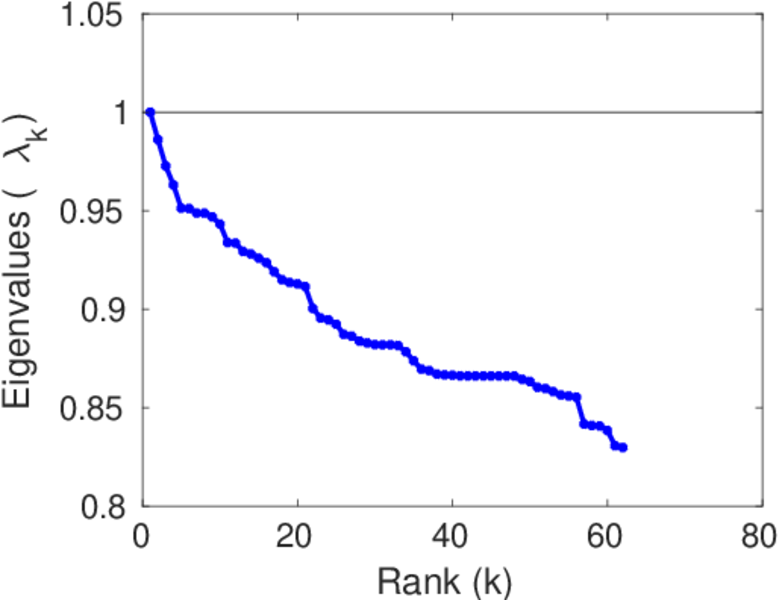
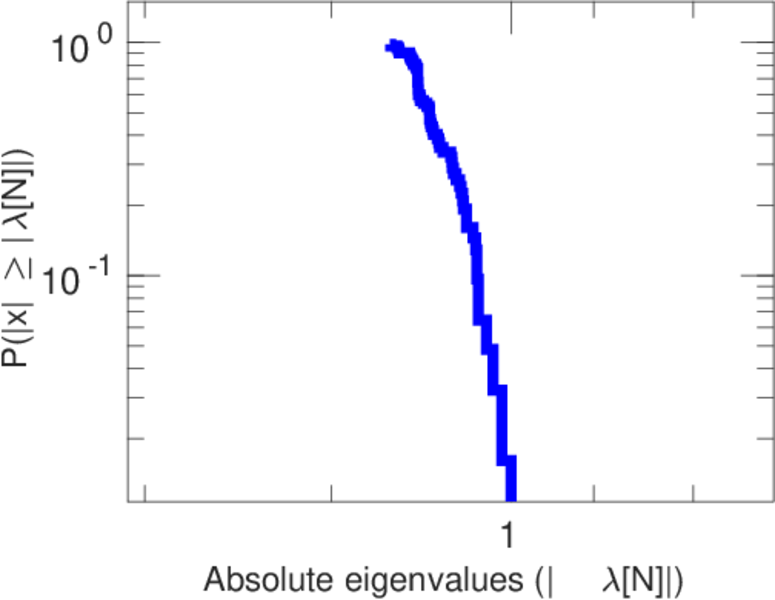
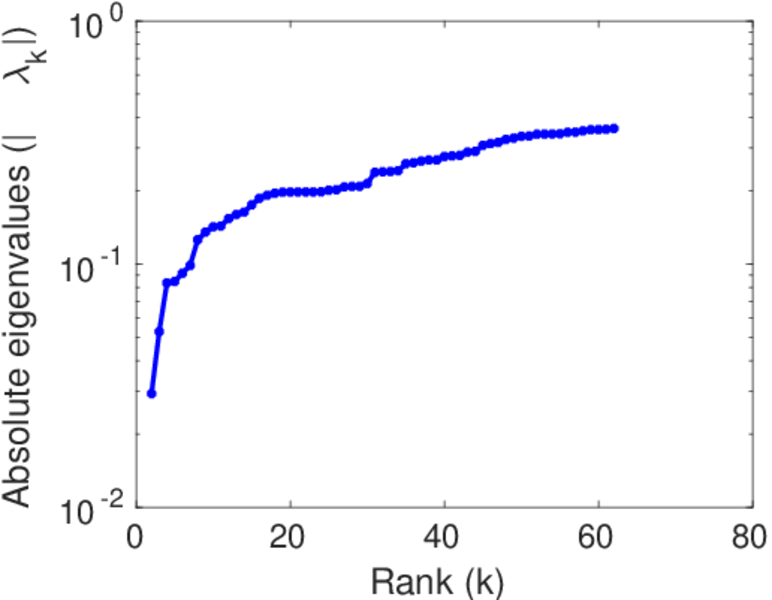
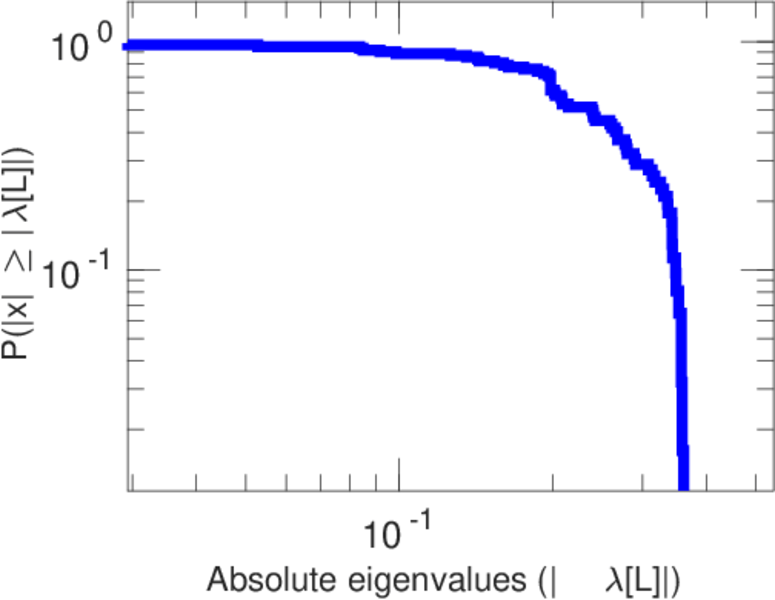
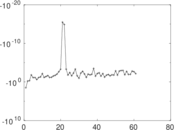
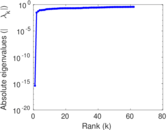
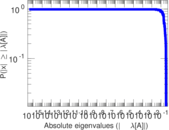
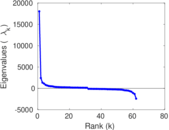
Matrix decompositions plots


Downloads
References
|
[1]
|
Jérôme Kunegis.
KONECT – The Koblenz Network Collection.
In Proc. Int. Conf. on World Wide Web Companion, pages
1343–1350, 2013.
[ http ]
|
|
[2]
|
Wikimedia Foundation.
Wikimedia downloads.
http://dumps.wikimedia.org/, January 2010.
|
 KONECT ‣ Networks ‣
Buy Me a Coffee
KONECT ‣ Networks ‣
Buy Me a Coffee