Wikipedia edits (ro)
This is the bipartite edit network of the Romanian Wikipedia. It contains users
and pages from the Romanian Wikipedia, connected by edit events. Each edge
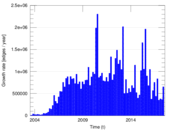
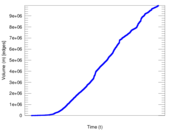
represents an edit. The dataset includes the timestamp of each edit.
Metadata
Statistics
| Size | n = | 1,798,416
|
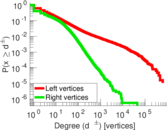
| Left size | n1 = | 62,243
|
| Right size | n2 = | 1,736,173
|
| Volume | m = | 9,945,745
|
| Unique edge count | m̿ = | 5,707,625
|
| Wedge count | s = | 343,829,904,019
|
| Claw count | z = | 31,245,434,826,988,400
|
| Cross count | x = | 2.596 14 × 1021
|
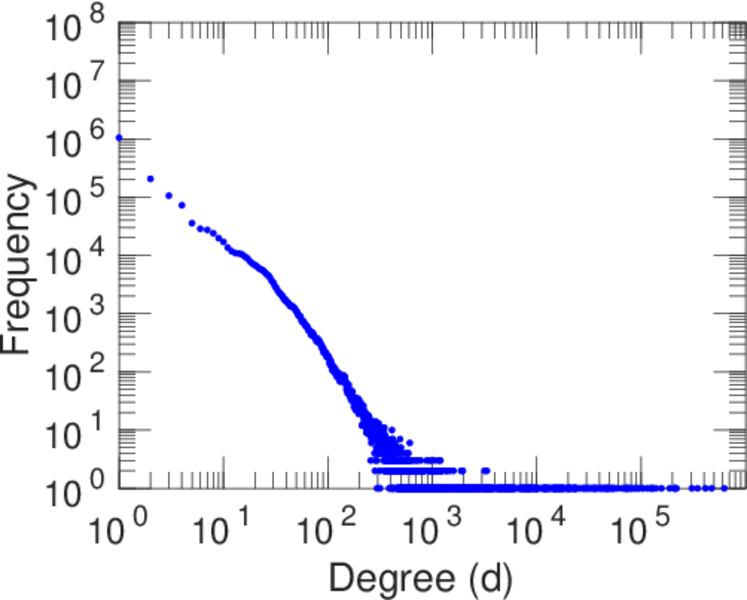
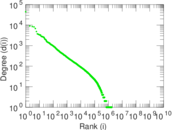
| Maximum degree | dmax = | 626,575
|
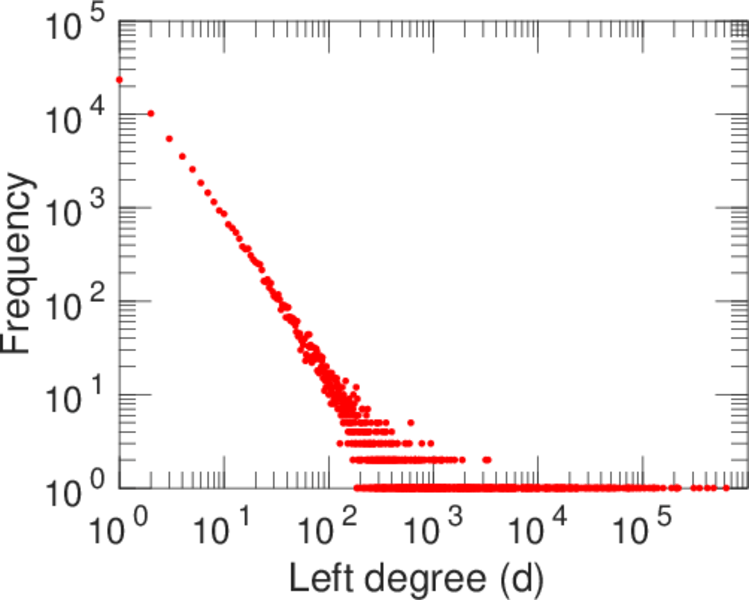
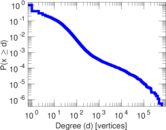
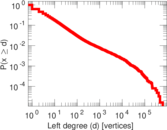
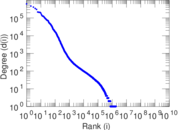
| Maximum left degree | d1max = | 626,575
|
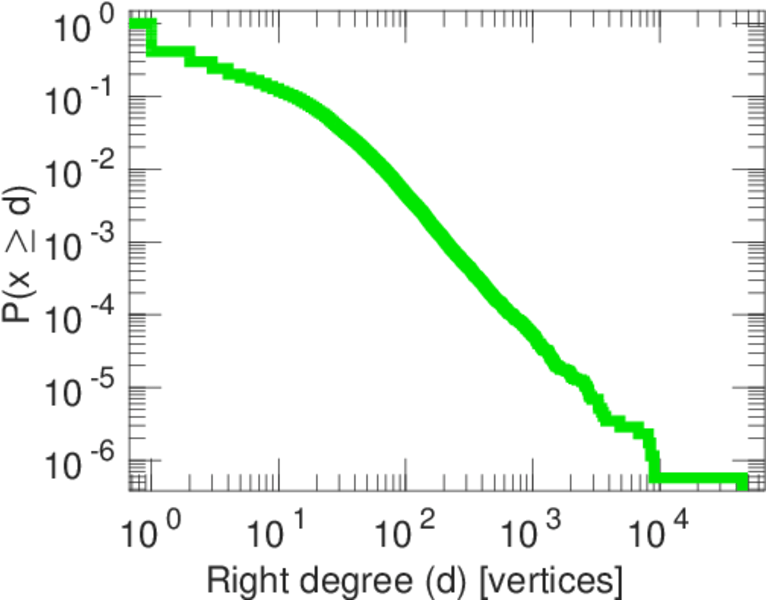
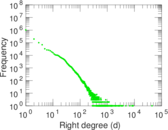
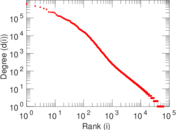
| Maximum right degree | d2max = | 44,553
|
| Average degree | d = | 11.060 6
|
| Average left degree | d1 = | 159.789
|
| Average right degree | d2 = | 5.728 54
|
| Fill | p = | 5.281 68 × 10−5
|
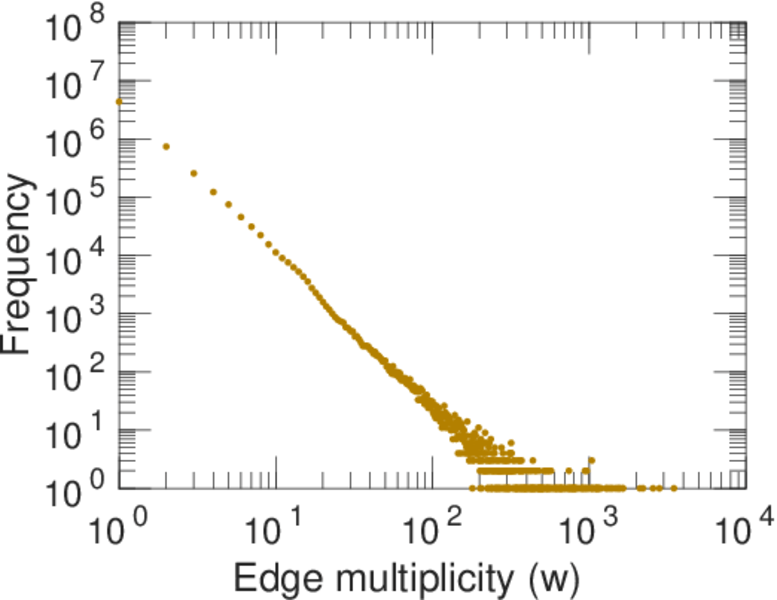
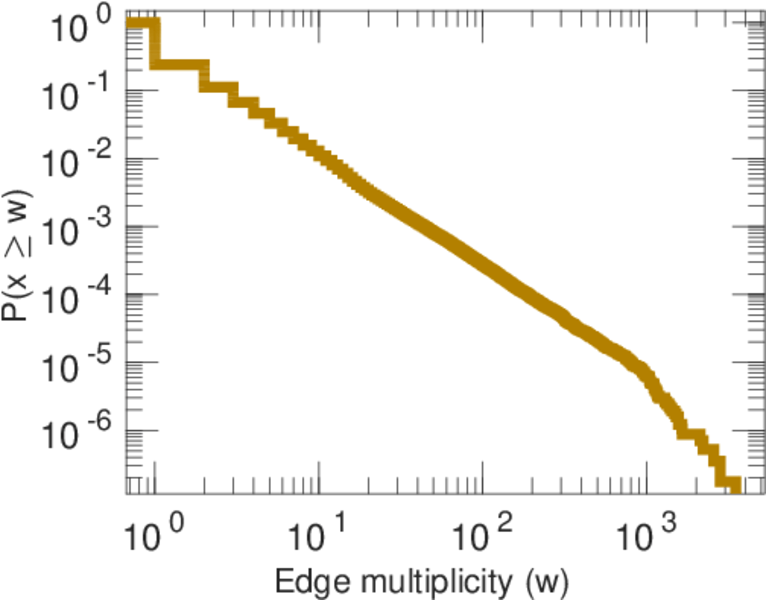
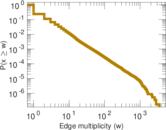
| Average edge multiplicity | m̃ = | 1.742 54
|
| Size of LCC | N = | 1,786,827
|
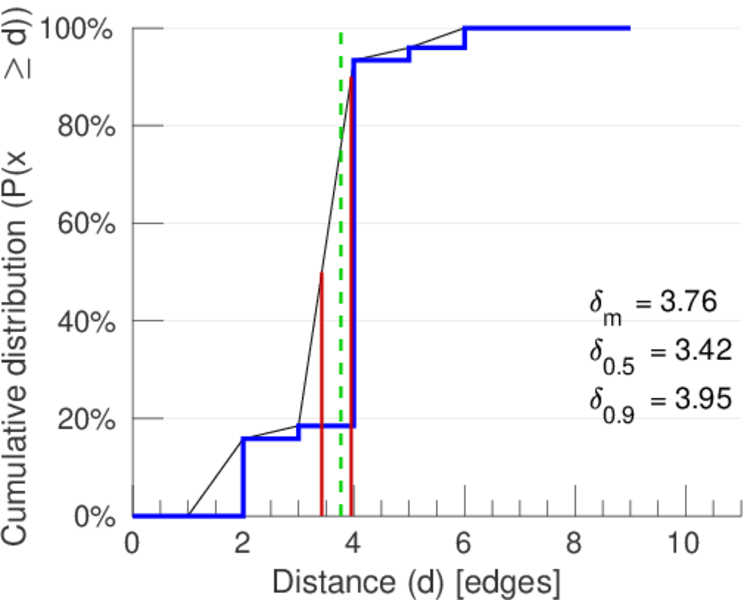
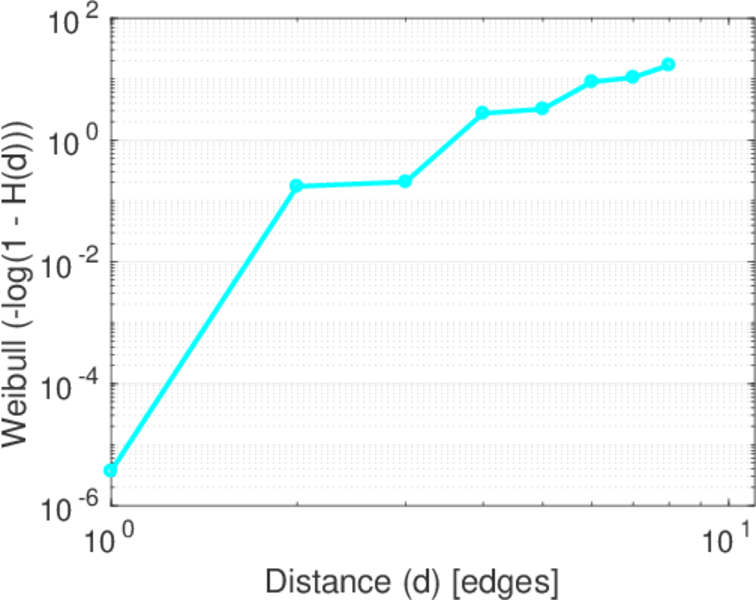
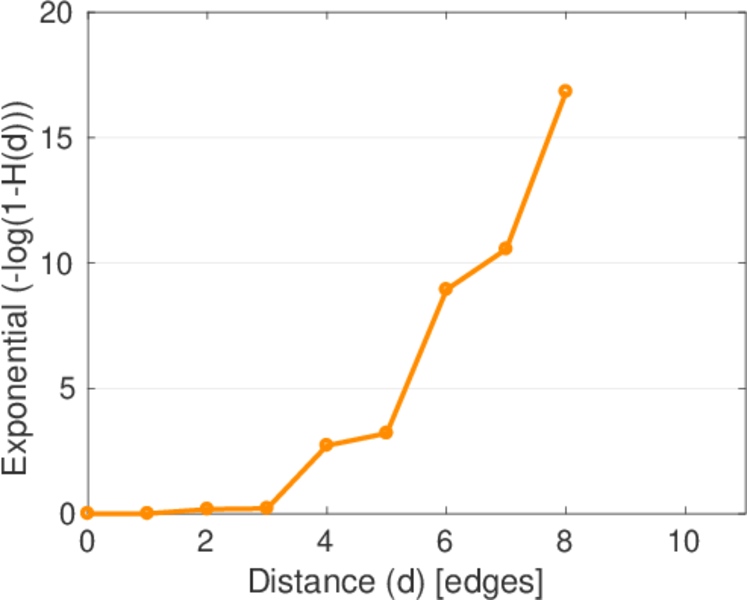
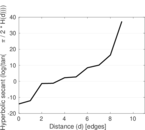
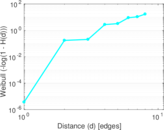
| Diameter | δ = | 11
|
| 50-Percentile effective diameter | δ0.5 = | 3.420 95
|
| 90-Percentile effective diameter | δ0.9 = | 3.954 90
|
| Median distance | δM = | 4
|
| Mean distance | δm = | 3.764 18
|
| Gini coefficient | G = | 0.858 217
|
| Balanced inequality ratio | P = | 0.135 218
|
| Left balanced inequality ratio | P1 = | 0.034 482 6
|
| Right balanced inequality ratio | P2 = | 0.199 941
|
| Relative edge distribution entropy | Her = | 0.695 481
|
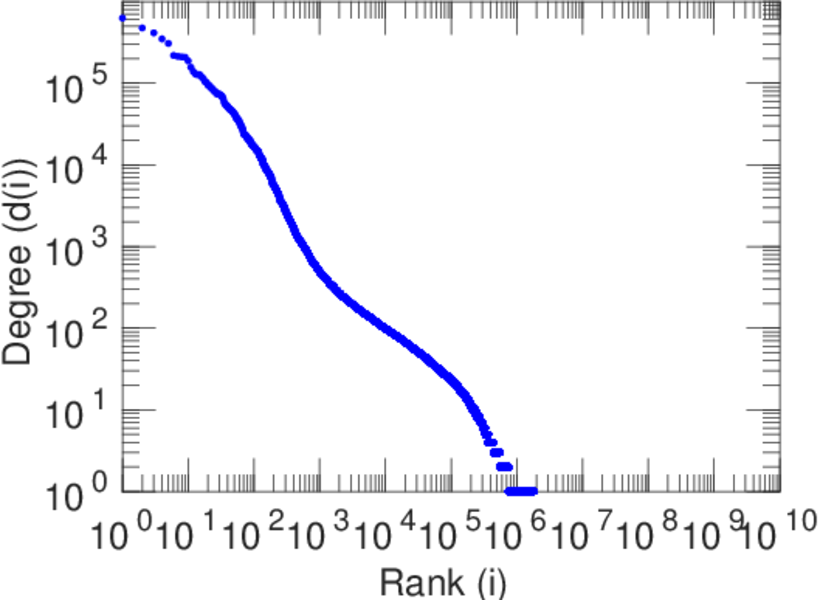
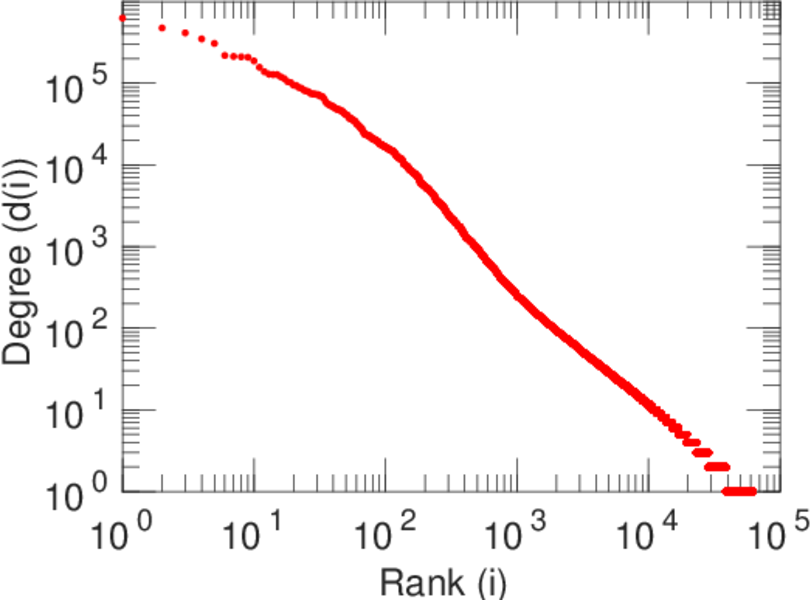
| Power law exponent | γ = | 2.736 15
|
| Tail power law exponent | γt = | 2.981 00
|
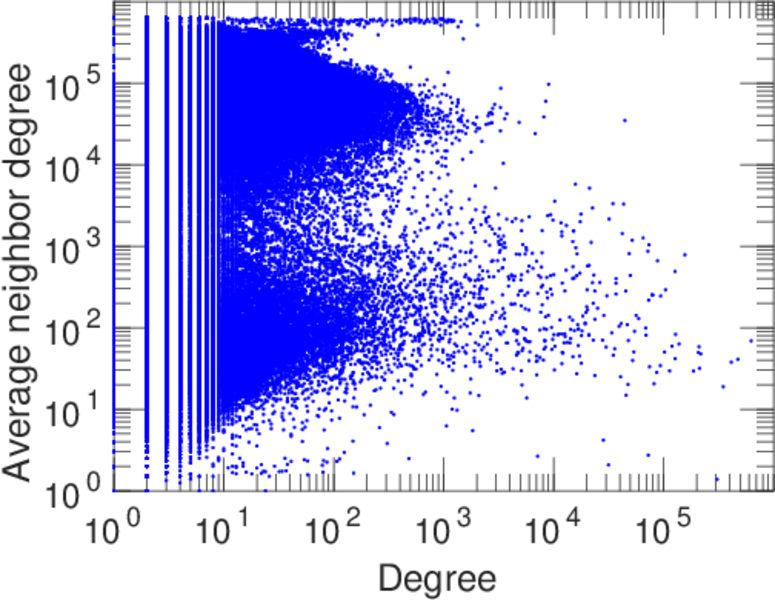
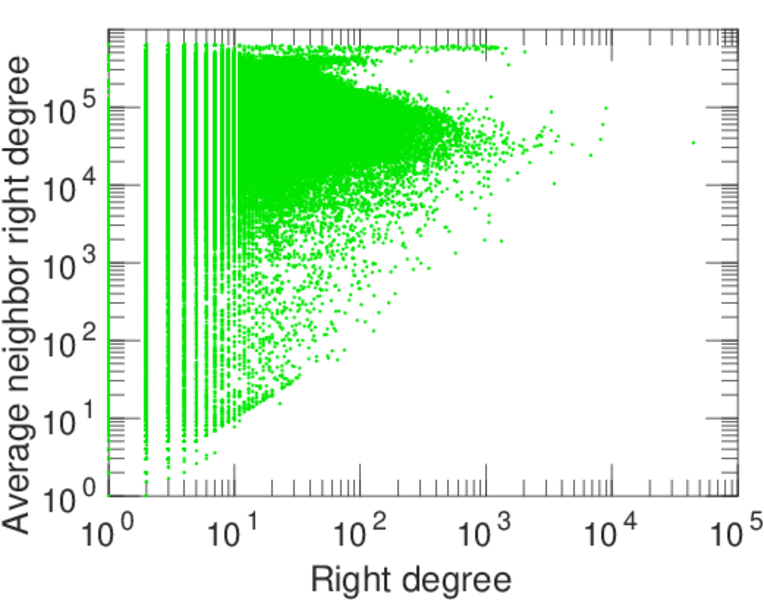
| Degree assortativity | ρ = | −0.135 375
|
| Degree assortativity p-value | pρ = | 0.000 00
|
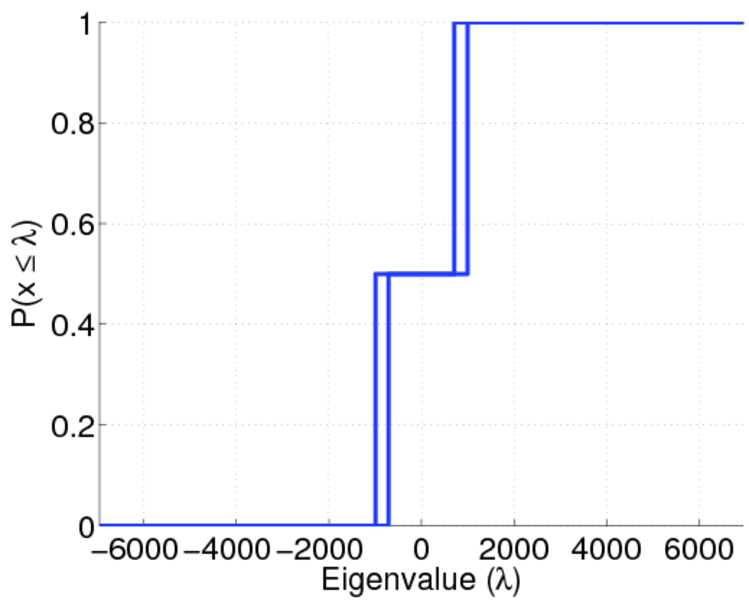
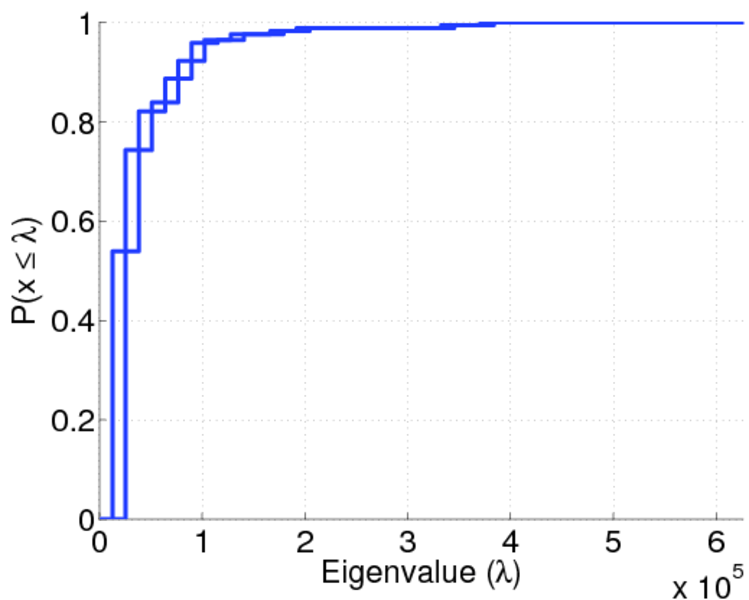
| Spectral norm | α = | 6,960.44
|
| Spectral separation | |λ1[A] / λ2[A]| = | 1.277 62
|
| Controllability | C = | 1,698,024
|
| Relative controllability | Cr = | 0.946 359
|
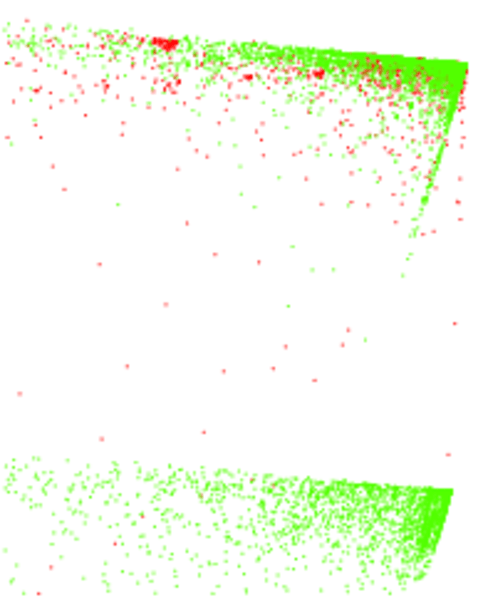
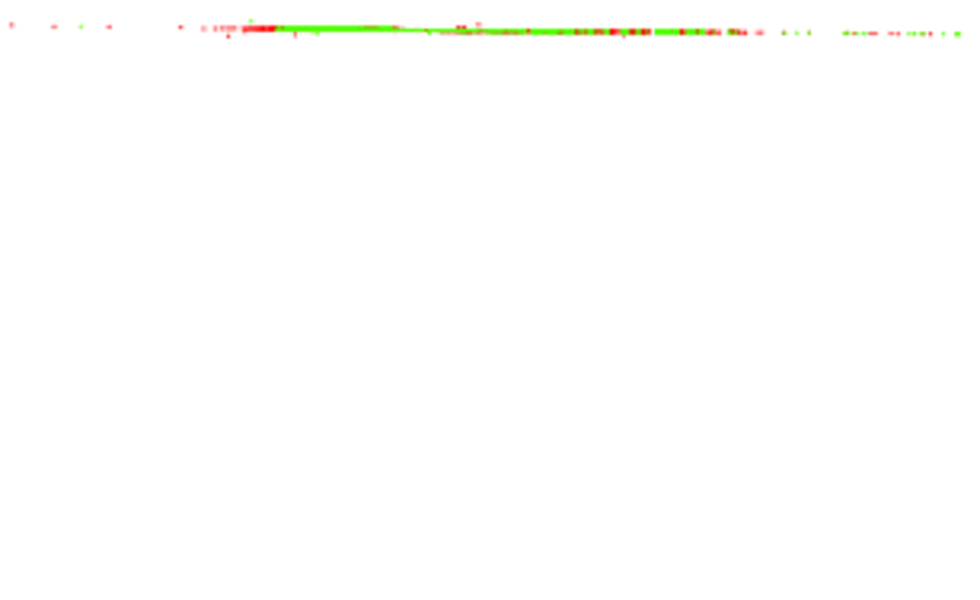
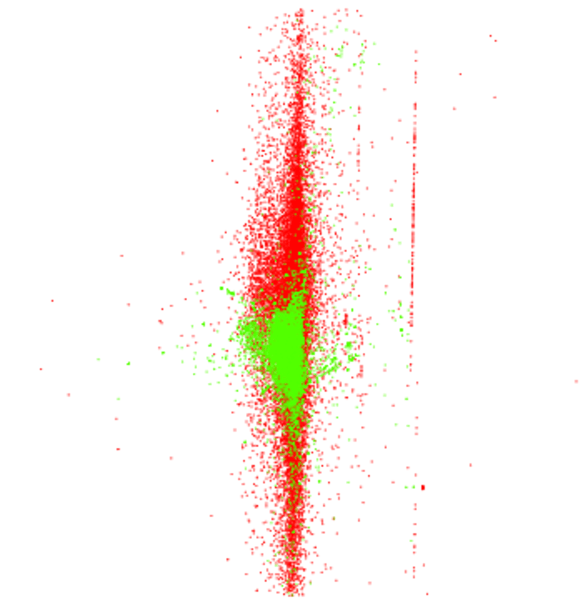
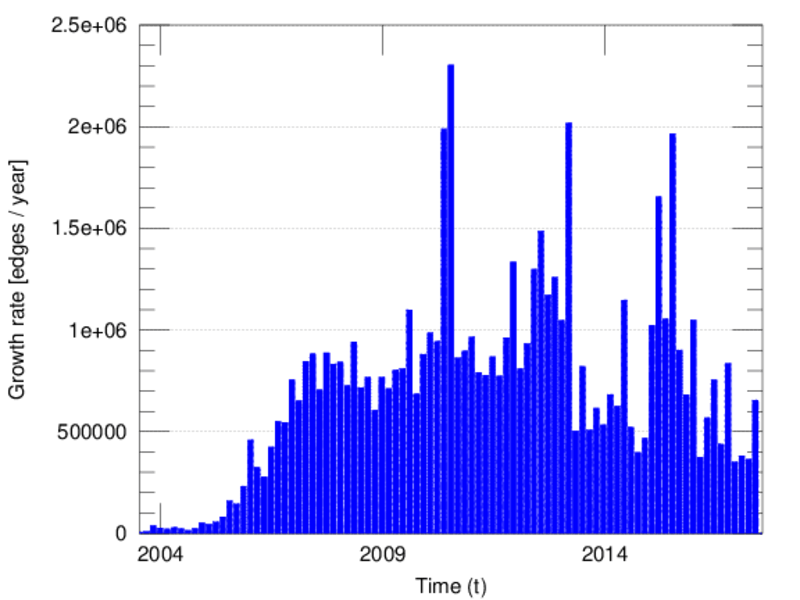
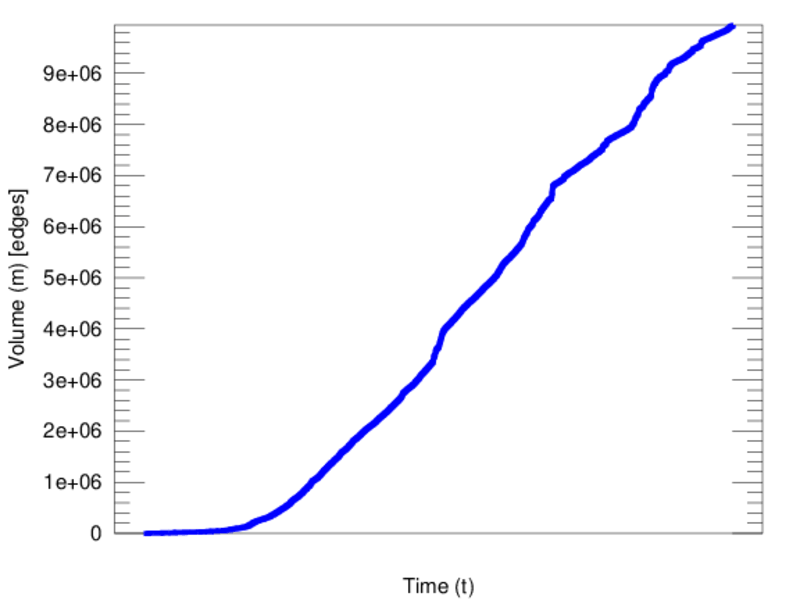
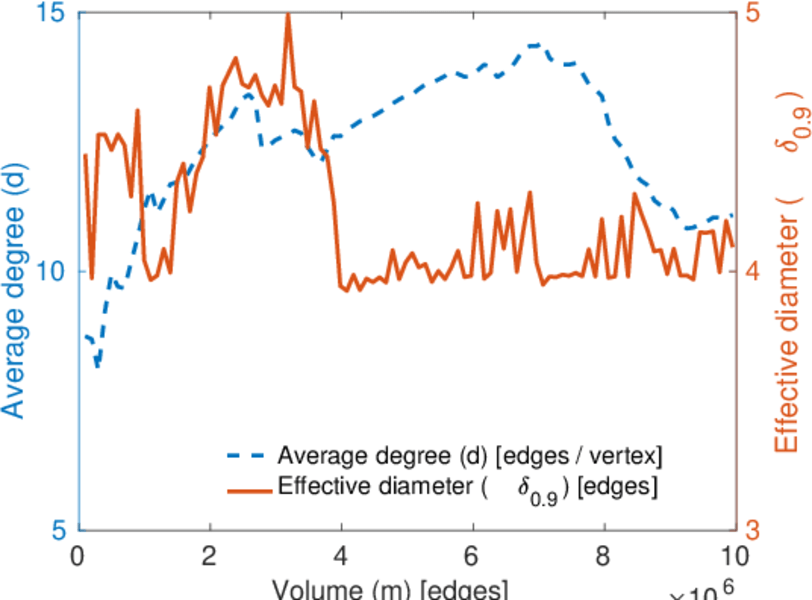
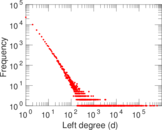
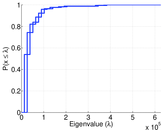
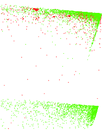
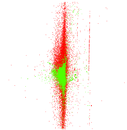
Plots


Downloads
References
|
[1]
|
Jérôme Kunegis.
KONECT – The Koblenz Network Collection.
In Proc. Int. Conf. on World Wide Web Companion, pages
1343–1350, 2013.
[ http ]
|
|
[2]
|
Wikimedia Foundation.
Wikimedia downloads.
http://dumps.wikimedia.org/, January 2010.
|
 KONECT ‣ Networks ‣
Buy Me a Coffee
KONECT ‣ Networks ‣
Buy Me a Coffee