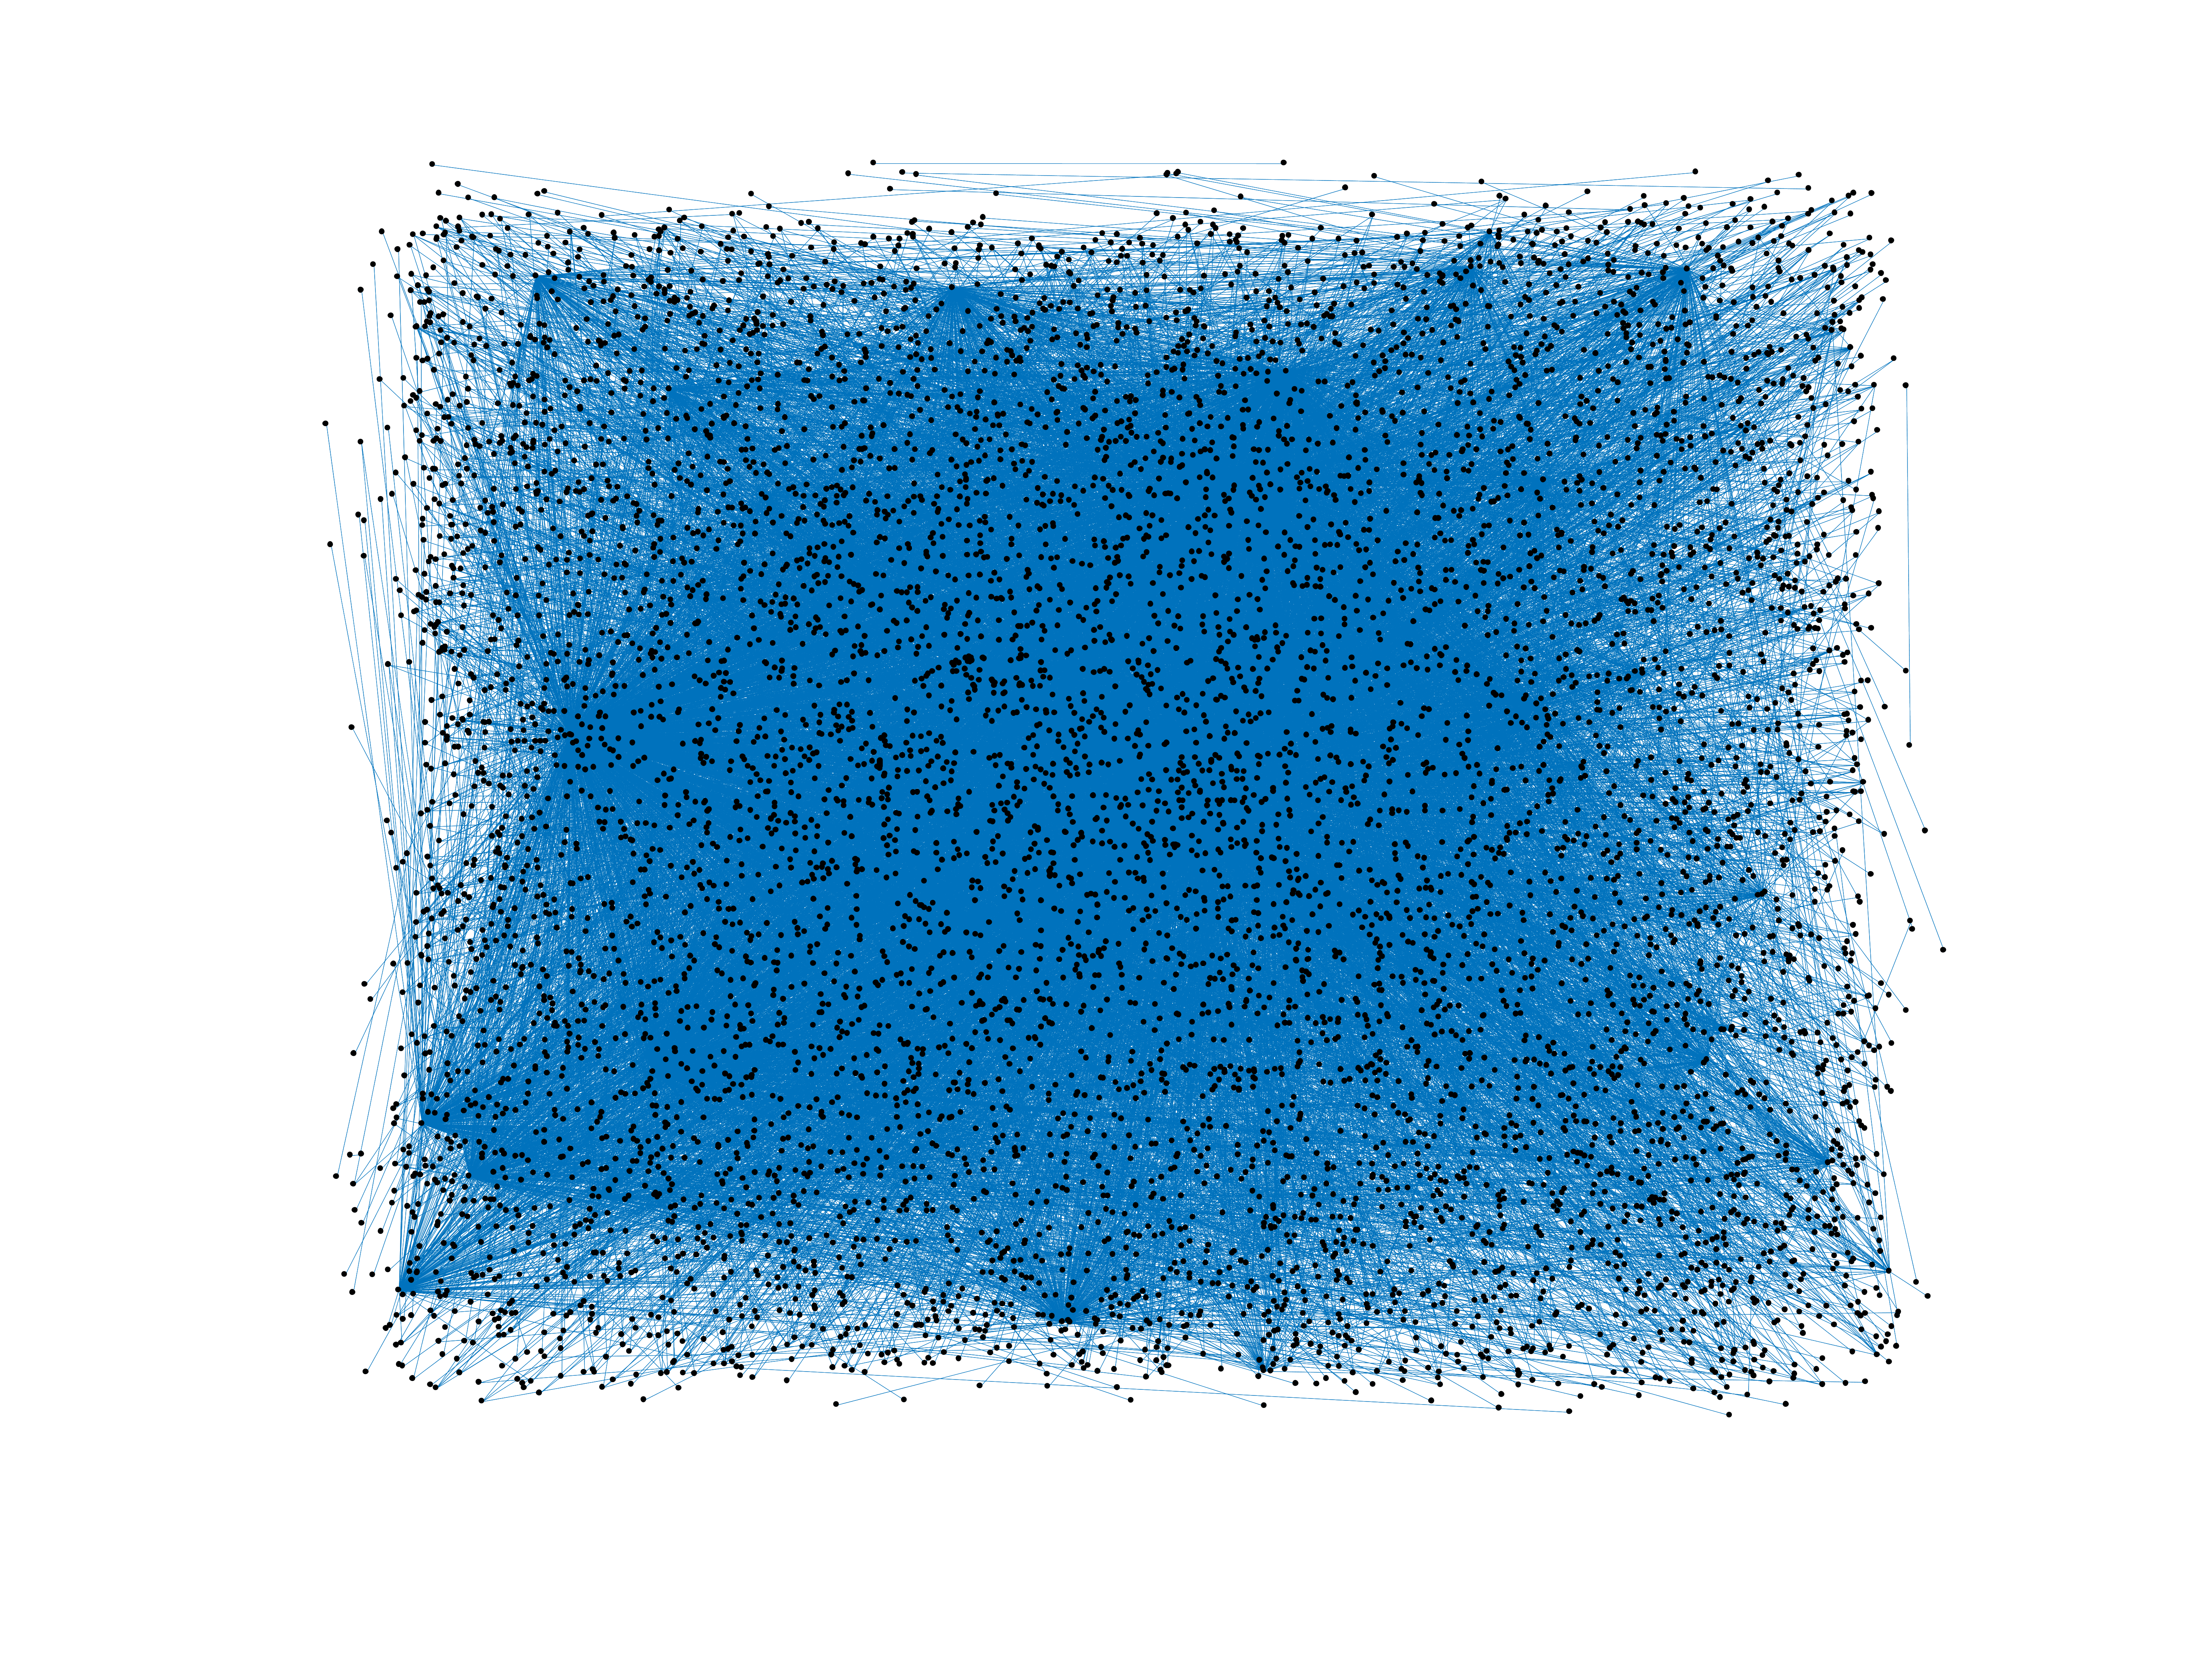
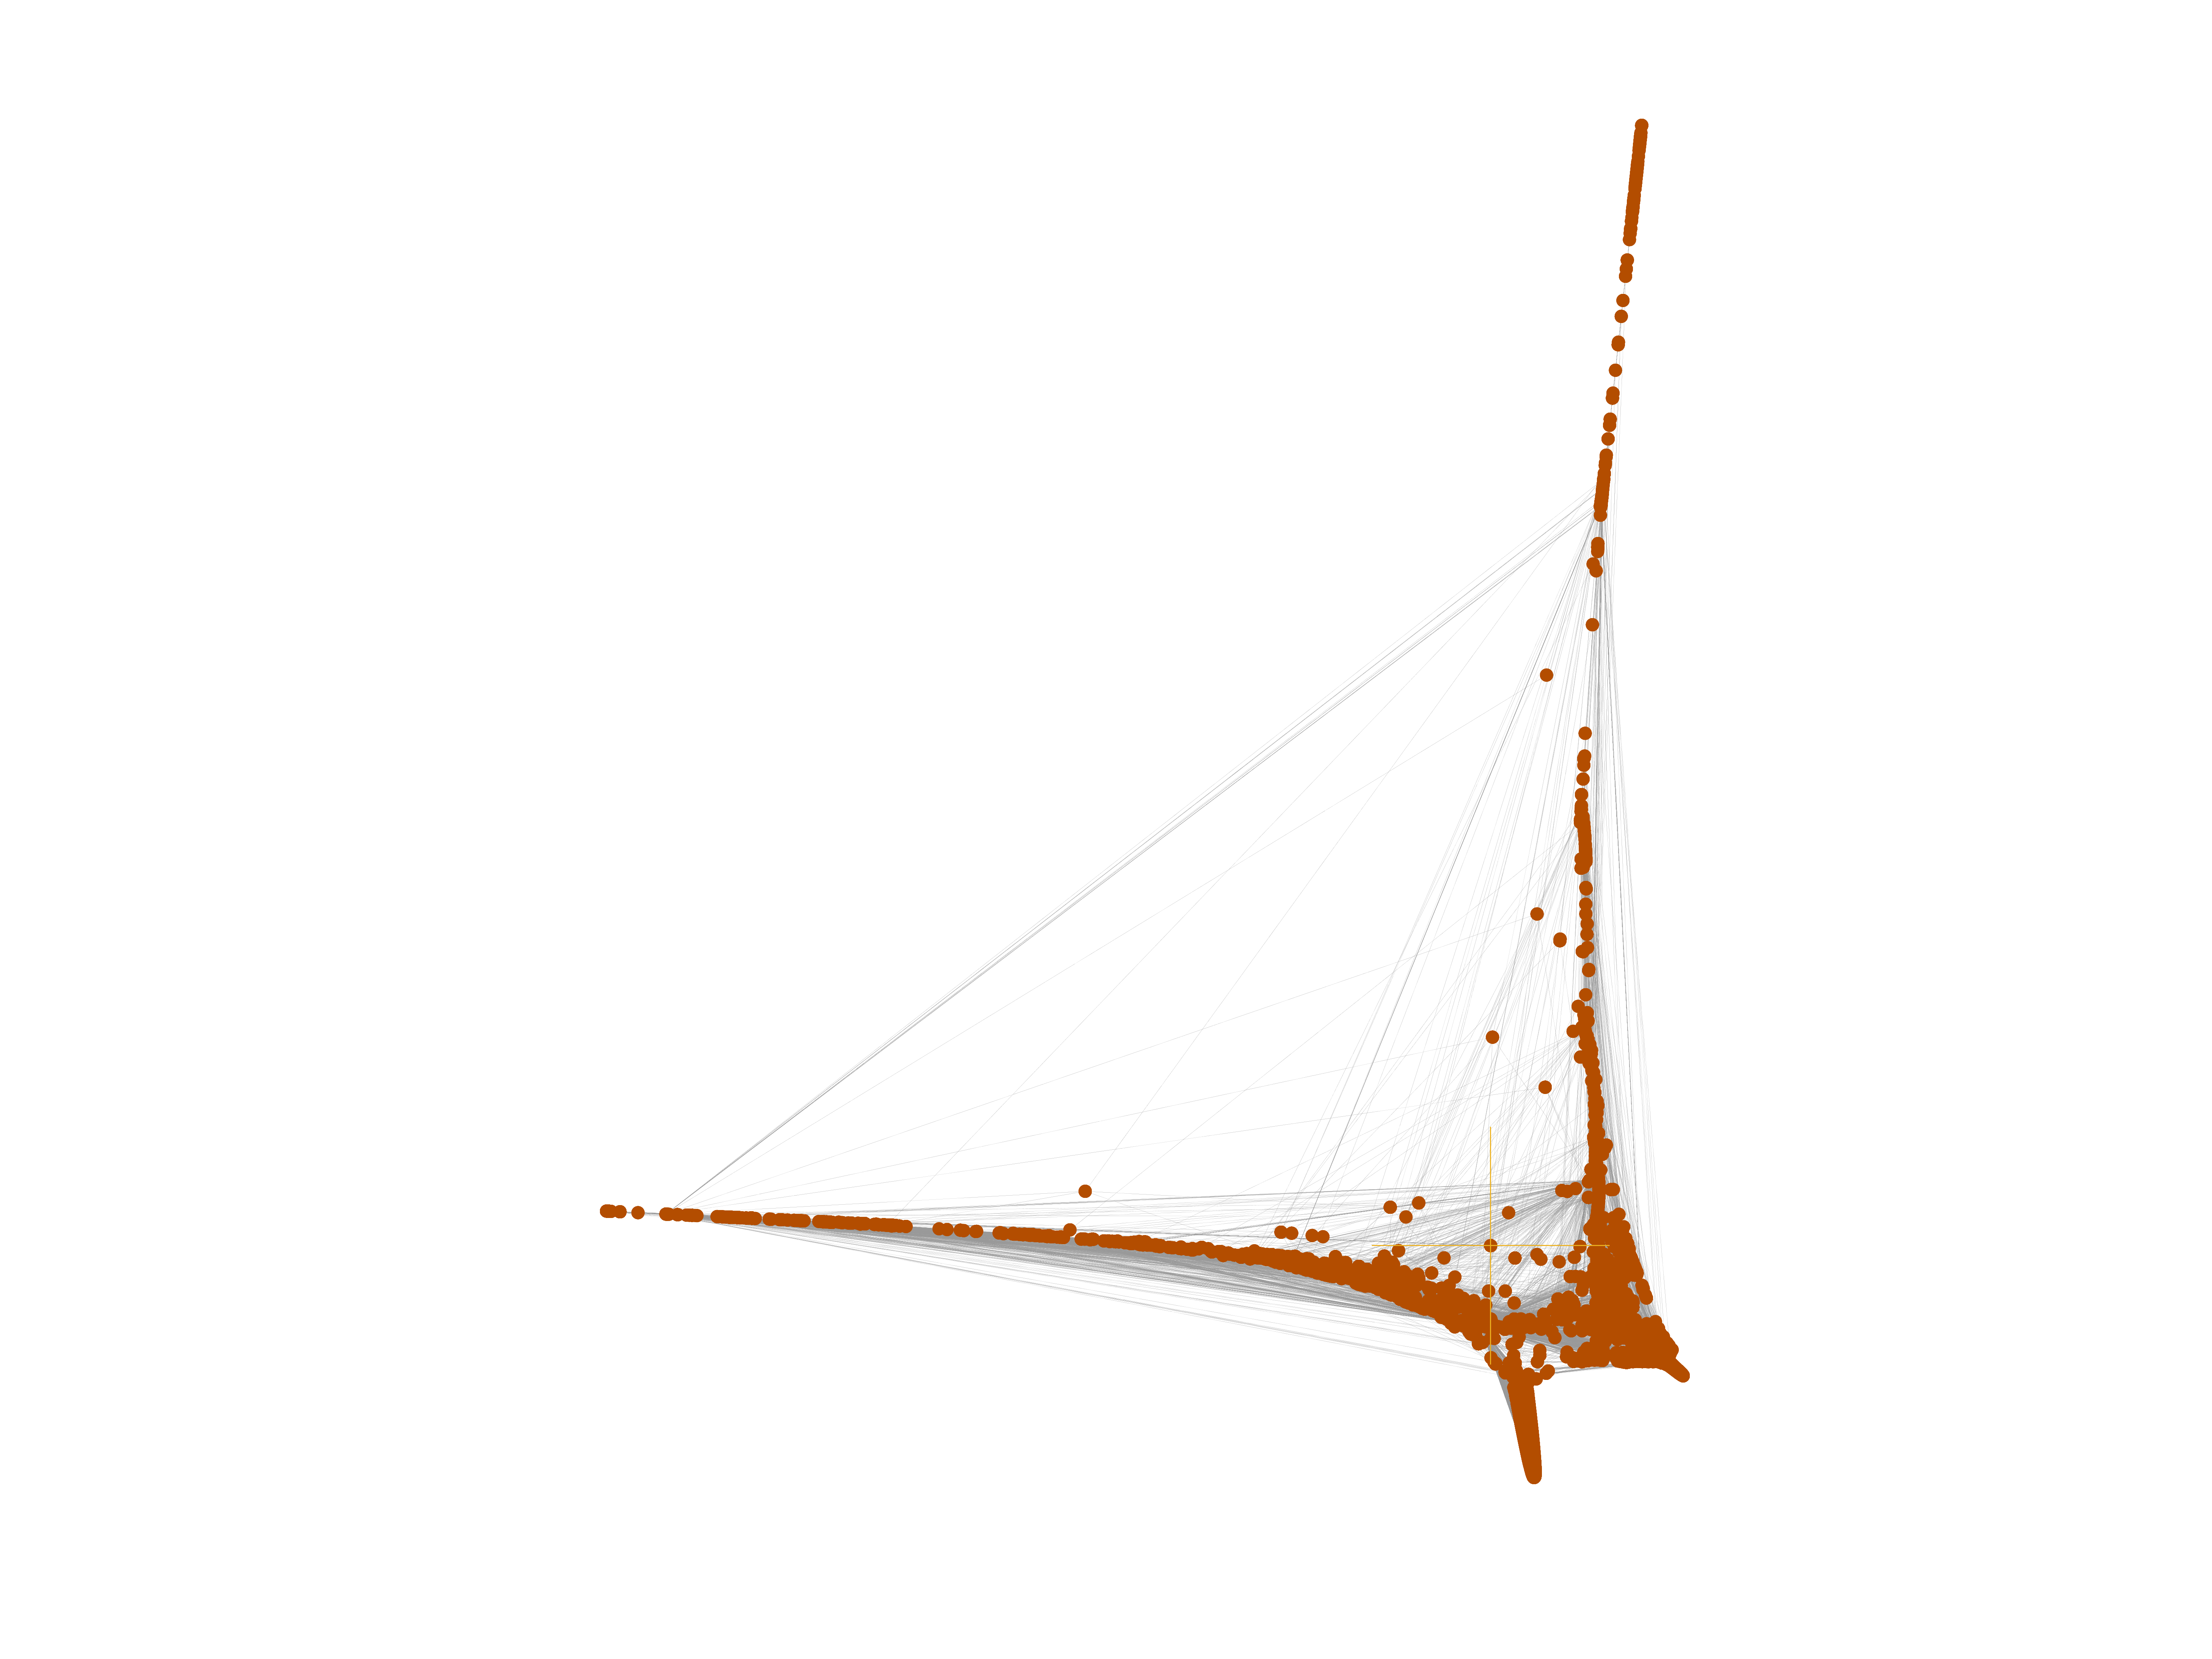
Wikinews edits (ro)
This is the bipartite edit network of the Romanian Wikinews. It contains users
and pages from the Romanian Wikinews, connected by edit events. Each edge
represents an edit. The dataset includes the timestamp of each edit.
Metadata
Statistics
| Size | n = | 7,741
|
| Left size | n1 = | 512
|
| Right size | n2 = | 7,229
|
| Volume | m = | 26,566
|
| Unique edge count | m̿ = | 14,996
|
| Wedge count | s = | 8,683,062
|
| Claw count | z = | 6,577,184,989
|
| Cross count | x = | 4,413,335,750,515
|
| Square count | q = | 1,609,872
|
| 4-Tour count | T4 = | 47,658,540
|
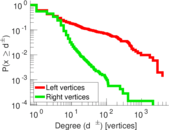
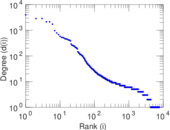
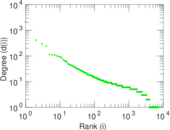
| Maximum degree | dmax = | 3,968
|
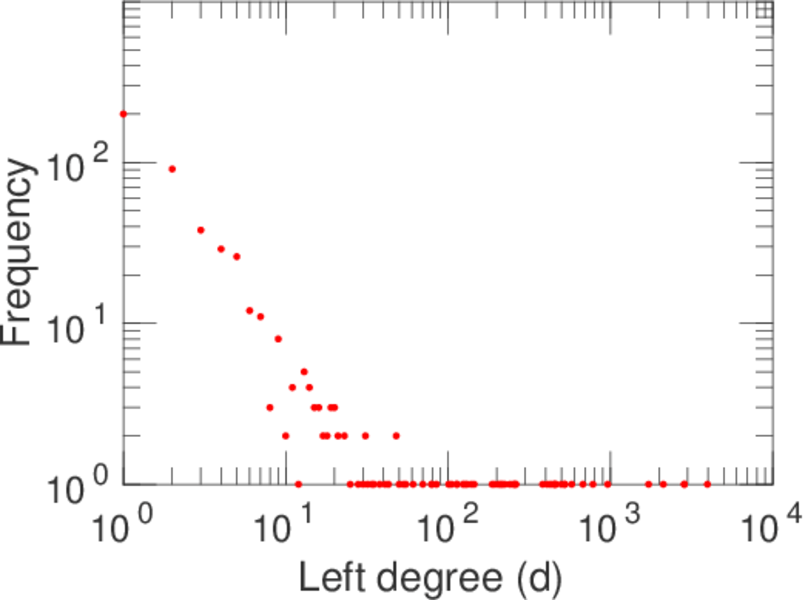
| Maximum left degree | d1max = | 3,968
|
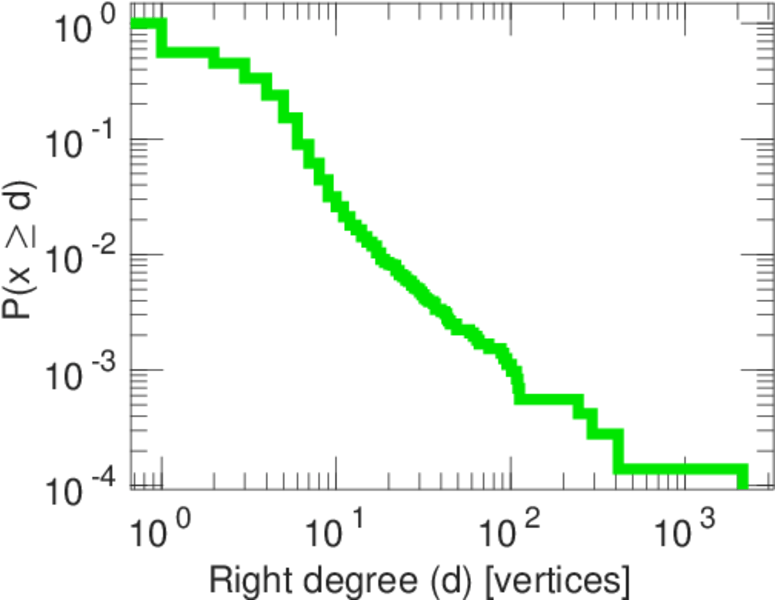
| Maximum right degree | d2max = | 2,128
|
| Average degree | d = | 6.863 71
|
| Average left degree | d1 = | 51.886 7
|
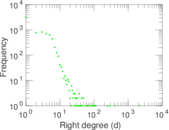
| Average right degree | d2 = | 3.674 92
|
| Fill | p = | 0.004 051 61
|
| Average edge multiplicity | m̃ = | 1.771 54
|
| Size of LCC | N = | 7,353
|
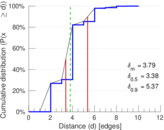
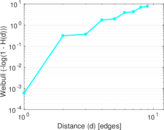
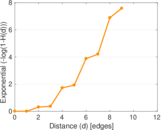
| Diameter | δ = | 11
|
| 50-Percentile effective diameter | δ0.5 = | 3.377 17
|
| 90-Percentile effective diameter | δ0.9 = | 5.366 99
|
| Median distance | δM = | 4
|
| Mean distance | δm = | 3.787 26
|
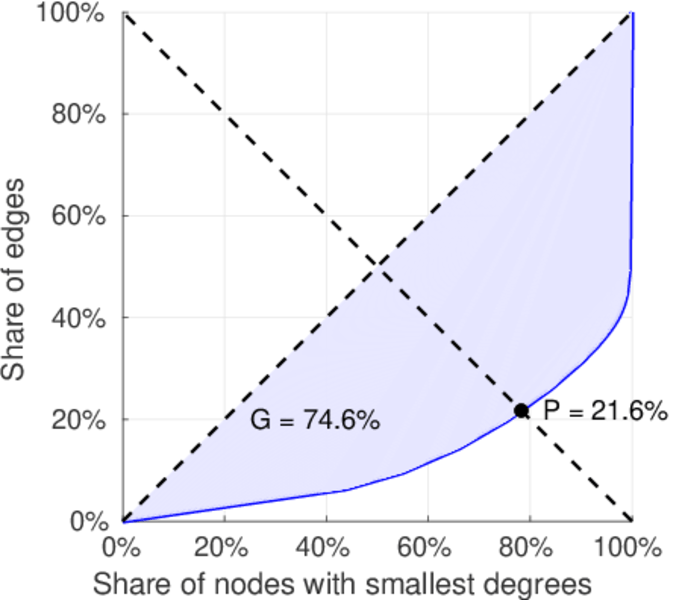
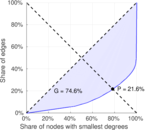
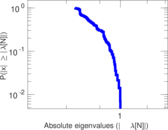
| Gini coefficient | G = | 0.756 561
|
| Balanced inequality ratio | P = | 0.210 758
|
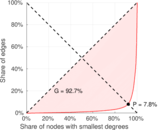
| Left balanced inequality ratio | P1 = | 0.077 768 6
|
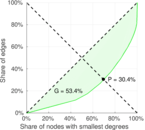
| Right balanced inequality ratio | P2 = | 0.303 734
|
| Relative edge distribution entropy | Her = | 0.757 481
|
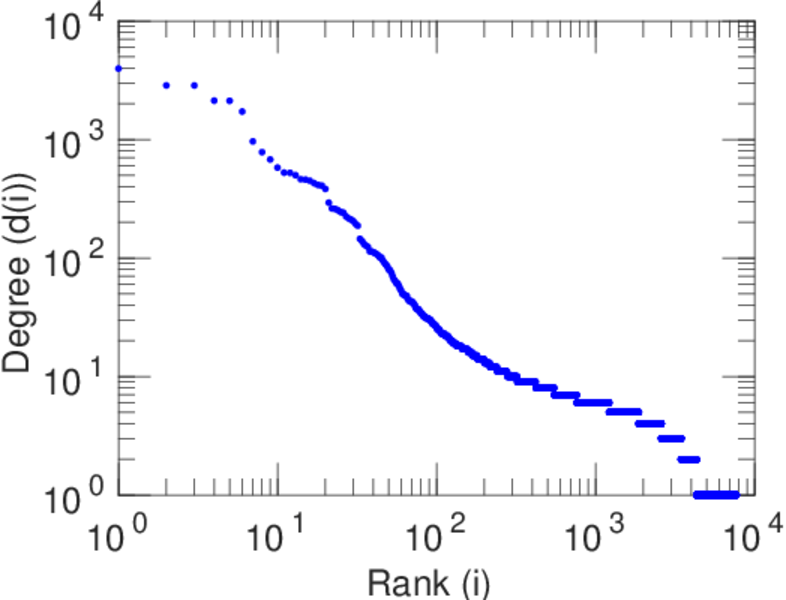
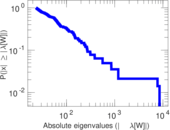
| Power law exponent | γ = | 2.765 95
|
| Tail power law exponent | γt = | 3.251 00
|
| Tail power law exponent with p | γ3 = | 3.251 00
|
| p-value | p = | 0.000 00
|
| Left tail power law exponent with p | γ3,1 = | 1.701 00
|
| Left p-value | p1 = | 0.000 00
|
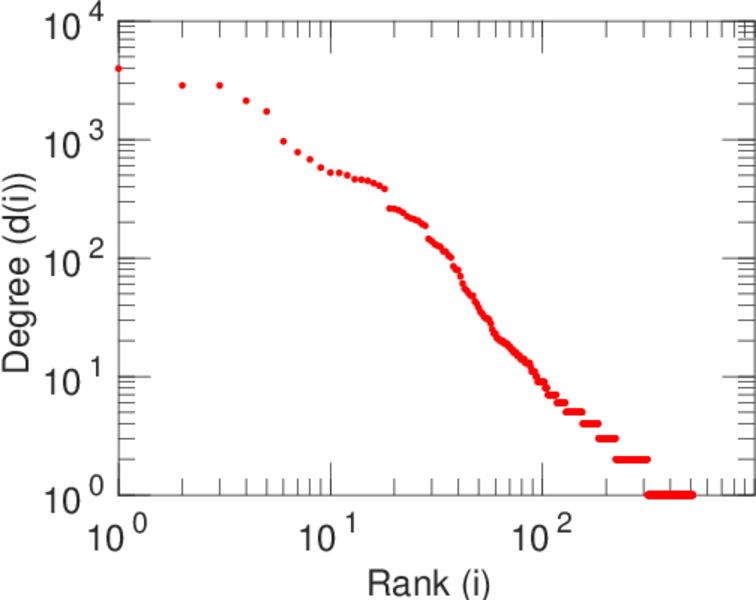
| Right tail power law exponent with p | γ3,2 = | 4.161 00
|
| Right p-value | p2 = | 0.762 000
|
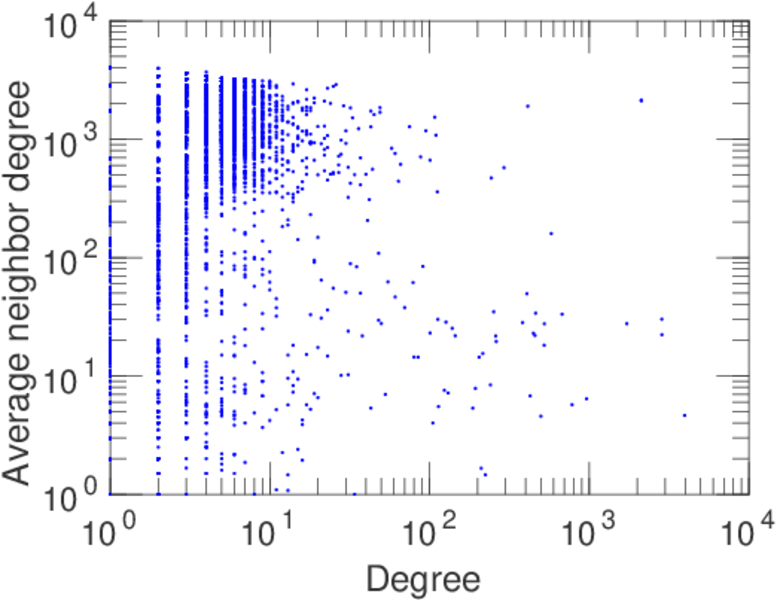
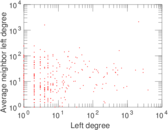
| Degree assortativity | ρ = | −0.180 065
|
| Degree assortativity p-value | pρ = | 1.742 05 × 10−109
|
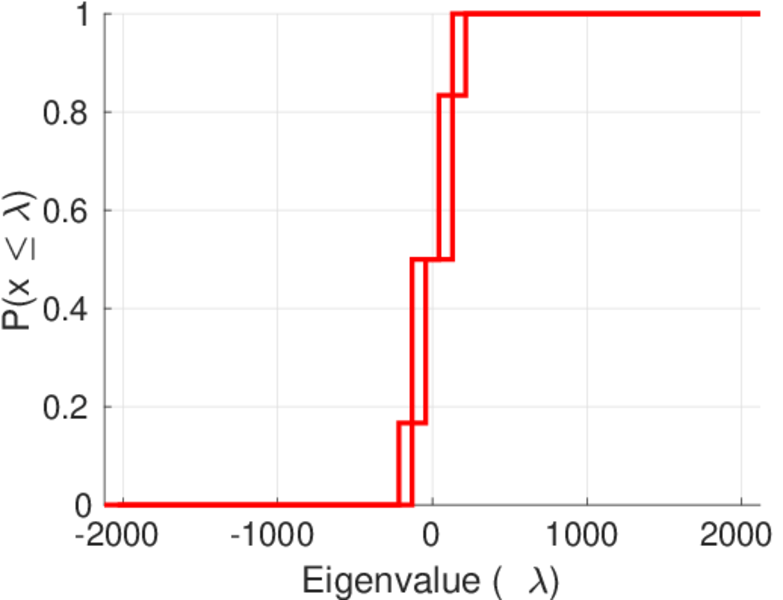
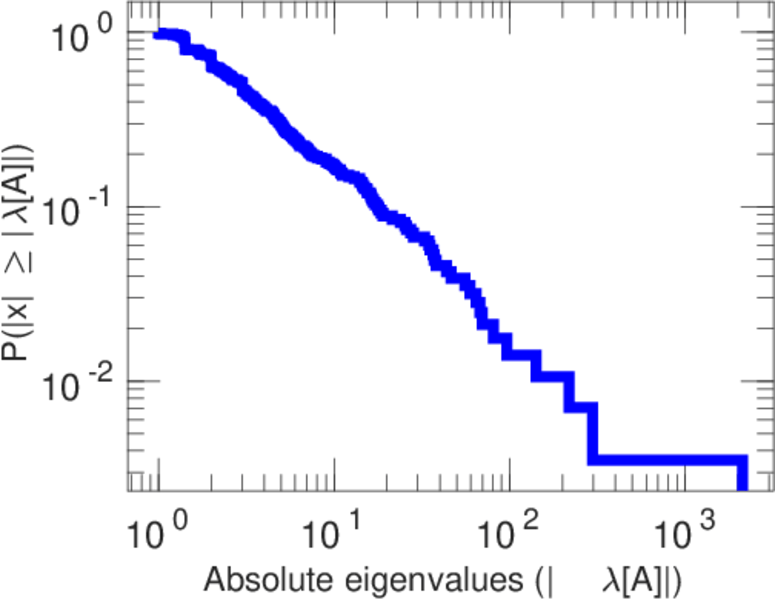
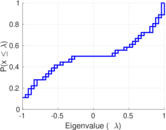
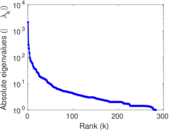
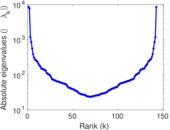
| Spectral norm | α = | 2,121.01
|
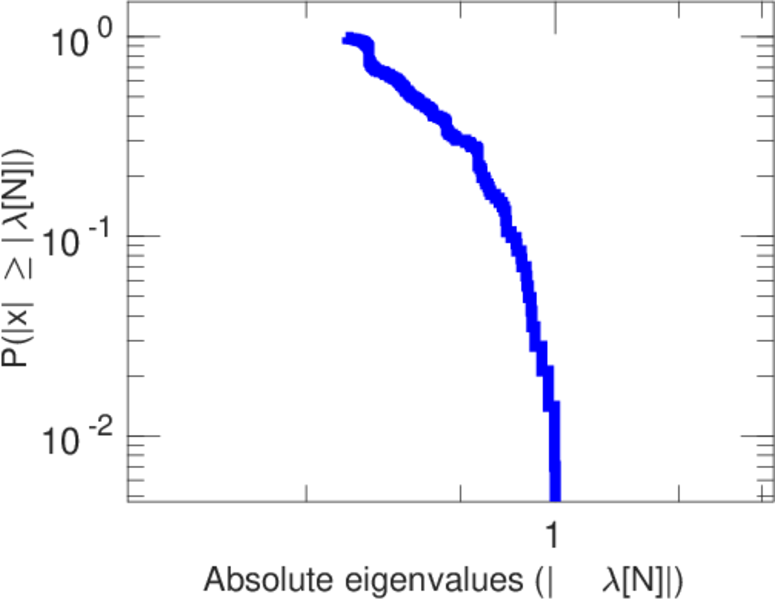
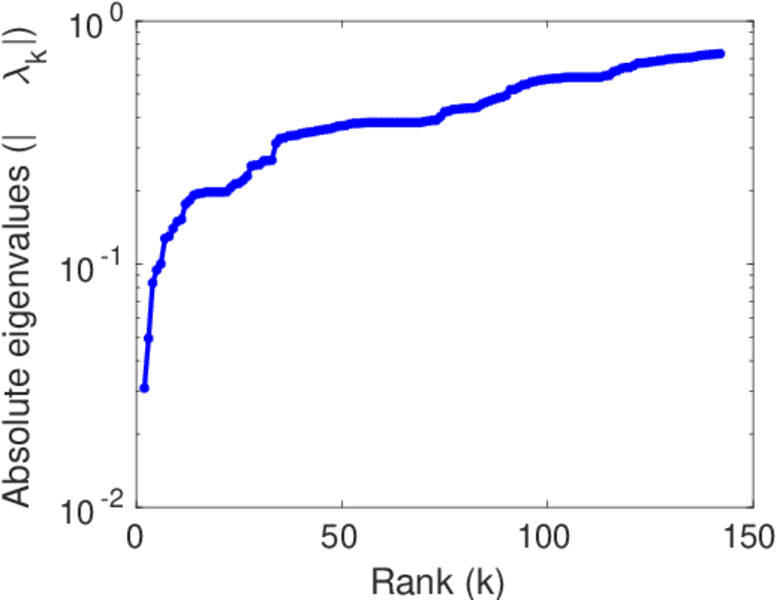
| Algebraic connectivity | a = | 0.030 916 4
|
| Spectral separation | |λ1[A] / λ2[A]| = | 7.164 33
|
| Controllability | C = | 6,788
|
| Relative controllability | Cr = | 0.883 394
|
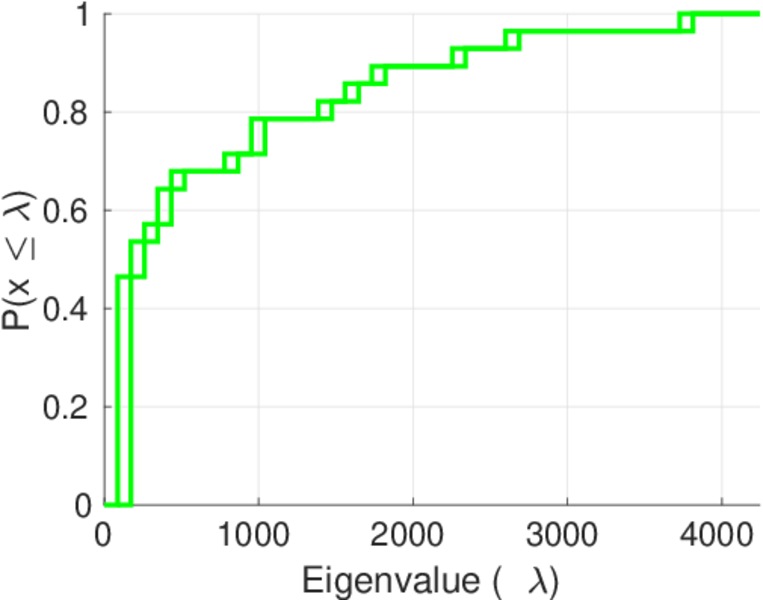
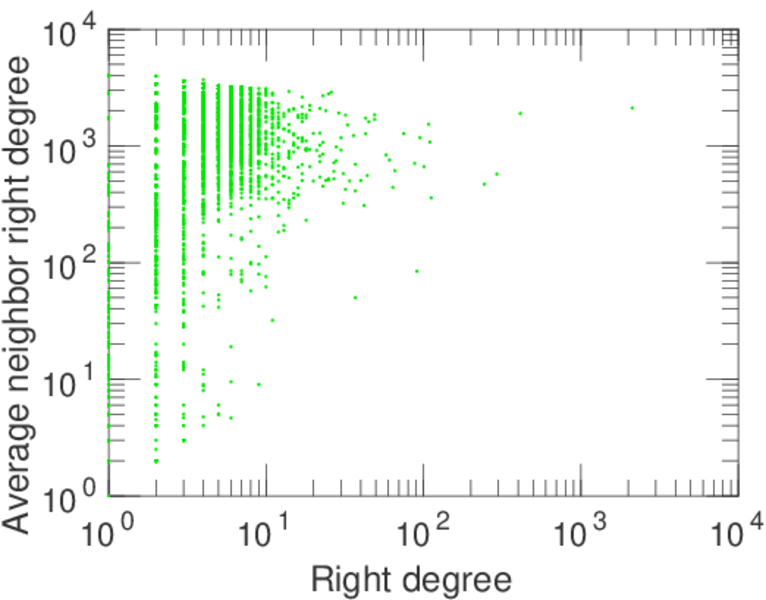
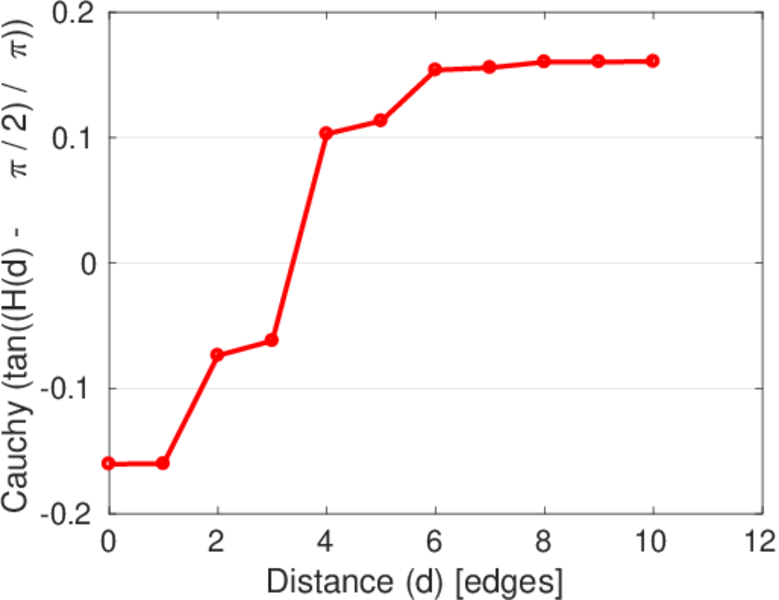
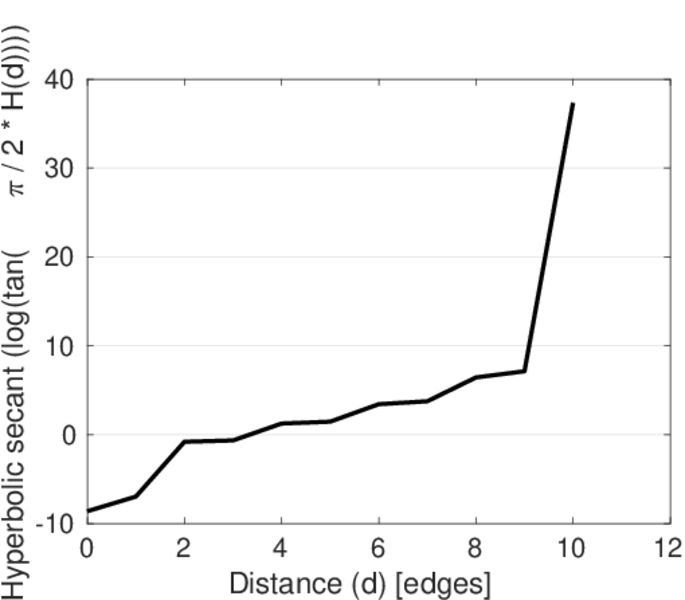
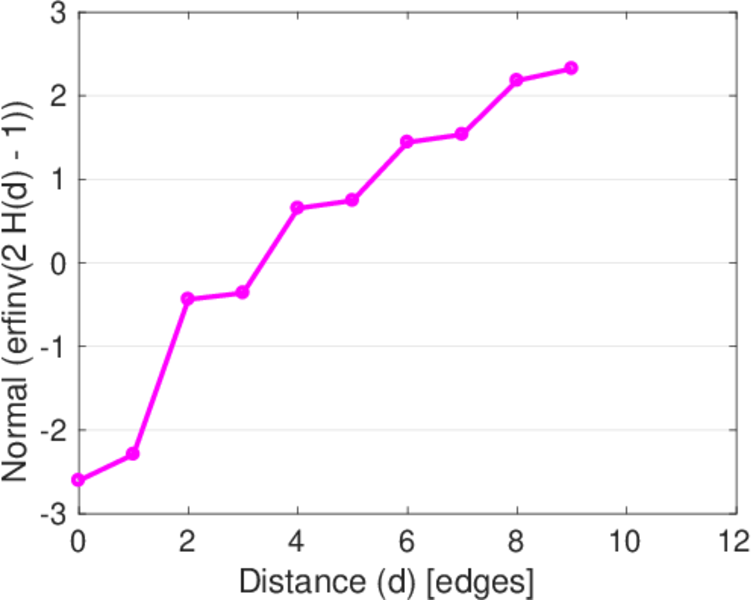
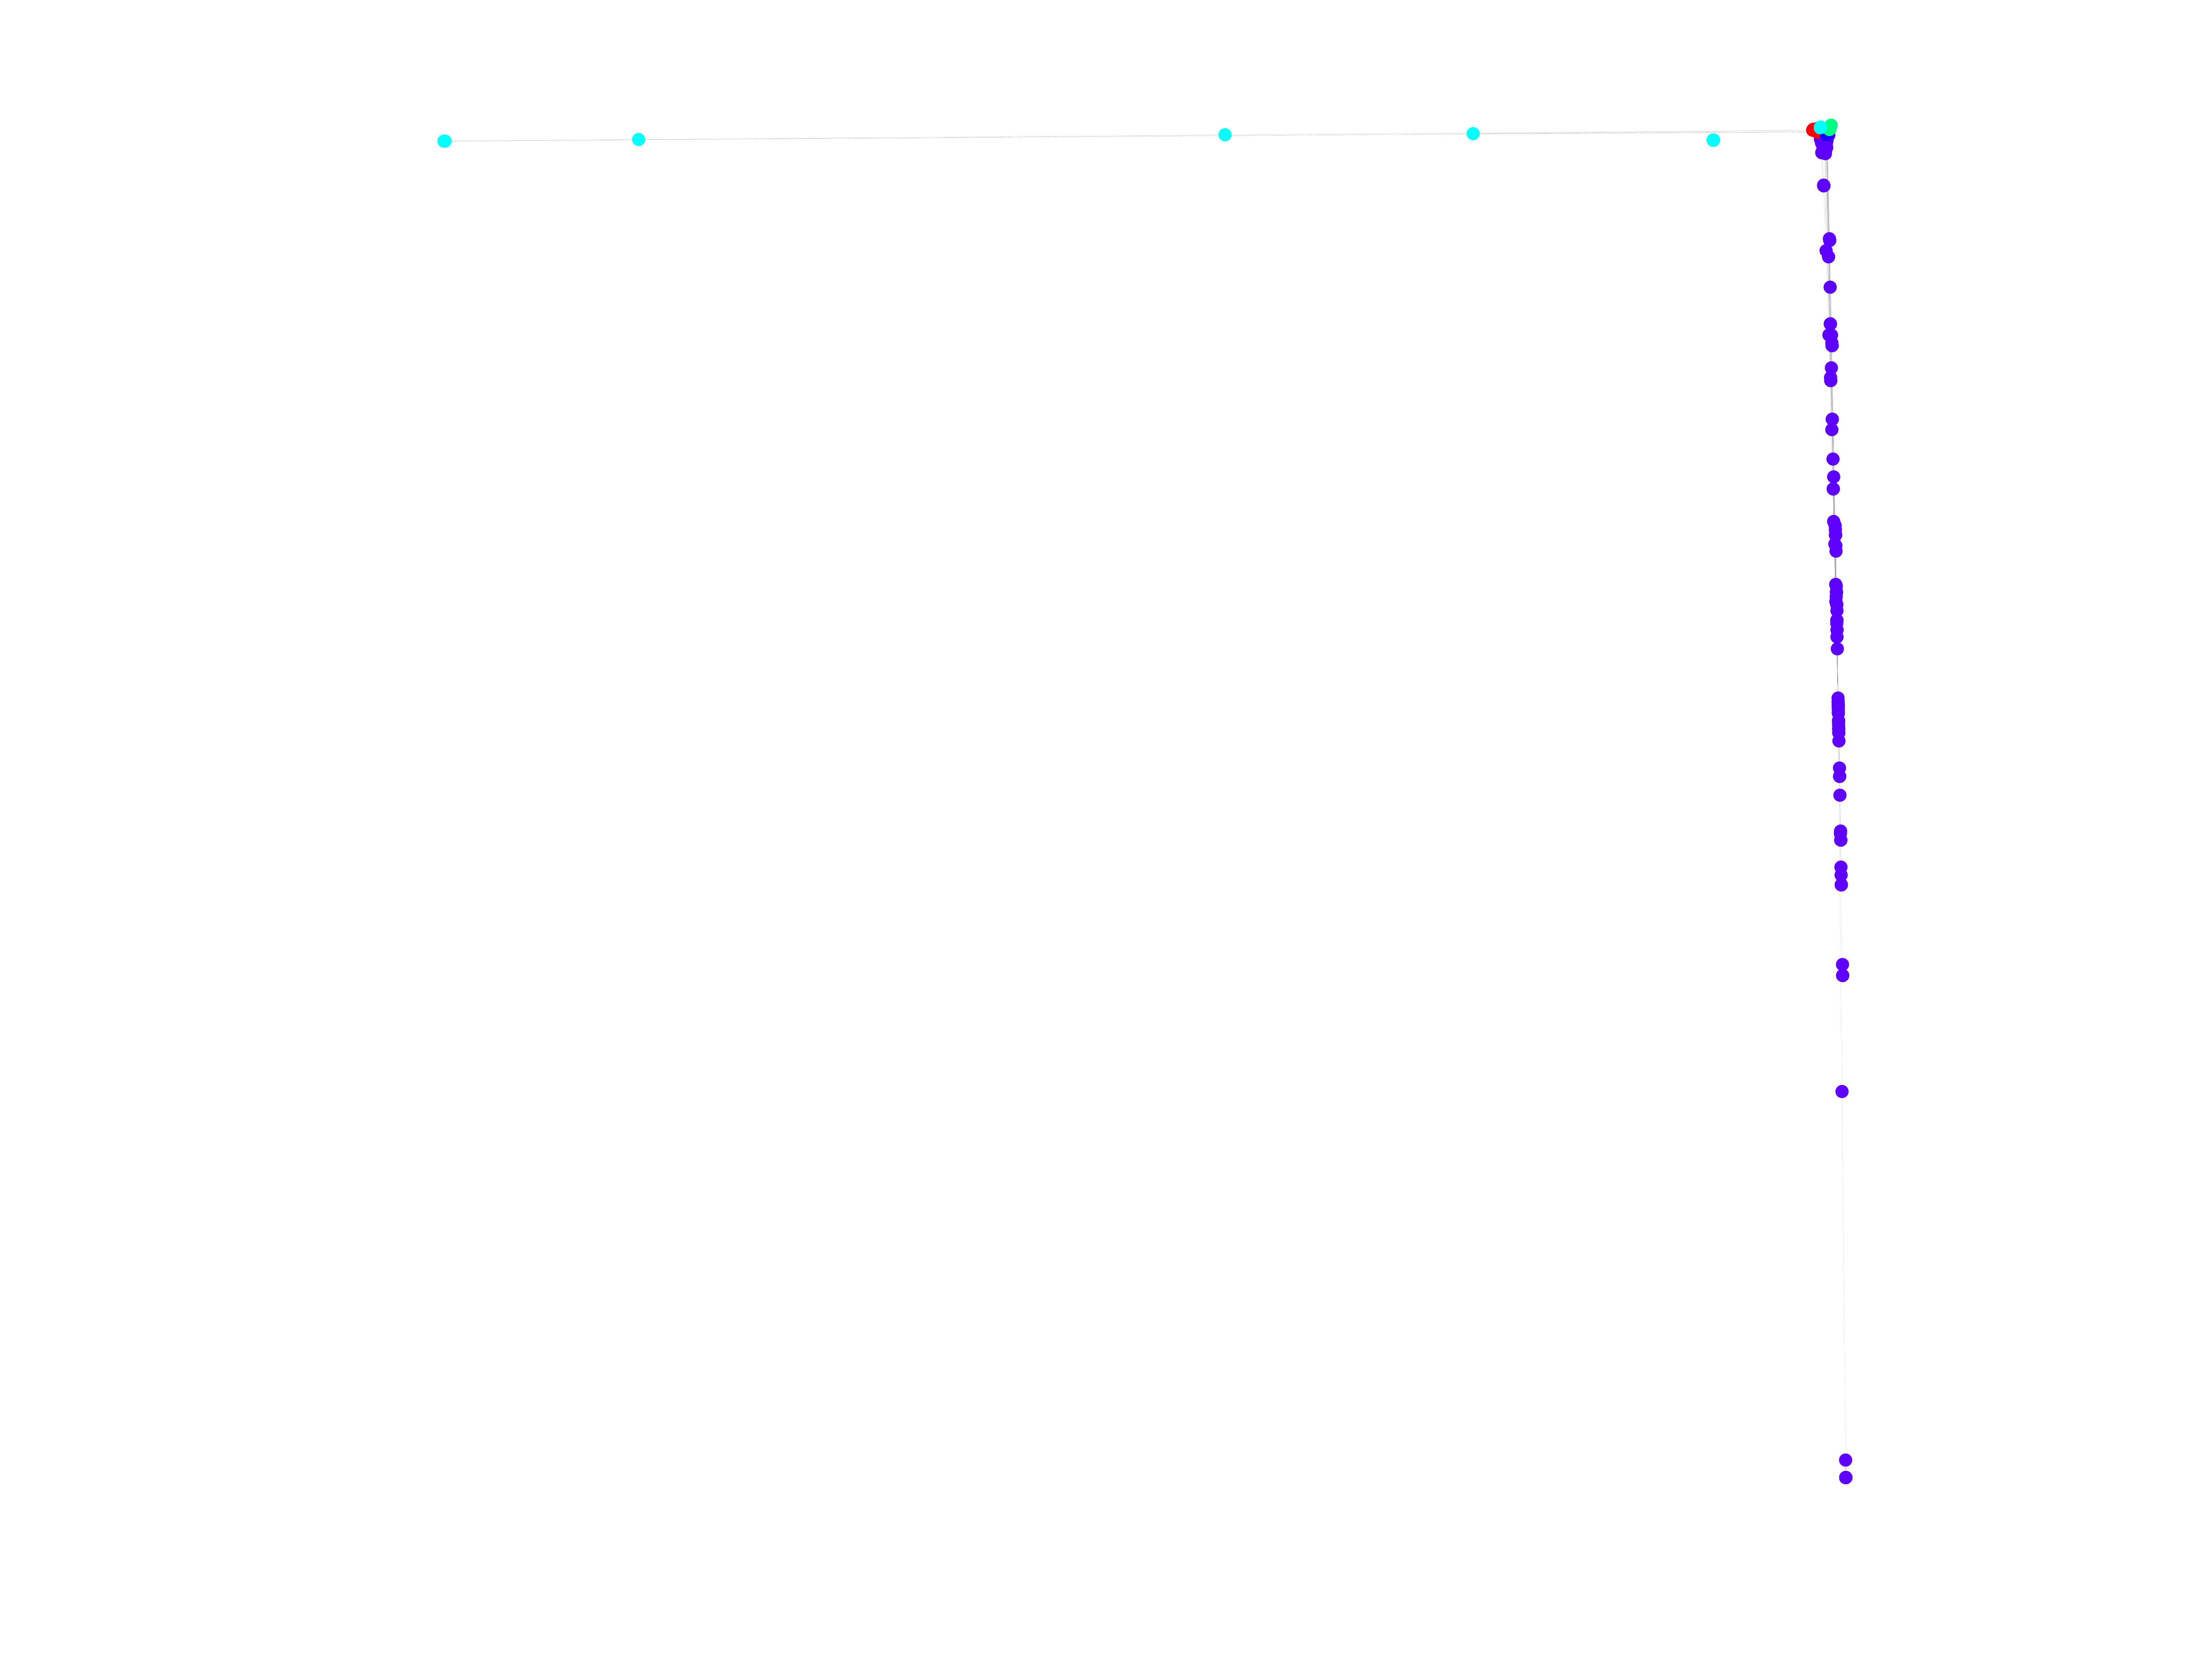
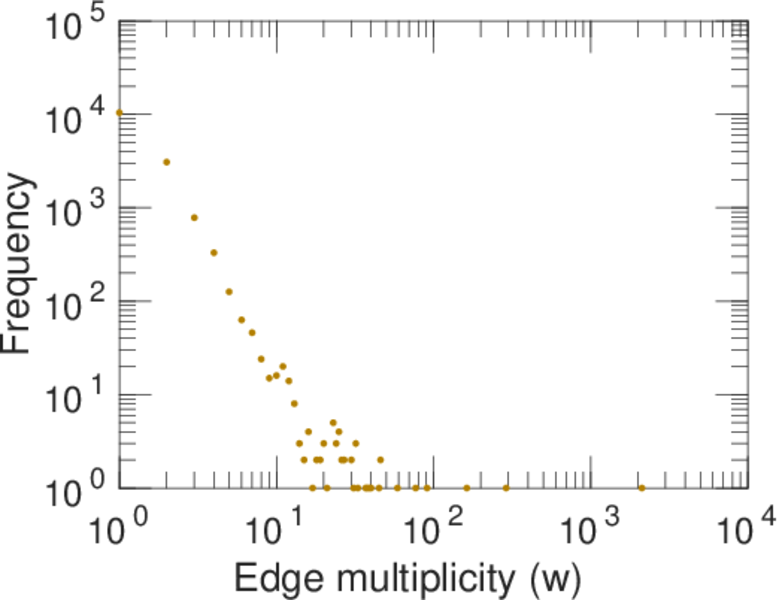
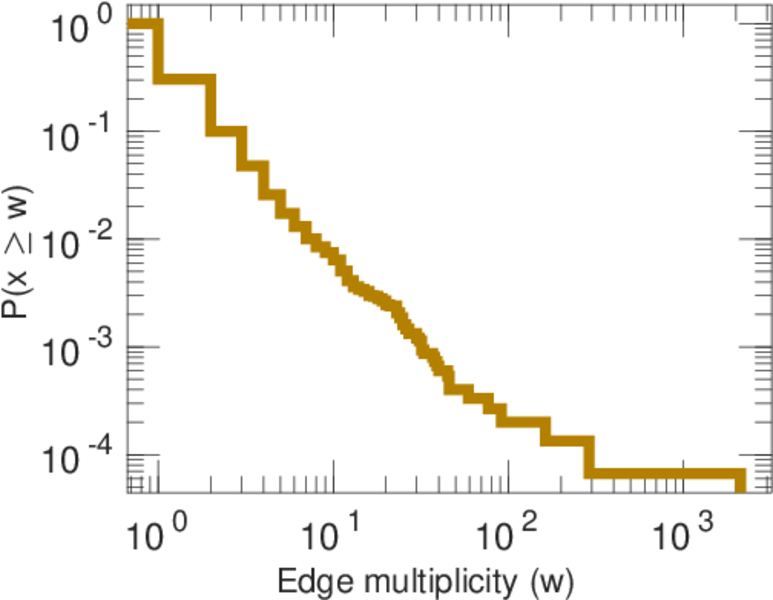
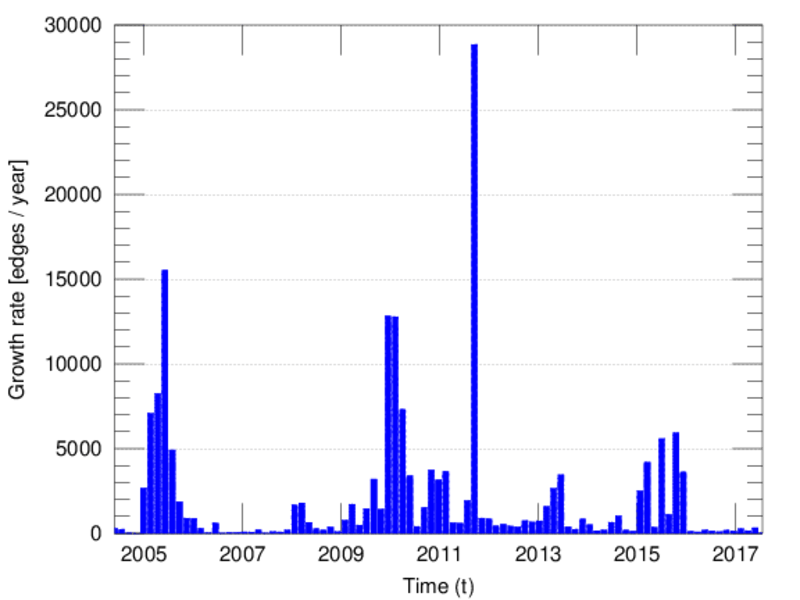
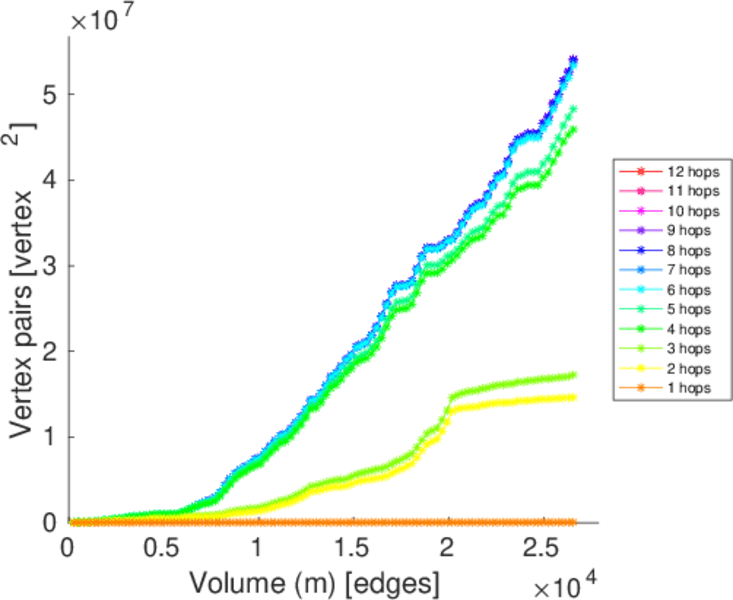
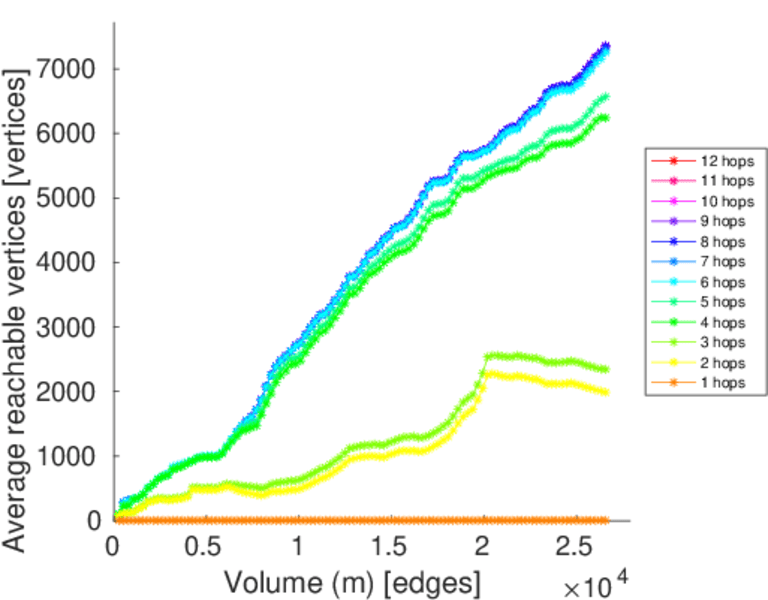
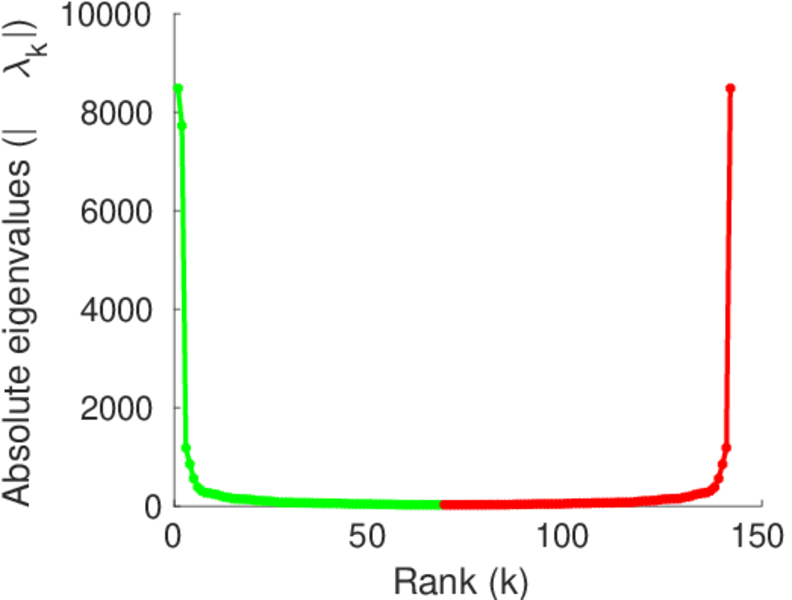
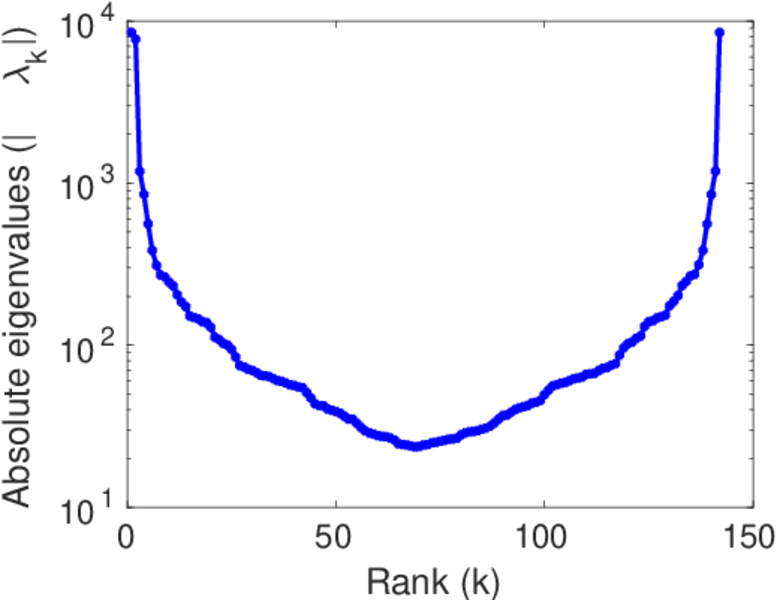
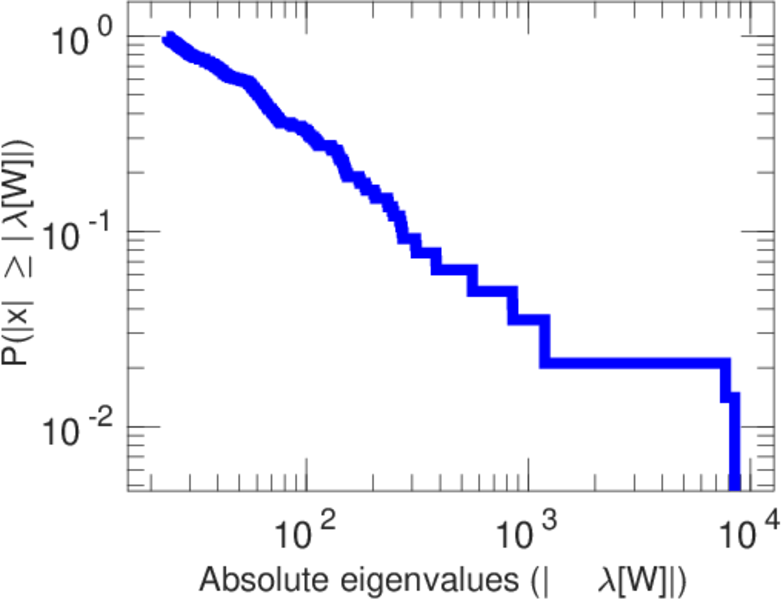
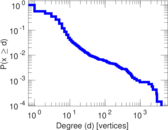
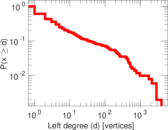
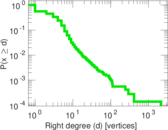
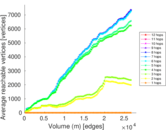
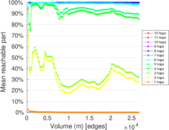
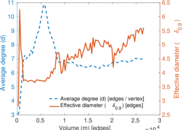
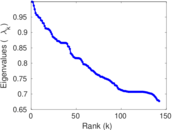
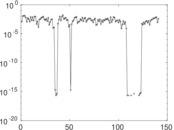
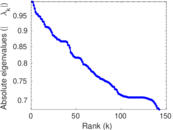
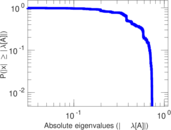
Plots
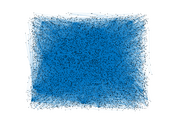


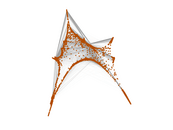


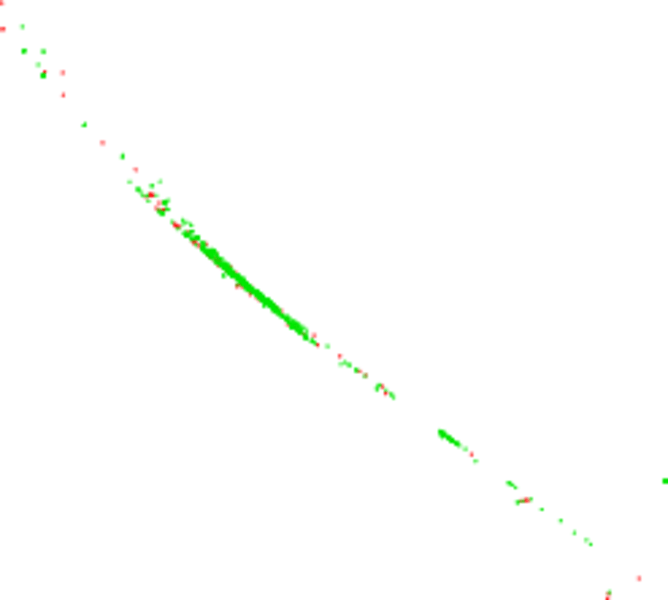
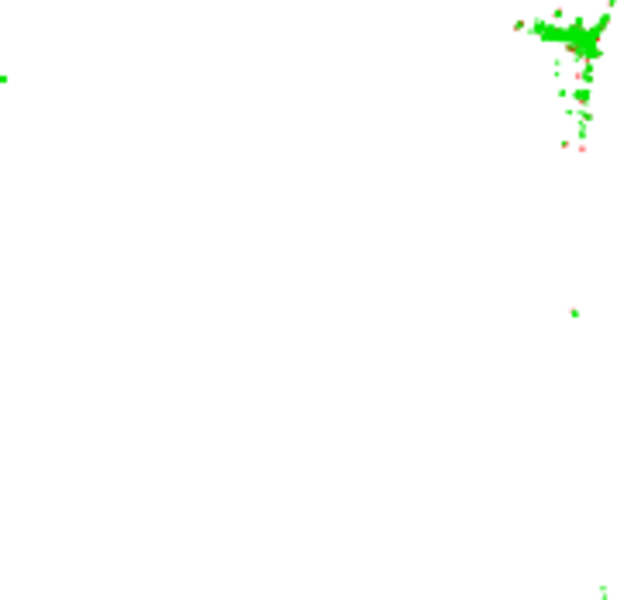
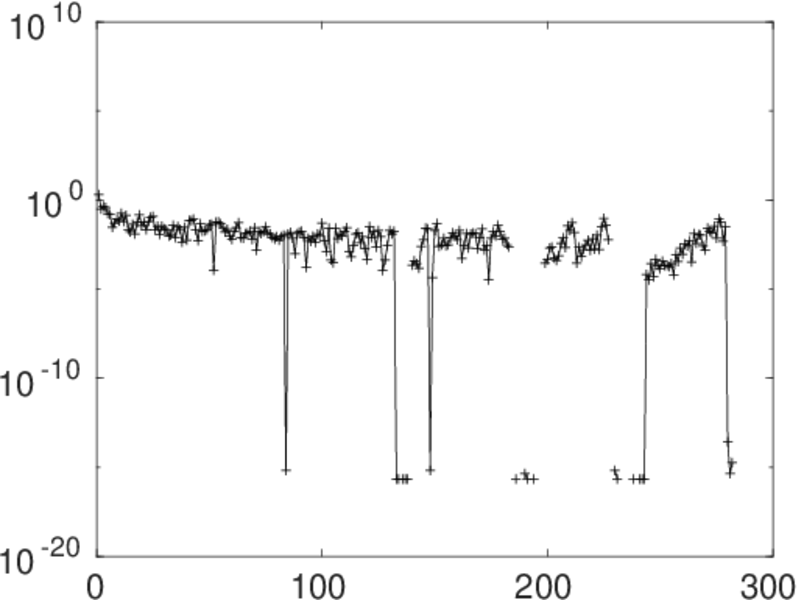
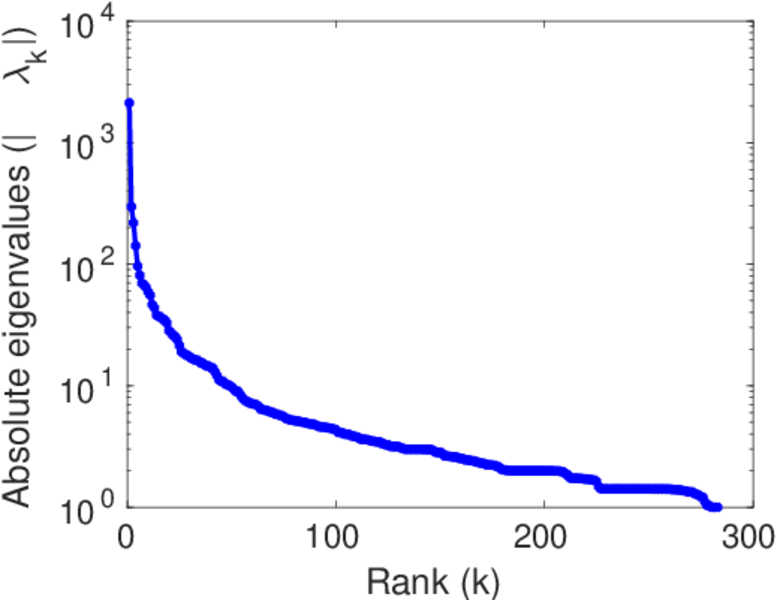
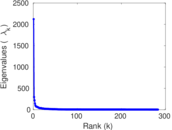
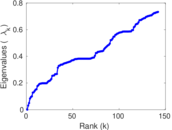
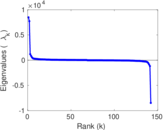
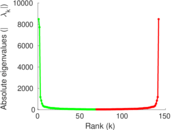
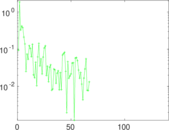
Matrix decompositions plots


Downloads
References
|
[1]
|
Jérôme Kunegis.
KONECT – The Koblenz Network Collection.
In Proc. Int. Conf. on World Wide Web Companion, pages
1343–1350, 2013.
[ http ]
|
|
[2]
|
Wikimedia Foundation.
Wikimedia downloads.
http://dumps.wikimedia.org/, January 2010.
|
 KONECT ‣ Networks ‣
Buy Me a Coffee
KONECT ‣ Networks ‣
Buy Me a Coffee