Wikivoyage edits (ro)
This is the bipartite edit network of the Romanian Wikivoyage. It contains
users and pages from the Romanian Wikivoyage, connected by edit events. Each
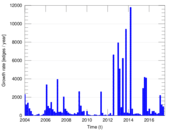
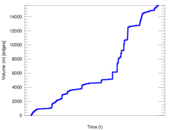
edge represents an edit. The dataset includes the timestamp of each edit.
Metadata
Statistics
| Size | n = | 2,868
|
| Left size | n1 = | 335
|
| Right size | n2 = | 2,533
|
| Volume | m = | 15,603
|
| Unique edge count | m̿ = | 9,066
|
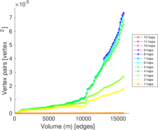
| Wedge count | s = | 1,950,090
|
| Claw count | z = | 348,940,950
|
| Cross count | x = | 51,723,242,288
|
| Square count | q = | 3,782,931
|
| 4-Tour count | T4 = | 38,102,340
|
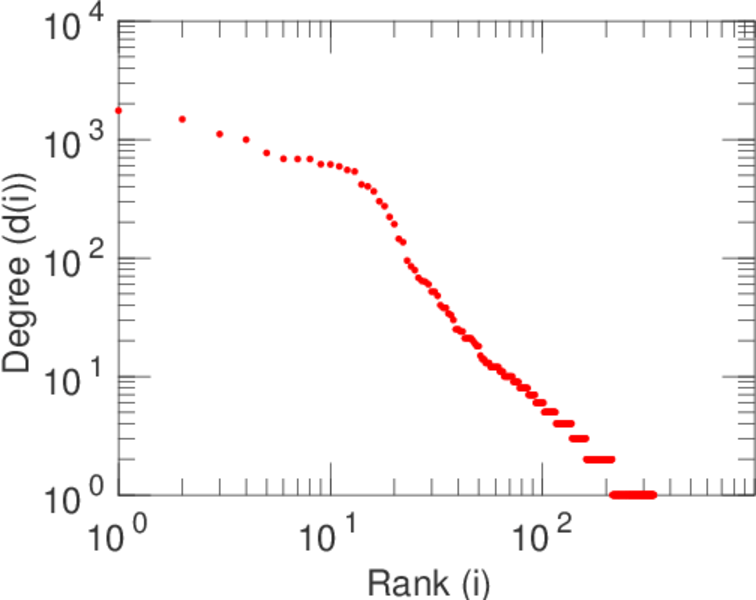
| Maximum degree | dmax = | 1,754
|
| Maximum left degree | d1max = | 1,754
|
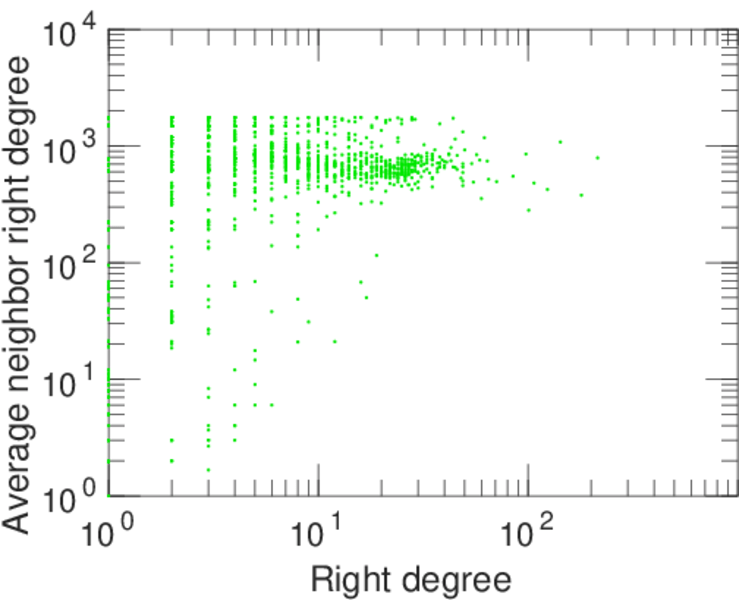
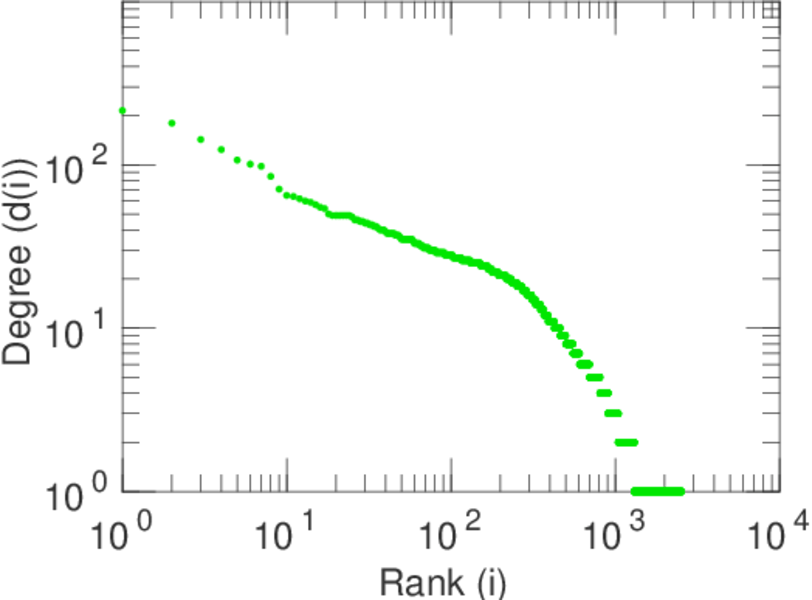
| Maximum right degree | d2max = | 215
|
| Average degree | d = | 10.880 8
|
| Average left degree | d1 = | 46.576 1
|
| Average right degree | d2 = | 6.159 89
|
| Fill | p = | 0.010 684 0
|
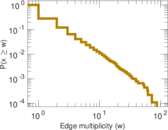
| Average edge multiplicity | m̃ = | 1.721 05
|
| Size of LCC | N = | 2,709
|
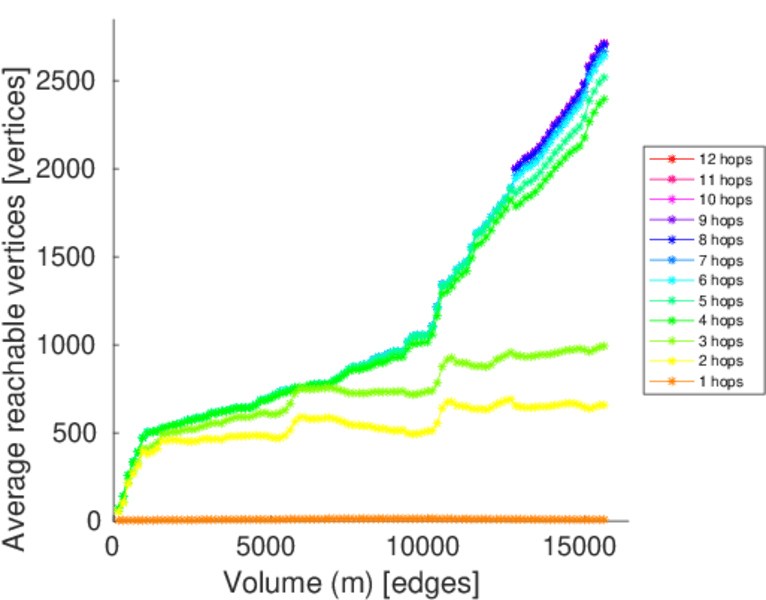
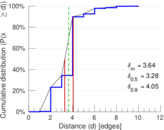
| Diameter | δ = | 12
|
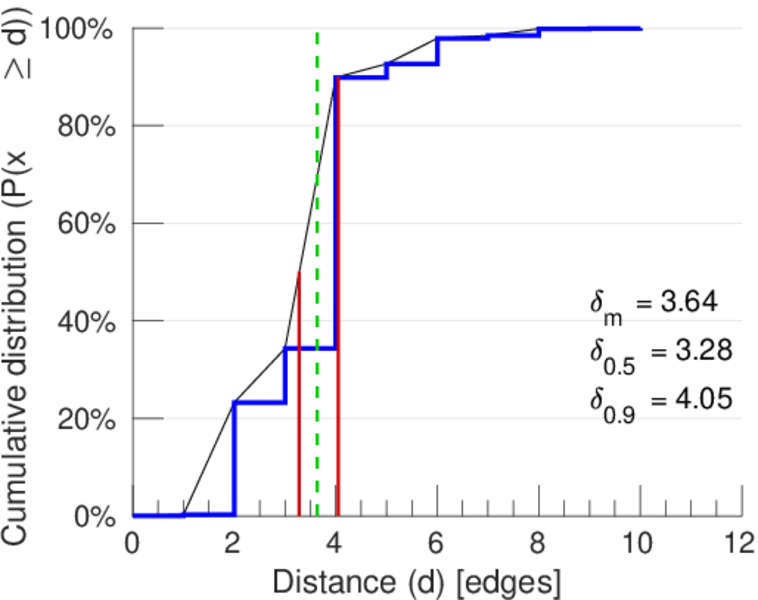
| 50-Percentile effective diameter | δ0.5 = | 3.282 67
|
| 90-Percentile effective diameter | δ0.9 = | 4.051 39
|
| Median distance | δM = | 4
|
| Mean distance | δm = | 3.636 04
|
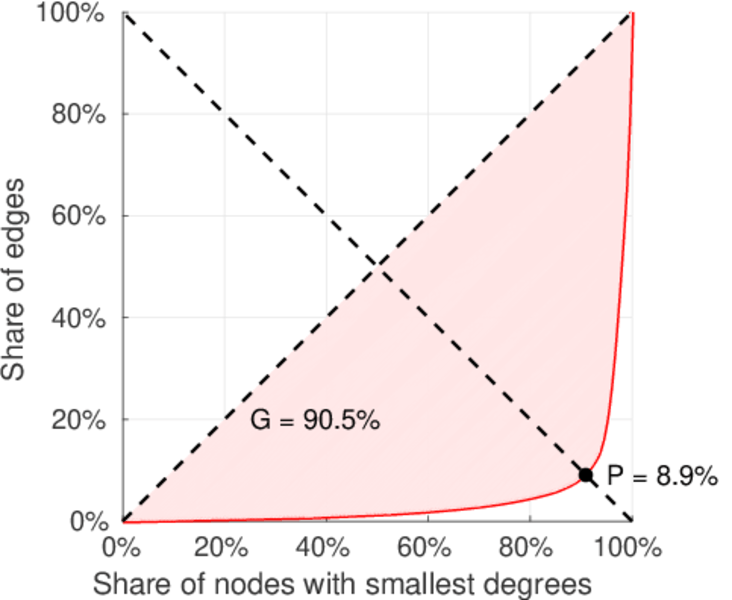
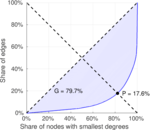
| Gini coefficient | G = | 0.808 189
|
| Balanced inequality ratio | P = | 0.170 224
|
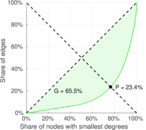
| Left balanced inequality ratio | P1 = | 0.089 341 8
|
| Right balanced inequality ratio | P2 = | 0.233 609
|
| Relative edge distribution entropy | Her = | 0.763 070
|
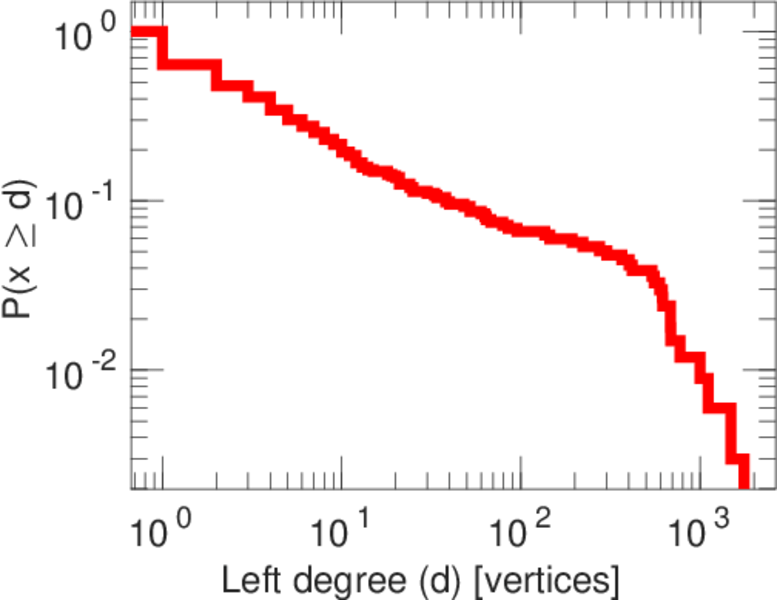
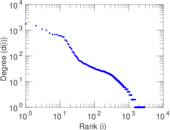
| Power law exponent | γ = | 2.377 08
|
| Tail power law exponent | γt = | 1.851 00
|
| Tail power law exponent with p | γ3 = | 1.851 00
|
| p-value | p = | 0.000 00
|
| Left tail power law exponent with p | γ3,1 = | 1.701 00
|
| Left p-value | p1 = | 0.000 00
|
| Right tail power law exponent with p | γ3,2 = | 8.551 00
|
| Right p-value | p2 = | 0.211 000
|
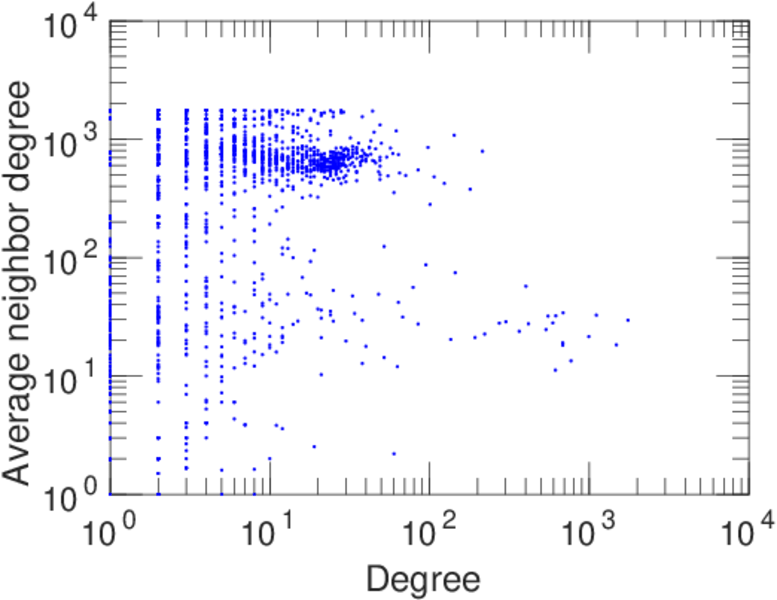
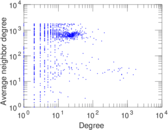
| Degree assortativity | ρ = | −0.214 396
|
| Degree assortativity p-value | pρ = | 9.452 16 × 10−95
|
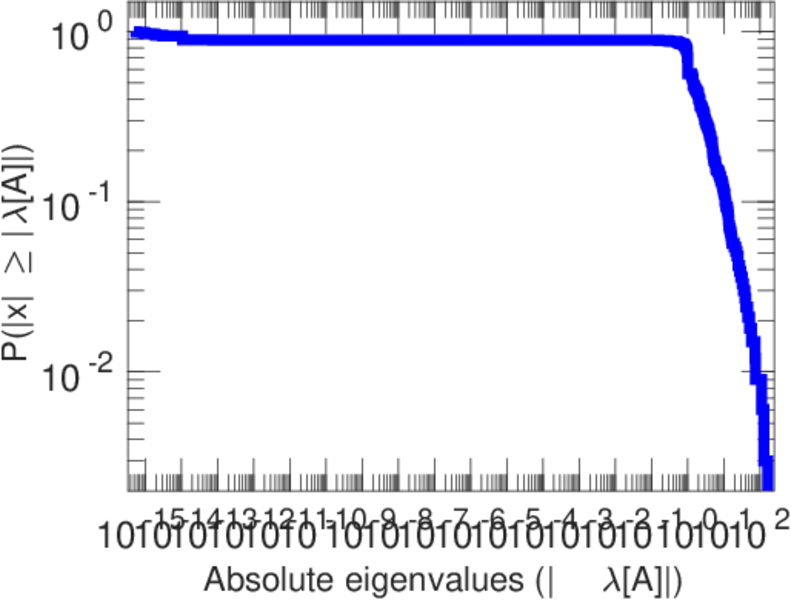
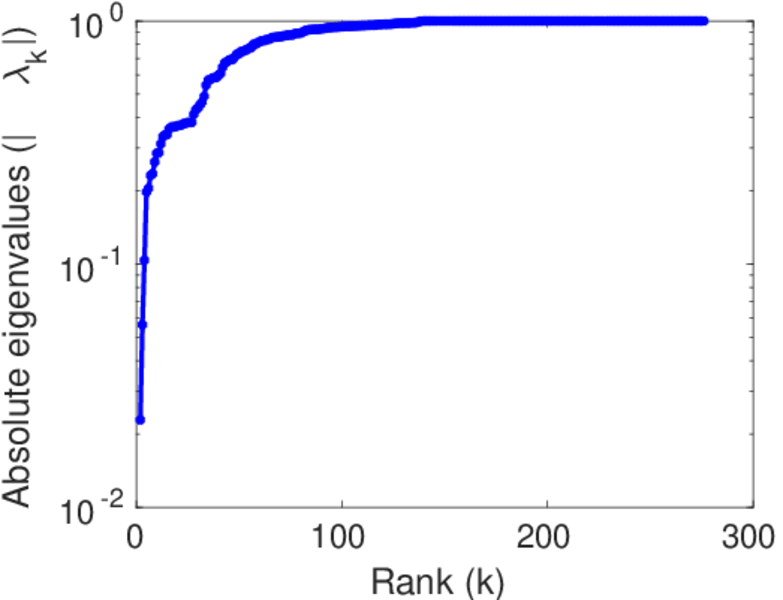
| Spectral norm | α = | 164.991
|
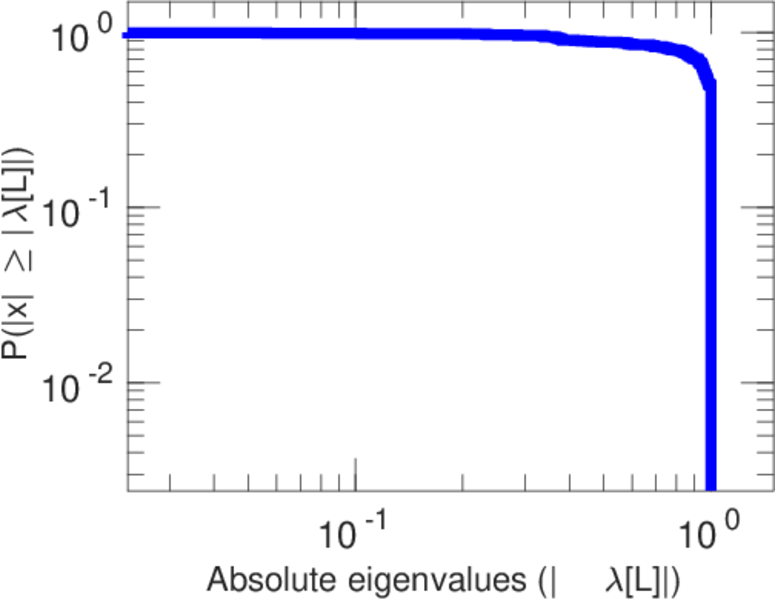
| Algebraic connectivity | a = | 0.022 847 4
|
| Spectral separation | |λ1[A] / λ2[A]| = | 1.278 73
|
| Controllability | C = | 2,262
|
| Relative controllability | Cr = | 0.793 128
|
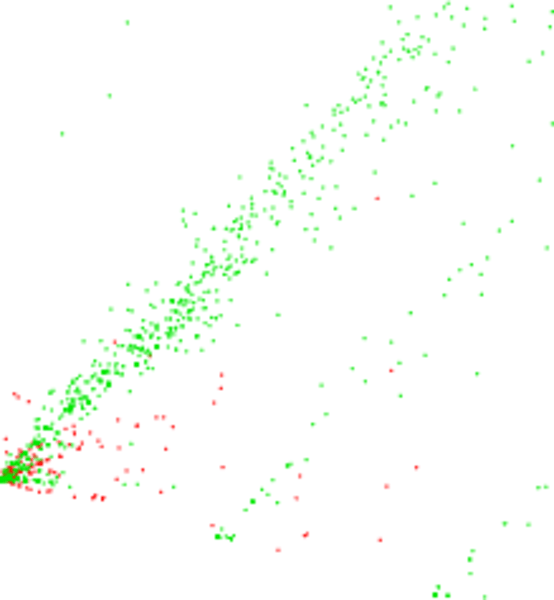
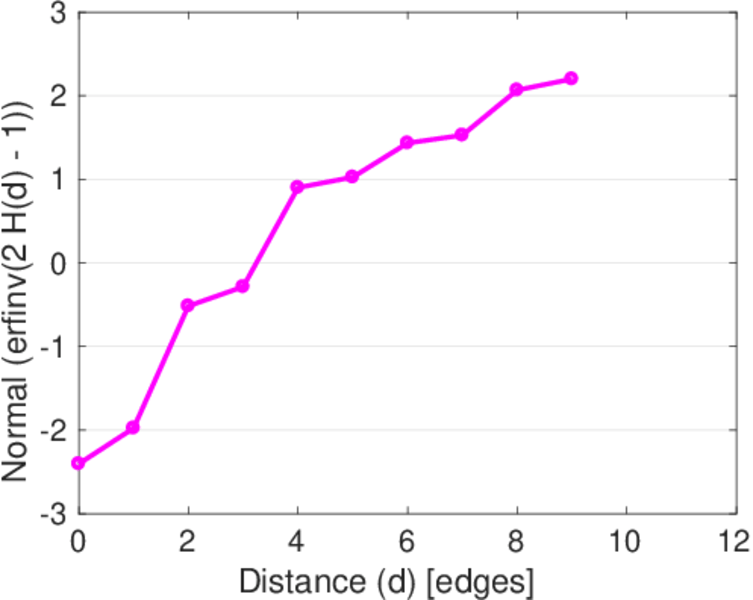
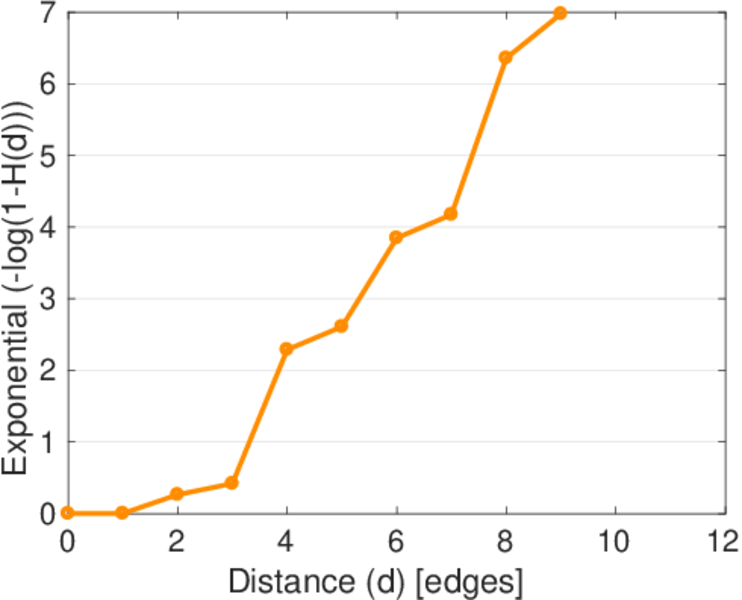
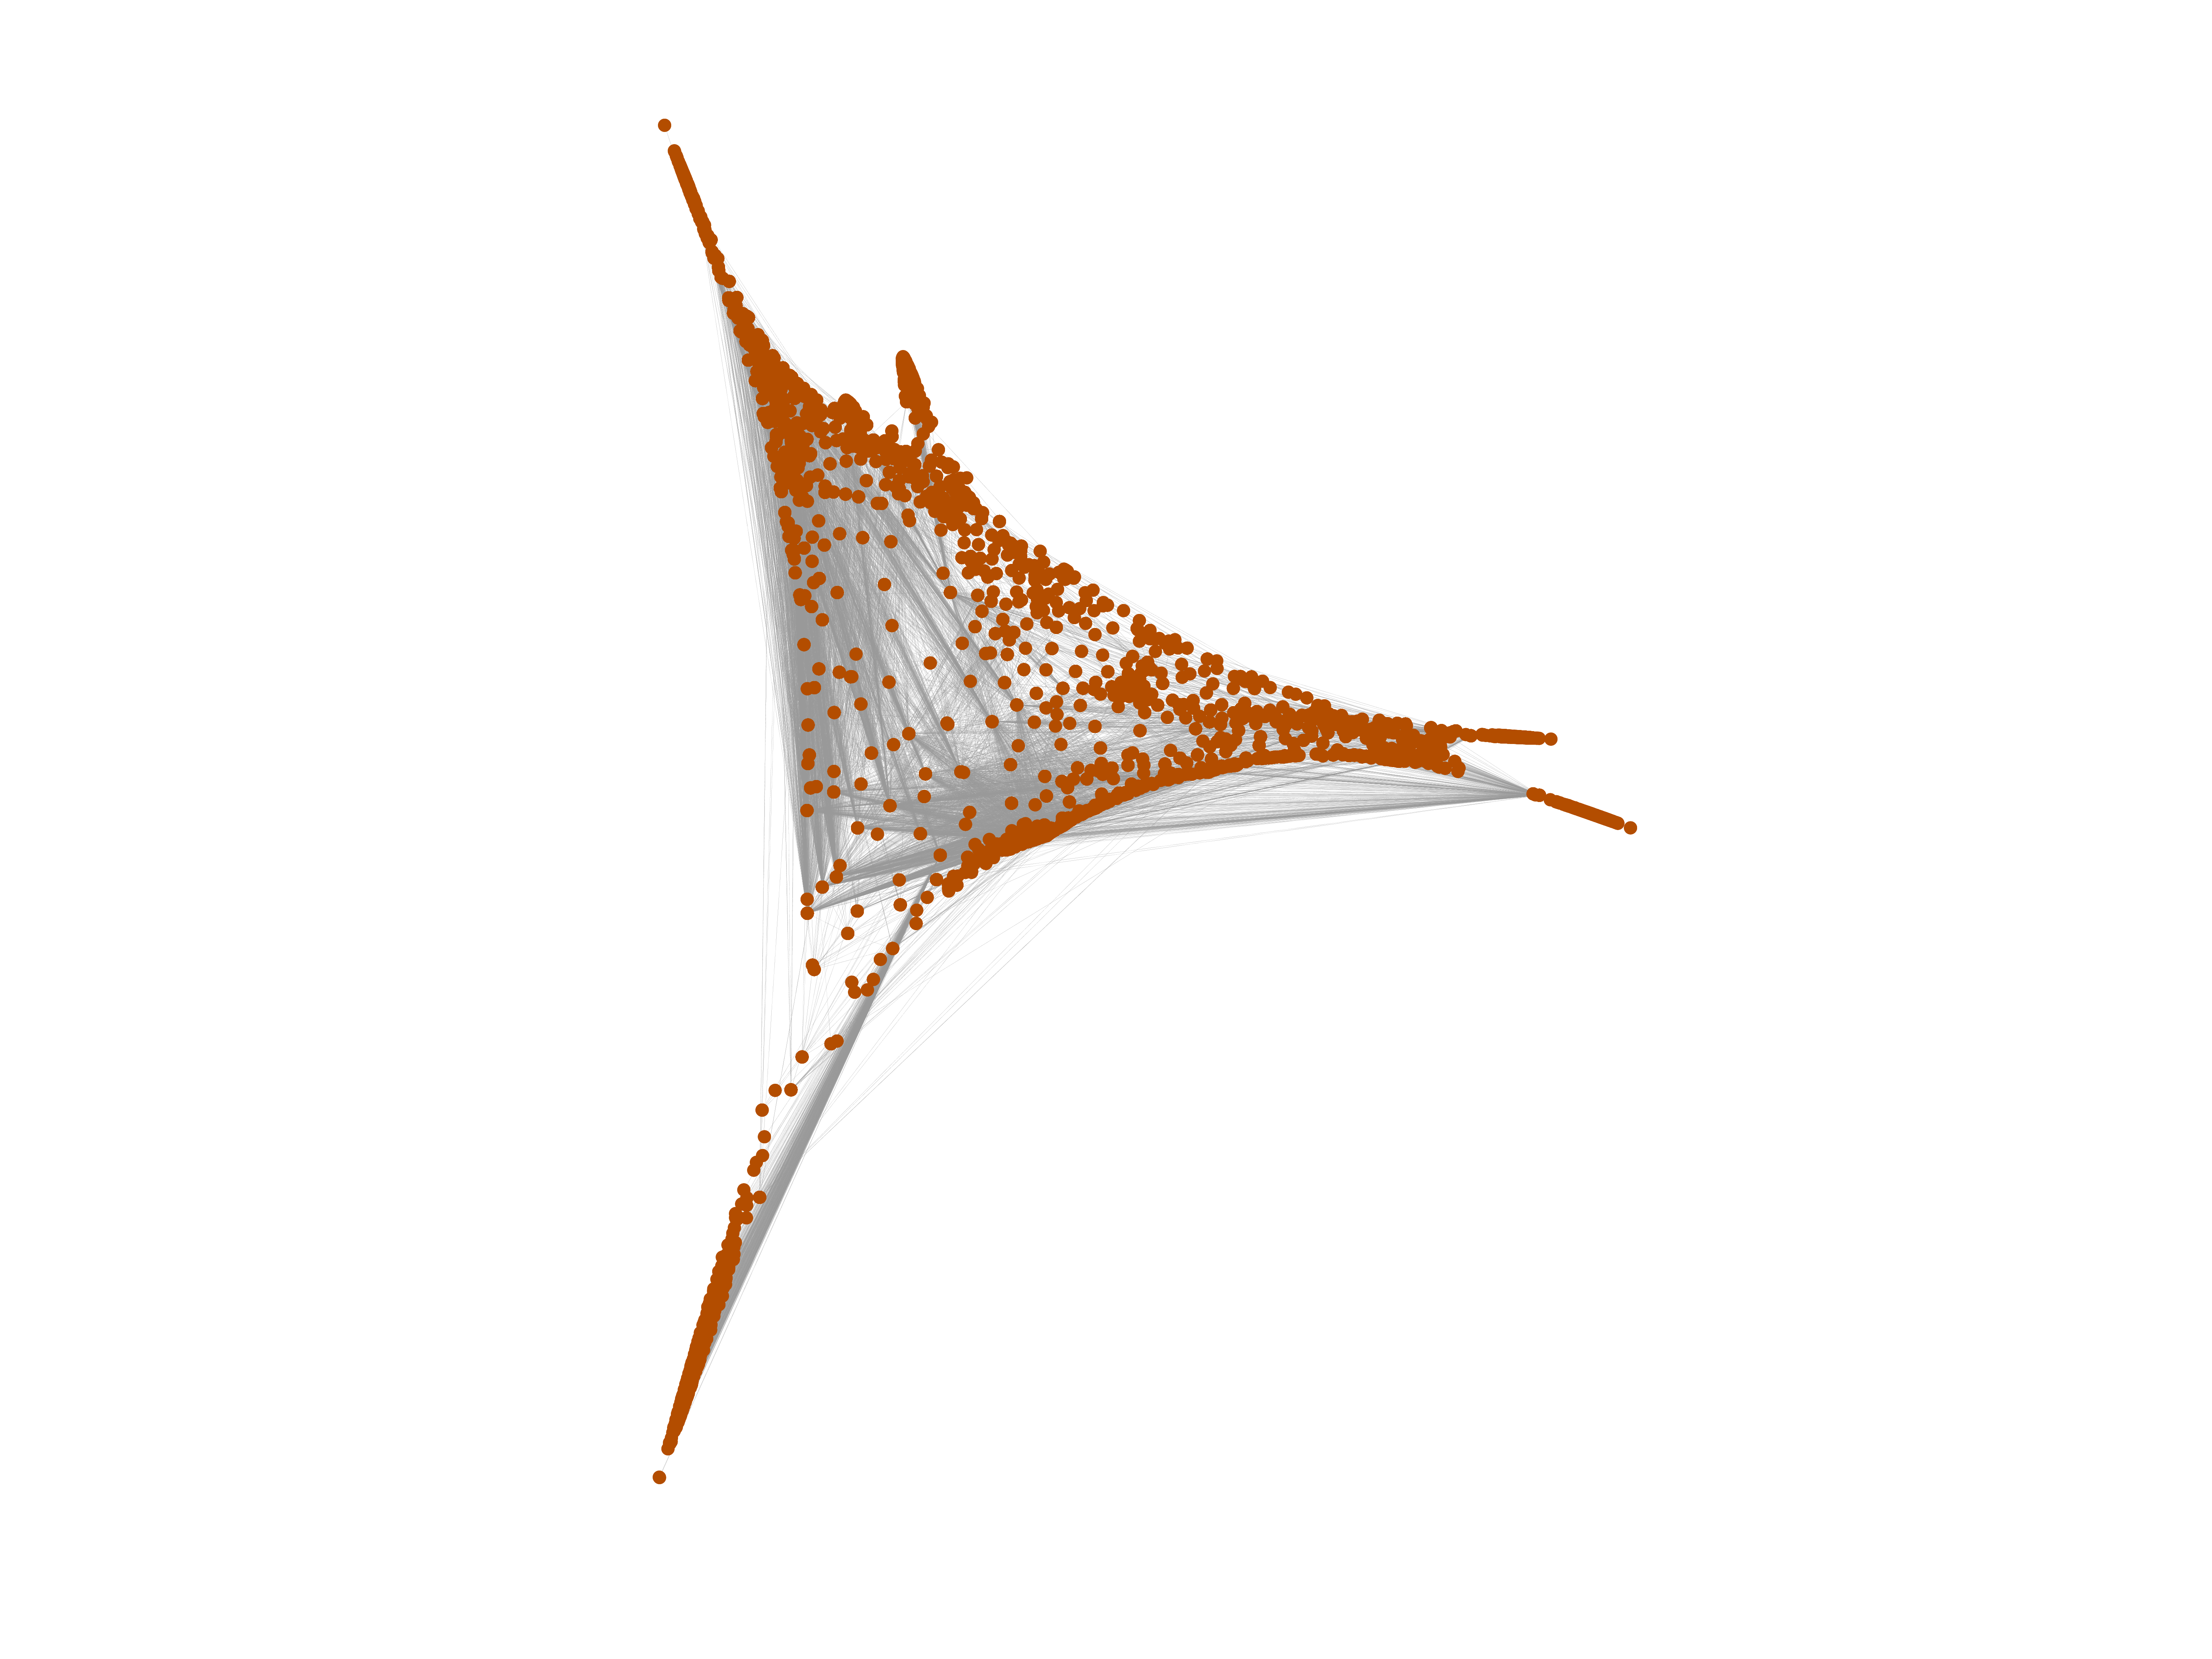
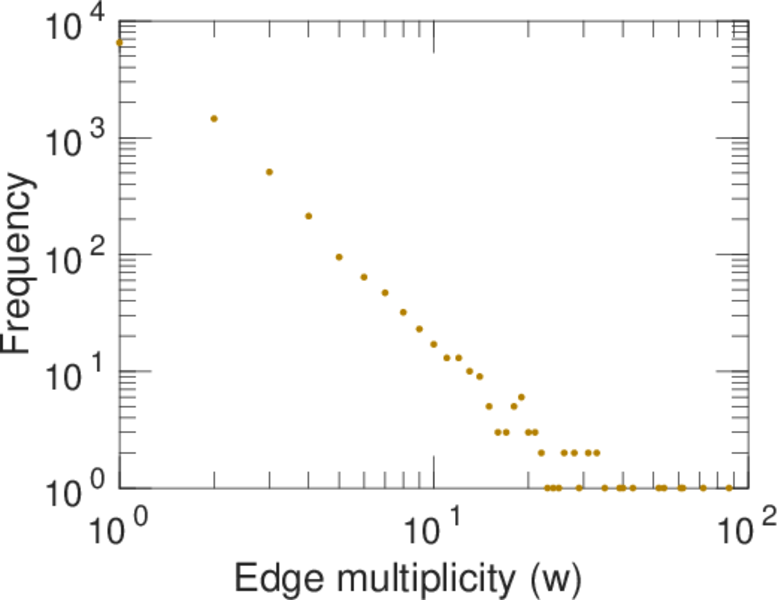
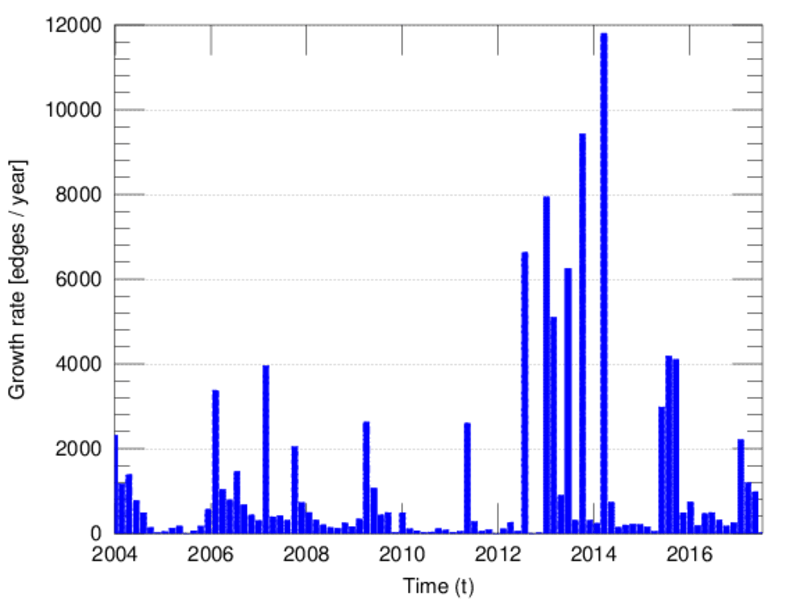
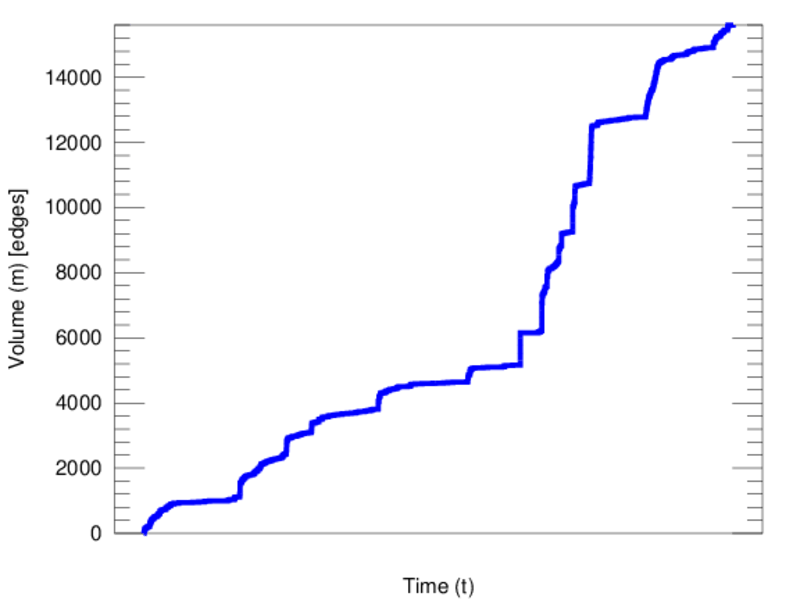
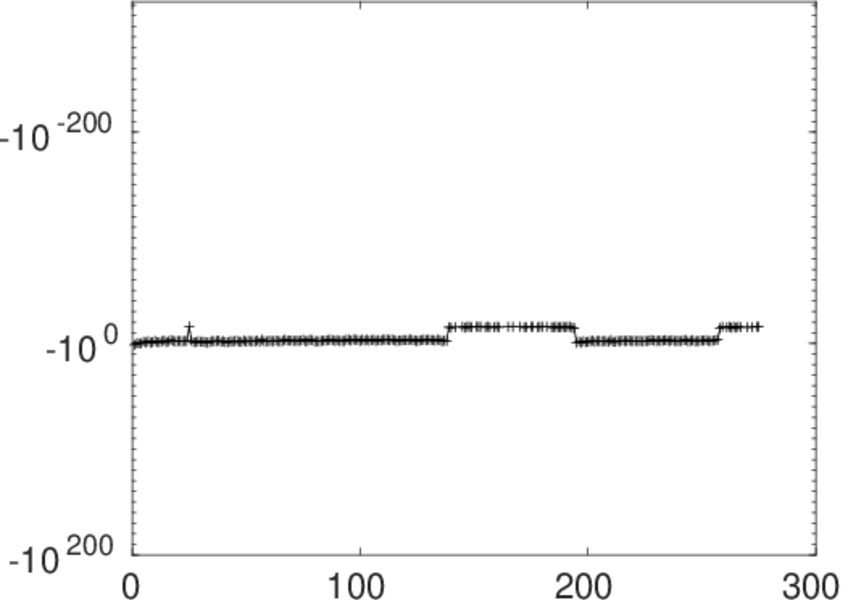
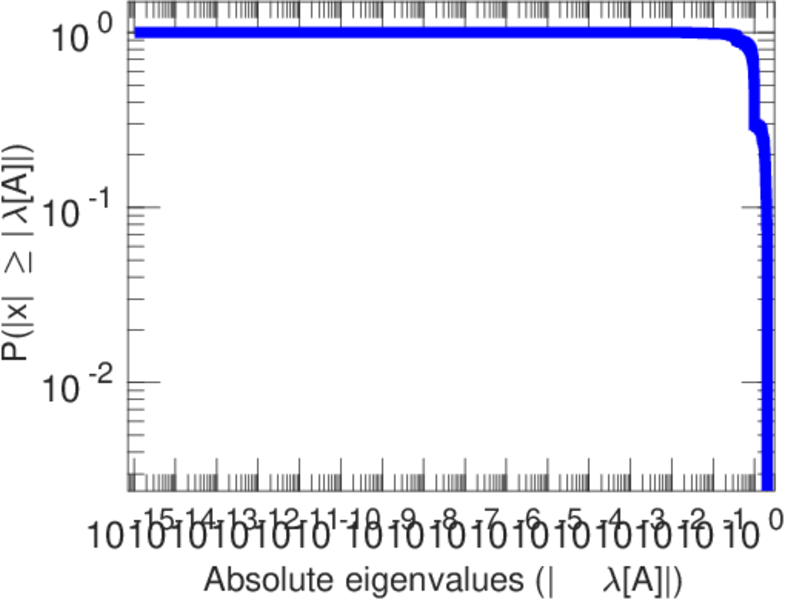
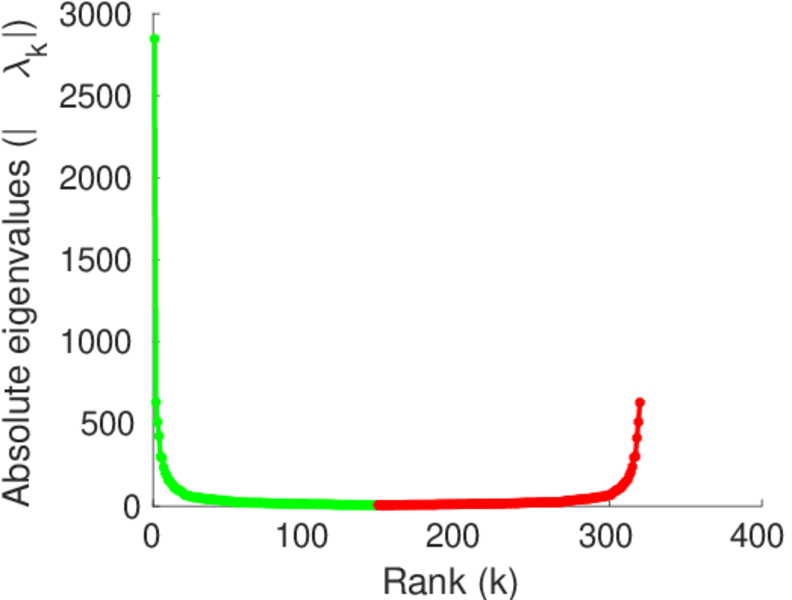
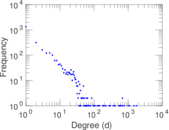
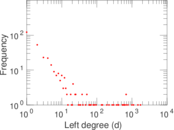
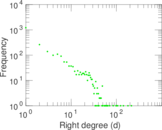
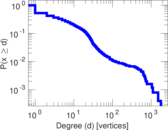
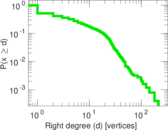
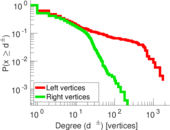
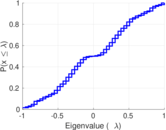
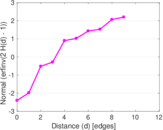
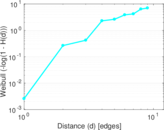
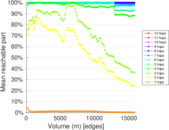
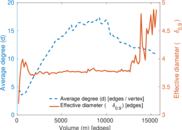
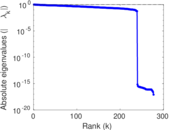
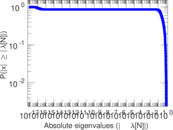
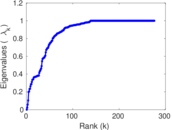
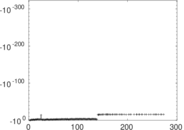
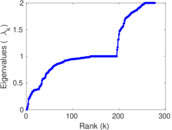
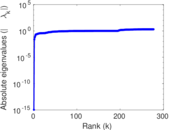
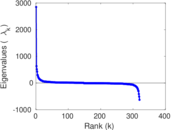
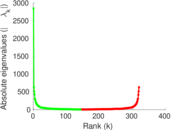
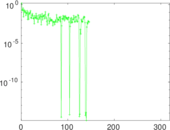
Plots


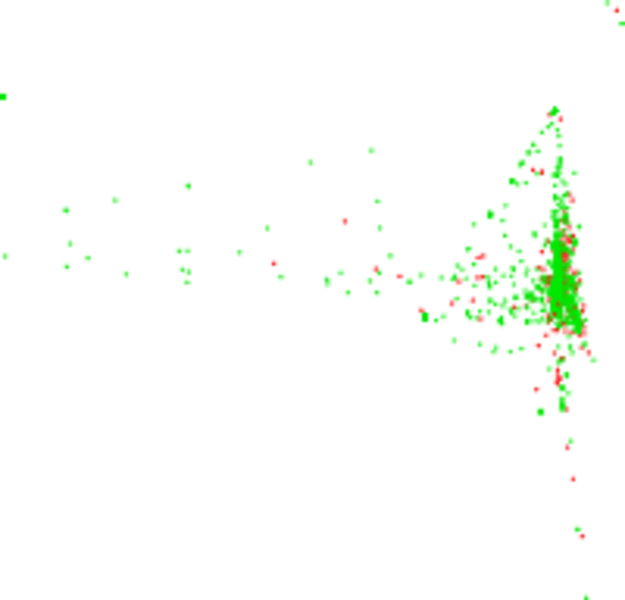
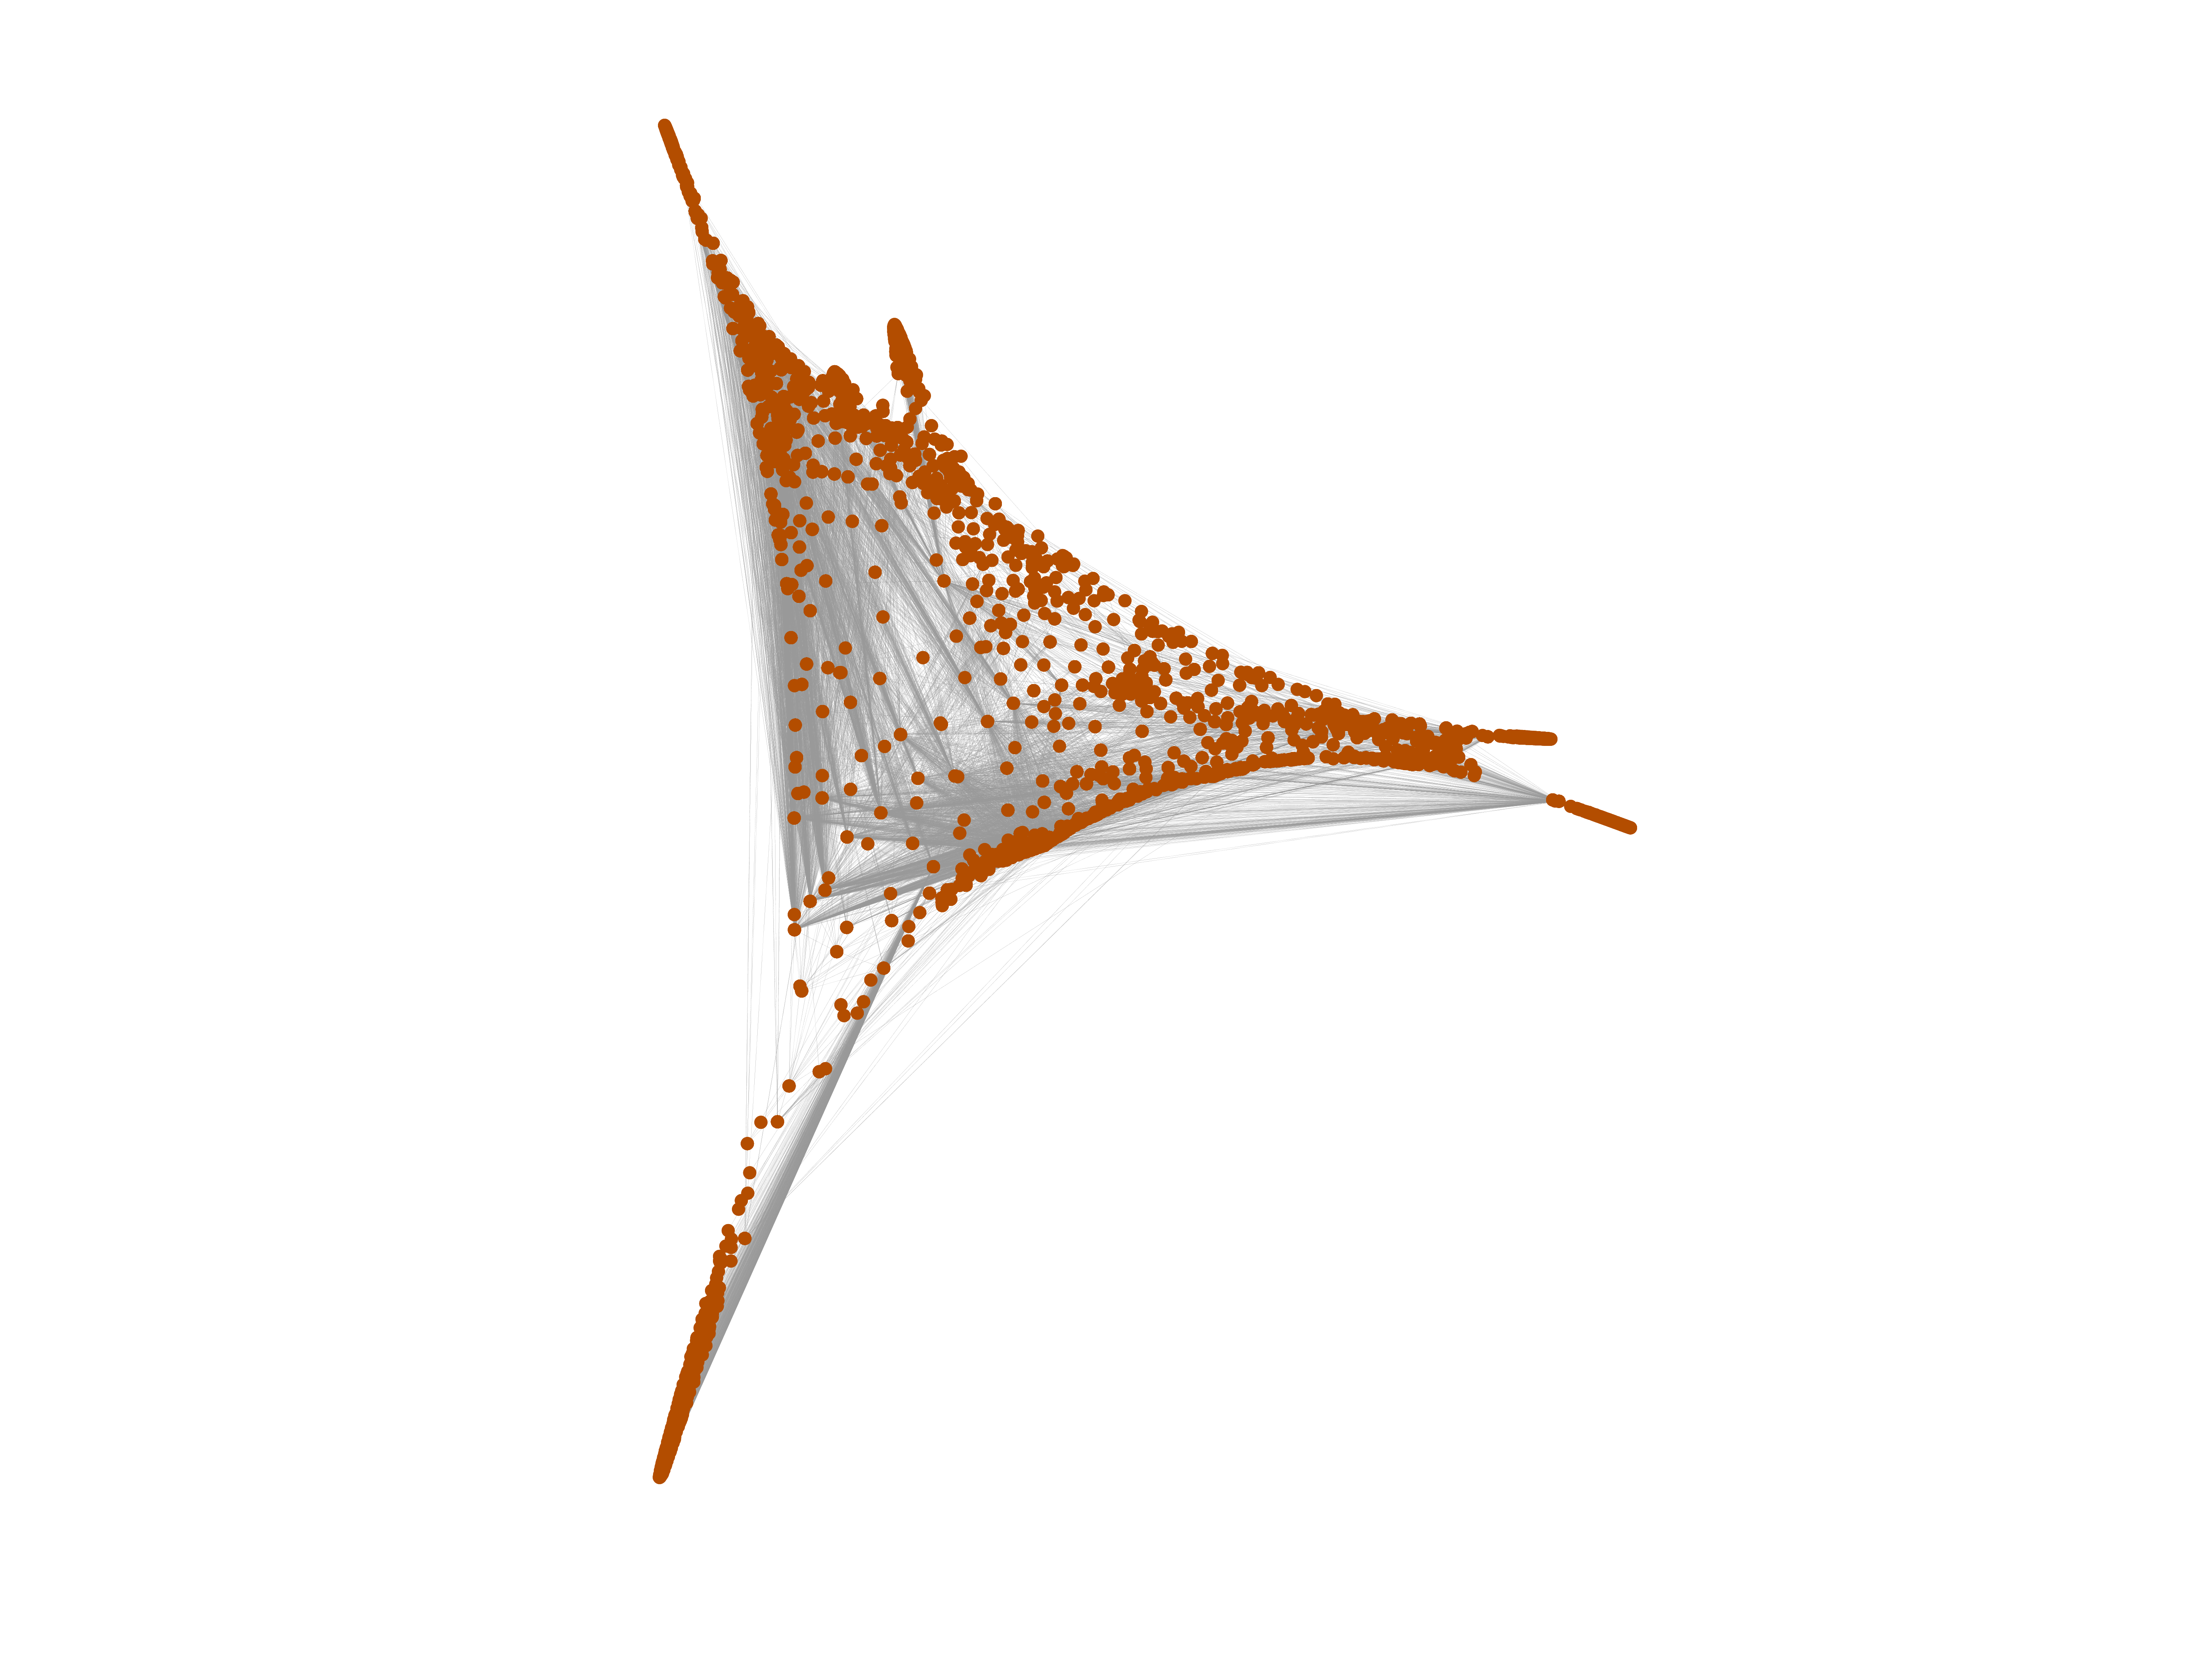
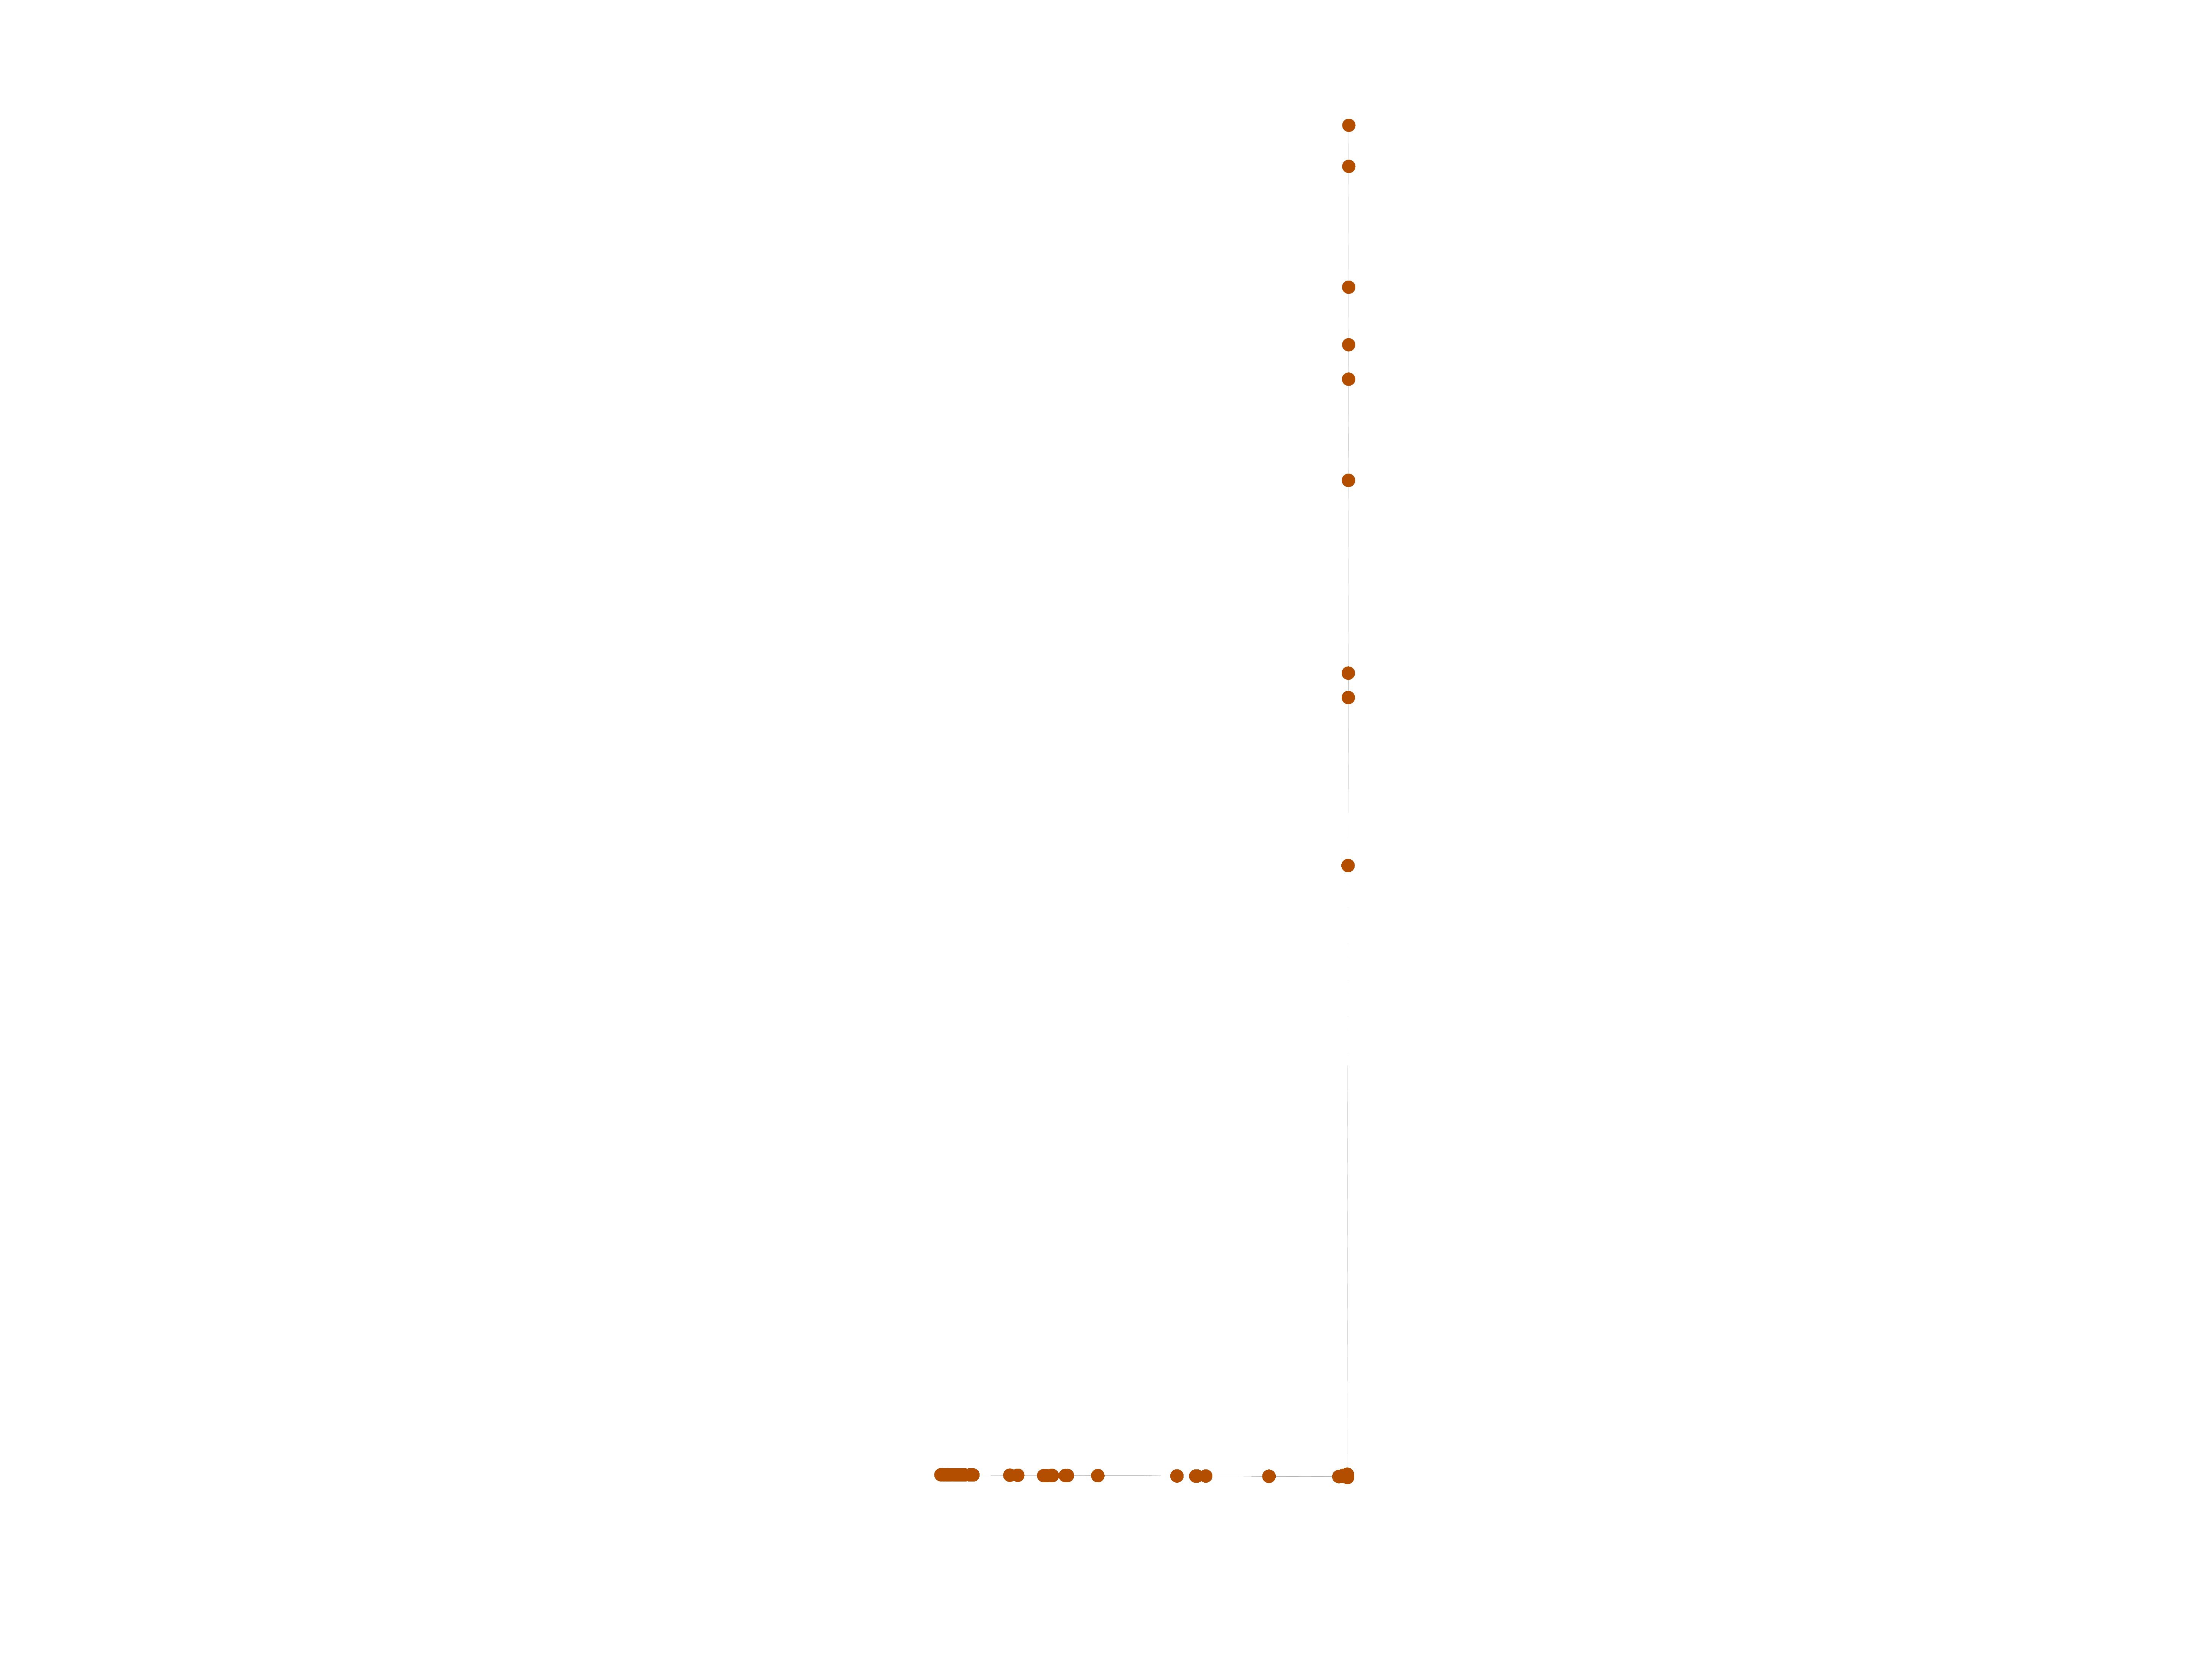
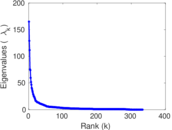
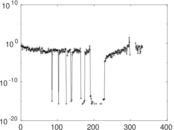
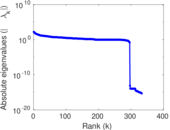
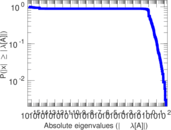
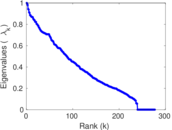
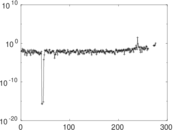
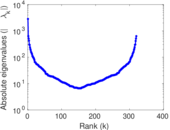
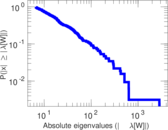
Matrix decompositions plots


Downloads
References
|
[1]
|
Jérôme Kunegis.
KONECT – The Koblenz Network Collection.
In Proc. Int. Conf. on World Wide Web Companion, pages
1343–1350, 2013.
[ http ]
|
|
[2]
|
Wikimedia Foundation.
Wikimedia downloads.
http://dumps.wikimedia.org/, January 2010.
|
 KONECT ‣ Networks ‣
Buy Me a Coffee
KONECT ‣ Networks ‣
Buy Me a Coffee