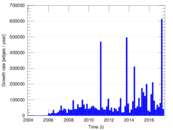
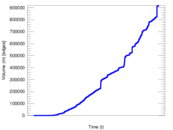
Wiktionary edits (ro)
This is the bipartite edit network of the Romanian Wiktionary. It contains
users and pages from the Romanian Wiktionary, connected by edit events. Each
edge represents an edit. The dataset includes the timestamp of each edit.
Metadata
Statistics
| Size | n = | 166,854
|
| Left size | n1 = | 867
|
| Right size | n2 = | 165,987
|
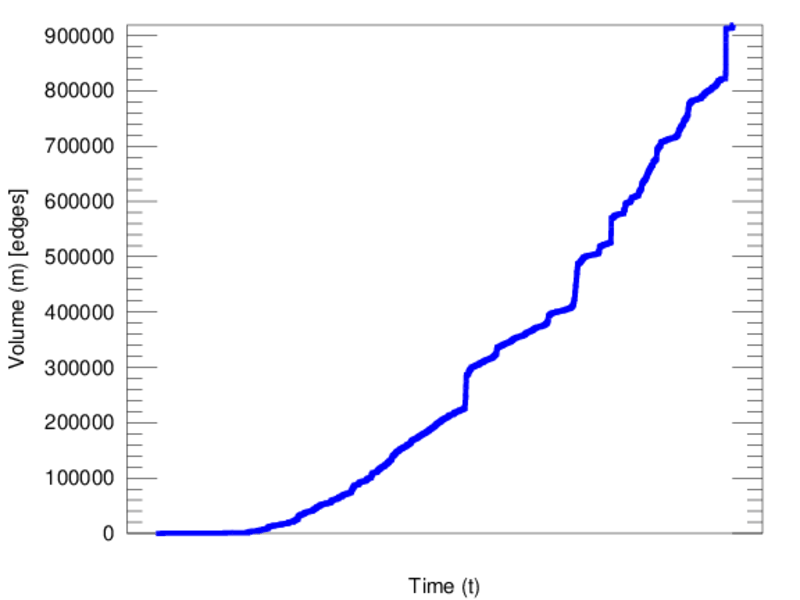
| Volume | m = | 918,811
|
| Unique edge count | m̿ = | 575,679
|
| Wedge count | s = | 18,328,824,575
|
| Claw count | z = | 600,503,632,946,949
|
| Cross count | x = | 1.721 72 × 1019
|
| Square count | q = | 11,445,252,531
|
| 4-Tour count | T4 = | 164,878,646,470
|
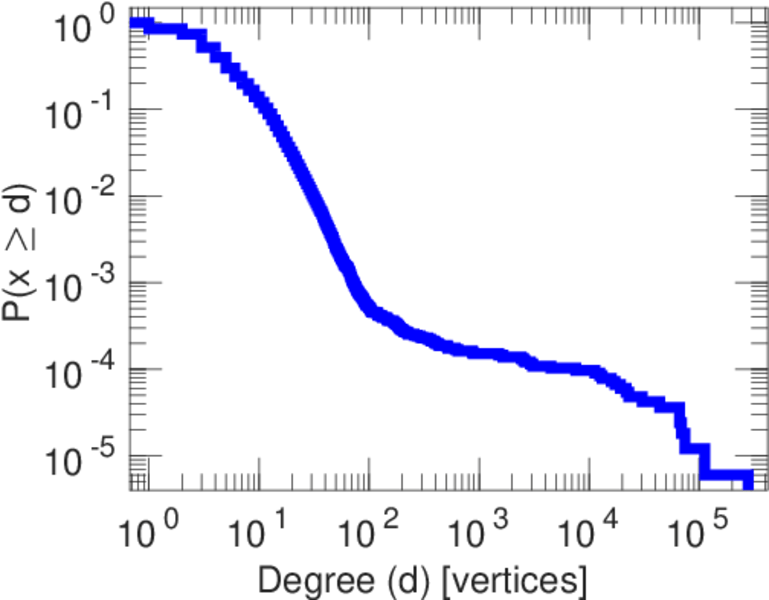
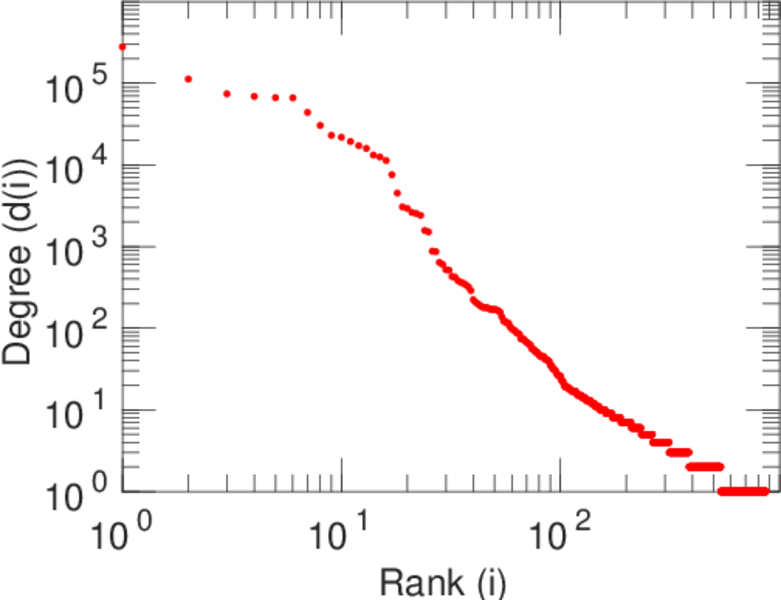
| Maximum degree | dmax = | 278,712
|
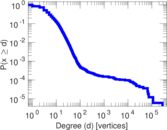
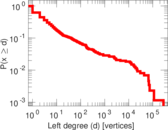
| Maximum left degree | d1max = | 278,712
|
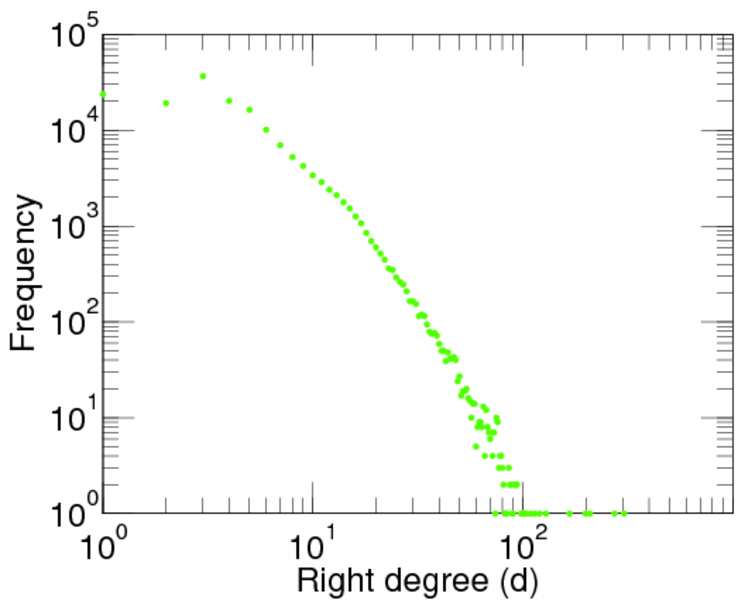
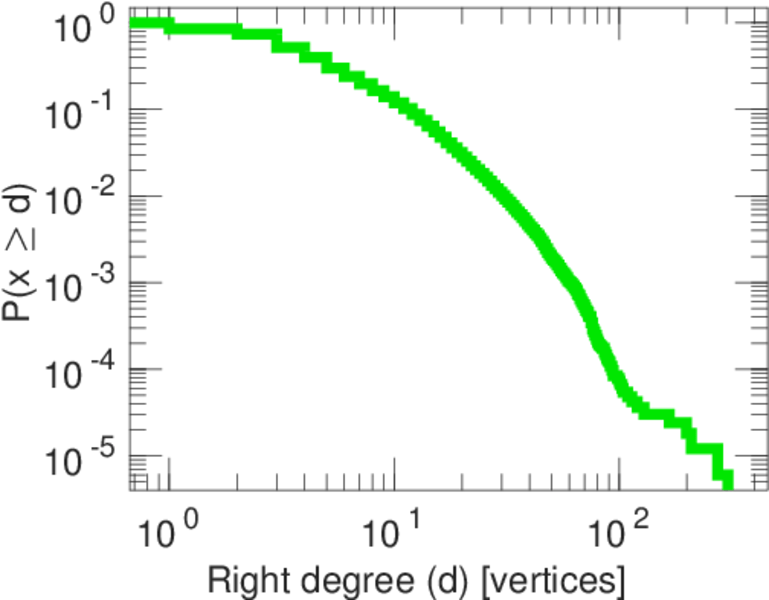
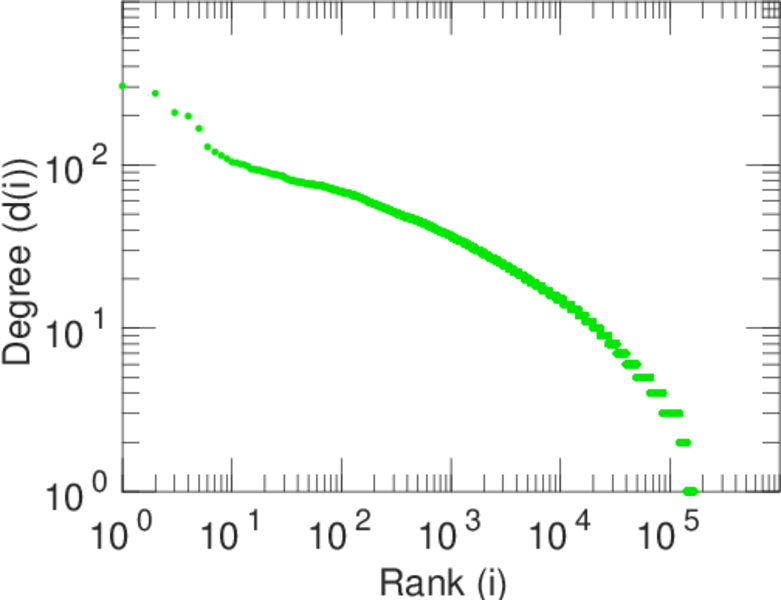
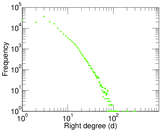
| Maximum right degree | d2max = | 304
|
| Average degree | d = | 11.013 4
|
| Average left degree | d1 = | 1,059.76
|
| Average right degree | d2 = | 5.535 44
|
| Fill | p = | 0.004 000 25
|
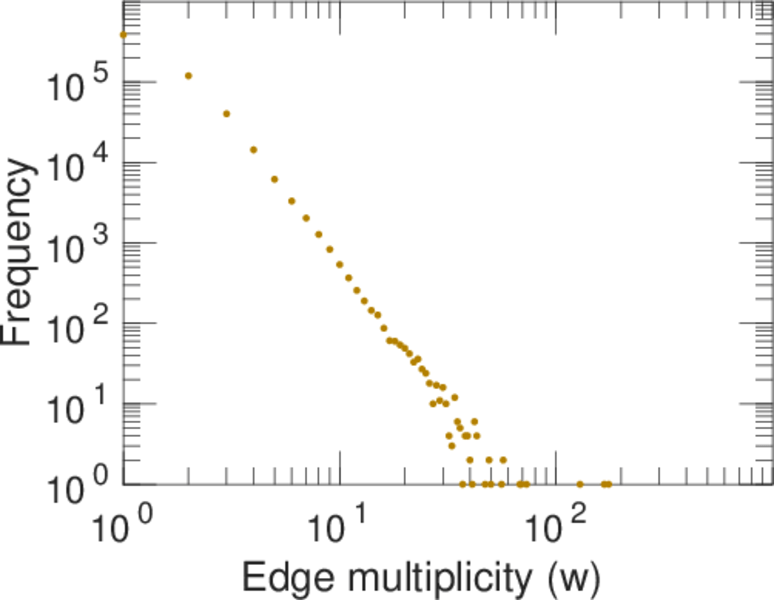
| Average edge multiplicity | m̃ = | 1.596 05
|
| Size of LCC | N = | 166,479
|
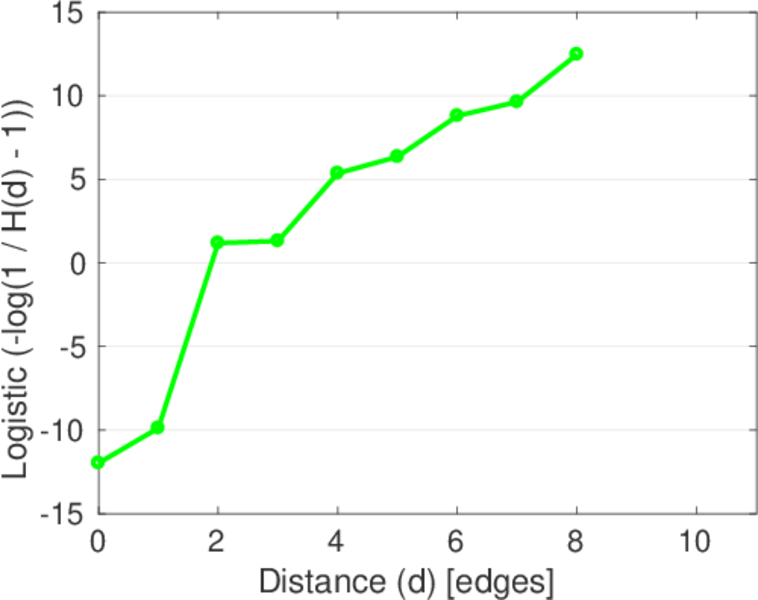
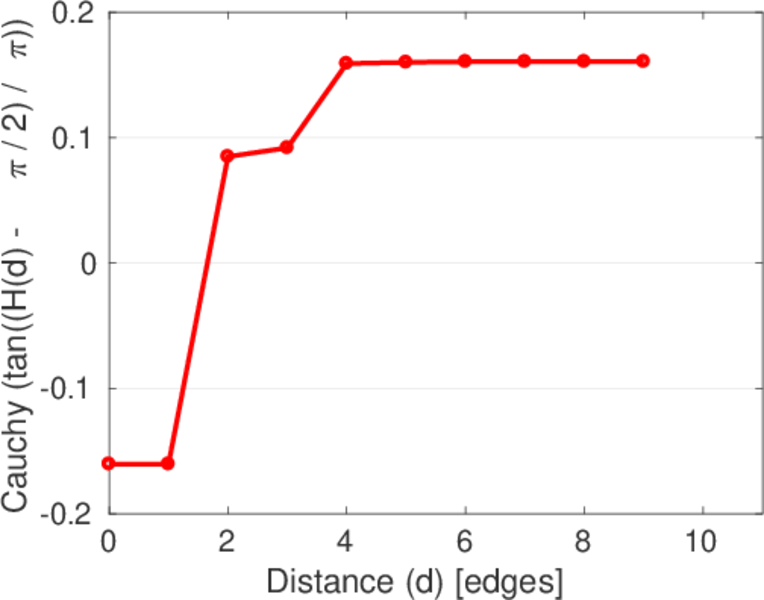
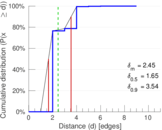
| Diameter | δ = | 12
|
| 50-Percentile effective diameter | δ0.5 = | 1.653 12
|
| 90-Percentile effective diameter | δ0.9 = | 3.541 61
|
| Median distance | δM = | 2
|
| Mean distance | δm = | 2.453 69
|
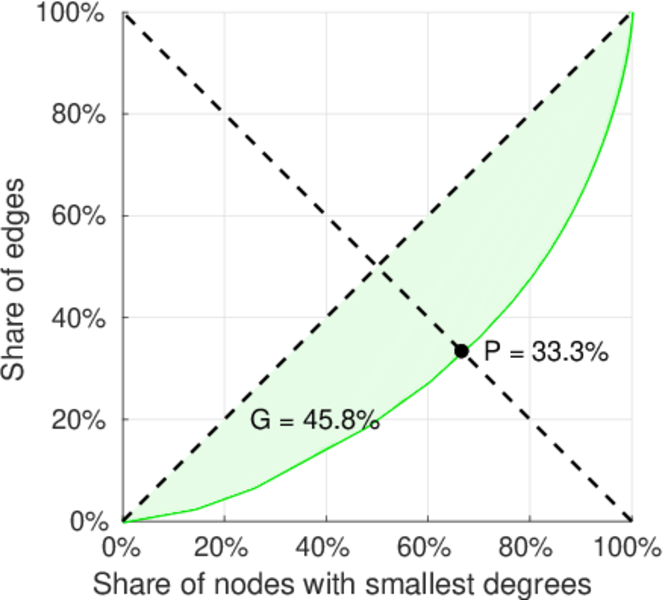
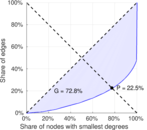
| Gini coefficient | G = | 0.728 221
|
| Balanced inequality ratio | P = | 0.224 547
|
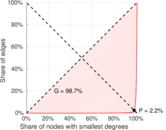
| Left balanced inequality ratio | P1 = | 0.022 199 3
|
| Right balanced inequality ratio | P2 = | 0.332 811
|
| Relative edge distribution entropy | Her = | 0.659 762
|
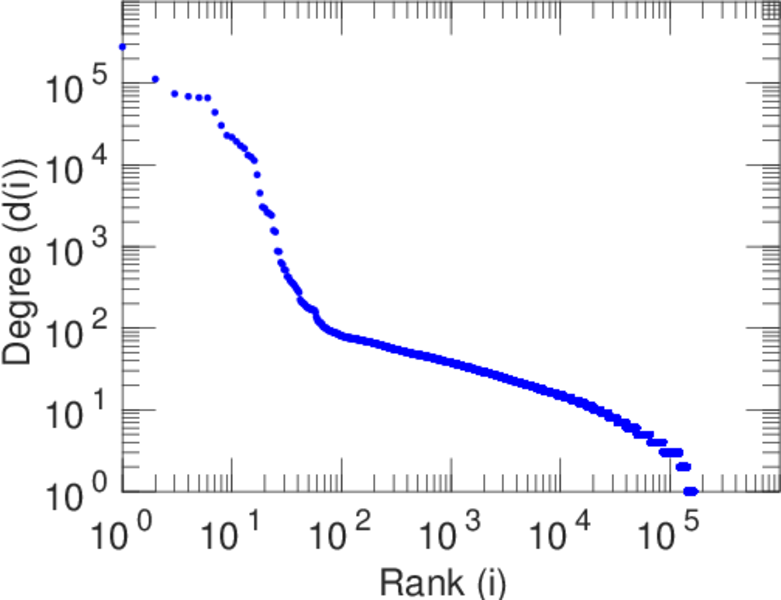
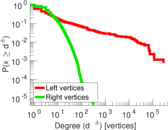
| Power law exponent | γ = | 1.973 22
|
| Tail power law exponent | γt = | 4.641 00
|
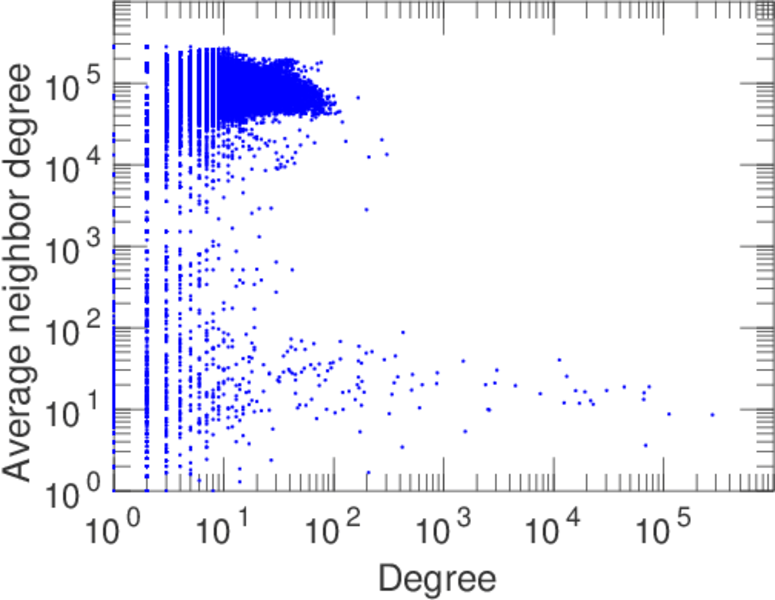
| Degree assortativity | ρ = | −0.391 889
|
| Degree assortativity p-value | pρ = | 0.000 00
|
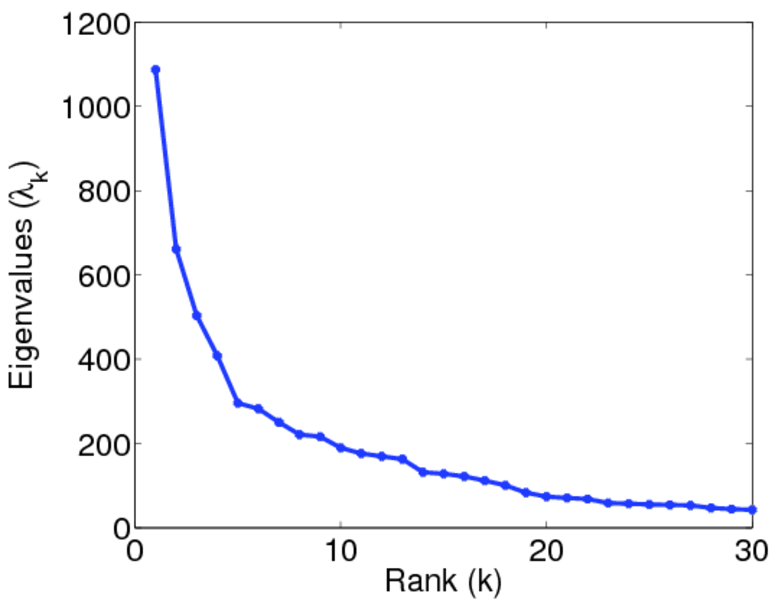
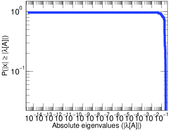
| Spectral norm | α = | 1,087.07
|
| Algebraic connectivity | a = | 0.048 187 6
|
| Controllability | C = | 165,138
|
| Relative controllability | Cr = | 0.990 226
|
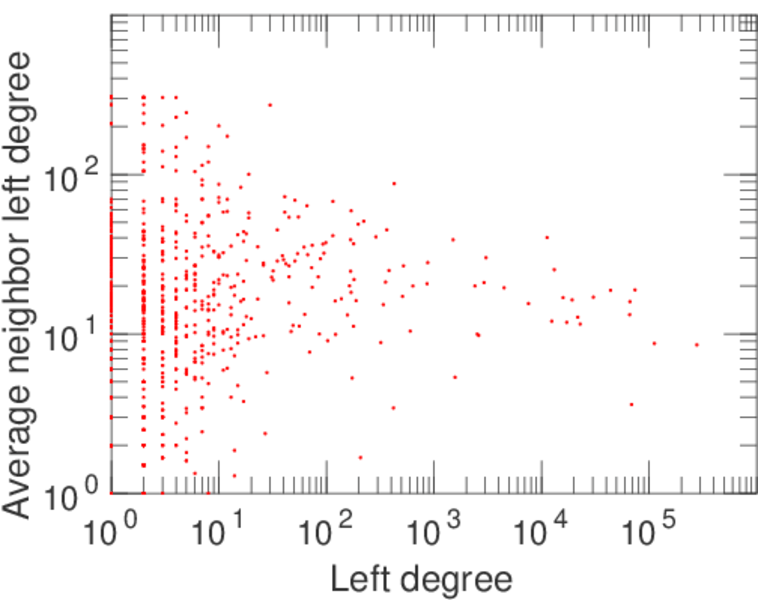
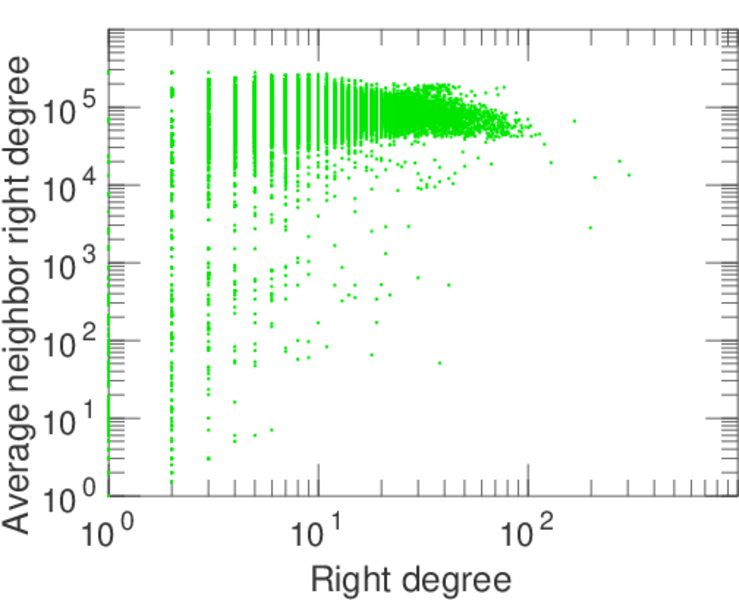
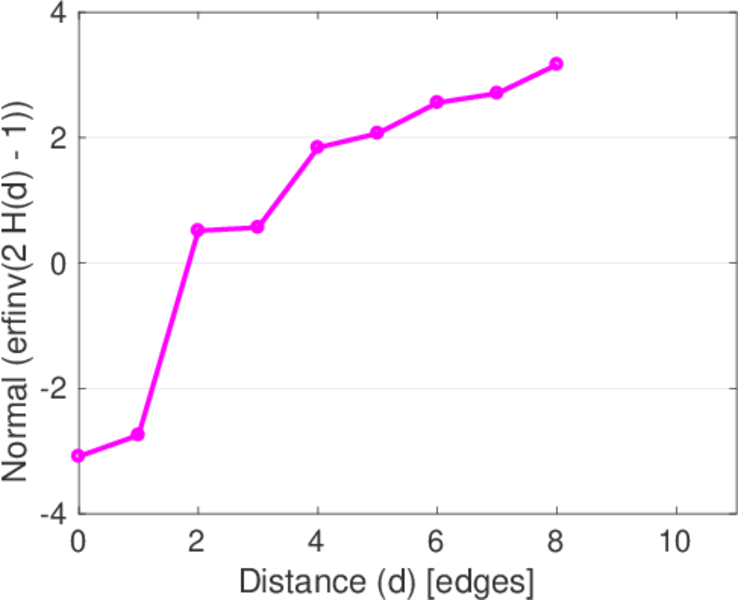
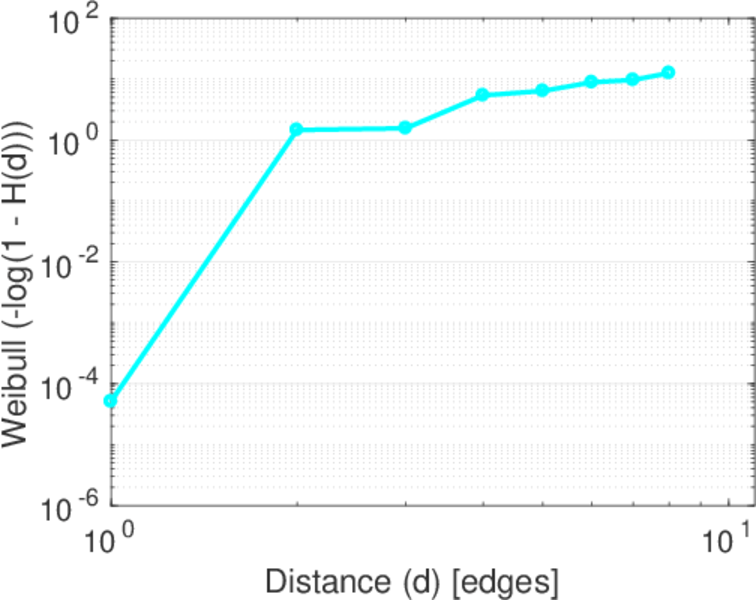
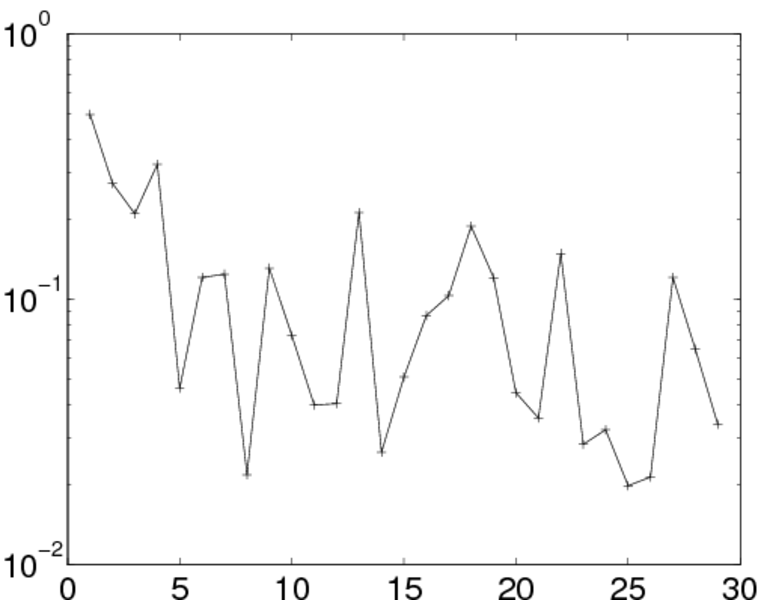
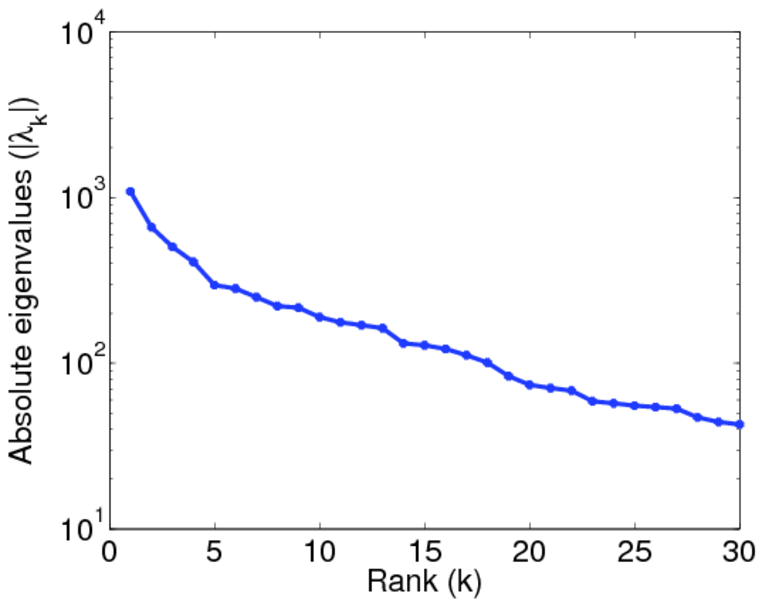
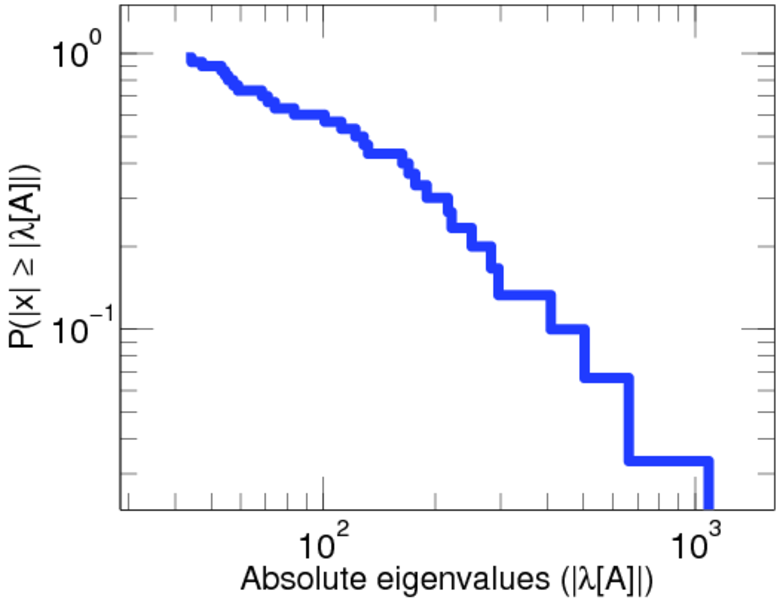
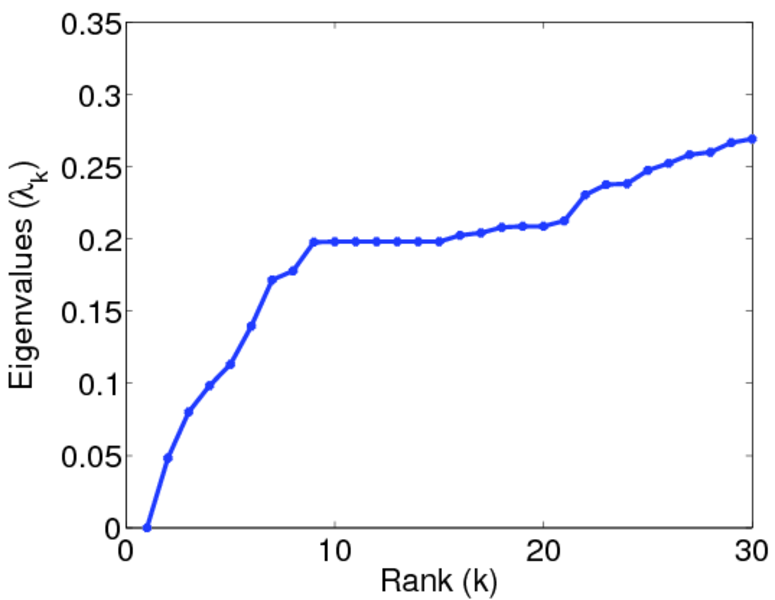
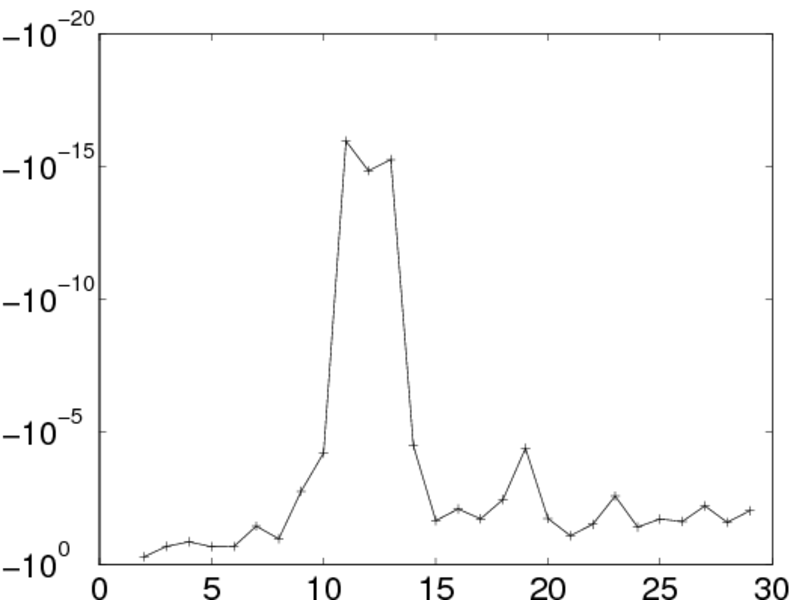
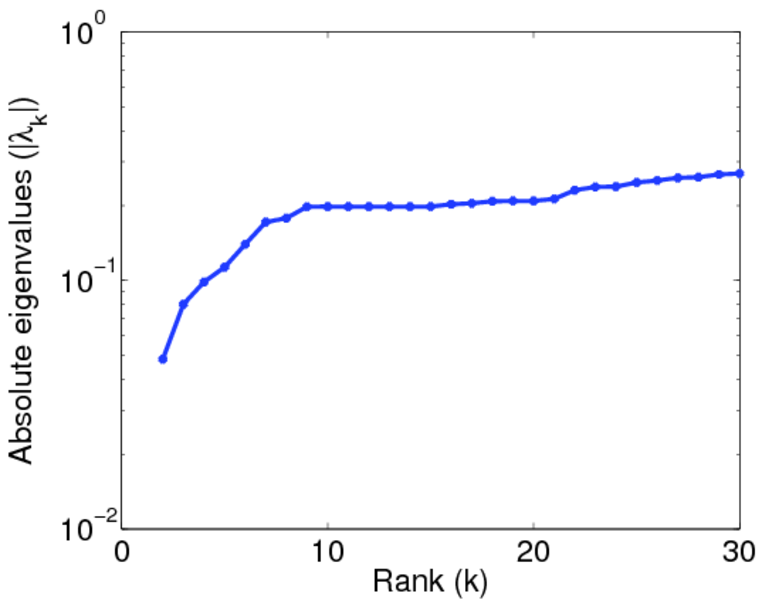
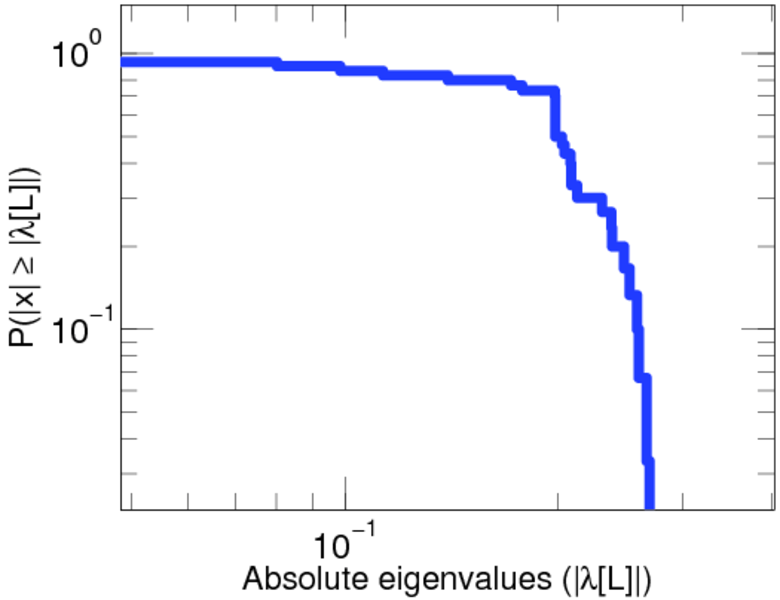
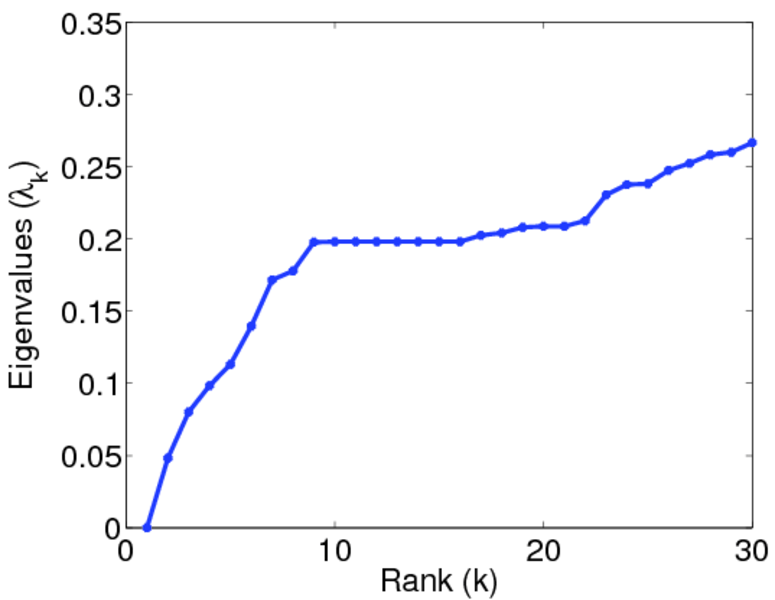
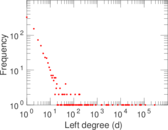
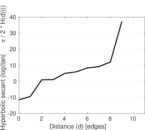
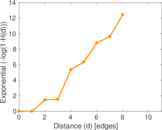
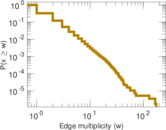
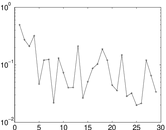
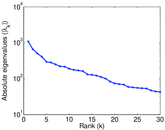
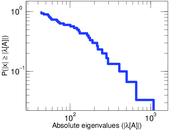
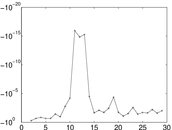
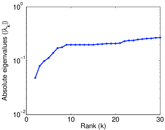
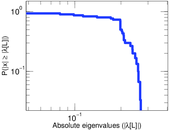
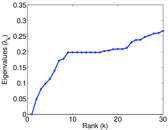
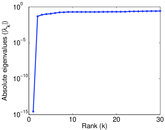
Plots


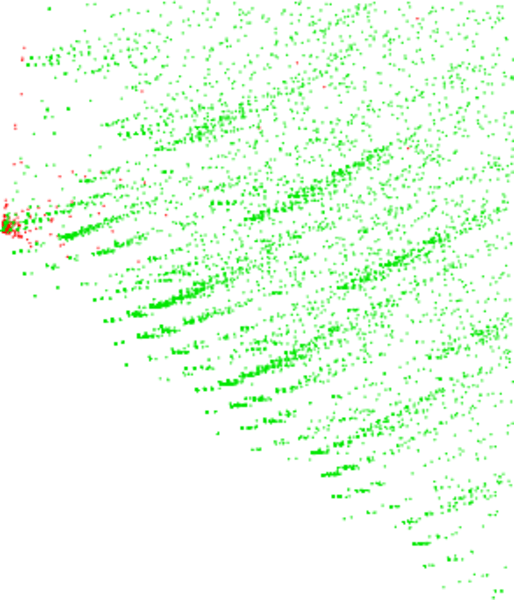
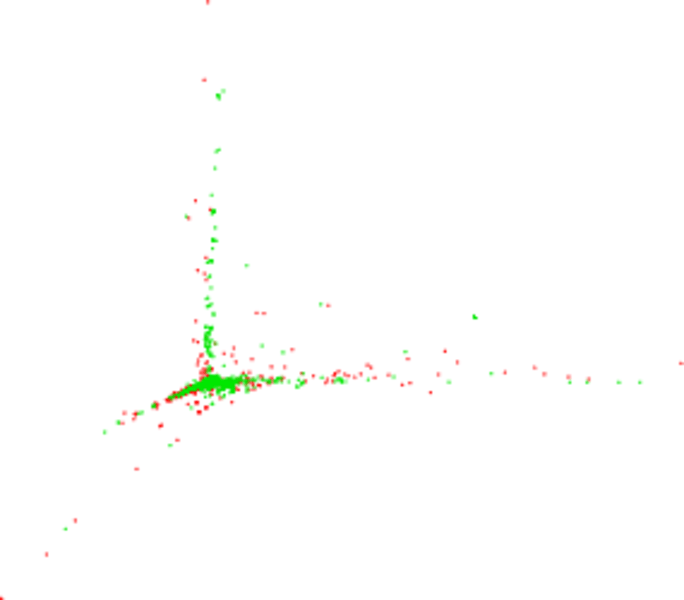
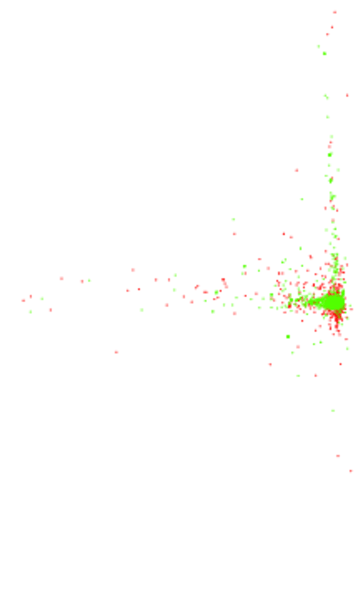
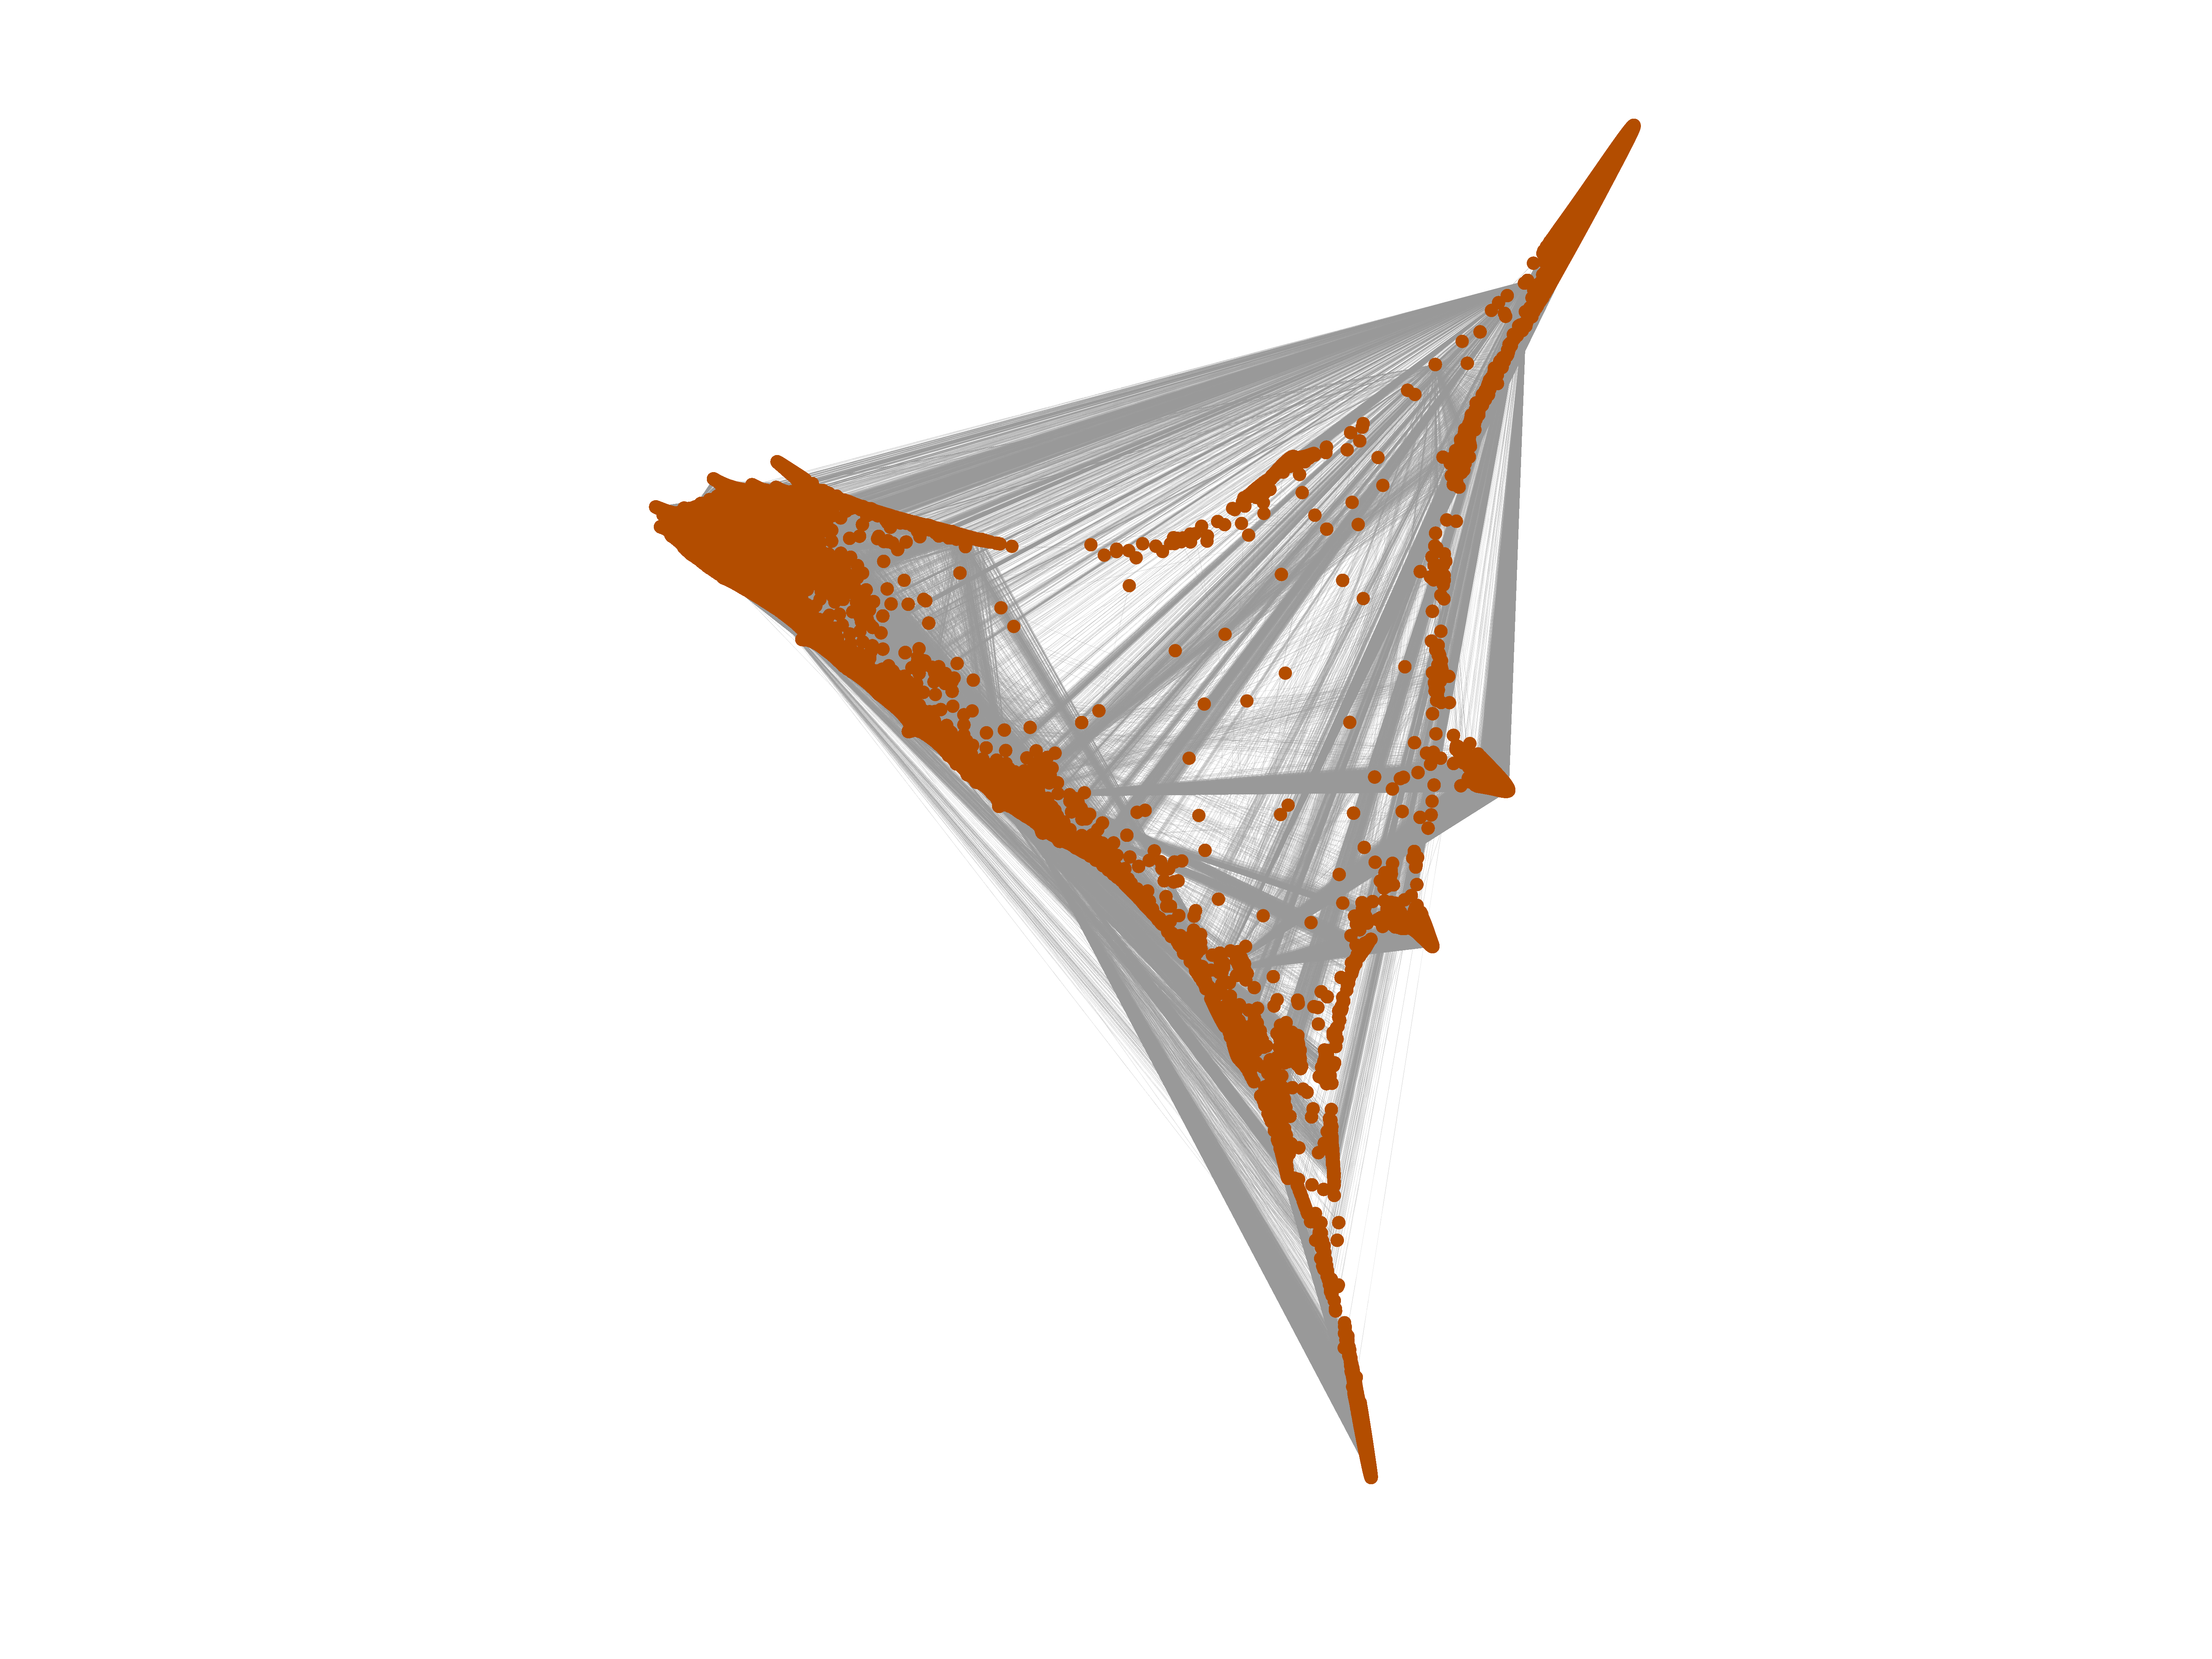
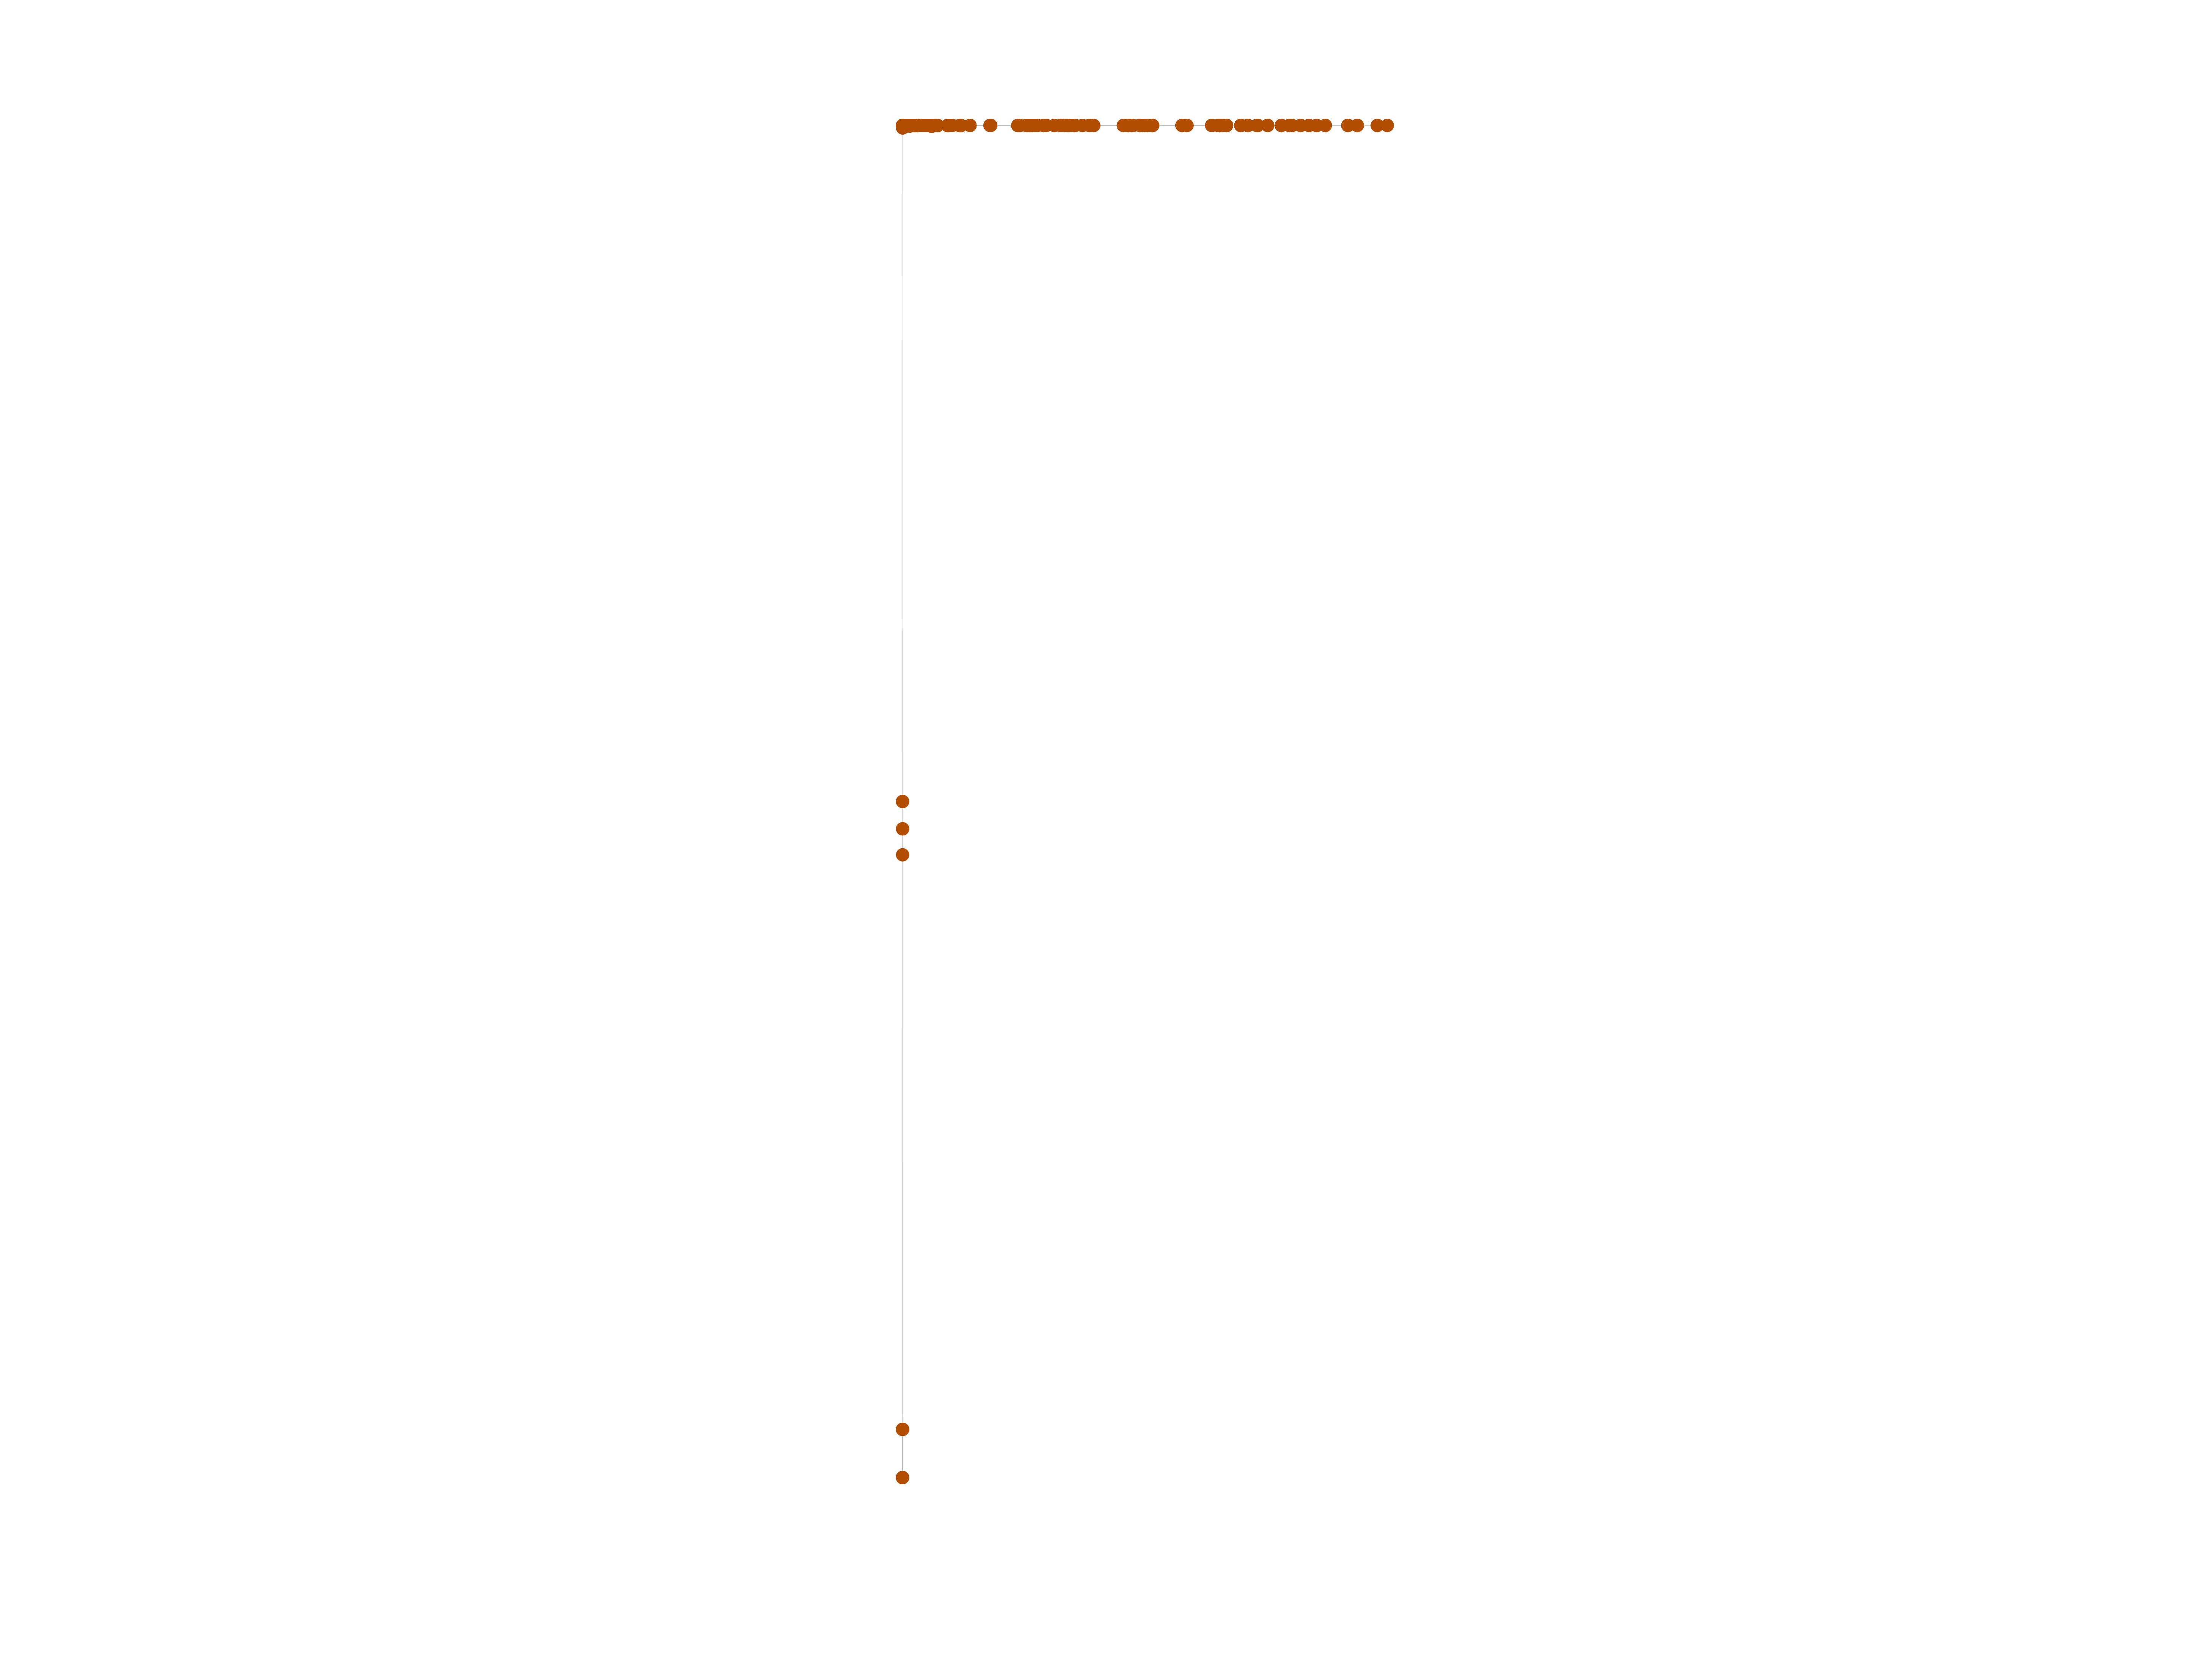
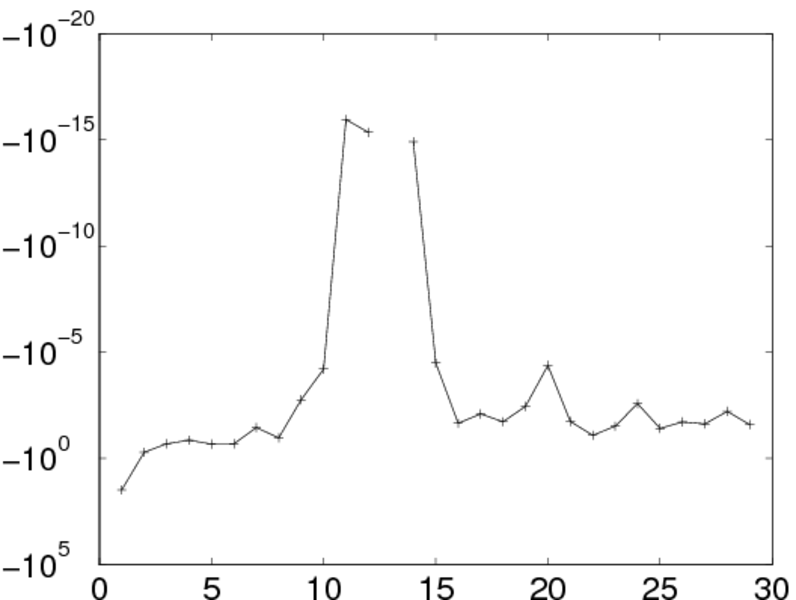
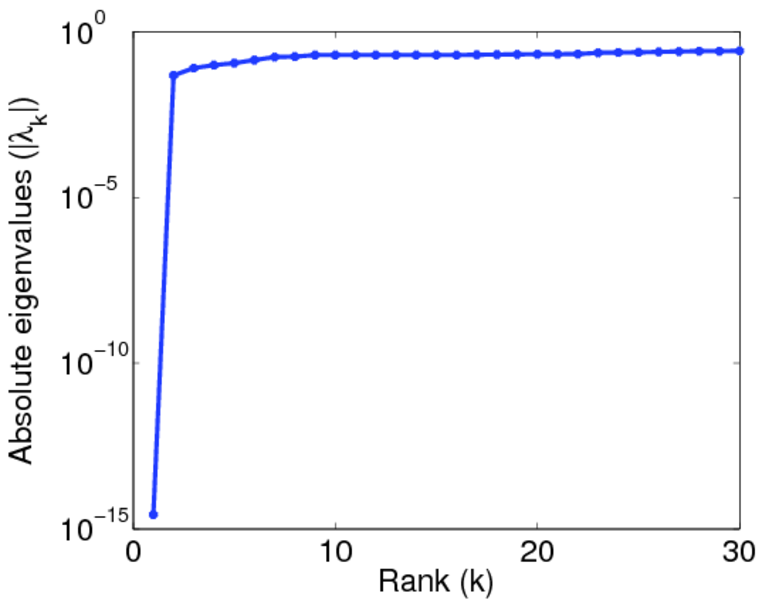
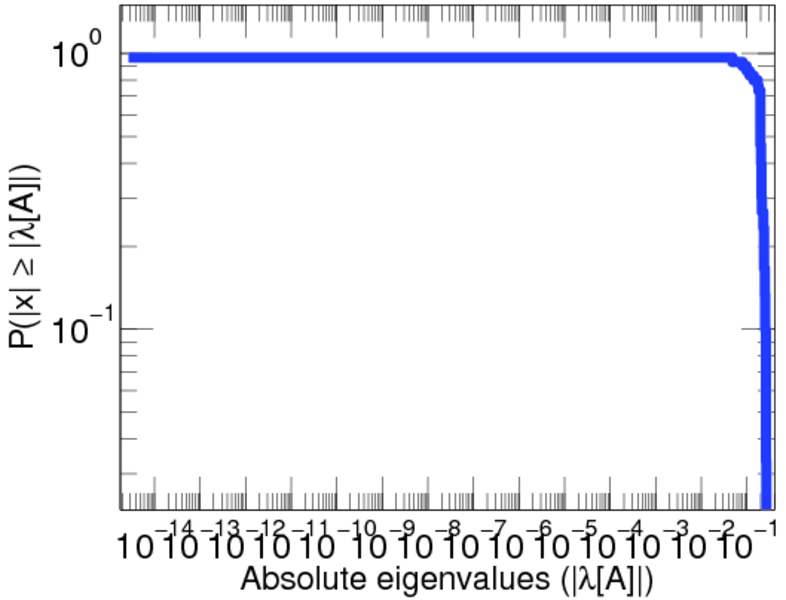
Matrix decompositions plots


Downloads
References
|
[1]
|
Jérôme Kunegis.
KONECT – The Koblenz Network Collection.
In Proc. Int. Conf. on World Wide Web Companion, pages
1343–1350, 2013.
[ http ]
|
|
[2]
|
Wikimedia Foundation.
Wikimedia downloads.
http://dumps.wikimedia.org/, January 2010.
|
 KONECT ‣ Networks ‣
Buy Me a Coffee
KONECT ‣ Networks ‣
Buy Me a Coffee