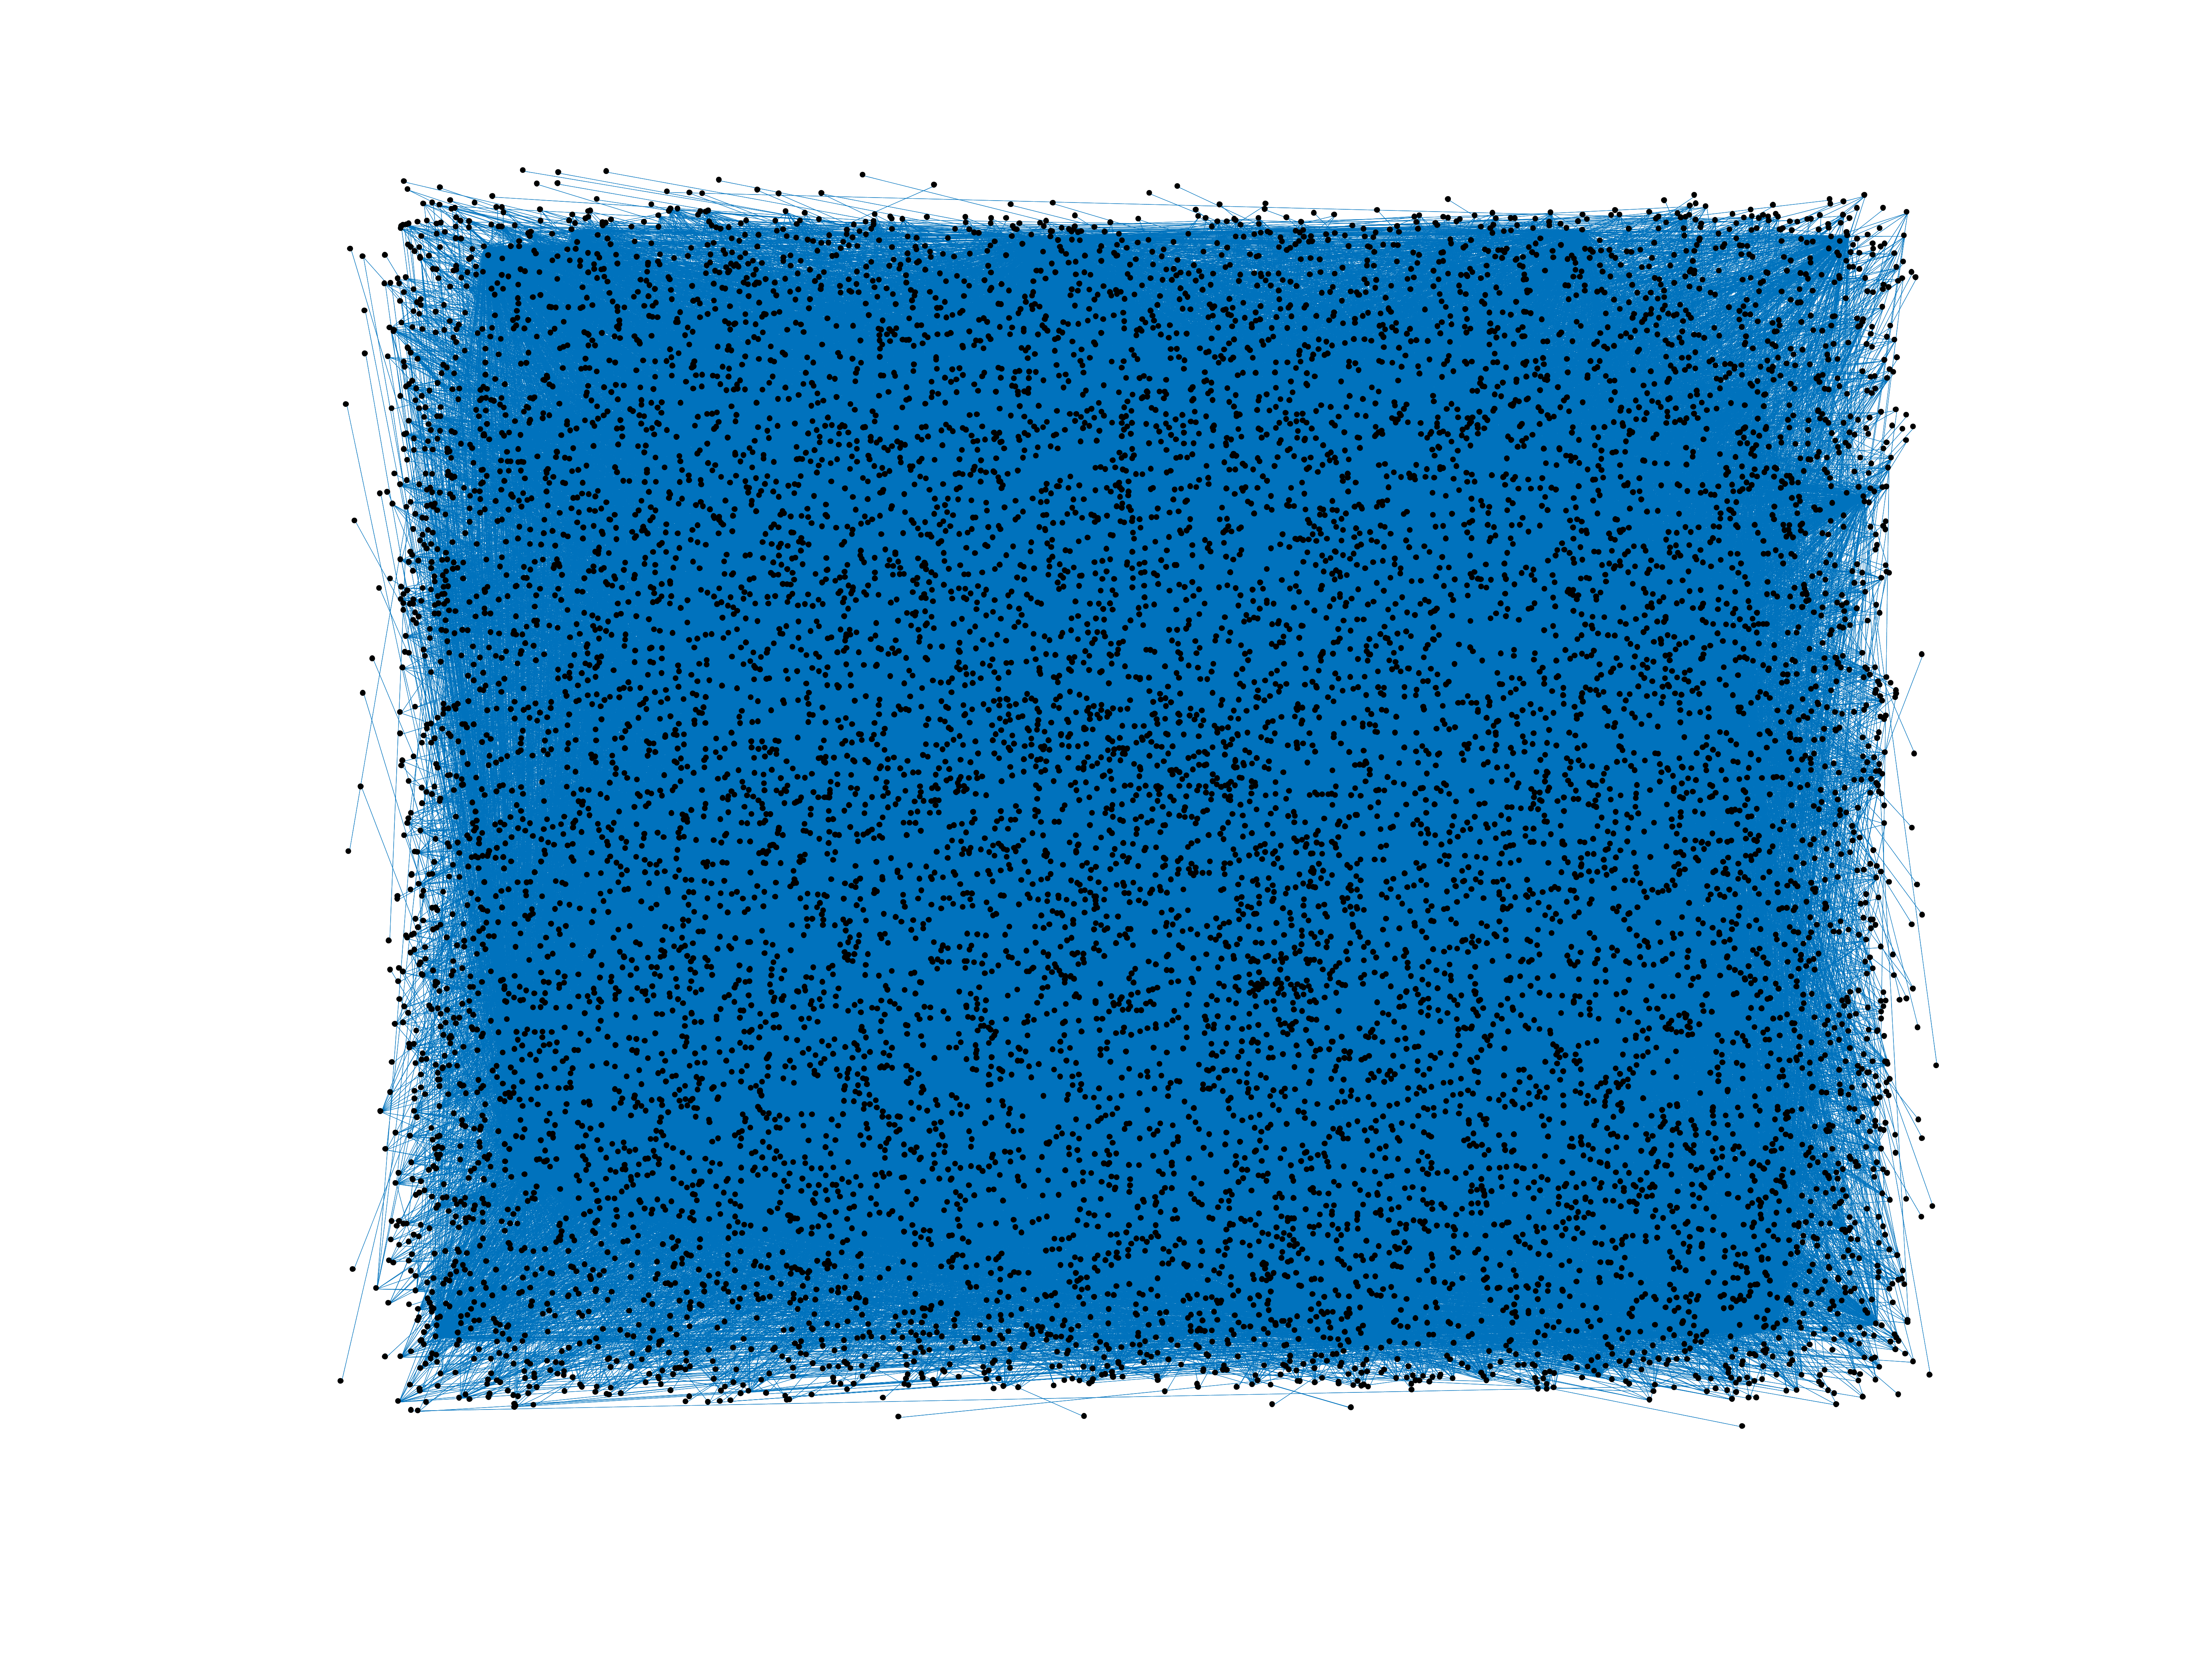
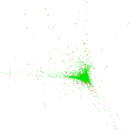
Wikipedia edits (rue)
This is the bipartite edit network of the Rusyn Wikipedia. It contains users
and pages from the Rusyn Wikipedia, connected by edit events. Each edge
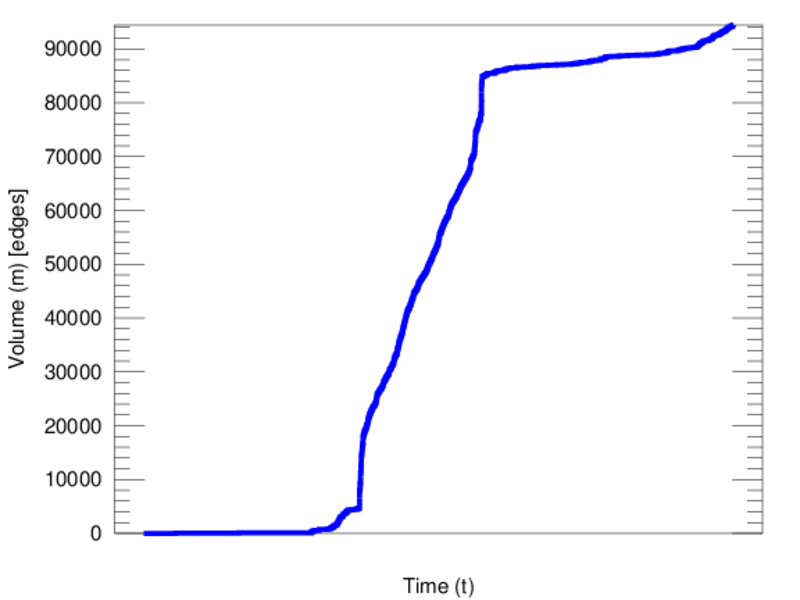
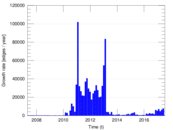
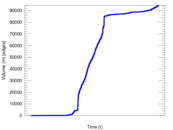
represents an edit. The dataset includes the timestamp of each edit.
Metadata
Statistics
| Size | n = | 11,377
|
| Left size | n1 = | 783
|
| Right size | n2 = | 10,594
|
| Volume | m = | 94,459
|
| Unique edge count | m̿ = | 53,597
|
| Wedge count | s = | 54,825,393
|
| Claw count | z = | 65,880,761,425
|
| Cross count | x = | 72,954,130,471,440
|
| Square count | q = | 79,805,362
|
| 4-Tour count | T4 = | 857,904,310
|
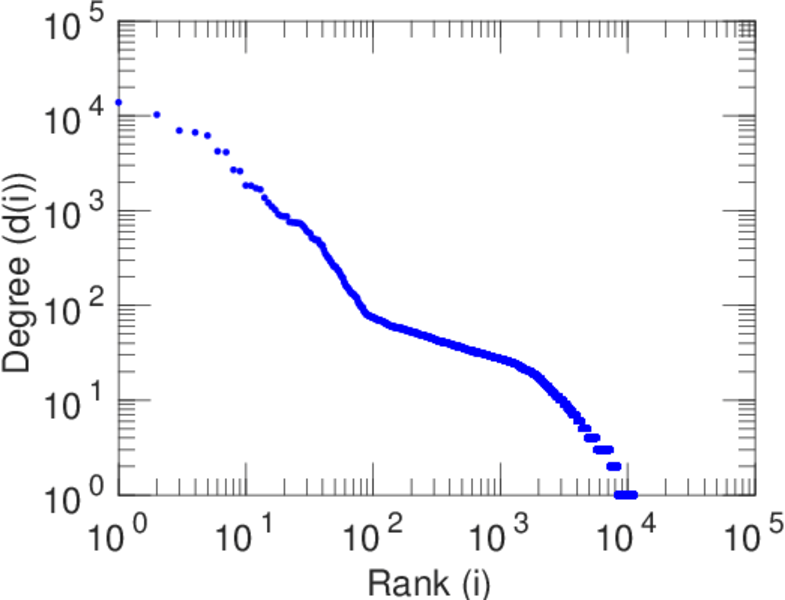
| Maximum degree | dmax = | 13,847
|
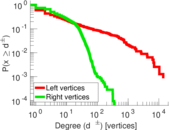
| Maximum left degree | d1max = | 13,847
|
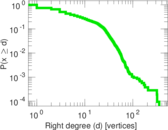
| Maximum right degree | d2max = | 353
|
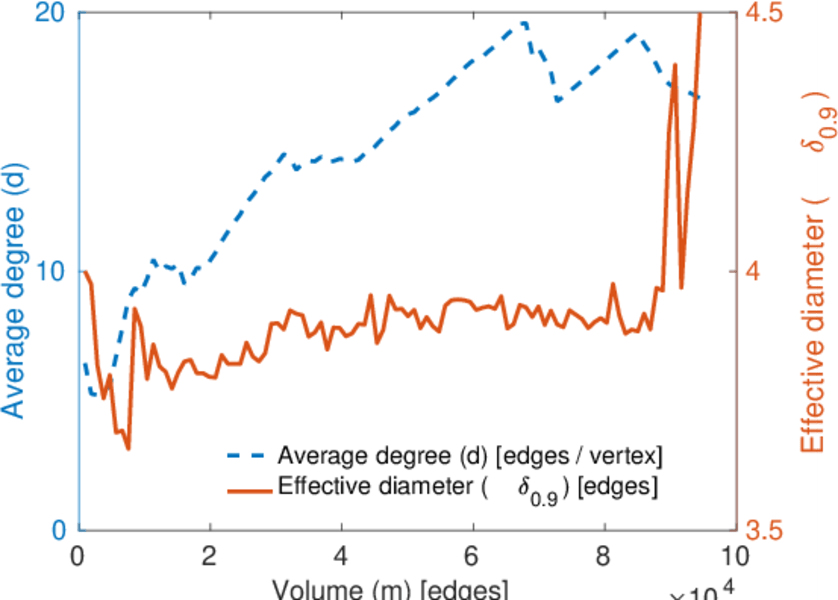
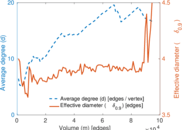
| Average degree | d = | 16.605 3
|
| Average left degree | d1 = | 120.637
|
| Average right degree | d2 = | 8.916 27
|
| Fill | p = | 0.006 461 28
|
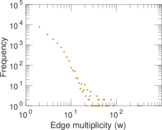
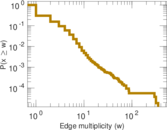
| Average edge multiplicity | m̃ = | 1.762 39
|
| Size of LCC | N = | 10,921
|
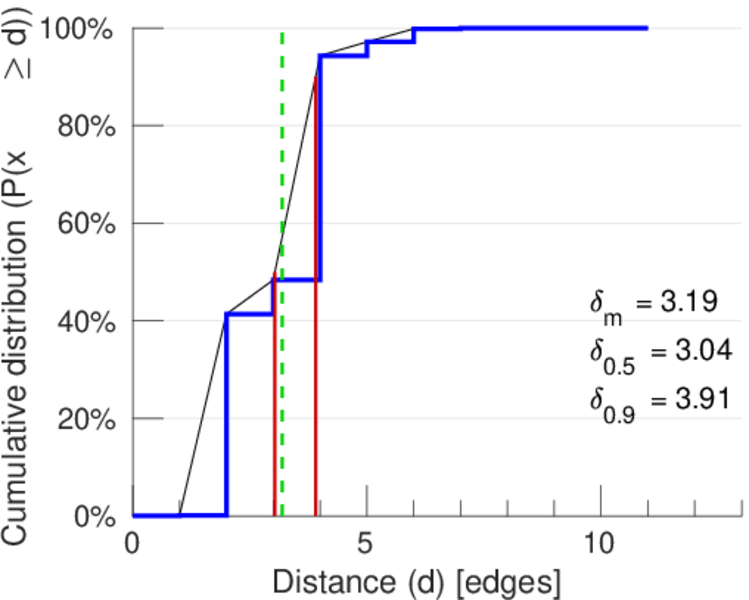
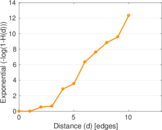
| Diameter | δ = | 13
|
| 50-Percentile effective diameter | δ0.5 = | 3.035 77
|
| 90-Percentile effective diameter | δ0.9 = | 3.905 93
|
| Median distance | δM = | 4
|
| Mean distance | δm = | 3.189 53
|
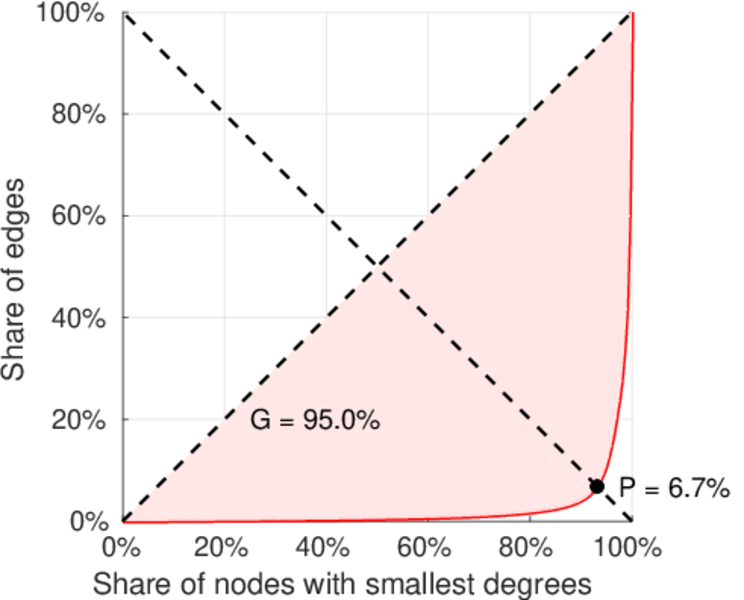
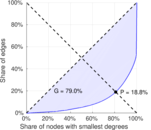
| Gini coefficient | G = | 0.796 351
|
| Balanced inequality ratio | P = | 0.185 641
|
| Left balanced inequality ratio | P1 = | 0.066 663 8
|
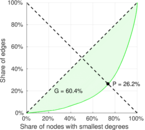
| Right balanced inequality ratio | P2 = | 0.262 378
|
| Relative edge distribution entropy | Her = | 0.757 650
|
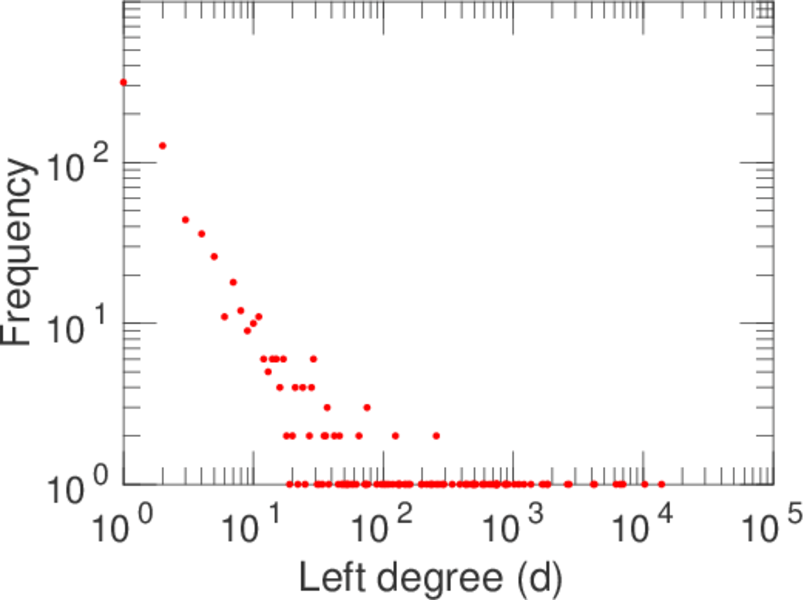
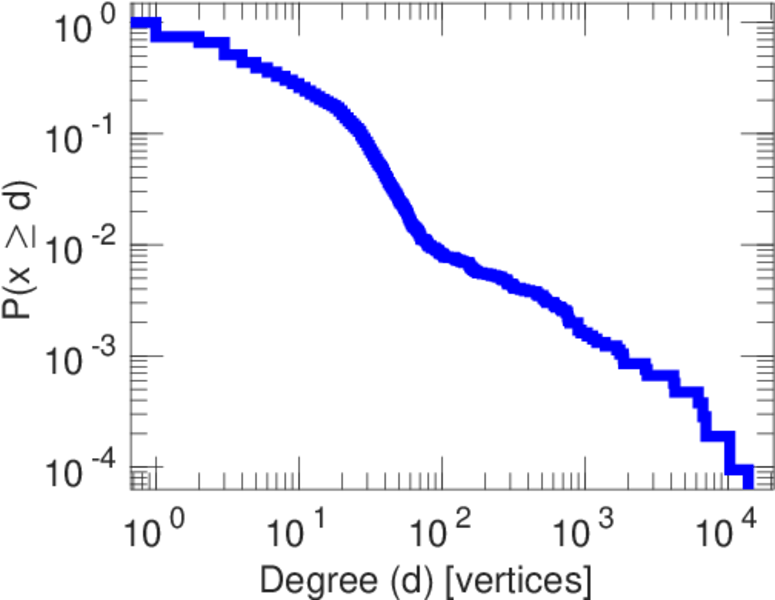
| Power law exponent | γ = | 1.879 69
|
| Tail power law exponent | γt = | 2.051 00
|
| Tail power law exponent with p | γ3 = | 2.051 00
|
| p-value | p = | 0.000 00
|
| Left tail power law exponent with p | γ3,1 = | 1.481 00
|
| Left p-value | p1 = | 0.009 000 00
|
| Right tail power law exponent with p | γ3,2 = | 7.181 00
|
| Right p-value | p2 = | 0.604 000
|
| Degree assortativity | ρ = | −0.186 690
|
| Degree assortativity p-value | pρ = | 0.000 00
|
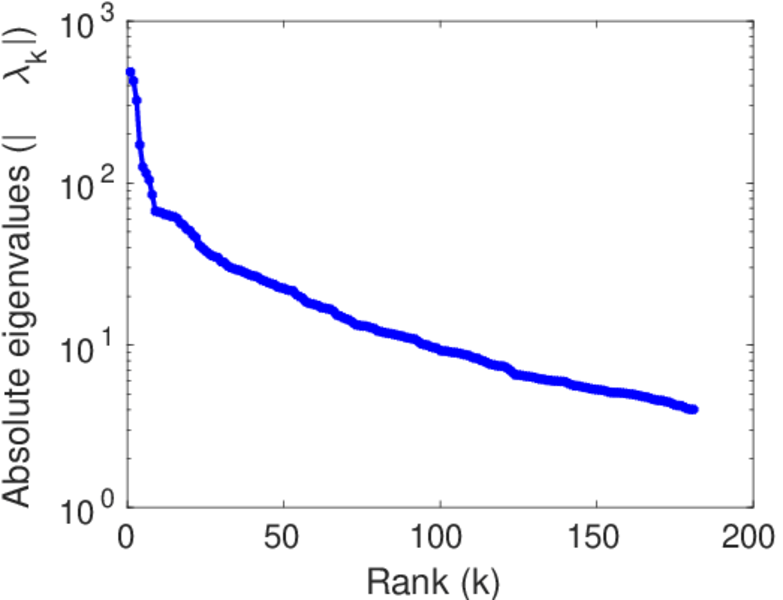
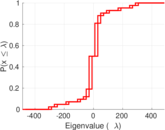
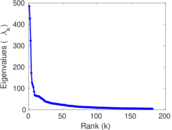
| Spectral norm | α = | 485.019
|
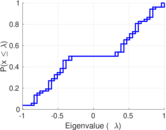
| Algebraic connectivity | a = | 0.066 831 3
|
| Spectral separation | |λ1[A] / λ2[A]| = | 1.135 90
|
| Controllability | C = | 9,859
|
| Relative controllability | Cr = | 0.869 937
|
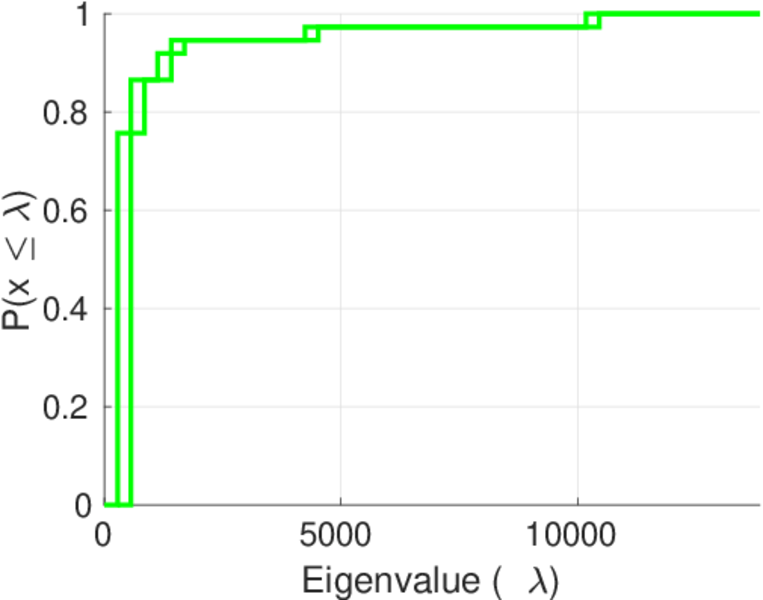
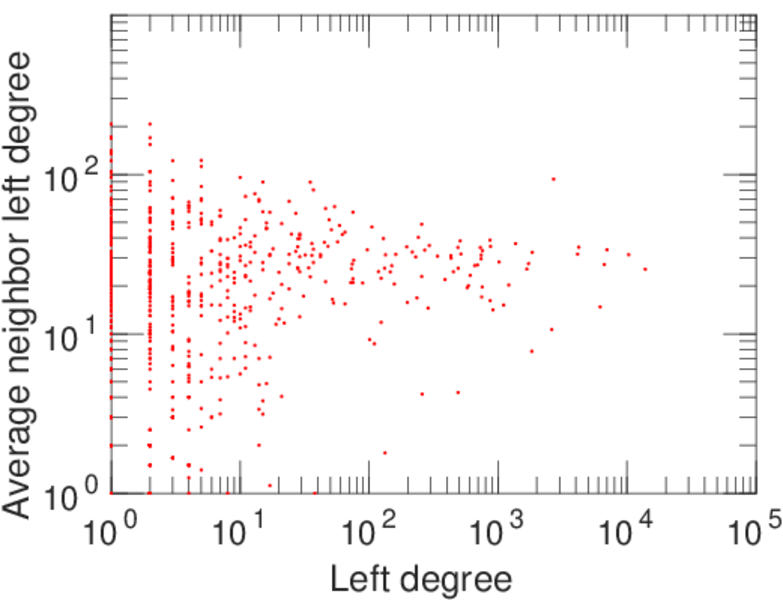
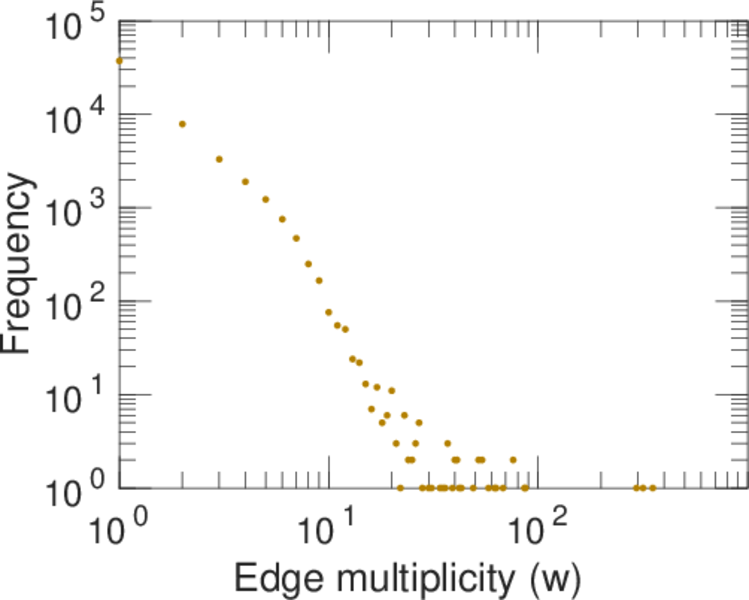
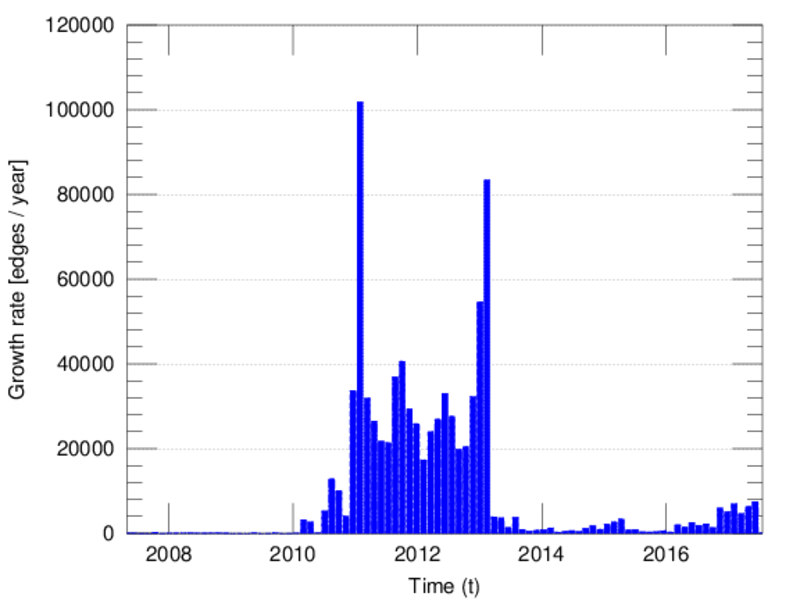
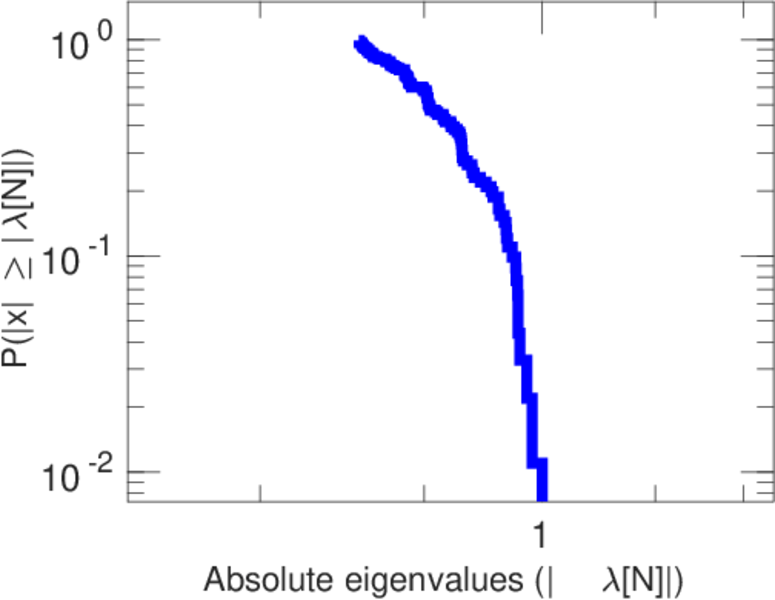
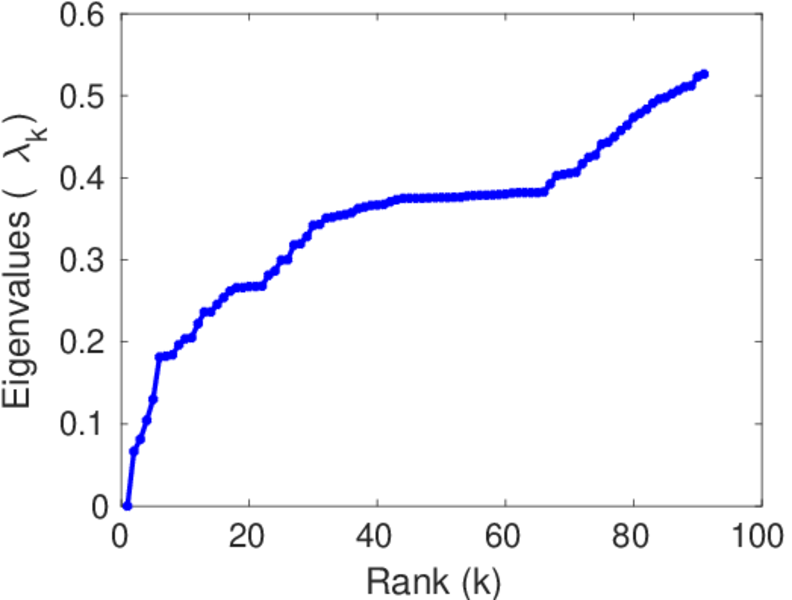
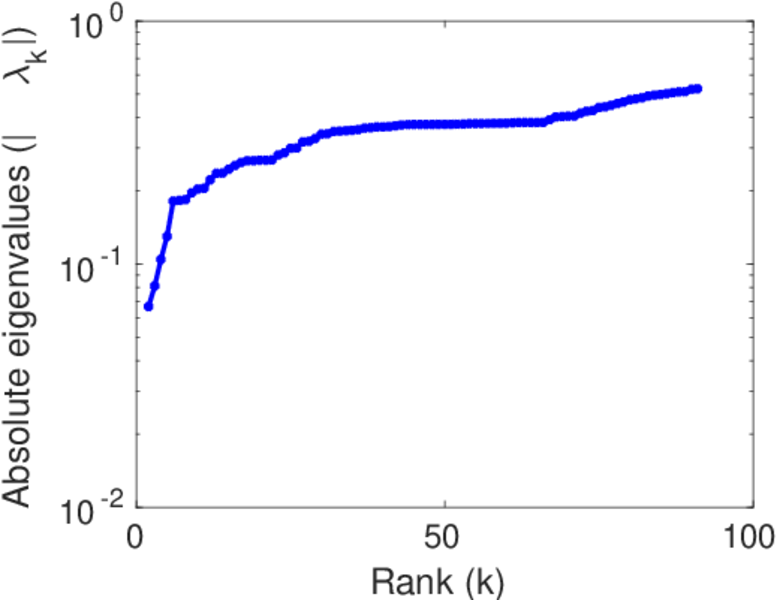
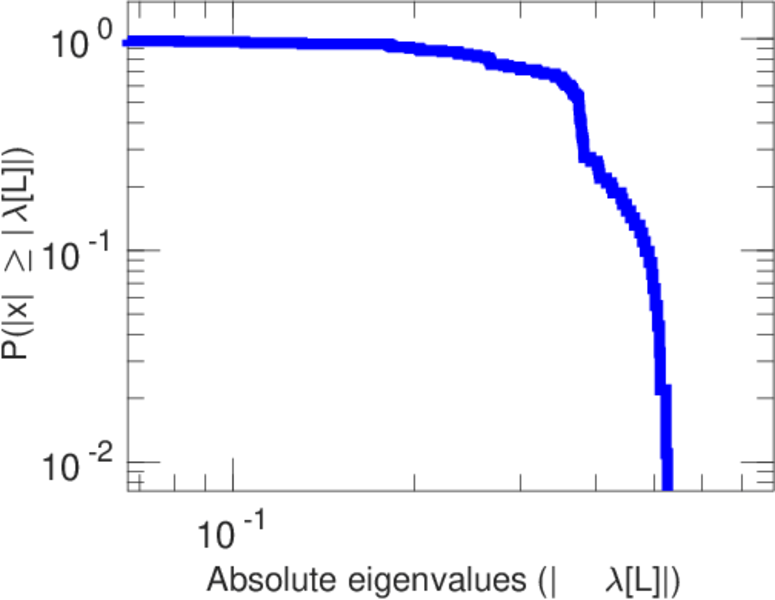
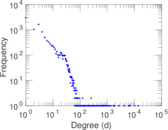
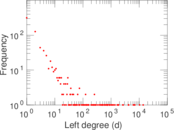
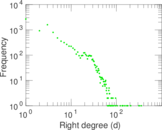
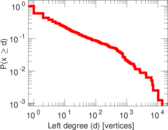
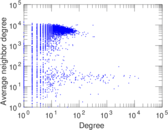
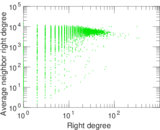
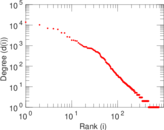
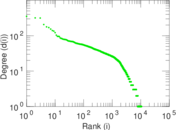
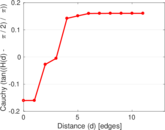
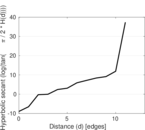
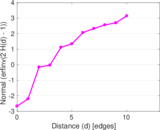
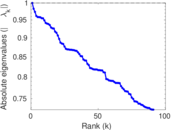
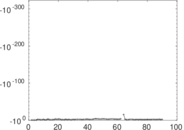
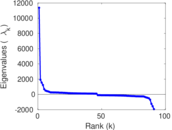
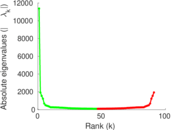
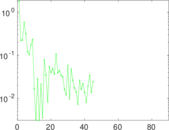
Plots


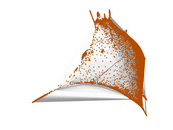


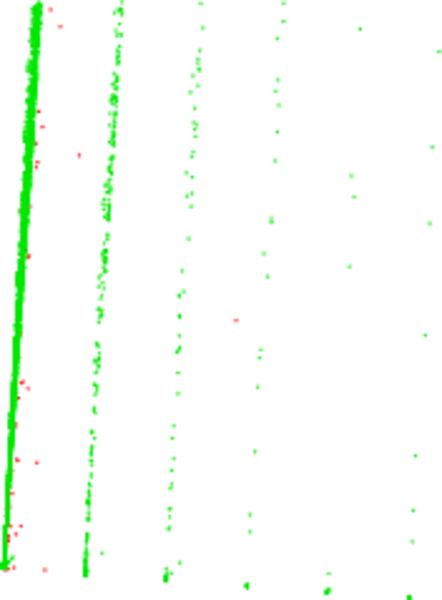
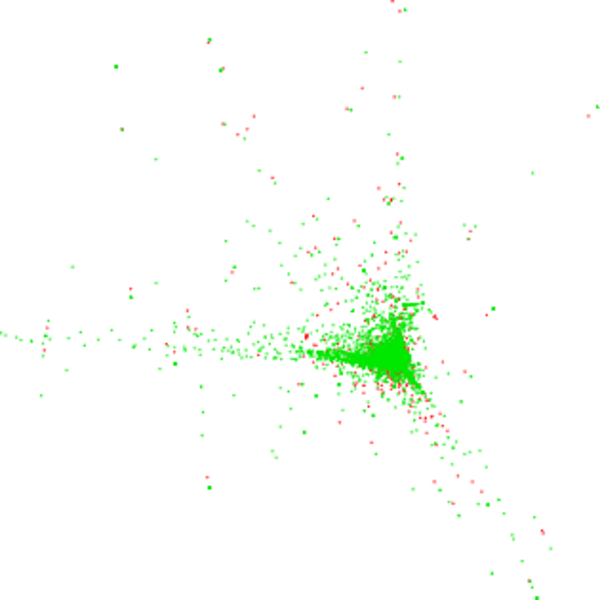
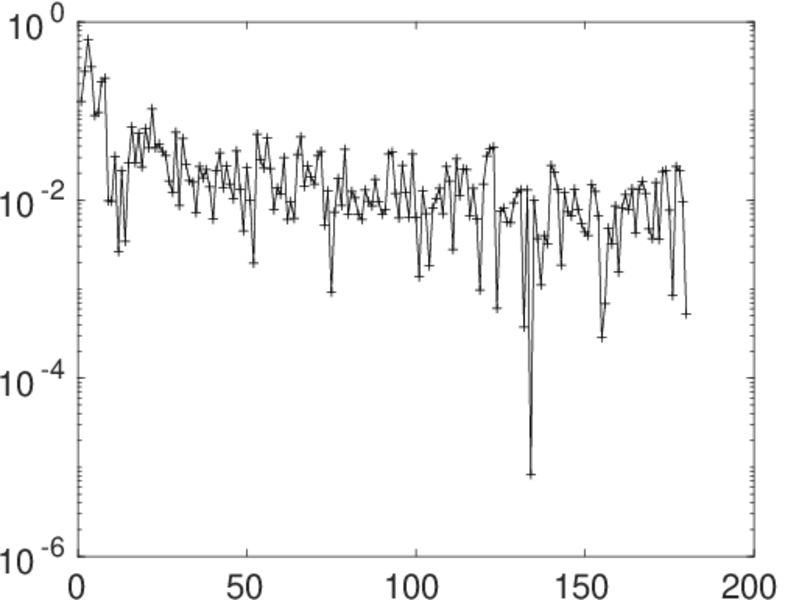
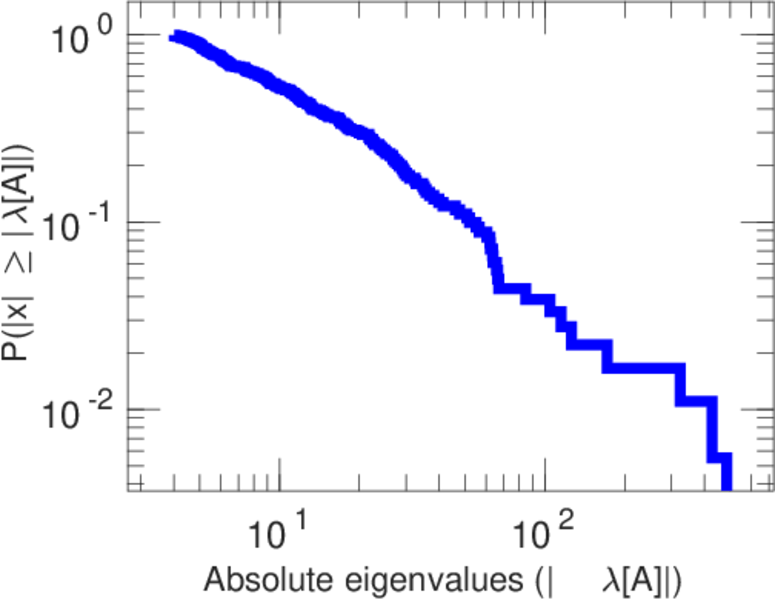
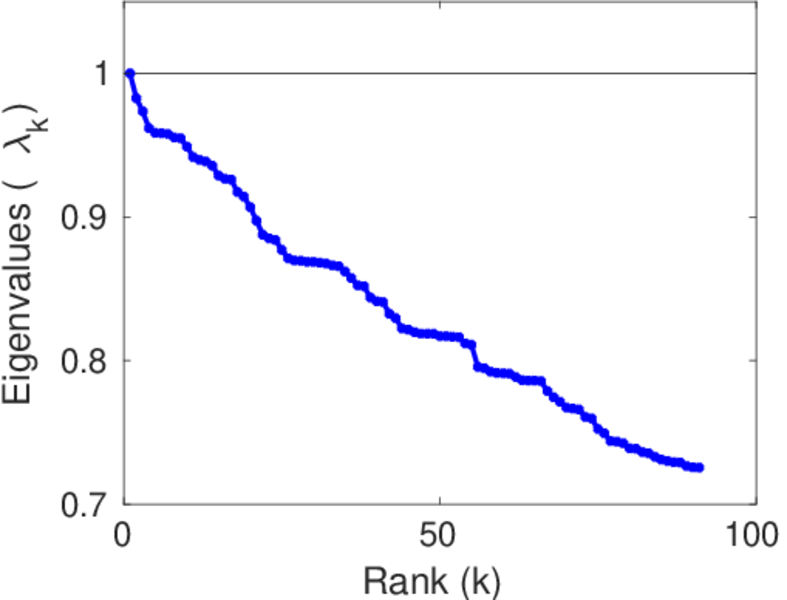
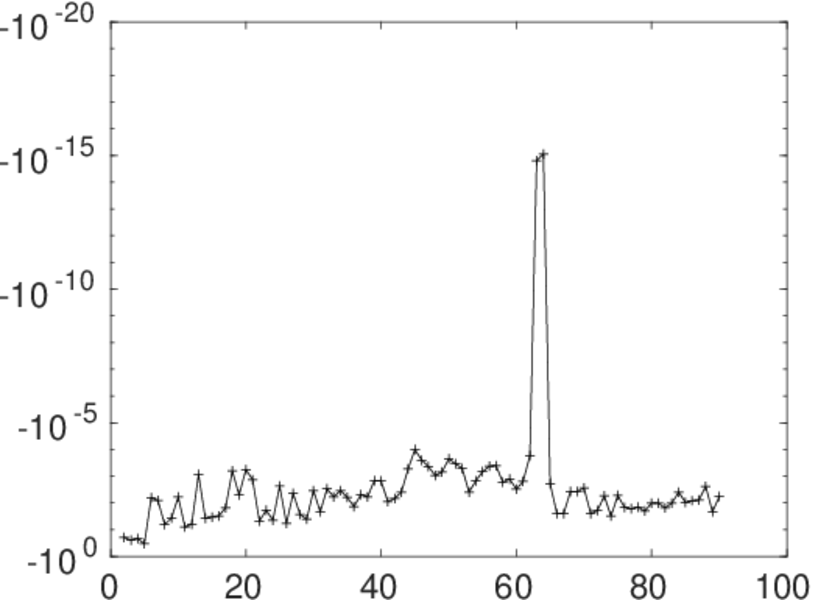
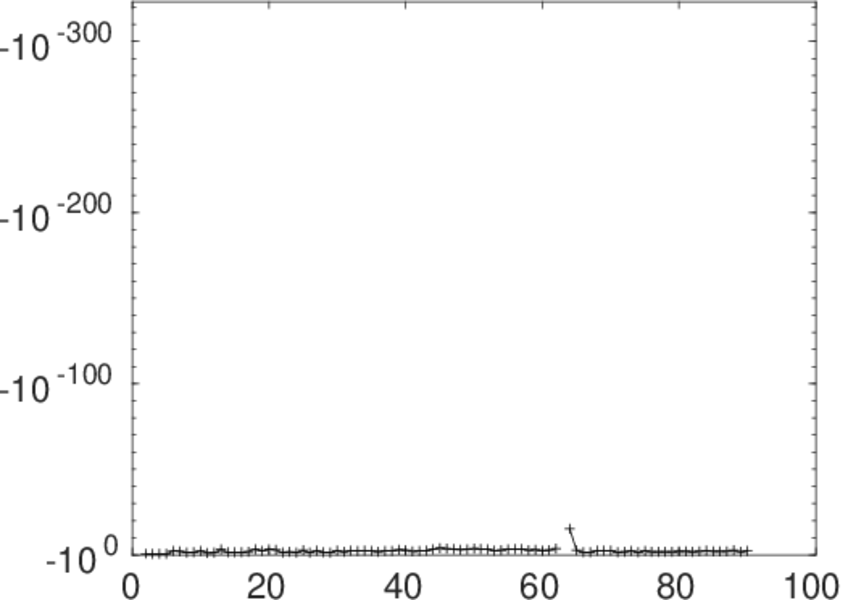
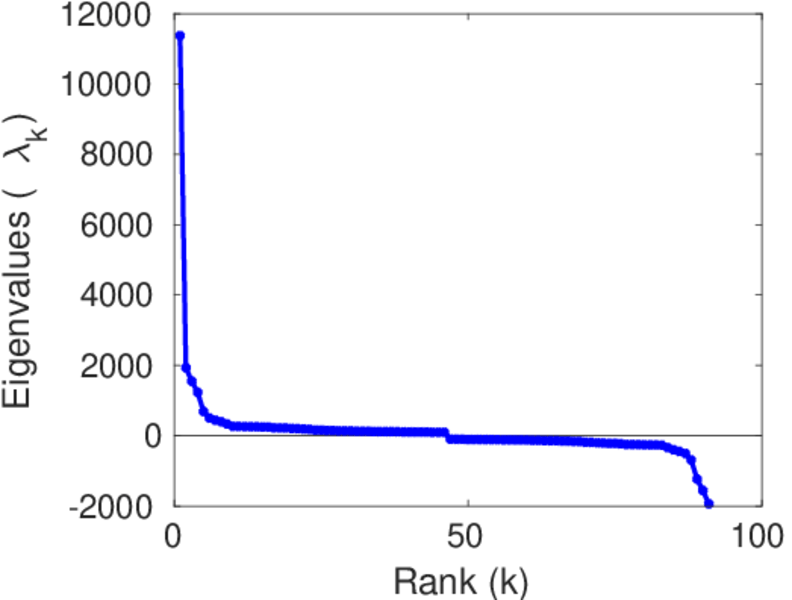
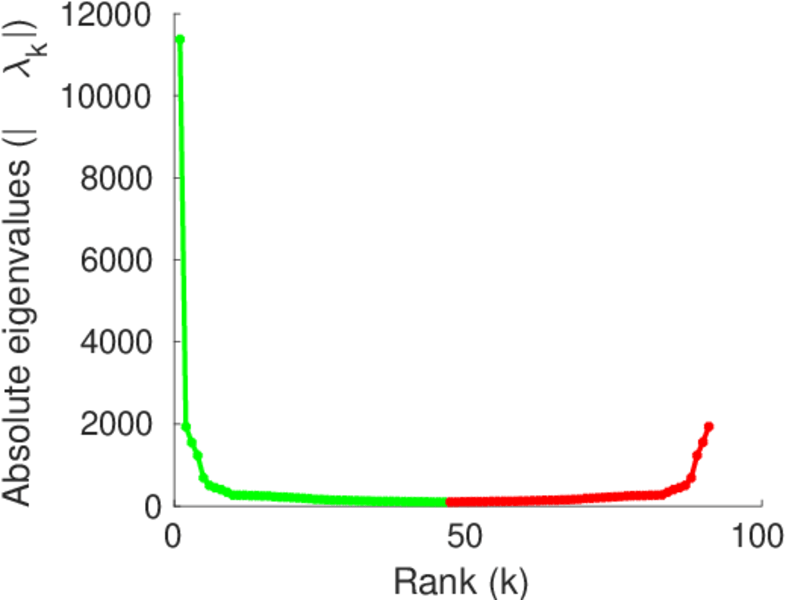
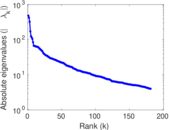
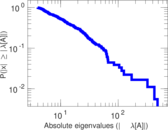
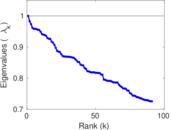
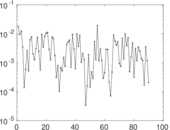
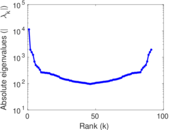
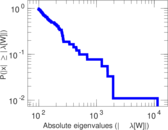
Matrix decompositions plots


Downloads
References
|
[1]
|
Jérôme Kunegis.
KONECT – The Koblenz Network Collection.
In Proc. Int. Conf. on World Wide Web Companion, pages
1343–1350, 2013.
[ http ]
|
|
[2]
|
Wikimedia Foundation.
Wikimedia downloads.
http://dumps.wikimedia.org/, January 2010.
|
 KONECT ‣ Networks ‣
Buy Me a Coffee
KONECT ‣ Networks ‣
Buy Me a Coffee