Wikiquote edits (ru)
This is the bipartite edit network of the Russian Wikisource. It contains users
and pages from the Russian Wikisource, connected by edit events. Each edge
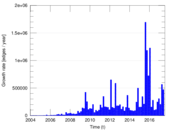
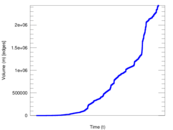
represents an edit. The dataset includes the timestamp of each edit.
Metadata
Statistics
| Size | n = | 609,903
|
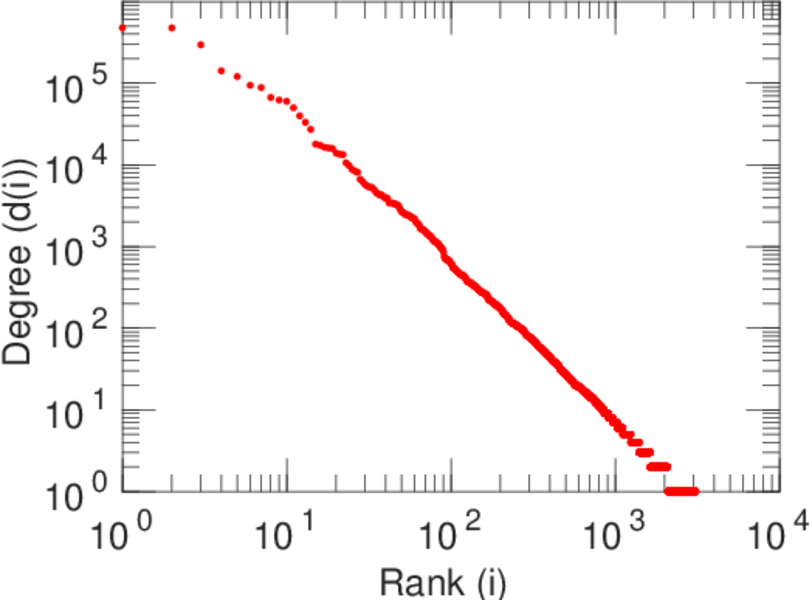
| Left size | n1 = | 3,088
|
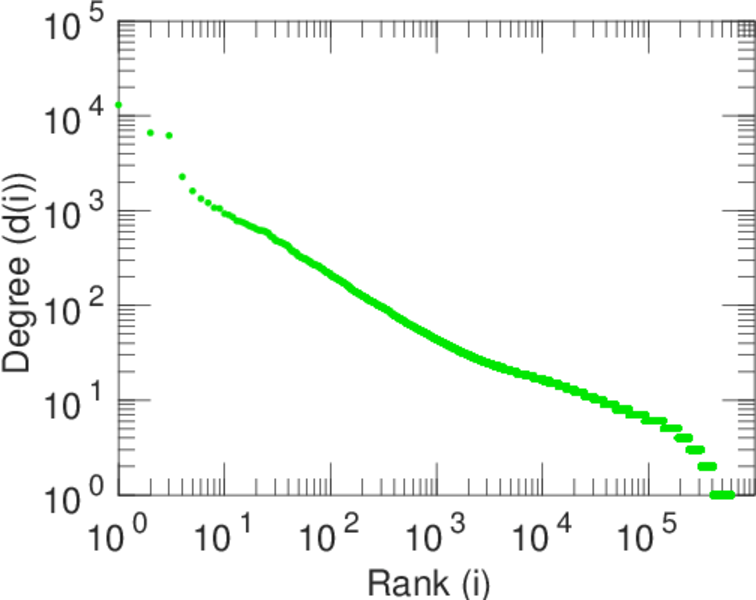
| Right size | n2 = | 606,815
|
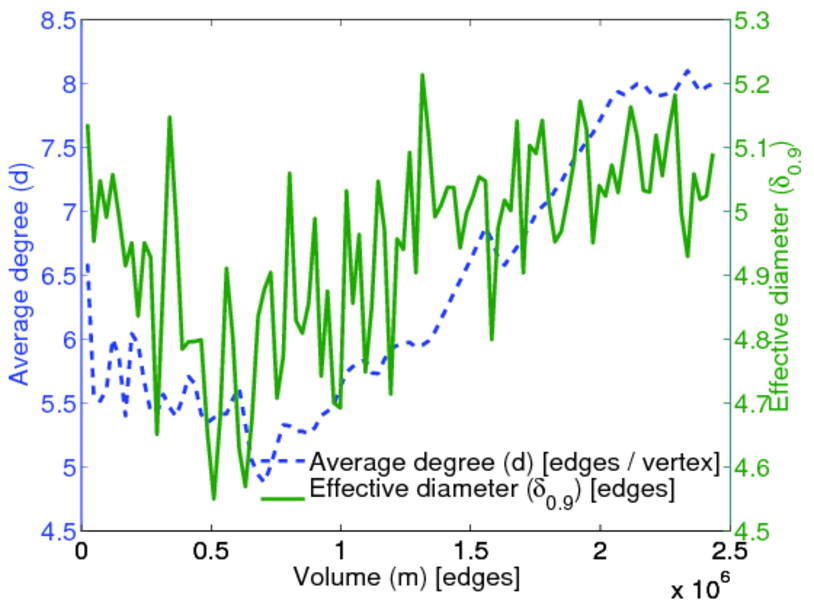
| Volume | m = | 2,434,171
|
| Unique edge count | m̿ = | 1,078,960
|
| Wedge count | s = | 50,781,916,248
|
| Cross count | x = | 1.668 82 × 1020
|
| Square count | q = | 7,319,061,472
|
| 4-Tour count | T4 = | 261,682,482,164
|
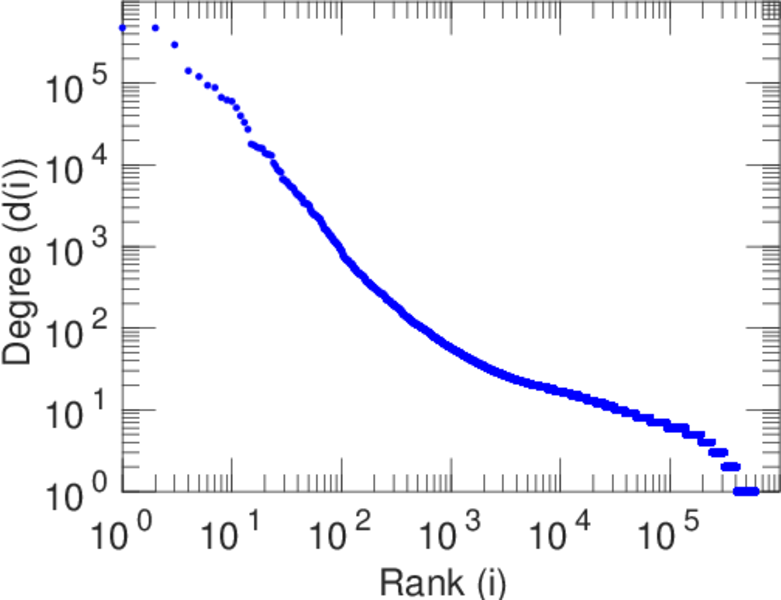
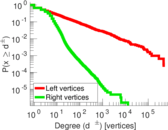
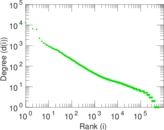
| Maximum degree | dmax = | 477,162
|
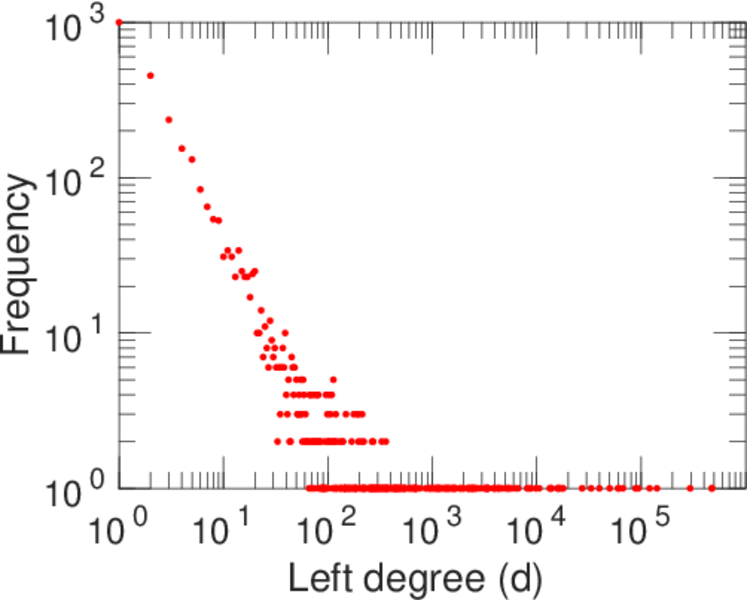
| Maximum left degree | d1max = | 477,162
|
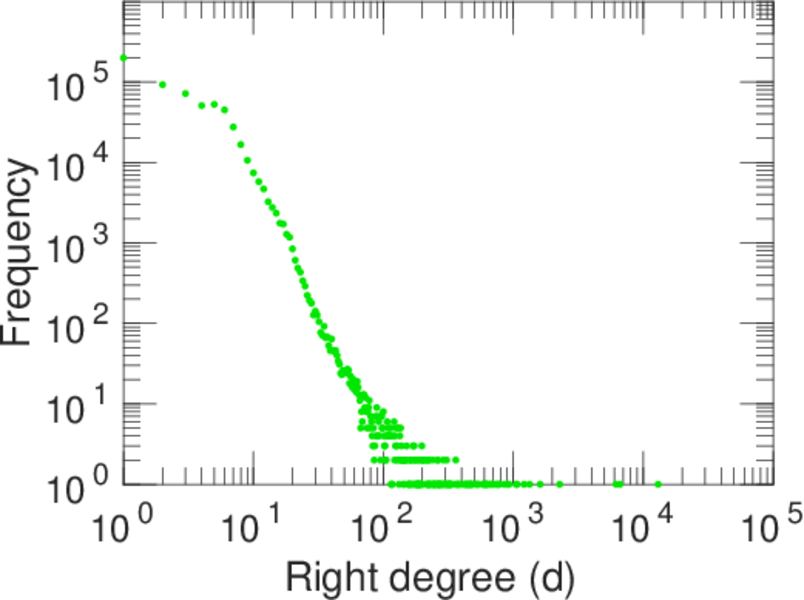
| Maximum right degree | d2max = | 13,030
|
| Average degree | d = | 7.982 16
|
| Average left degree | d1 = | 788.268
|
| Average right degree | d2 = | 4.011 39
|
| Fill | p = | 0.000 575 800
|
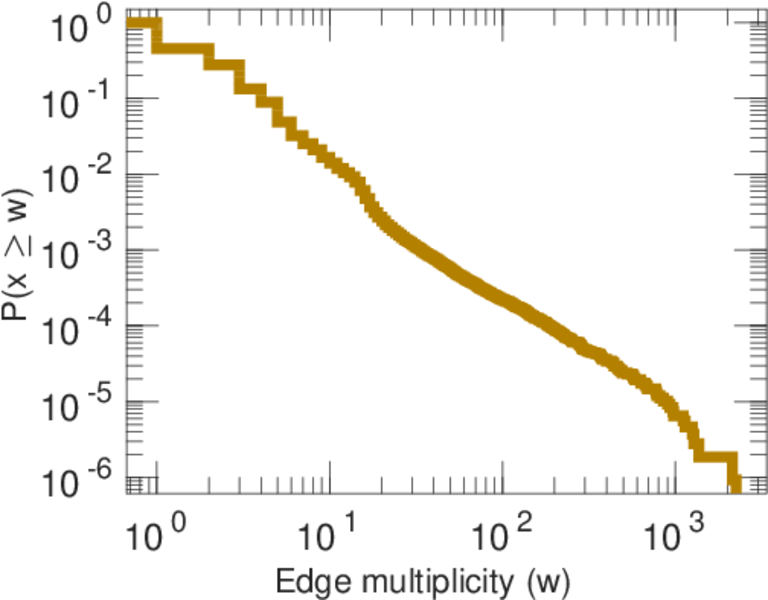
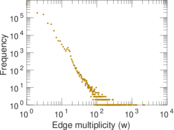
| Average edge multiplicity | m̃ = | 2.256 03
|
| Size of LCC | N = | 607,855
|
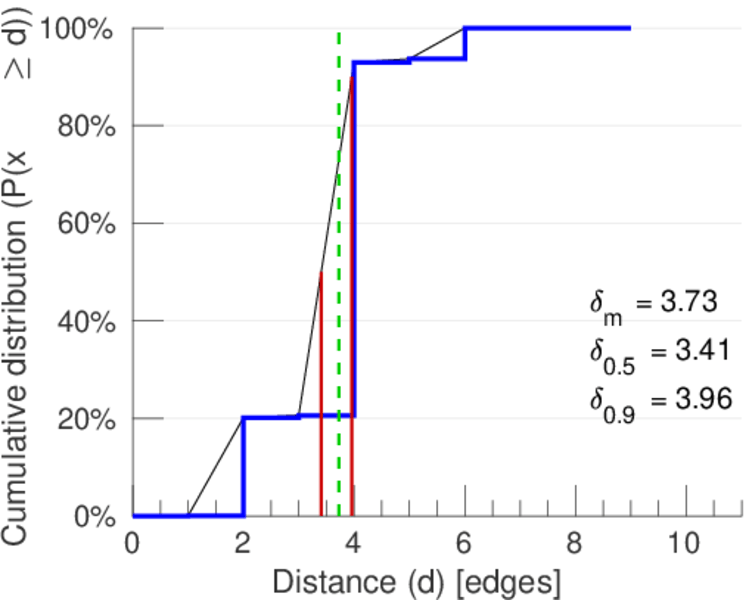
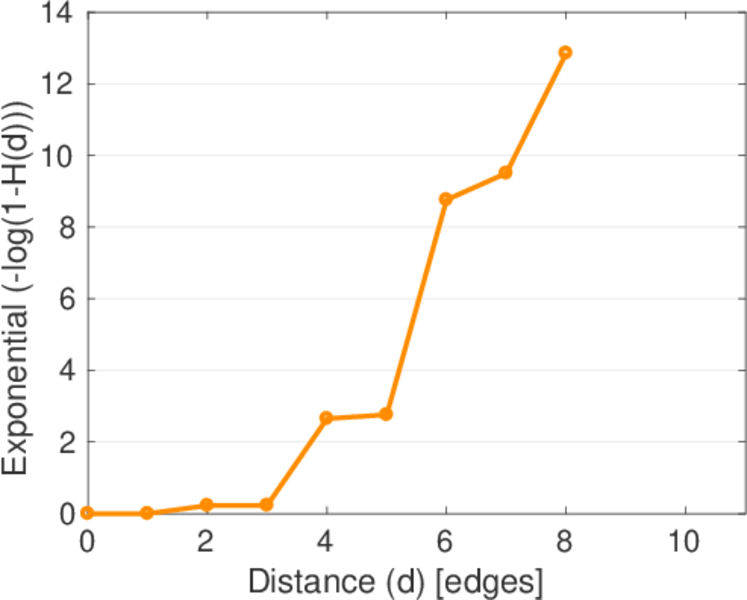
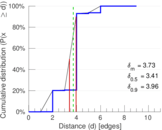
| Diameter | δ = | 12
|
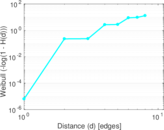
| 50-Percentile effective diameter | δ0.5 = | 3.406 26
|
| 90-Percentile effective diameter | δ0.9 = | 3.959 29
|
| Median distance | δM = | 4
|
| Mean distance | δm = | 3.726 52
|
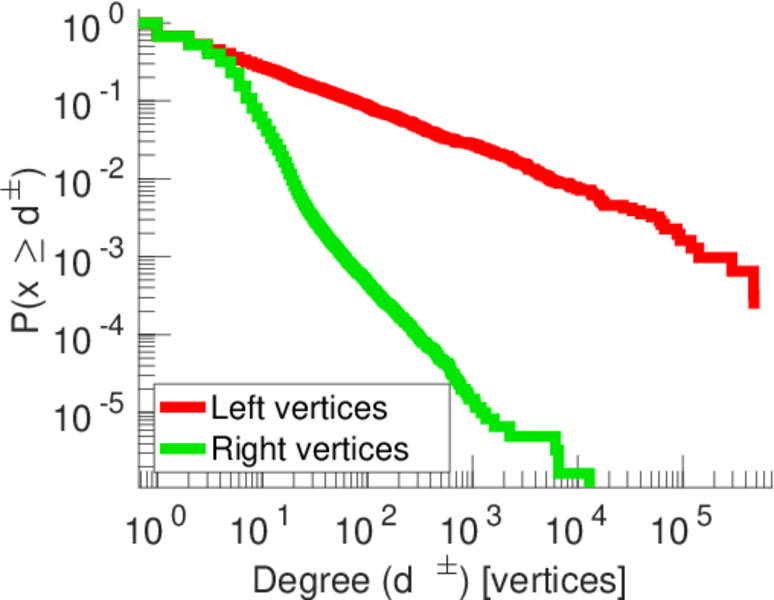
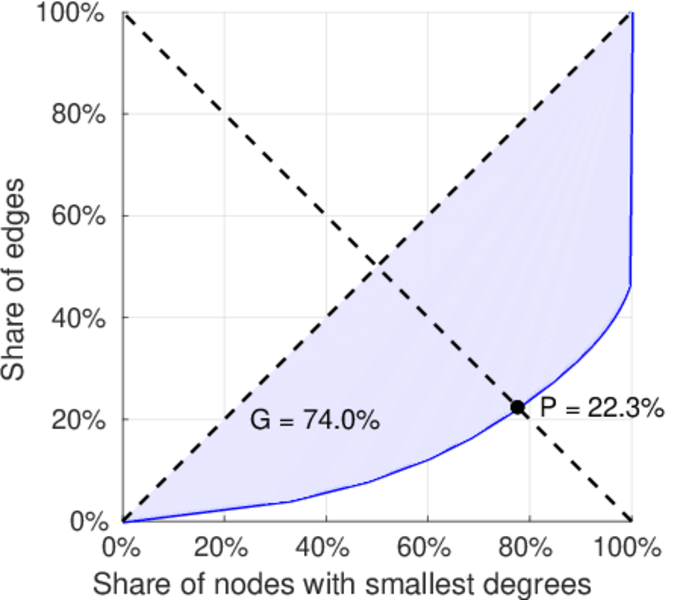
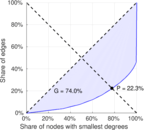
| Gini coefficient | G = | 0.740 434
|
| Balanced inequality ratio | P = | 0.221 880
|
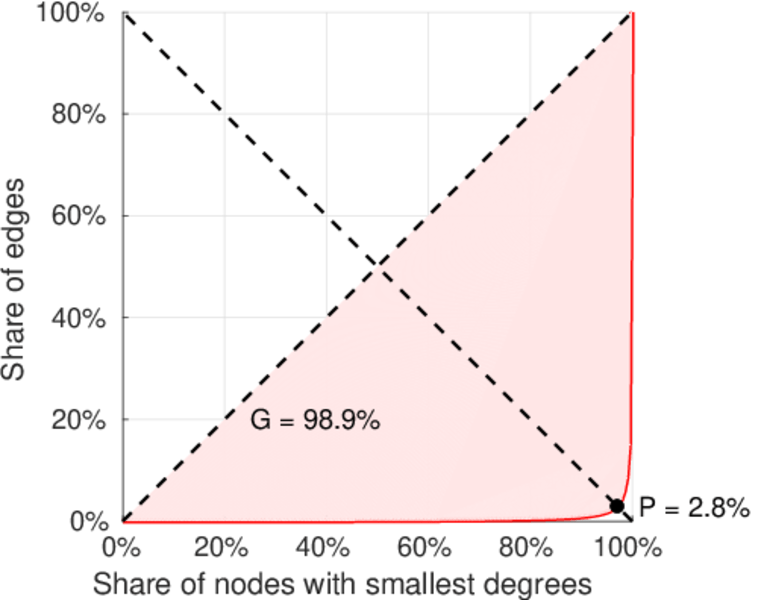
| Left balanced inequality ratio | P1 = | 0.027 996 0
|
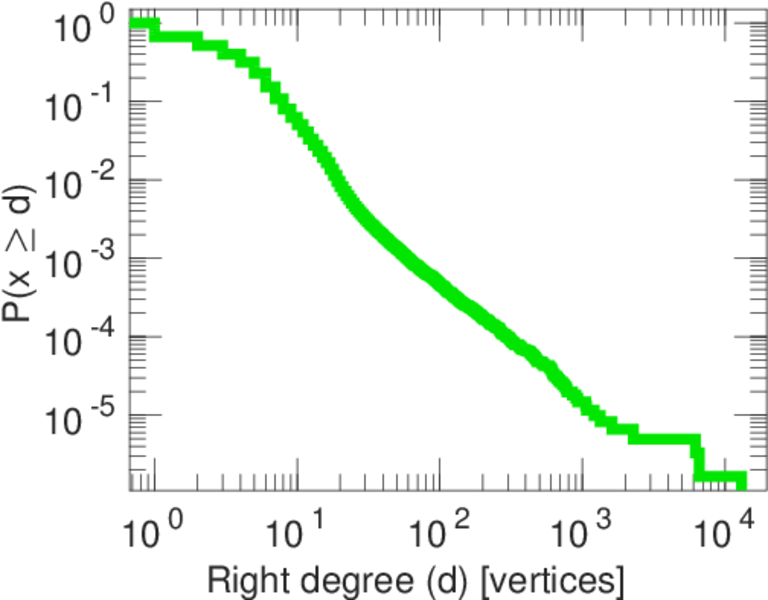
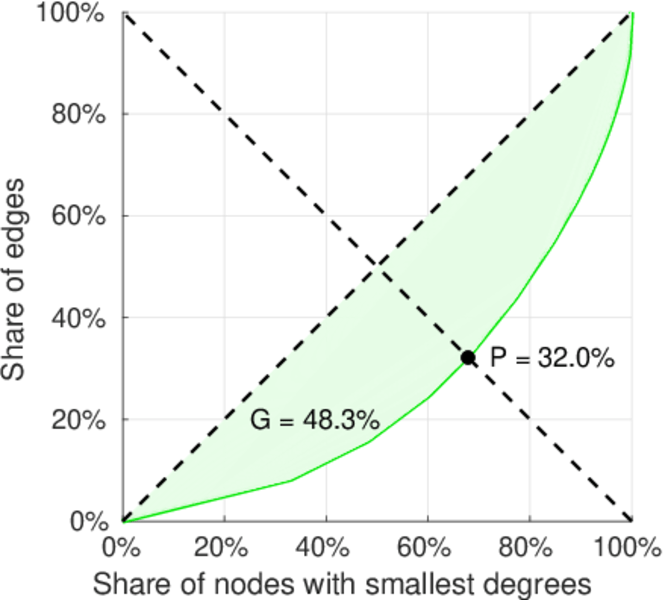
| Right balanced inequality ratio | P2 = | 0.319 987
|
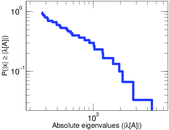
| Tail power law exponent | γt = | 1.521 00
|
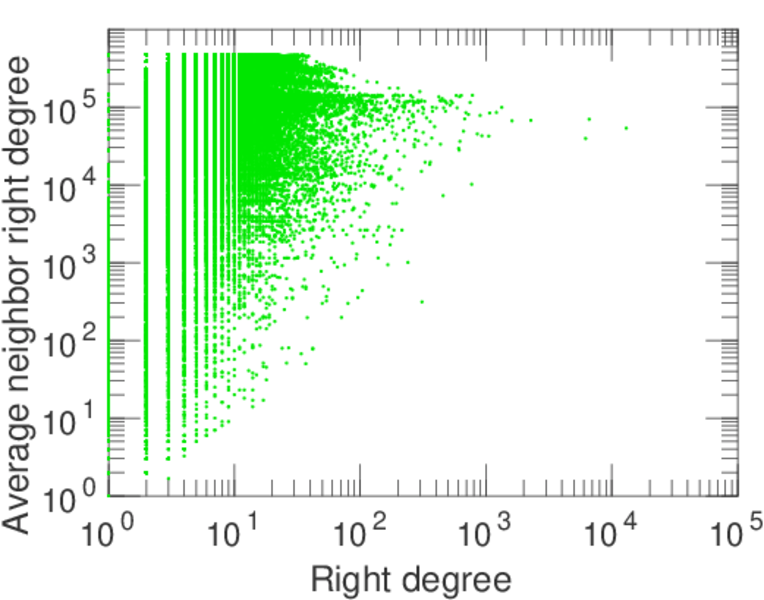
| Degree assortativity | ρ = | −0.061 828 3
|
| Degree assortativity p-value | pρ = | 0.000 00
|
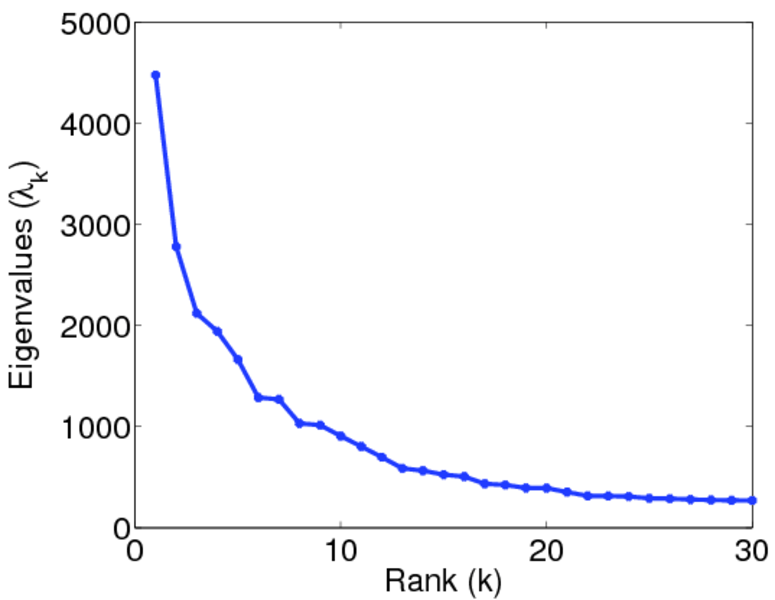
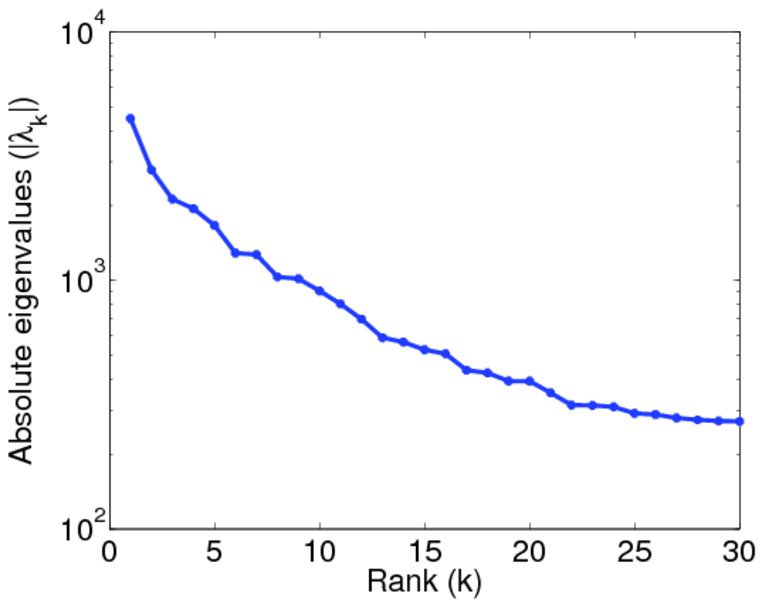
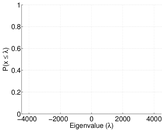
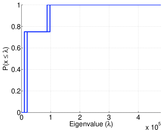
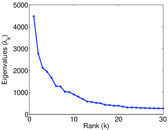
| Spectral norm | α = | 4,477.39
|
| Algebraic connectivity | a = | 0.008 014 00
|
| Spectral separation | |λ1[A] / λ2[A]| = | 1.610 29
|
| Controllability | C = | 603,062
|
| Relative controllability | Cr = | 0.990 611
|
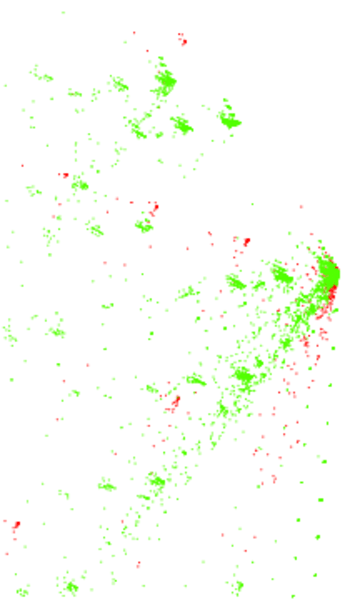
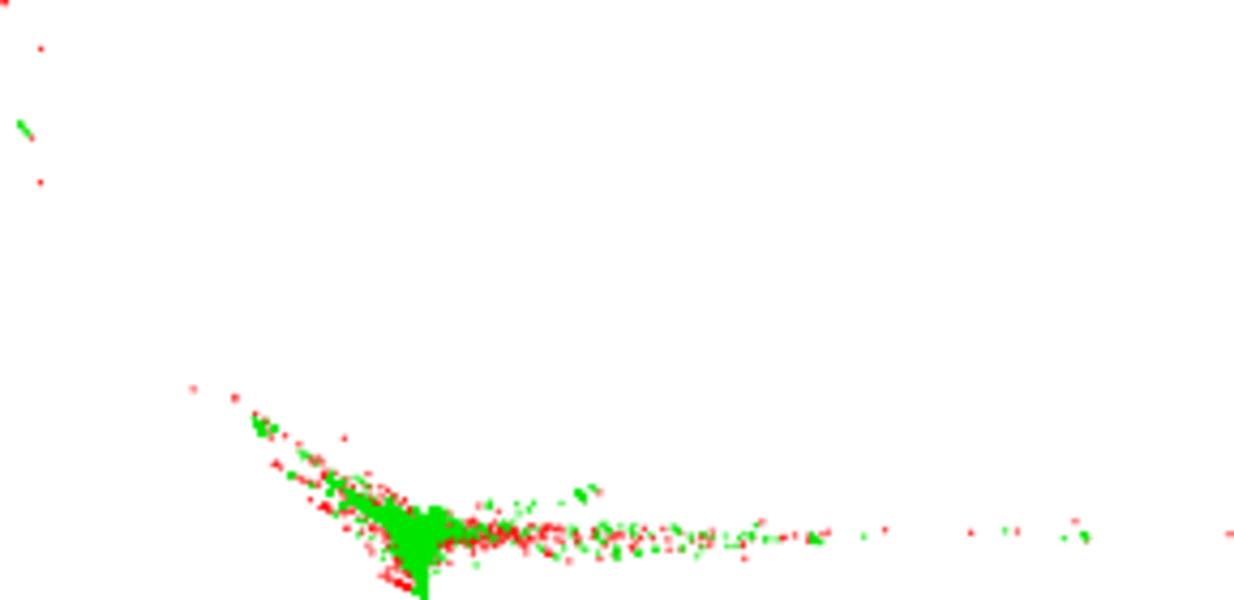
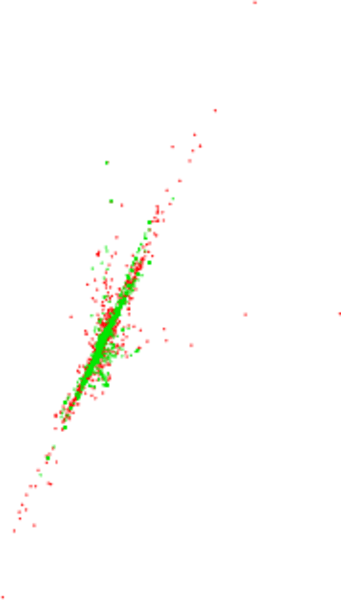
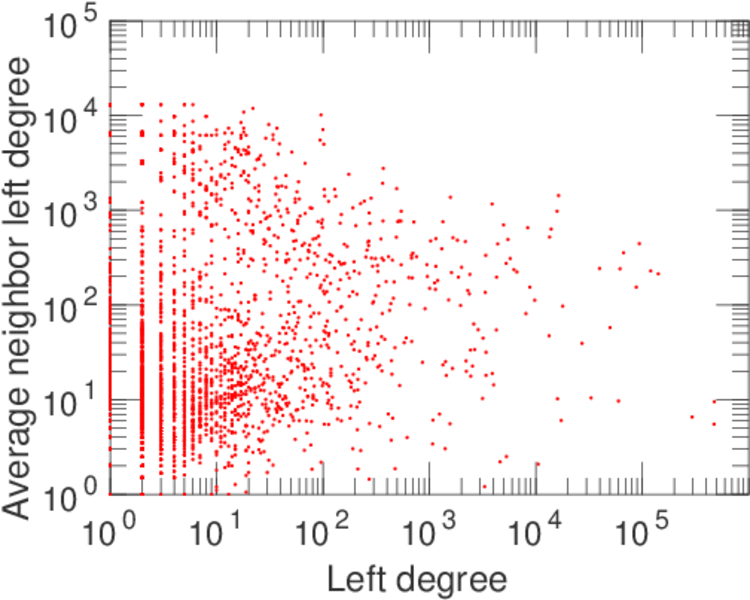
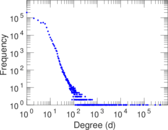
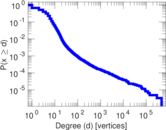
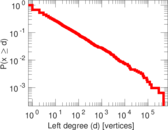
Plots


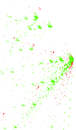
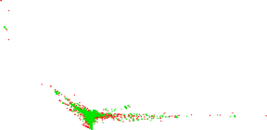


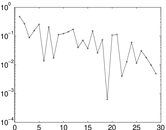
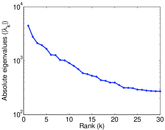
Matrix decompositions plots
Downloads
References
|
[1]
|
Jérôme Kunegis.
KONECT – The Koblenz Network Collection.
In Proc. Int. Conf. on World Wide Web Companion, pages
1343–1350, 2013.
[ http ]
|
|
[2]
|
Wikimedia Foundation.
Wikimedia downloads.
http://dumps.wikimedia.org/, January 2010.
|
 KONECT ‣ Networks ‣
Buy Me a Coffee
KONECT ‣ Networks ‣
Buy Me a Coffee