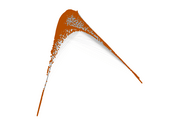
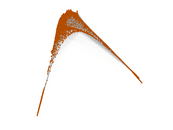
Wikipedia edits (rw)
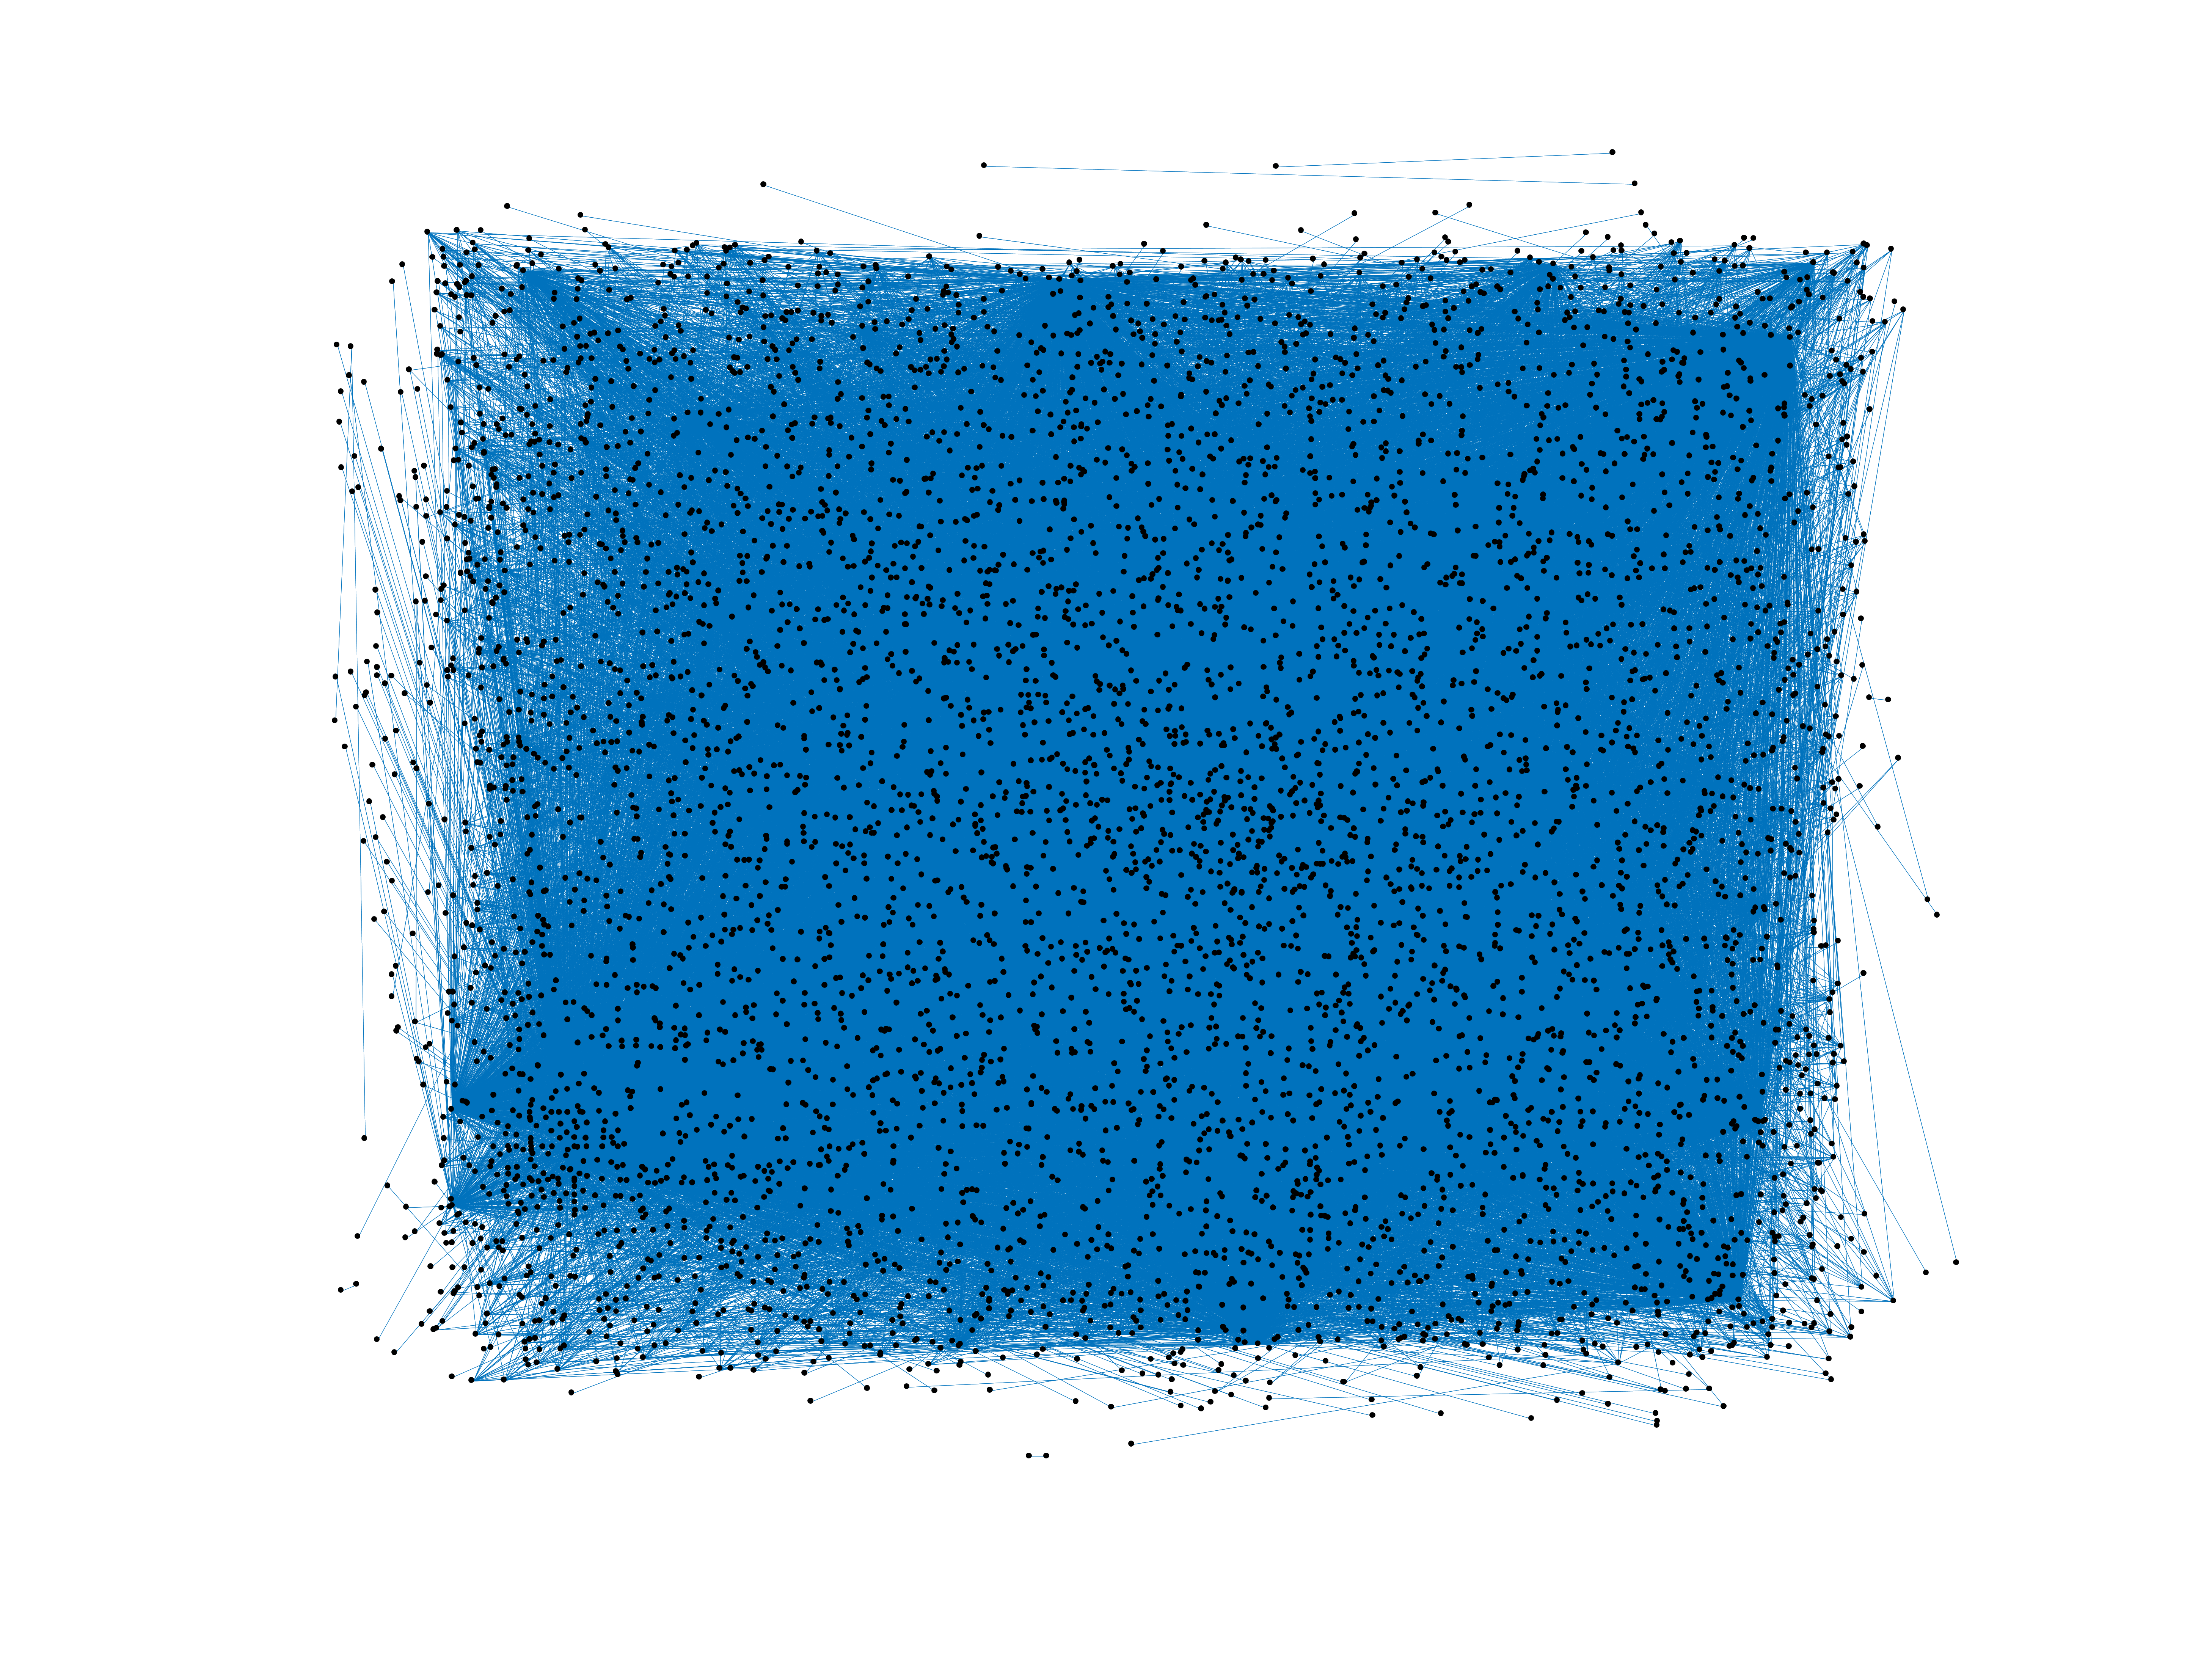
This is the bipartite edit network of the Kinyarwanda Wikipedia. It contains
users and pages from the Kinyarwanda Wikipedia, connected by edit events. Each
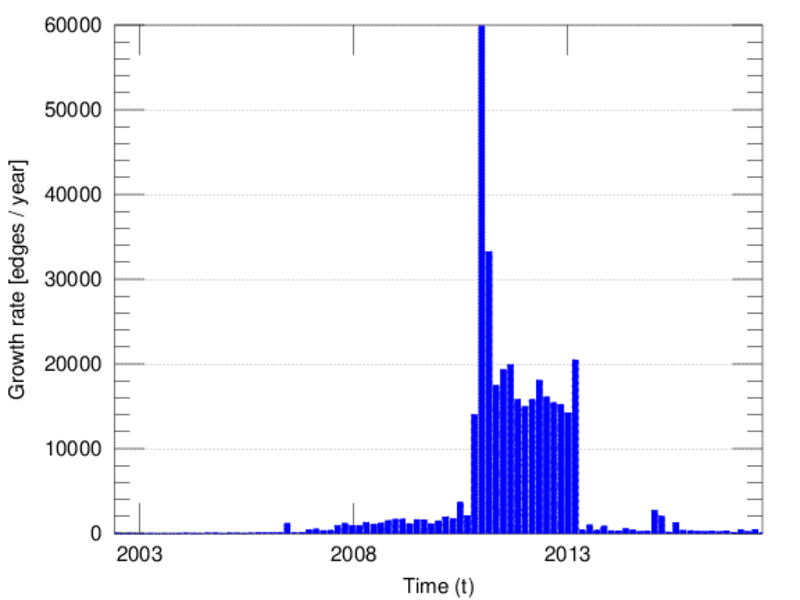
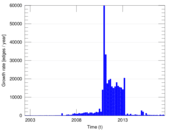
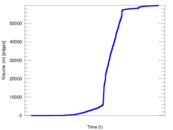
edge represents an edit. The dataset includes the timestamp of each edit.
Metadata
Statistics
| Size | n = | 5,815
|
| Left size | n1 = | 777
|
| Right size | n2 = | 5,038
|
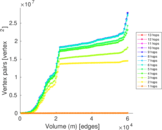
| Volume | m = | 59,837
|
| Unique edge count | m̿ = | 29,642
|
| Wedge count | s = | 17,499,948
|
| Claw count | z = | 12,915,350,219
|
| Cross count | x = | 9,381,640,668,205
|
| Square count | q = | 31,164,407
|
| 4-Tour count | T4 = | 319,388,424
|
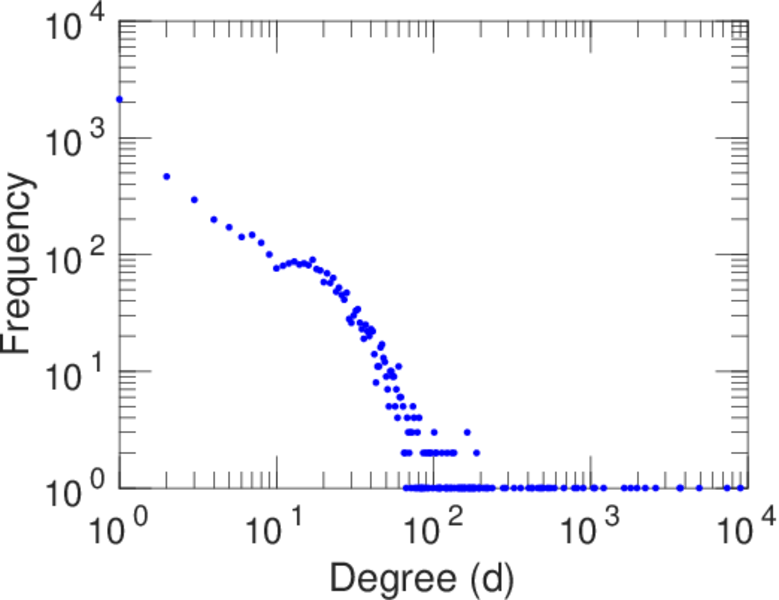
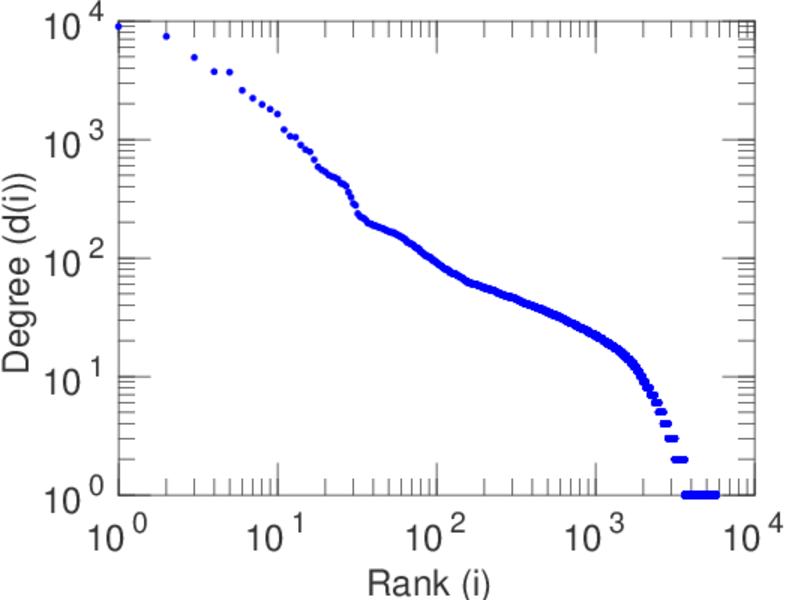
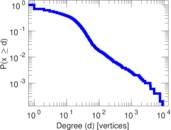
| Maximum degree | dmax = | 8,989
|
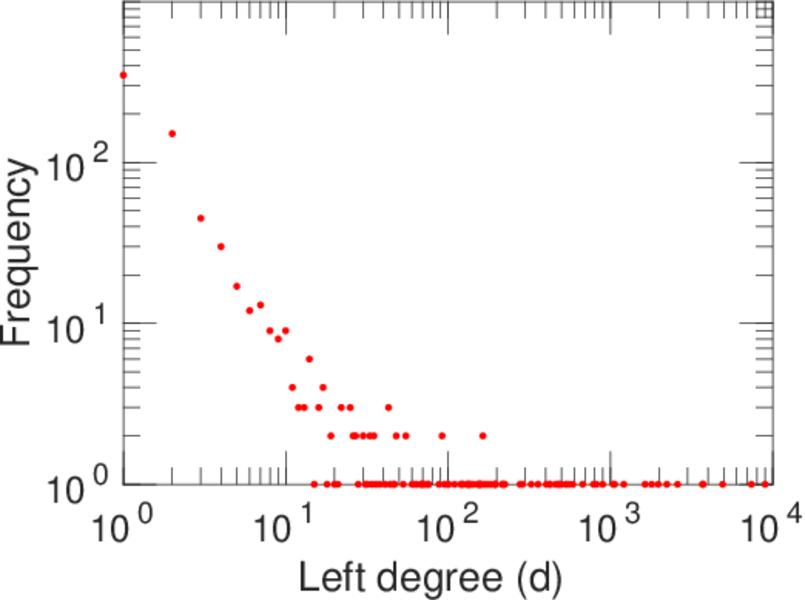
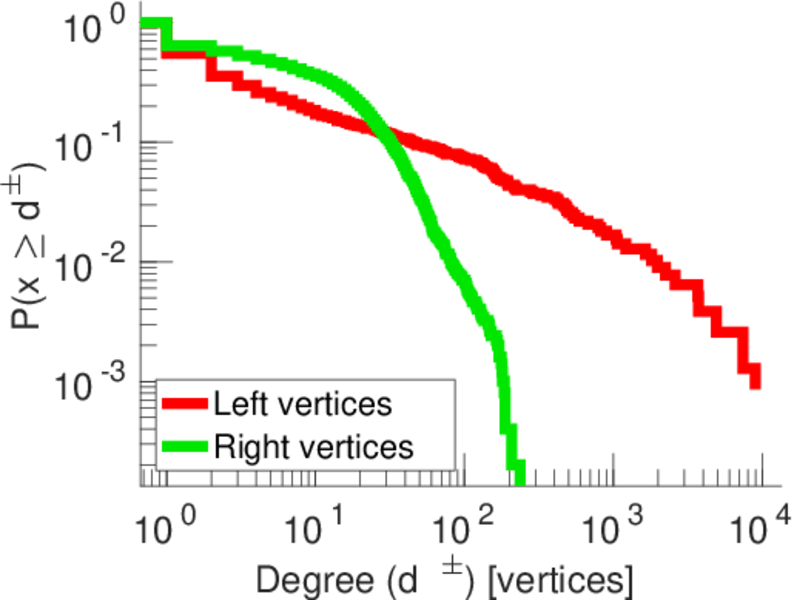
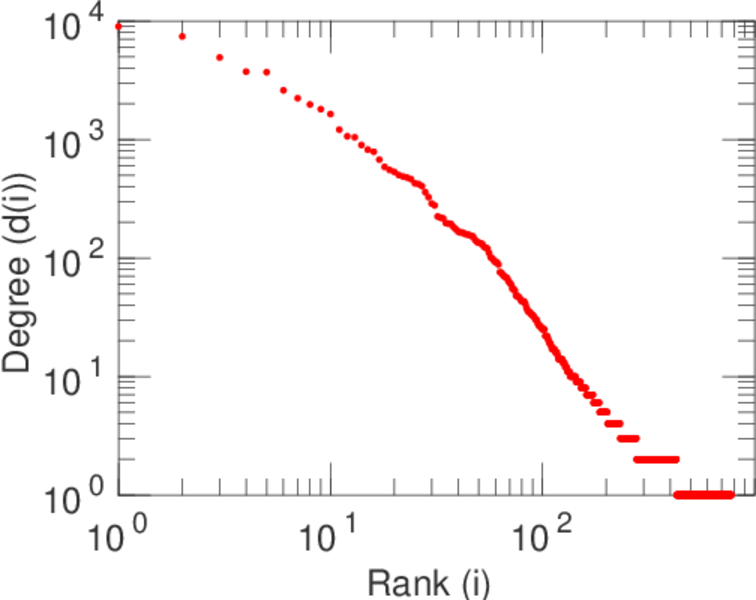
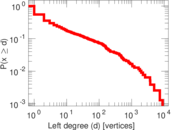
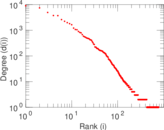
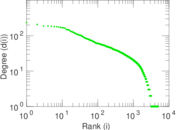
| Maximum left degree | d1max = | 8,989
|
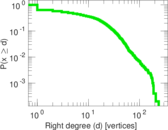
| Maximum right degree | d2max = | 237
|
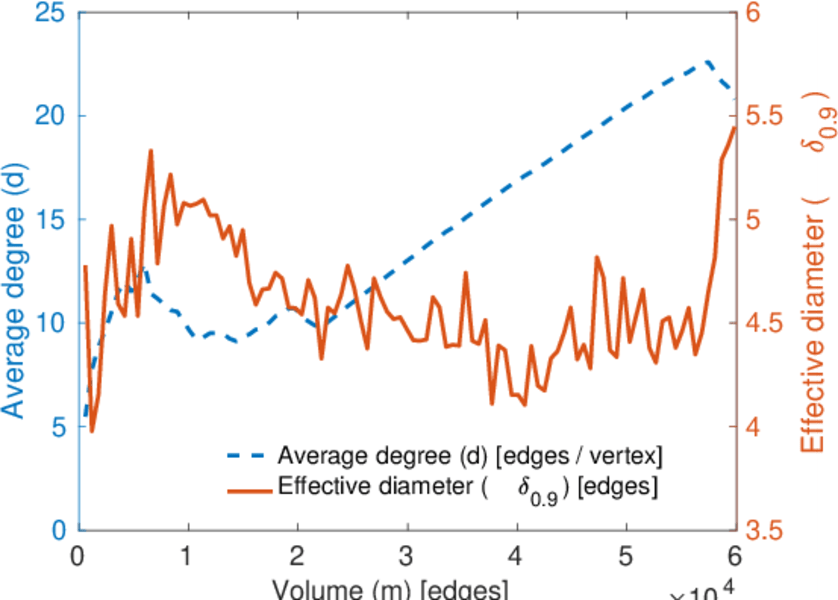
| Average degree | d = | 20.580 2
|
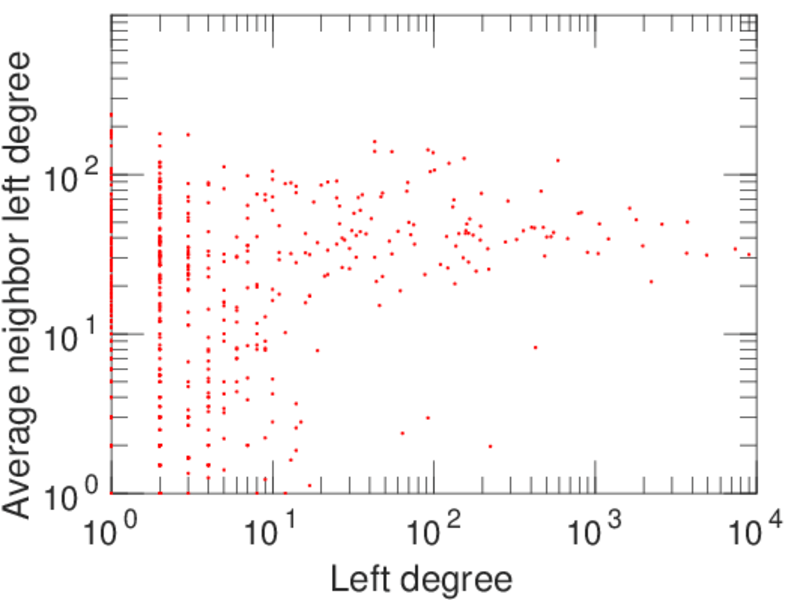
| Average left degree | d1 = | 77.010 3
|
| Average right degree | d2 = | 11.877 1
|
| Fill | p = | 0.007 572 31
|
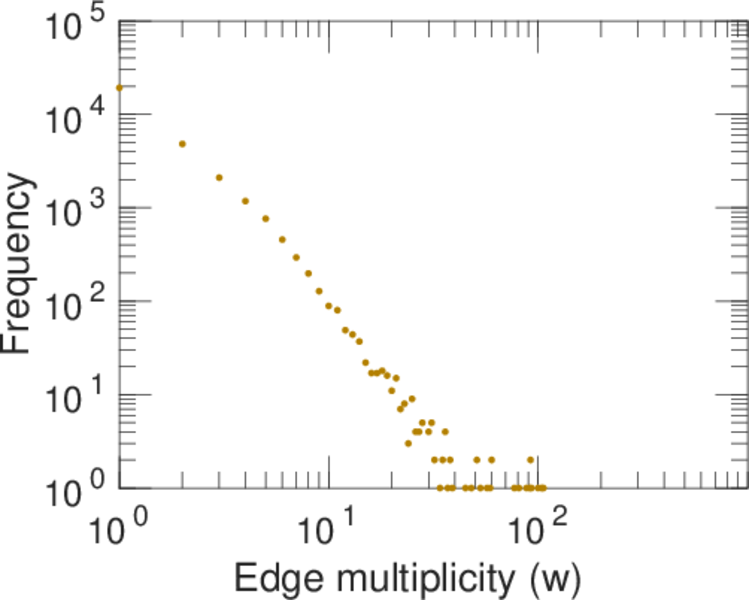
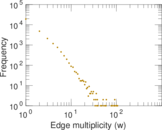
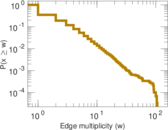
| Average edge multiplicity | m̃ = | 2.018 66
|
| Size of LCC | N = | 5,274
|
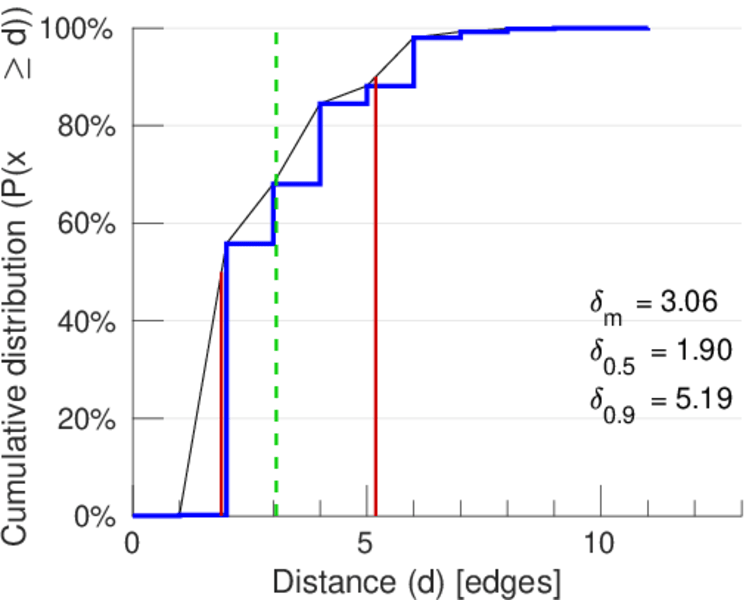
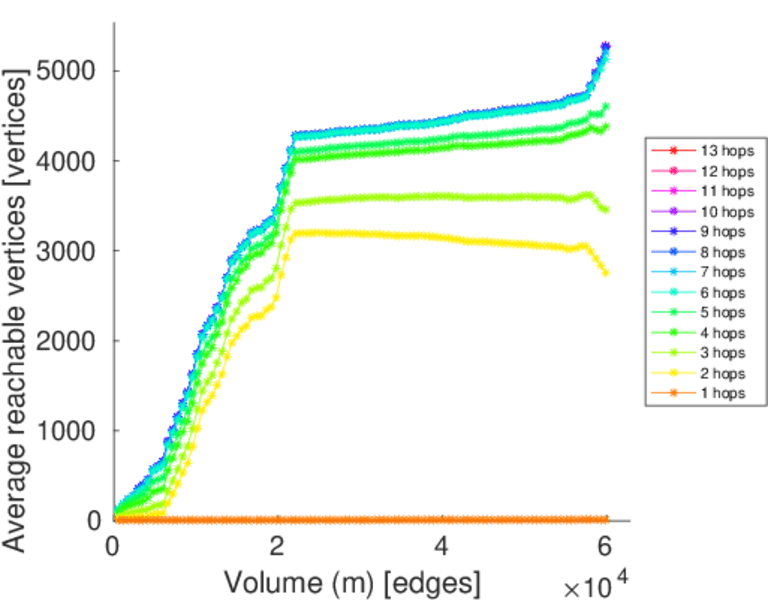
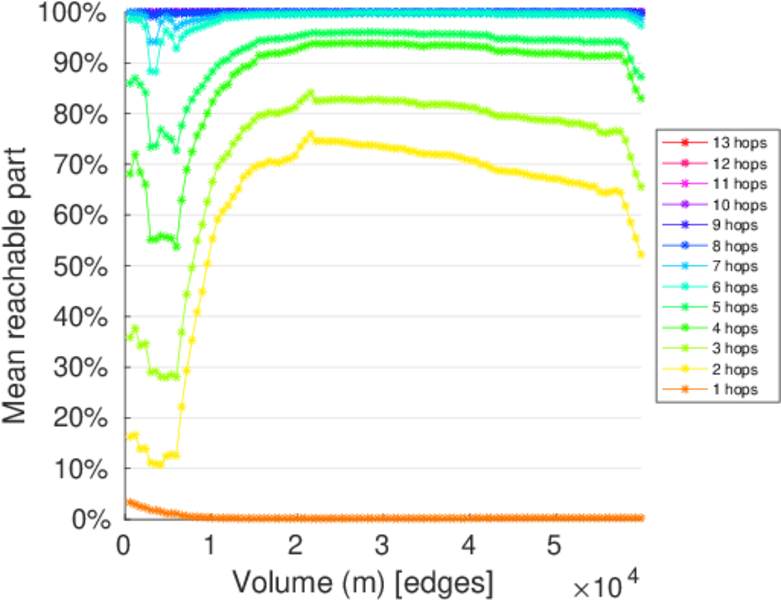
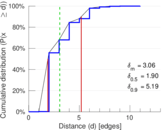
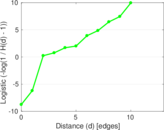
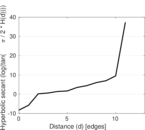
| Diameter | δ = | 13
|
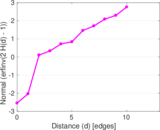
| 50-Percentile effective diameter | δ0.5 = | 1.895 96
|
| 90-Percentile effective diameter | δ0.9 = | 5.188 67
|
| Median distance | δM = | 2
|
| Mean distance | δm = | 3.062 97
|
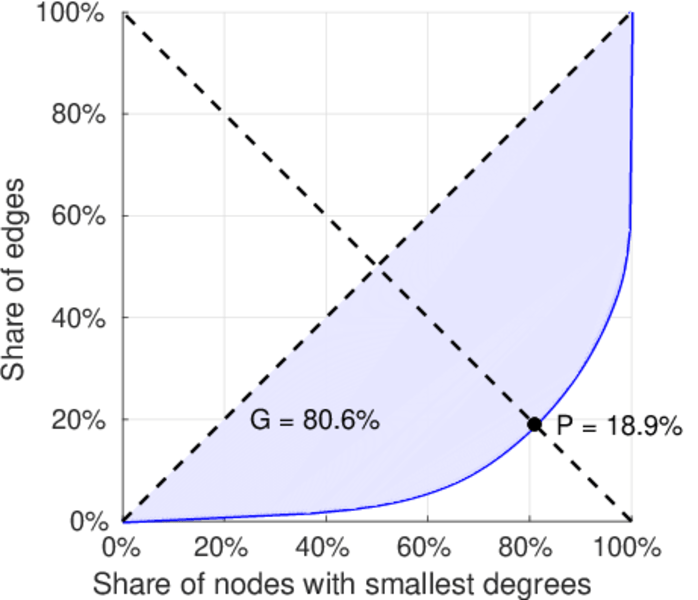
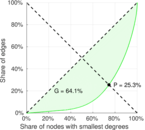
| Gini coefficient | G = | 0.795 948
|
| Balanced inequality ratio | P = | 0.194 303
|
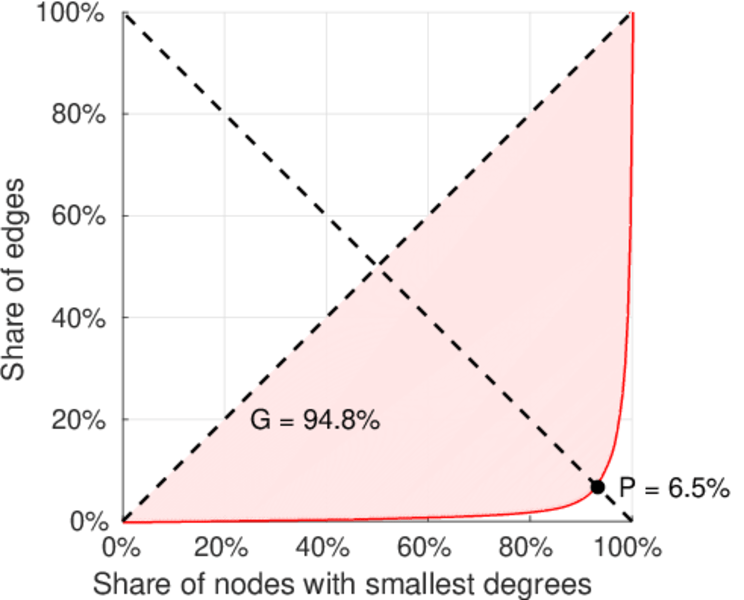
| Left balanced inequality ratio | P1 = | 0.065 427 7
|
| Right balanced inequality ratio | P2 = | 0.253 322
|
| Relative edge distribution entropy | Her = | 0.772 092
|
| Power law exponent | γ = | 1.875 98
|
| Tail power law exponent | γt = | 2.771 00
|
| Tail power law exponent with p | γ3 = | 2.771 00
|
| p-value | p = | 0.000 00
|
| Left tail power law exponent with p | γ3,1 = | 1.491 00
|
| Left p-value | p1 = | 0.004 000 00
|
| Right tail power law exponent with p | γ3,2 = | 5.591 00
|
| Right p-value | p2 = | 0.076 000 0
|
| Degree assortativity | ρ = | −0.295 939
|
| Degree assortativity p-value | pρ = | 0.000 00
|
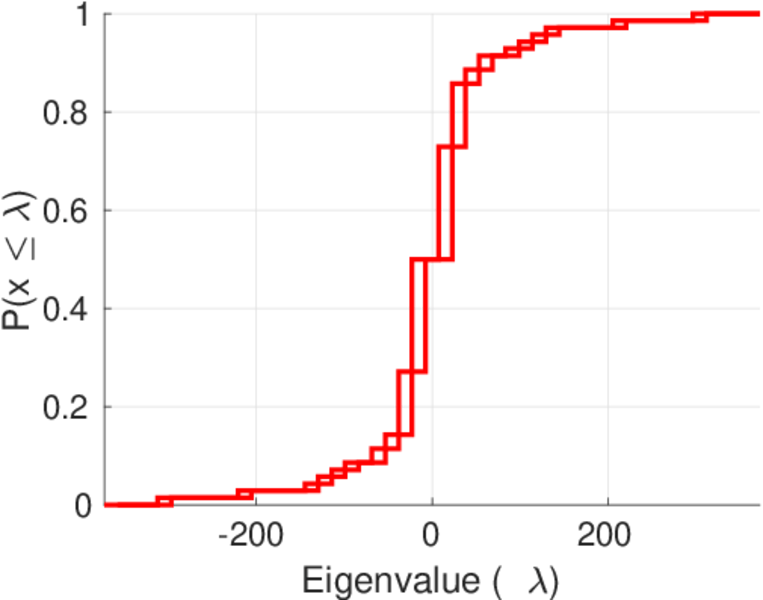
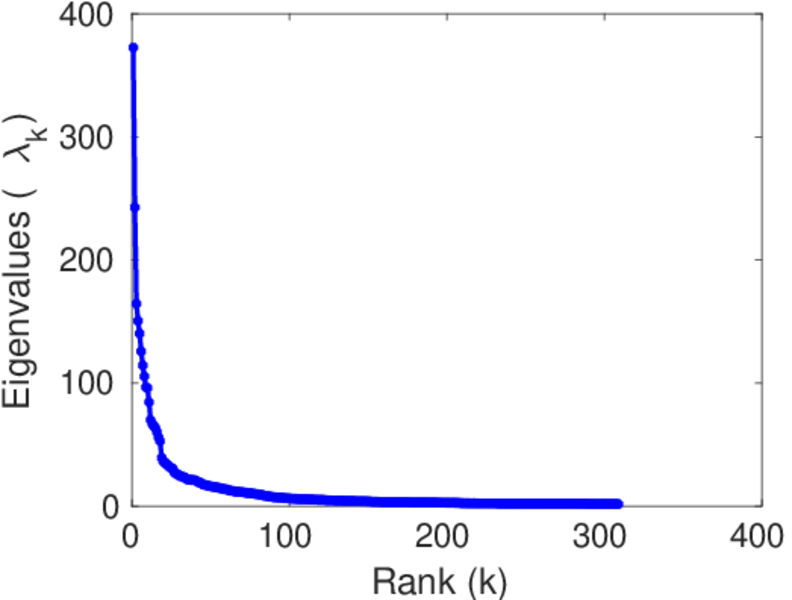
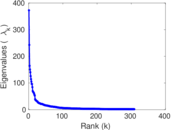
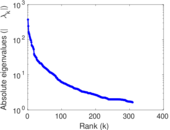
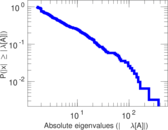
| Spectral norm | α = | 372.505
|
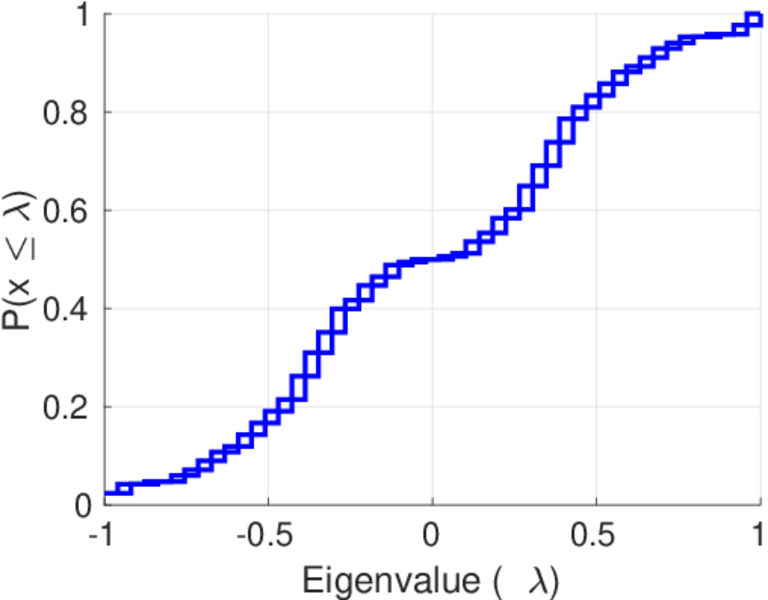
| Algebraic connectivity | a = | 0.026 081 9
|
| Spectral separation | |λ1[A] / λ2[A]| = | 1.535 54
|
| Controllability | C = | 4,305
|
| Relative controllability | Cr = | 0.748 305
|
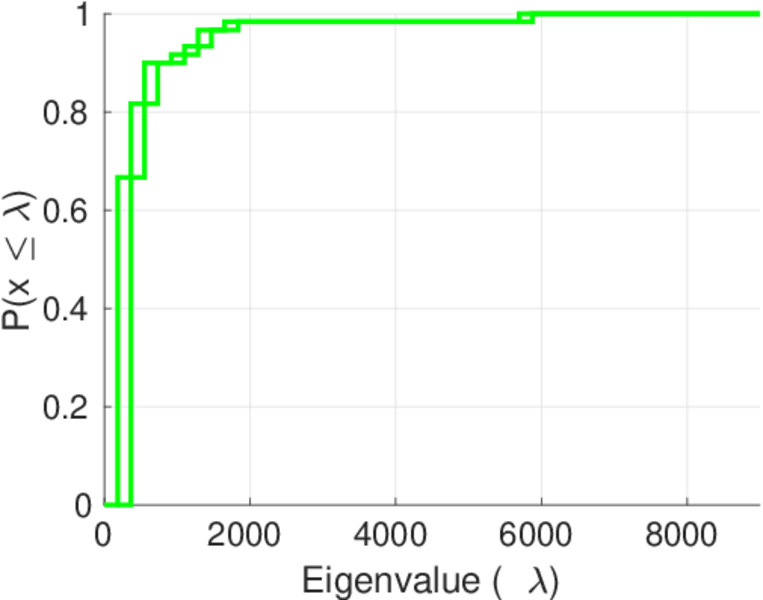
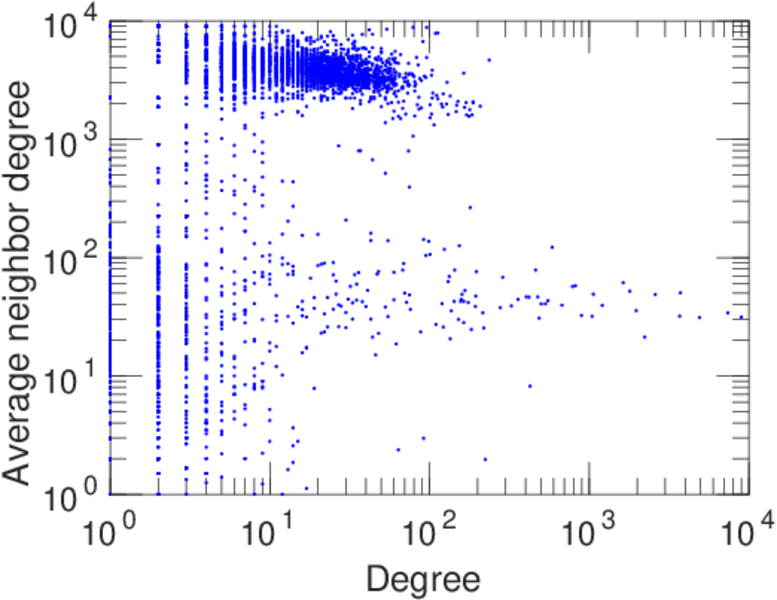
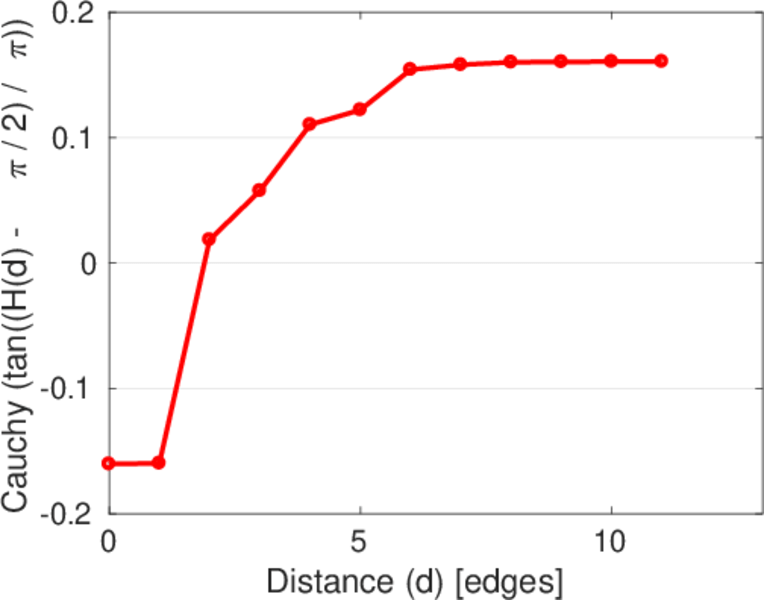
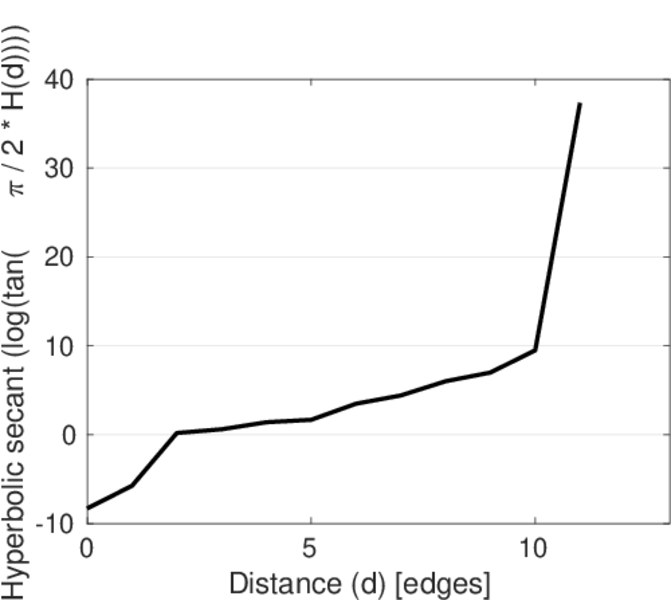
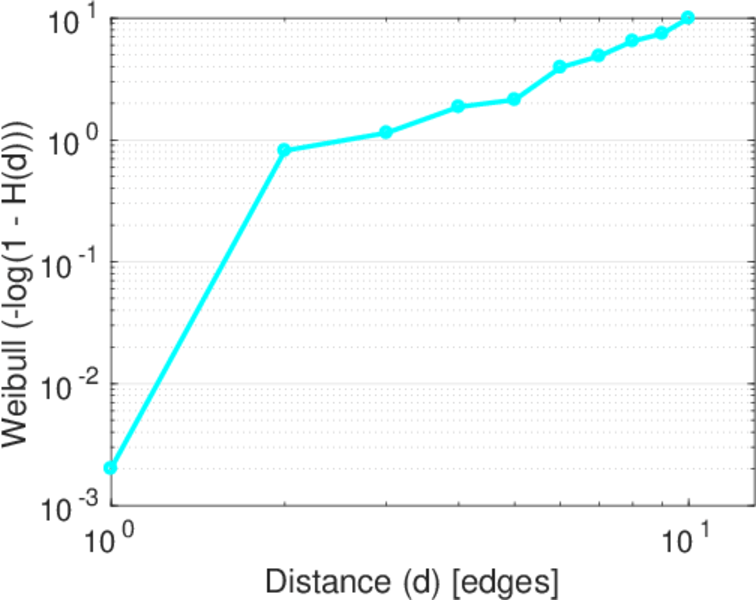
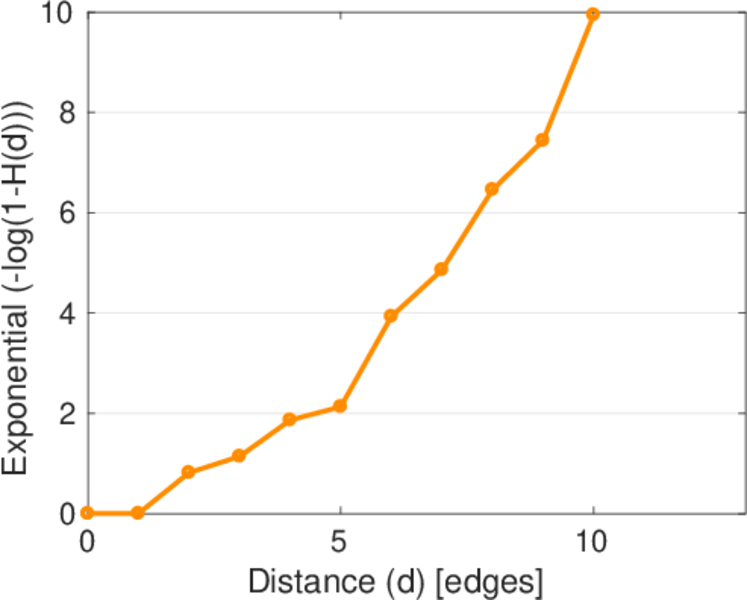
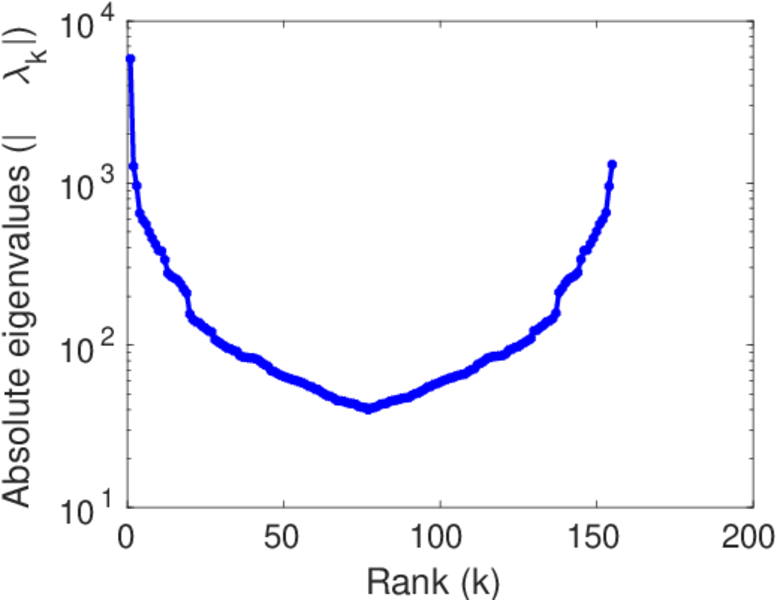
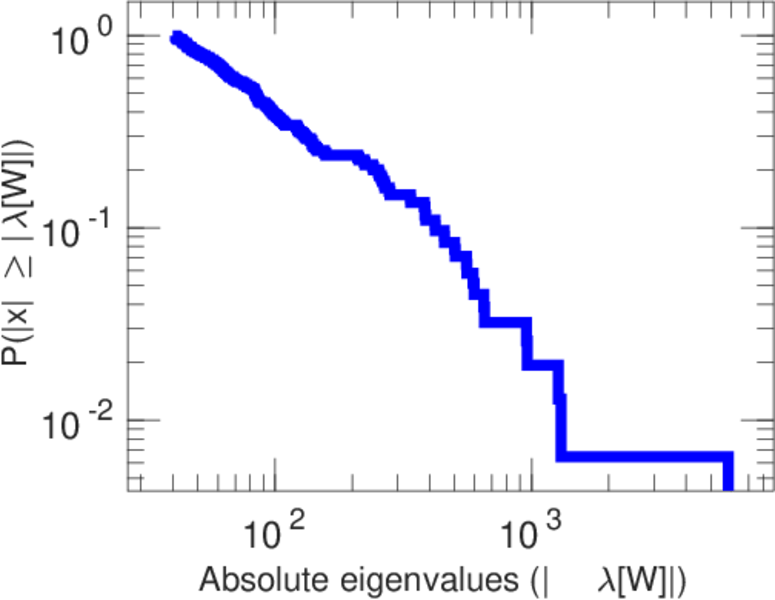
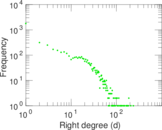
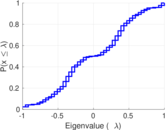
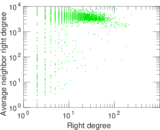
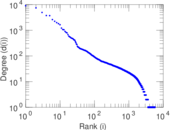
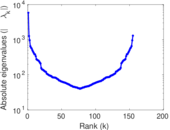
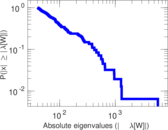
Plots


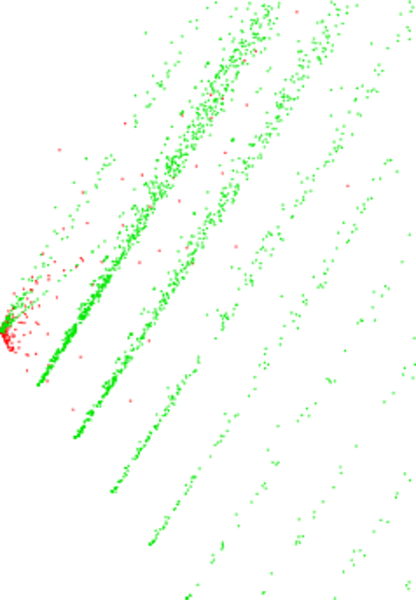
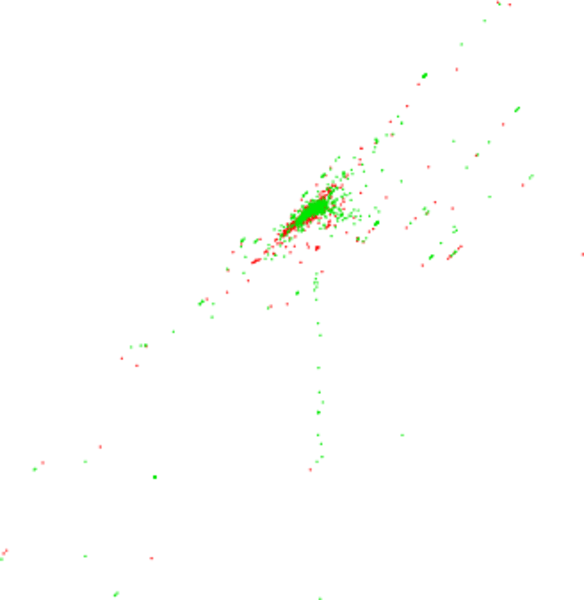
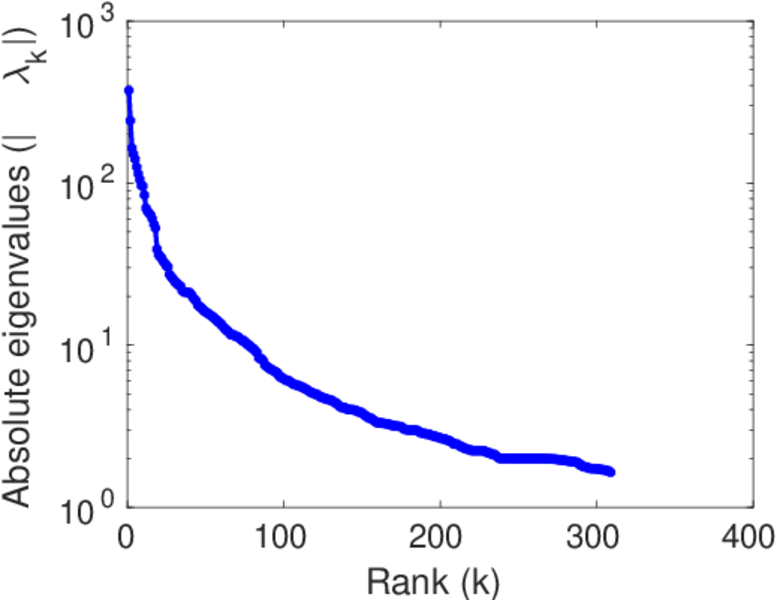
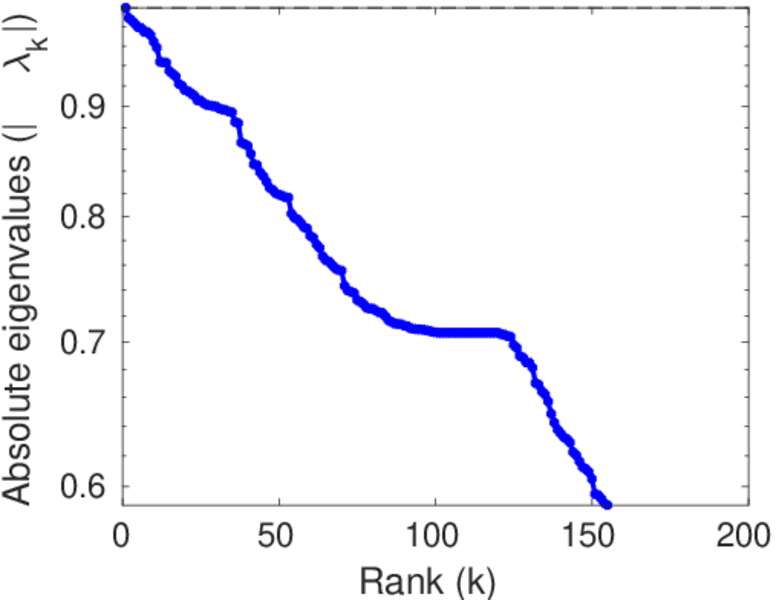
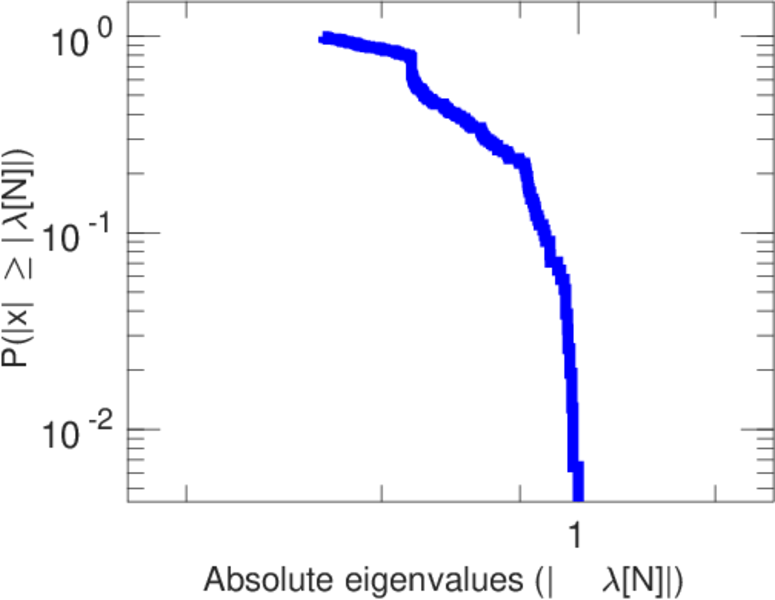
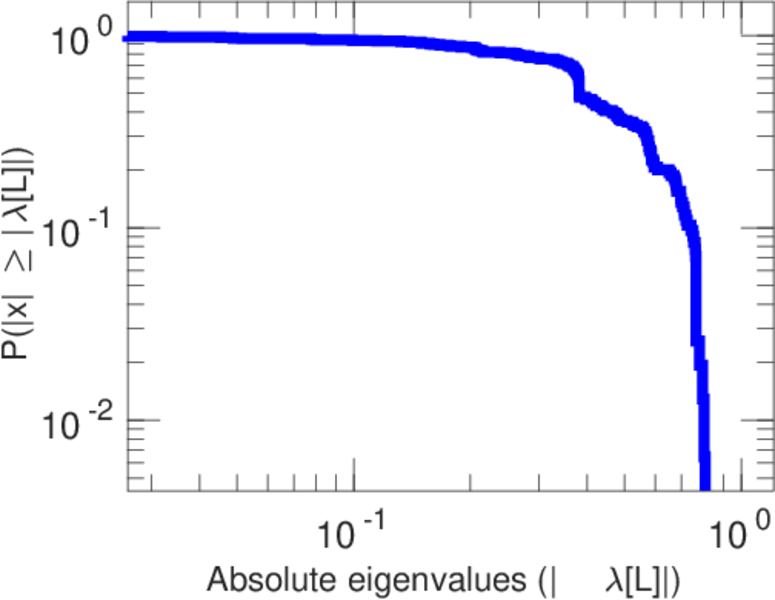
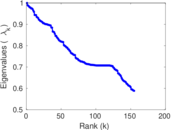
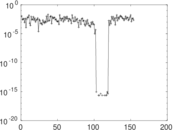
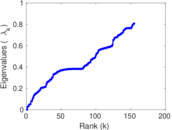
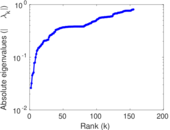
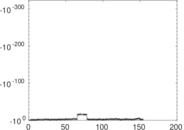
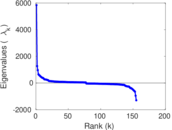
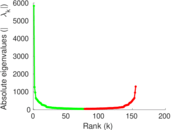
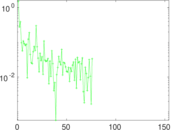
Matrix decompositions plots


Downloads
References
|
[1]
|
Jérôme Kunegis.
KONECT – The Koblenz Network Collection.
In Proc. Int. Conf. on World Wide Web Companion, pages
1343–1350, 2013.
[ http ]
|
|
[2]
|
Wikimedia Foundation.
Wikimedia downloads.
http://dumps.wikimedia.org/, January 2010.
|
 KONECT ‣ Networks ‣
Buy Me a Coffee
KONECT ‣ Networks ‣
Buy Me a Coffee