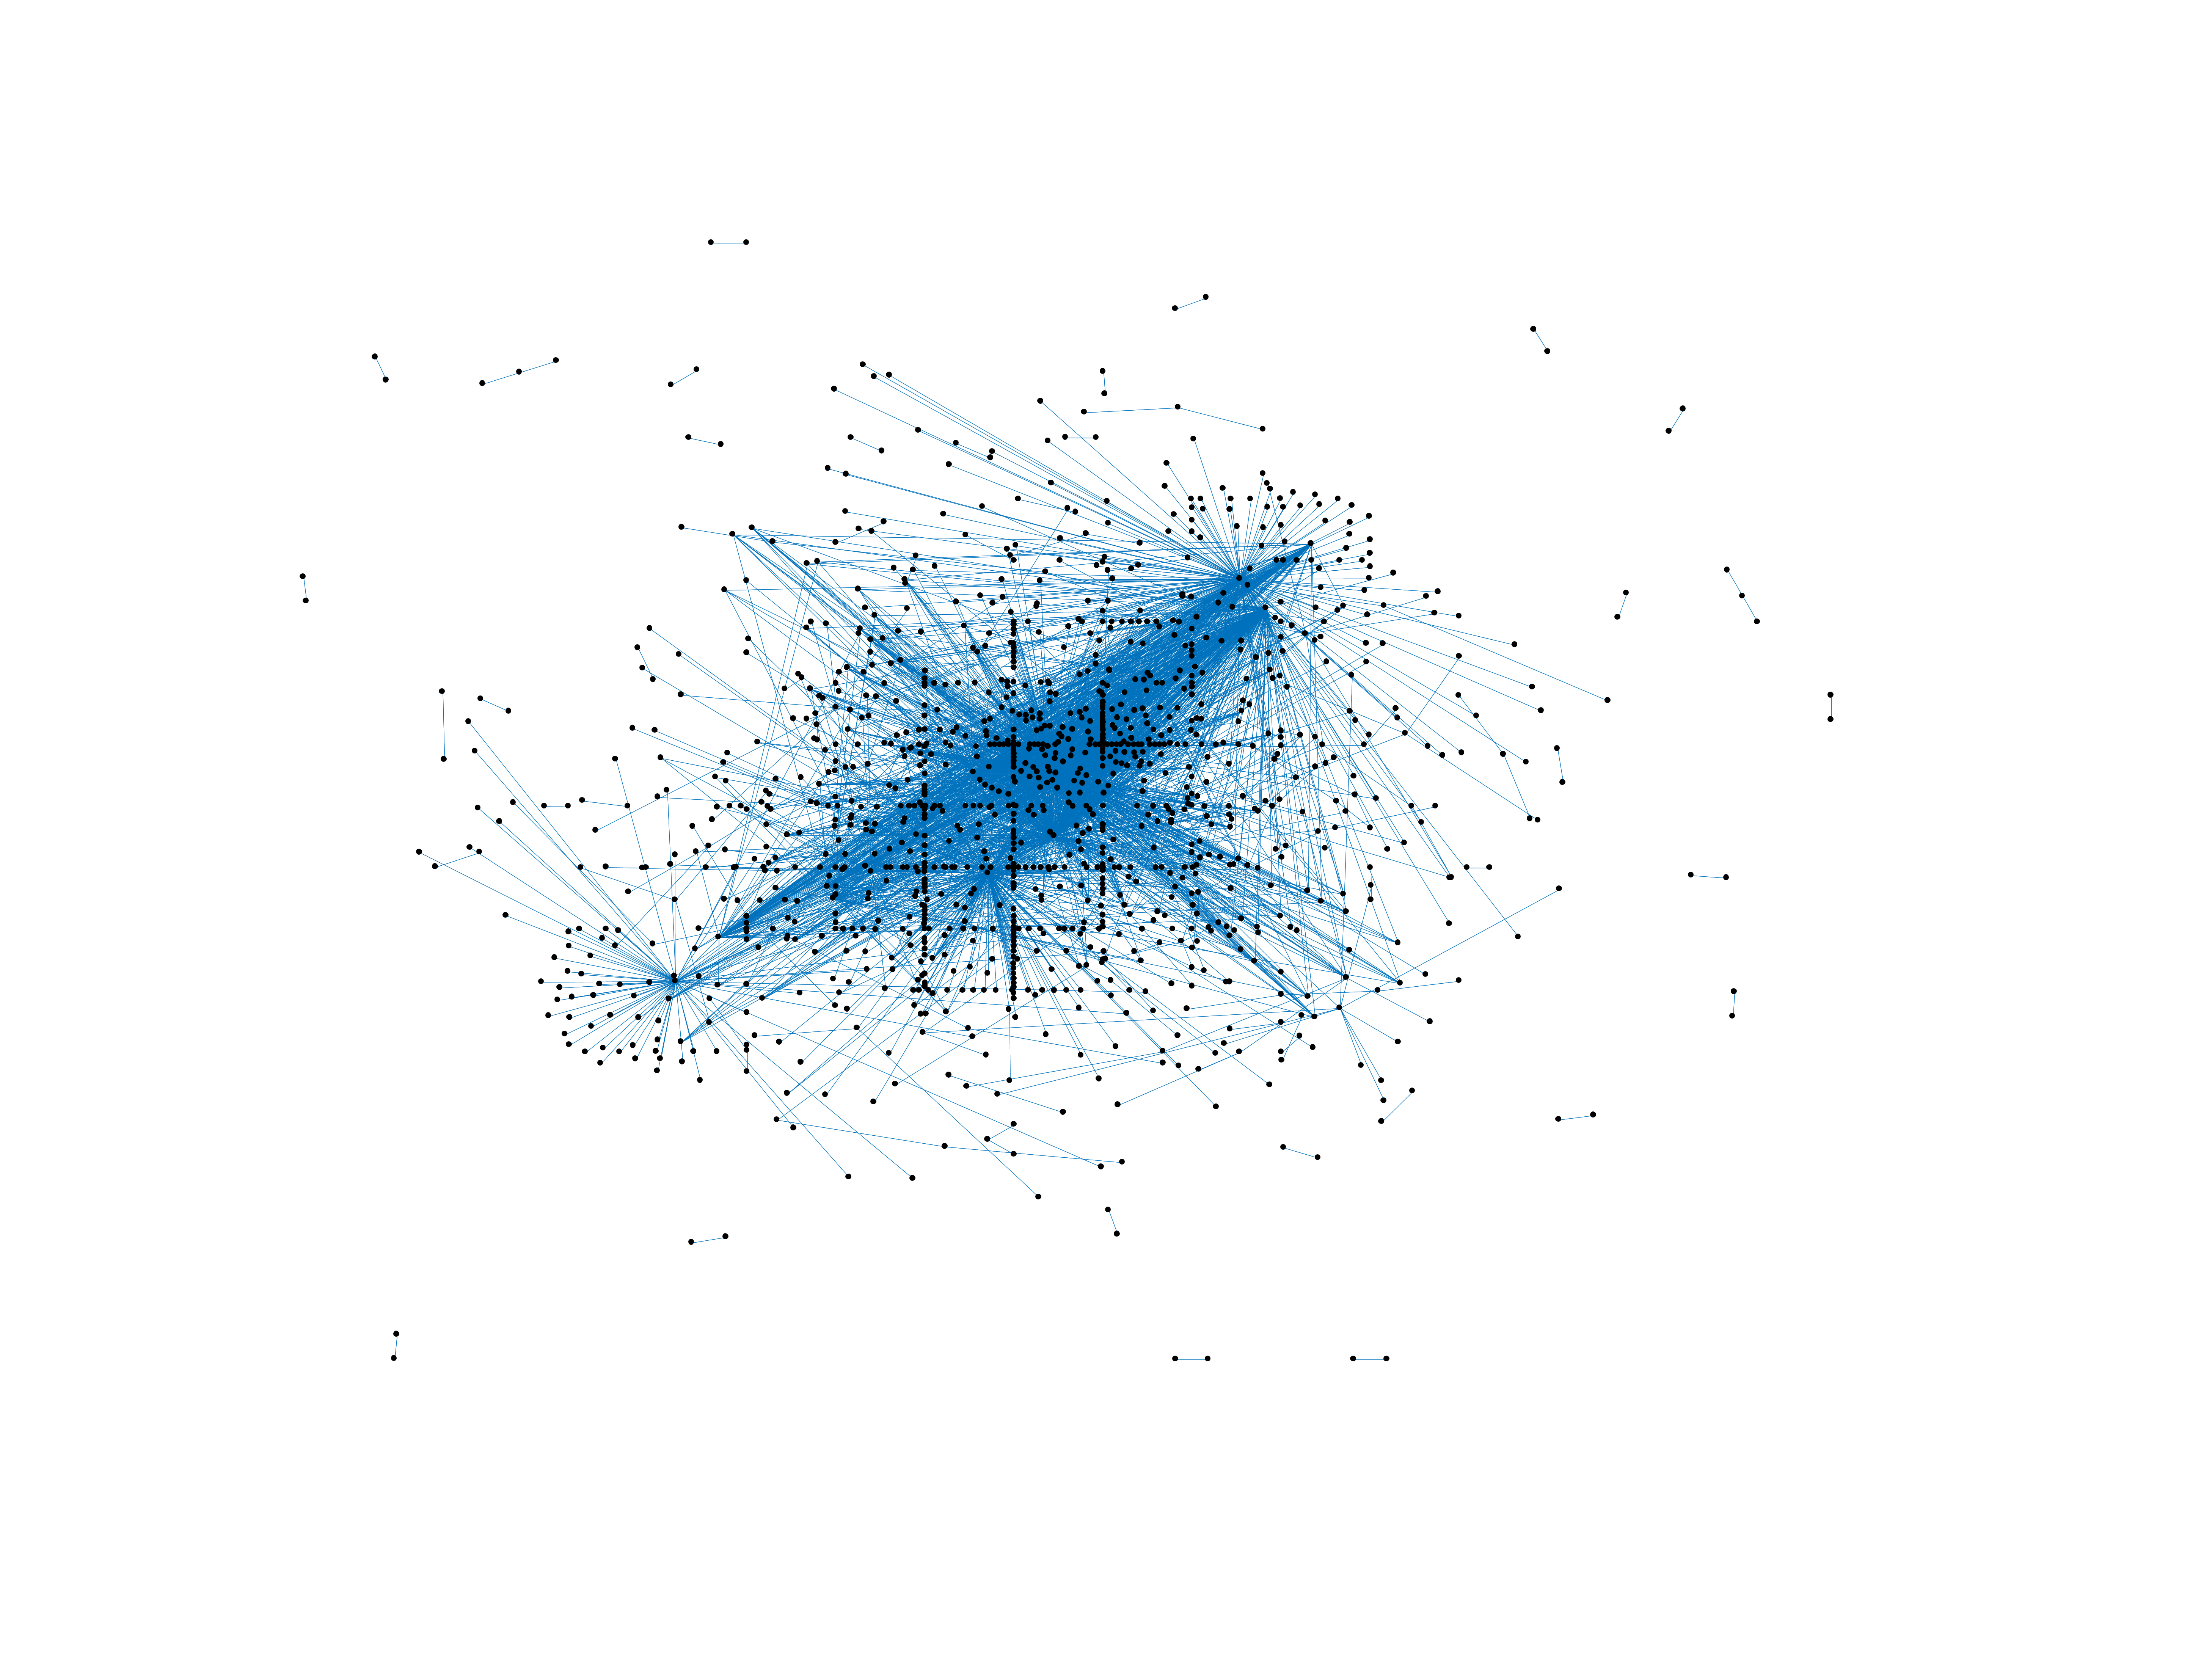
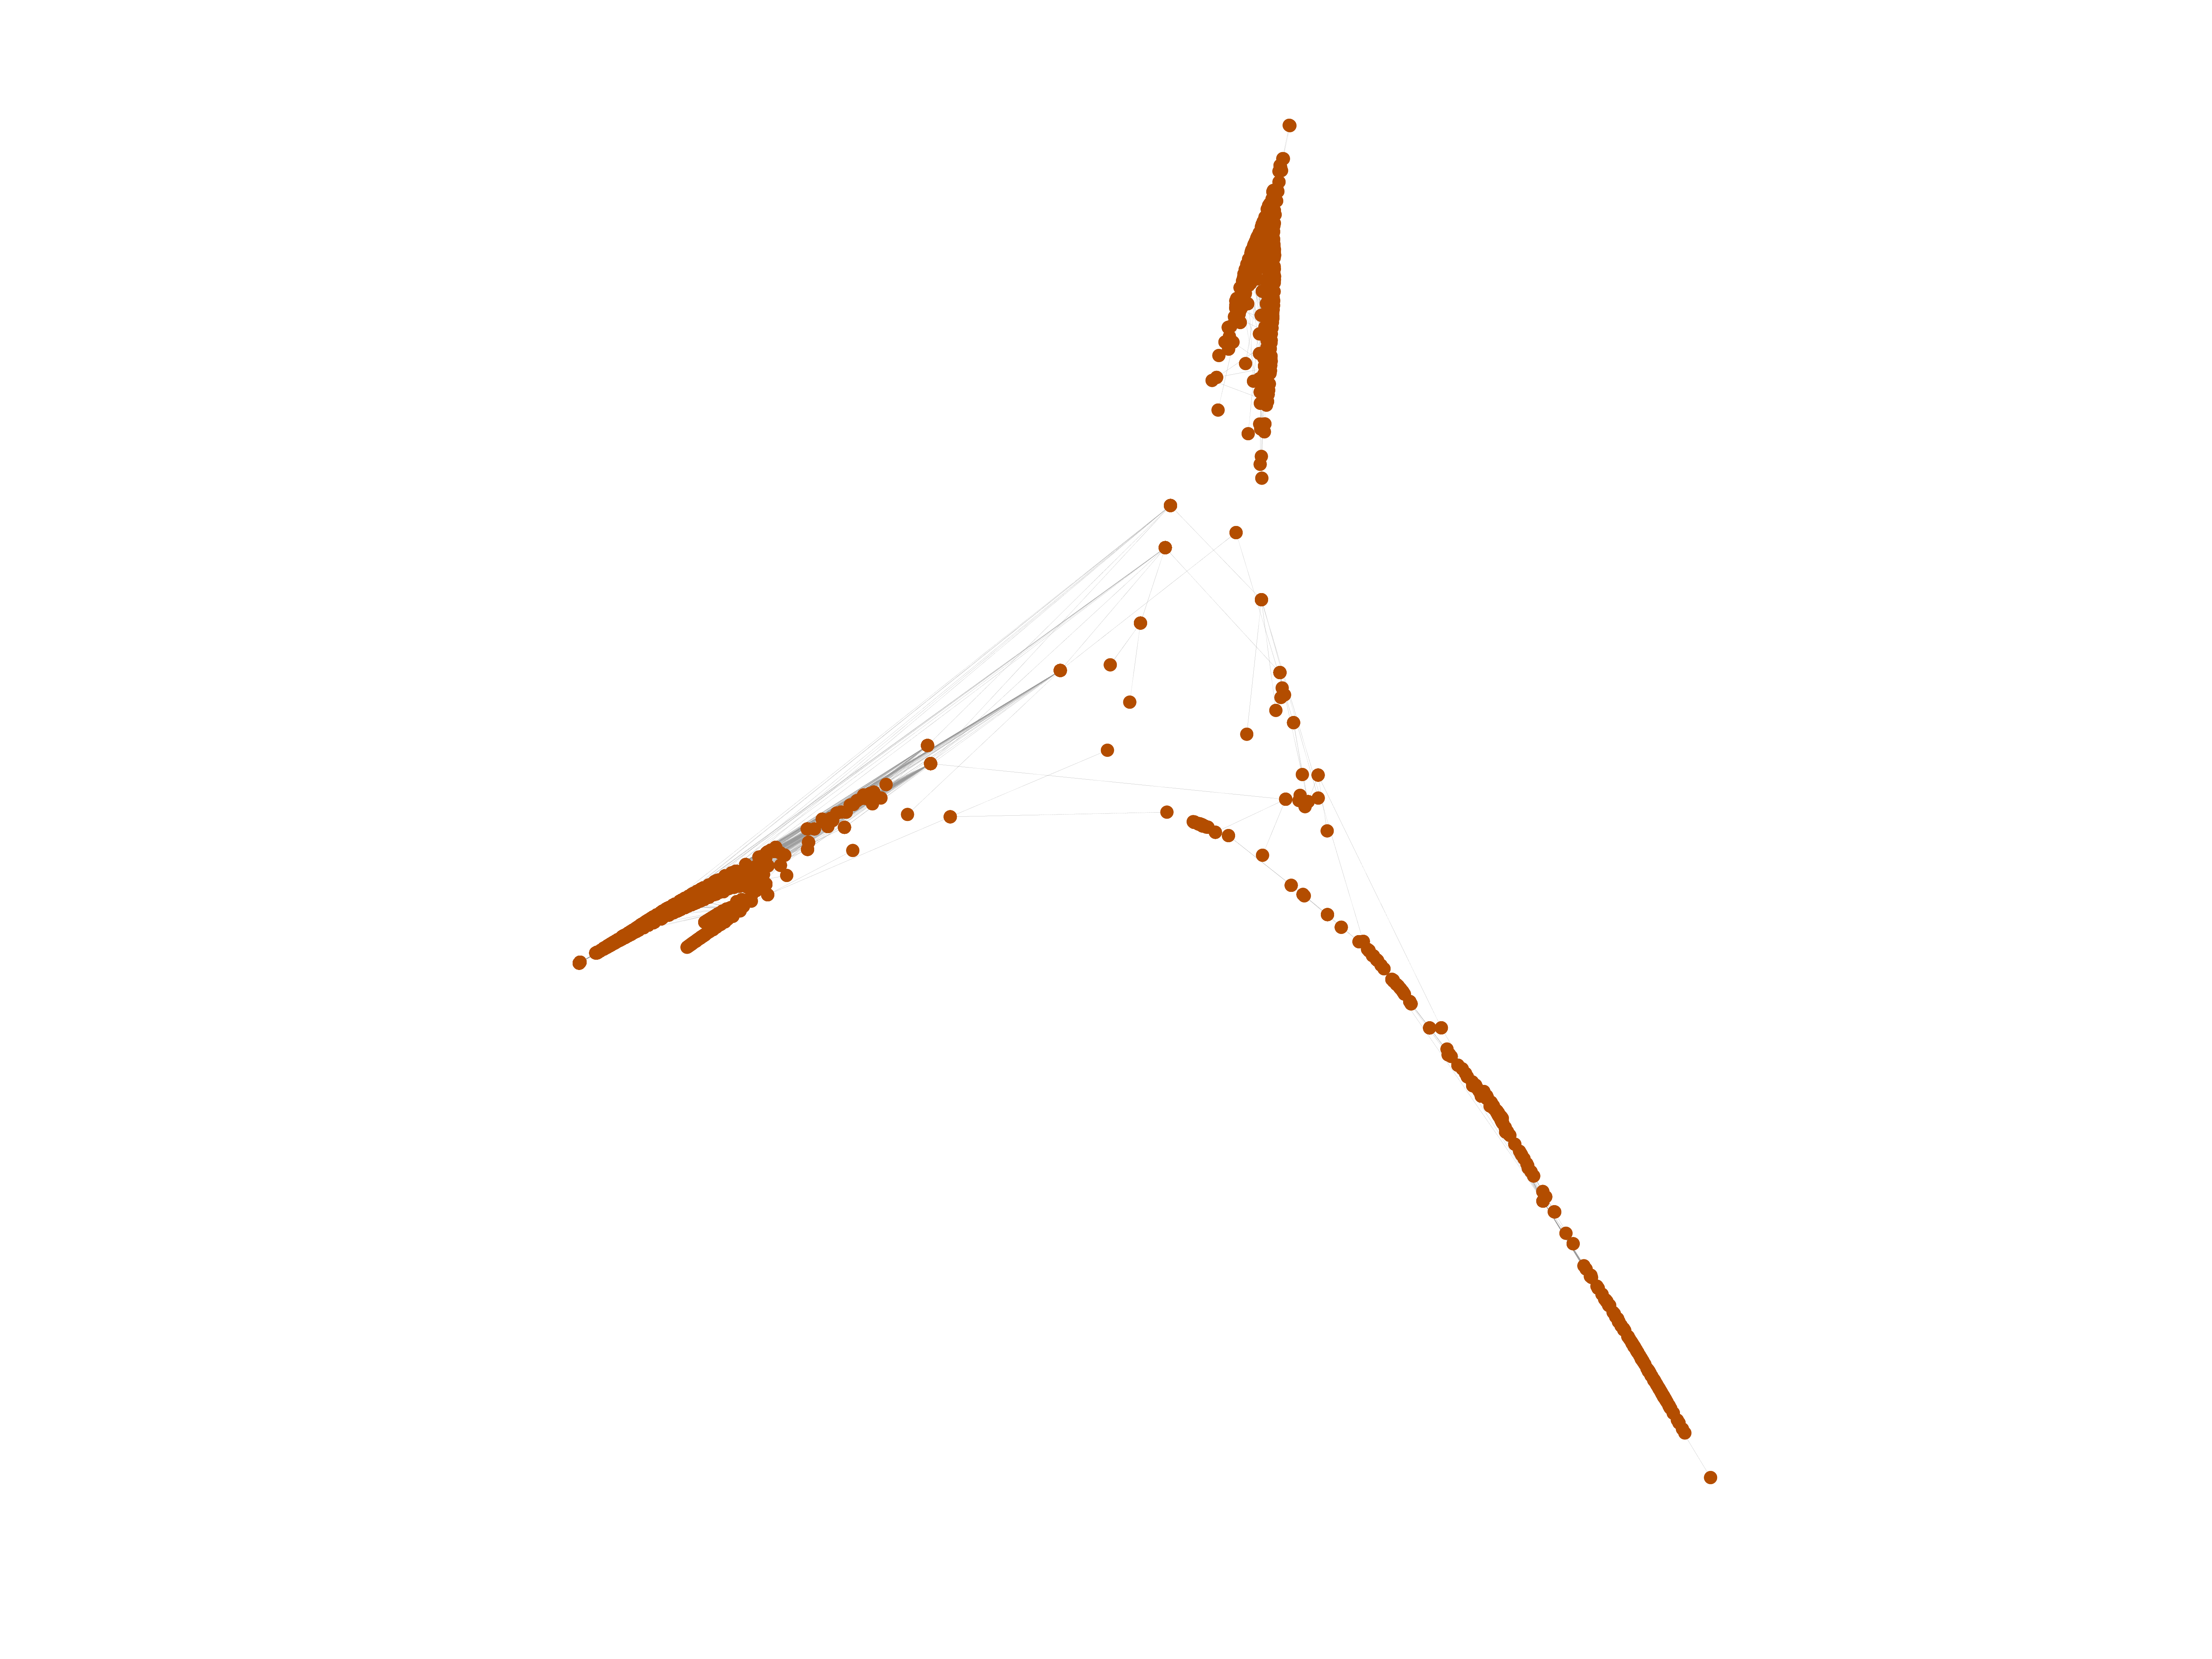
Wiktionary edits (rw)
This is the bipartite edit network of the Kinyarwanda Wiktionary. It contains
users and pages from the Kinyarwanda Wiktionary, connected by edit events. Each
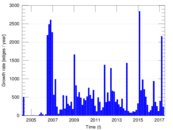
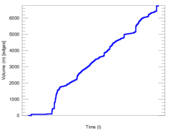
edge represents an edit. The dataset includes the timestamp of each edit.
Metadata
Statistics
| Size | n = | 1,321
|
| Left size | n1 = | 175
|
| Right size | n2 = | 1,146
|
| Volume | m = | 6,776
|
| Unique edge count | m̿ = | 3,268
|
| Wedge count | s = | 274,827
|
| Claw count | z = | 19,620,161
|
| Cross count | x = | 1,233,074,874
|
| Square count | q = | 456,519
|
| 4-Tour count | T4 = | 4,758,304
|
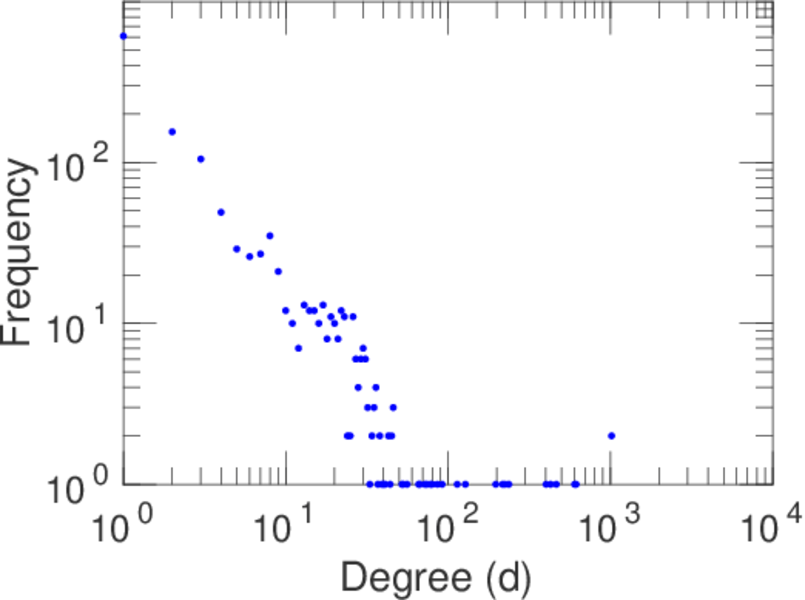
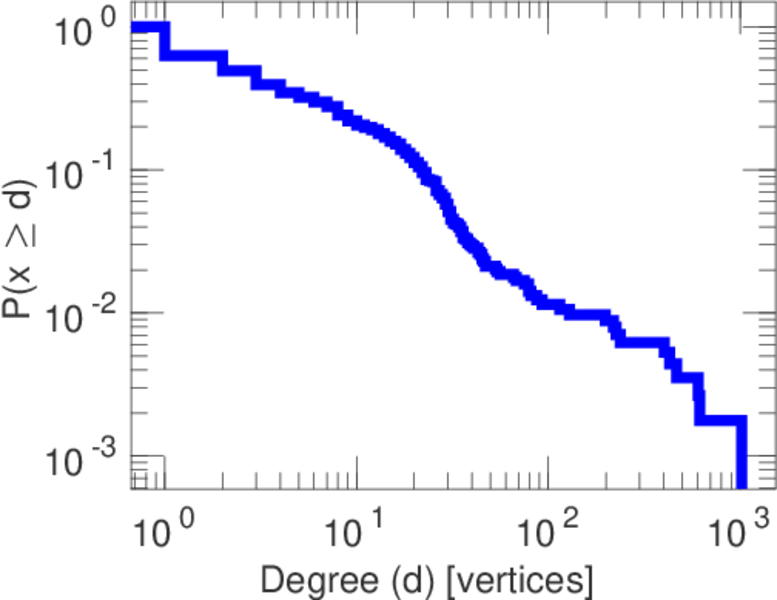
| Maximum degree | dmax = | 1,019
|
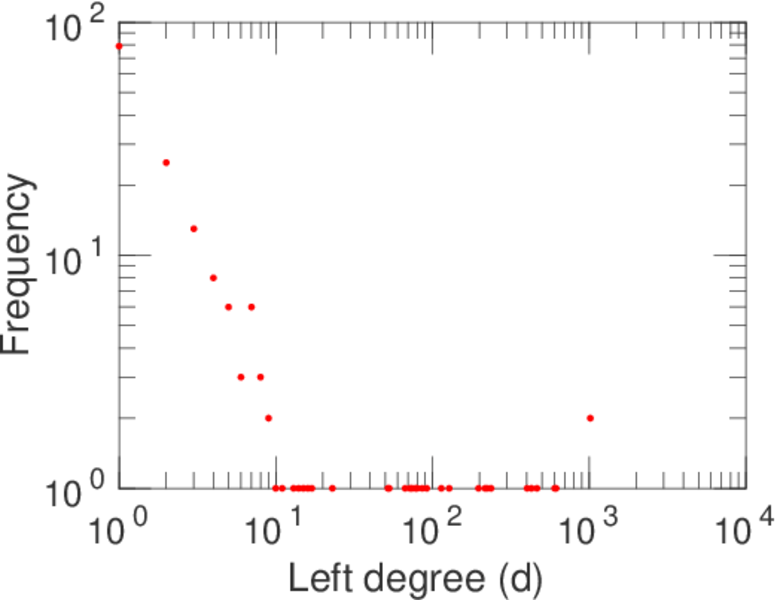
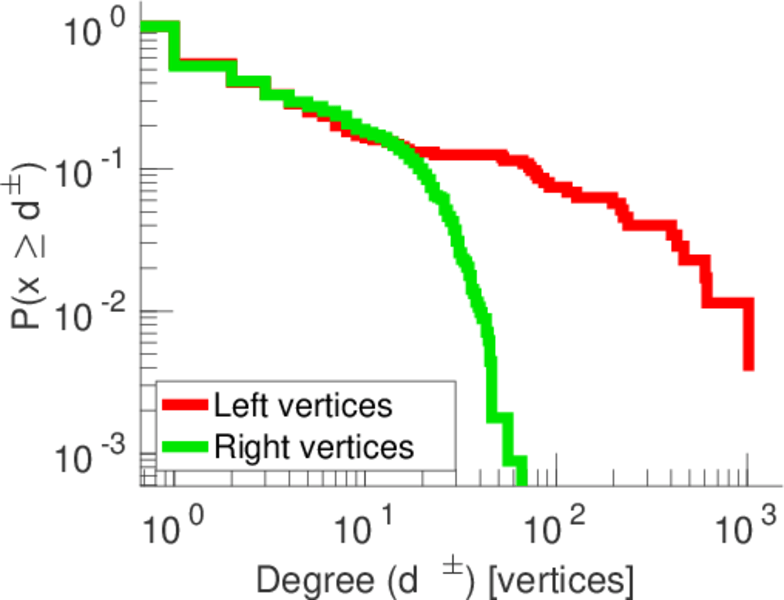
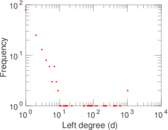
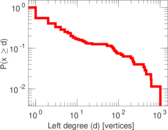
| Maximum left degree | d1max = | 1,019
|
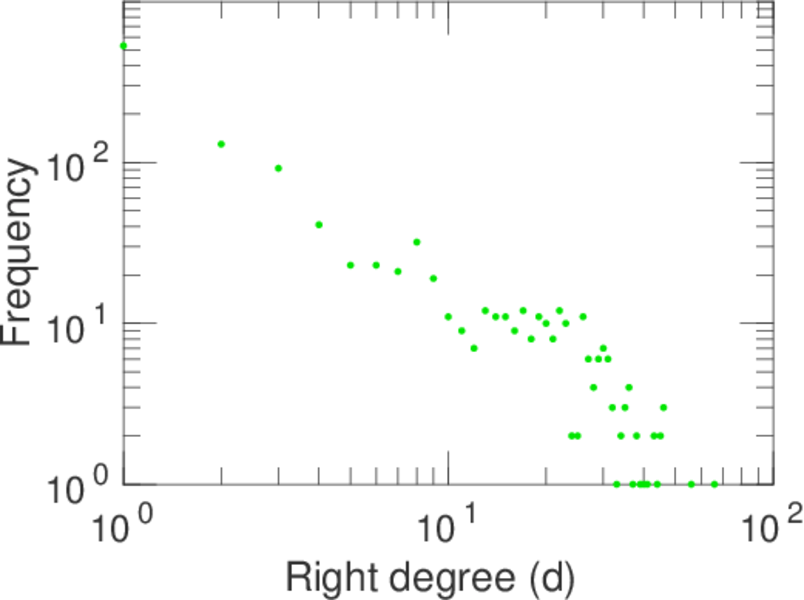
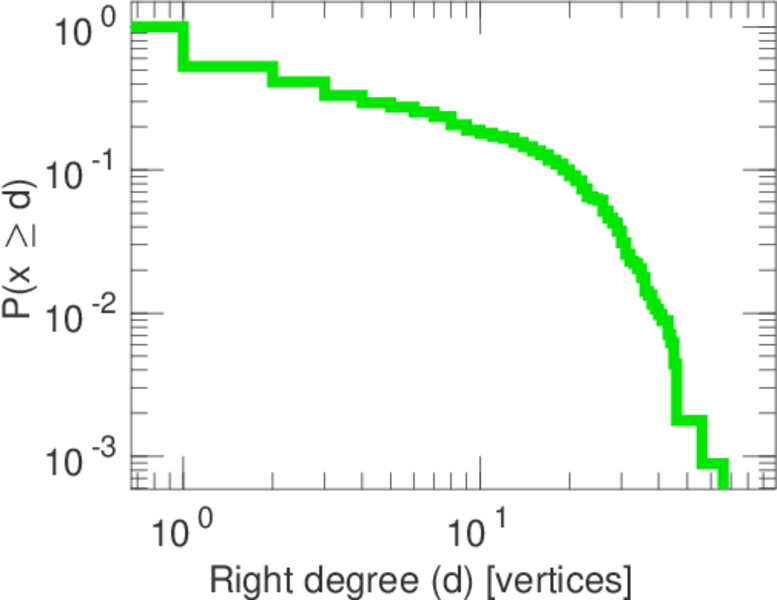
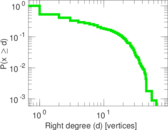
| Maximum right degree | d2max = | 66
|
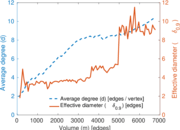
| Average degree | d = | 10.258 9
|
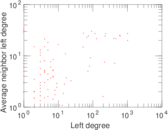
| Average left degree | d1 = | 38.720 0
|
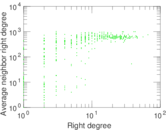
| Average right degree | d2 = | 5.912 74
|
| Fill | p = | 0.016 295 2
|
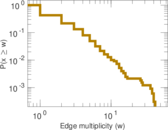
| Average edge multiplicity | m̃ = | 2.073 44
|
| Size of LCC | N = | 990
|
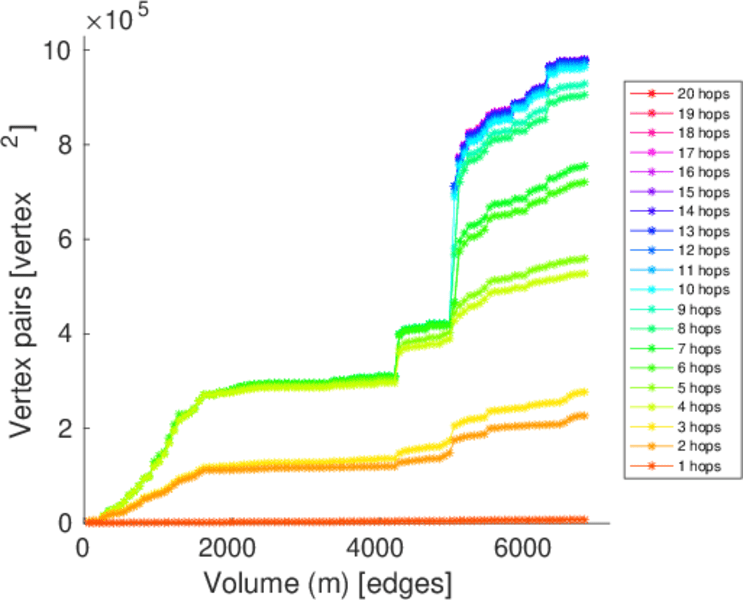
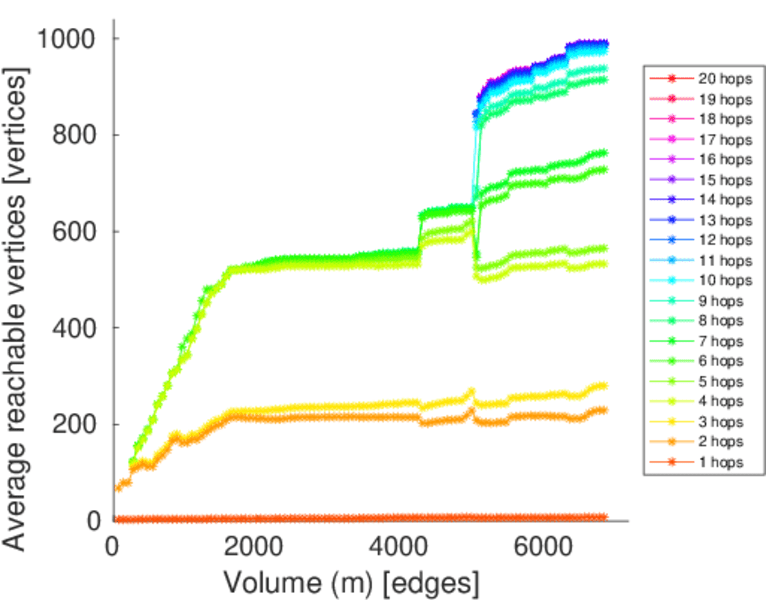
| Diameter | δ = | 18
|
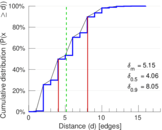
| 50-Percentile effective diameter | δ0.5 = | 4.060 52
|
| 90-Percentile effective diameter | δ0.9 = | 8.054 96
|
| Median distance | δM = | 5
|
| Mean distance | δm = | 5.152 73
|
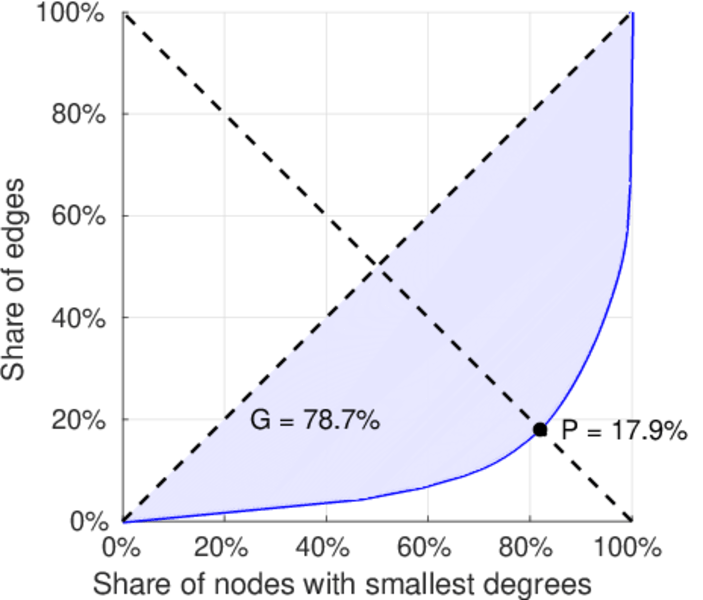
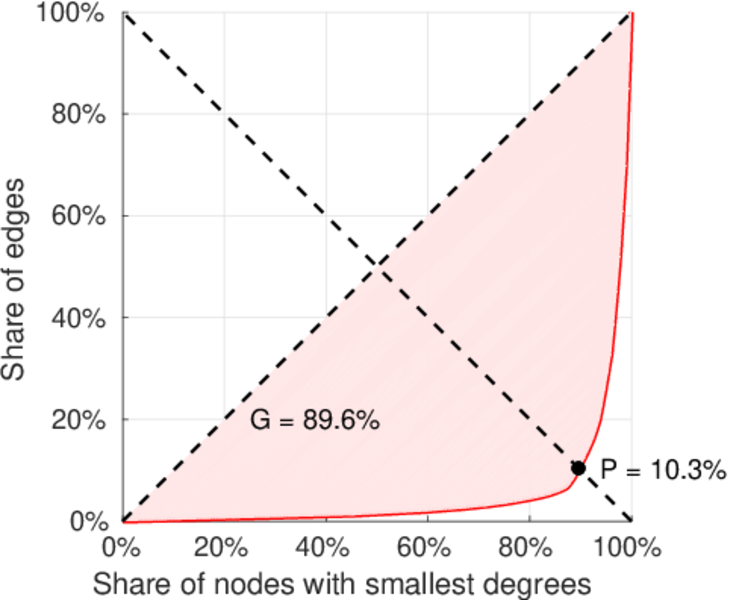
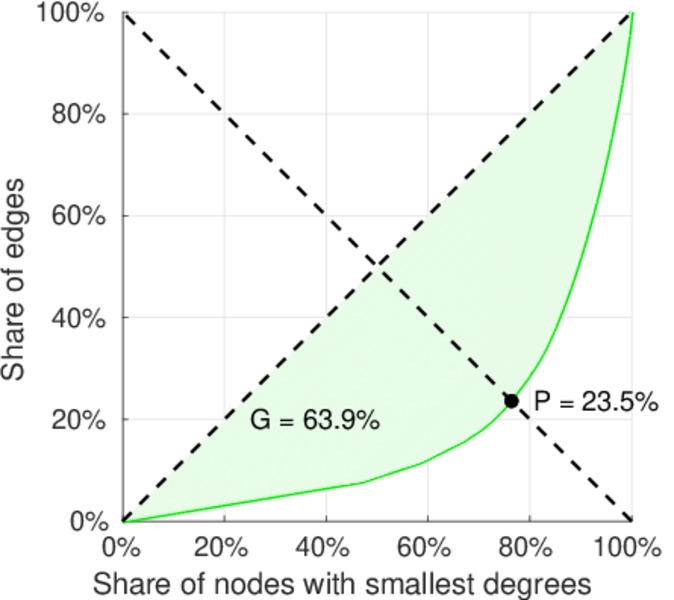
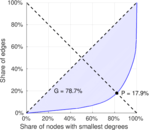
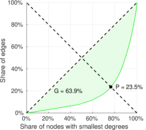
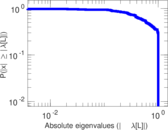
| Gini coefficient | G = | 0.775 089
|
| Balanced inequality ratio | P = | 0.189 787
|
| Left balanced inequality ratio | P1 = | 0.102 568
|
| Right balanced inequality ratio | P2 = | 0.234 504
|
| Relative edge distribution entropy | Her = | 0.794 703
|
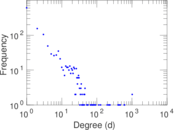
| Power law exponent | γ = | 2.453 36
|
| Tail power law exponent | γt = | 1.881 00
|
| Tail power law exponent with p | γ3 = | 1.881 00
|
| p-value | p = | 0.000 00
|
| Left tail power law exponent with p | γ3,1 = | 1.661 00
|
| Left p-value | p1 = | 0.010 000 0
|
| Right tail power law exponent with p | γ3,2 = | 1.931 00
|
| Right p-value | p2 = | 0.000 00
|
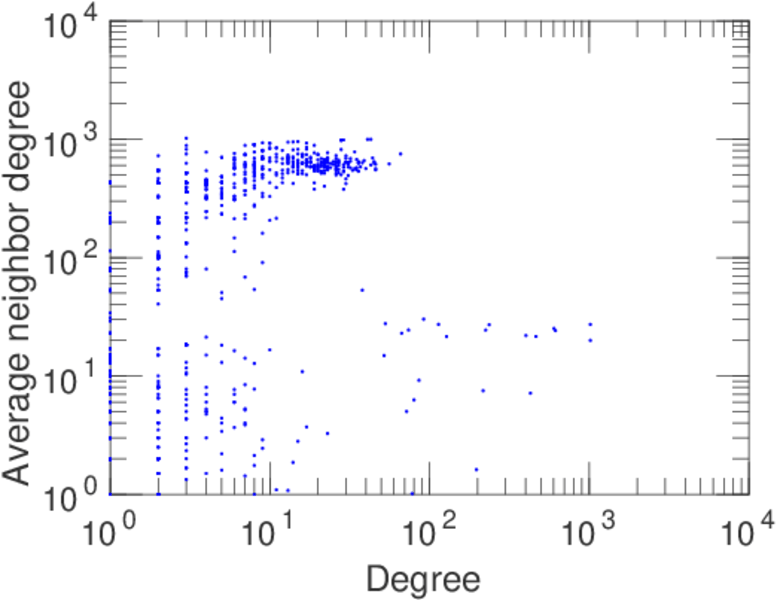
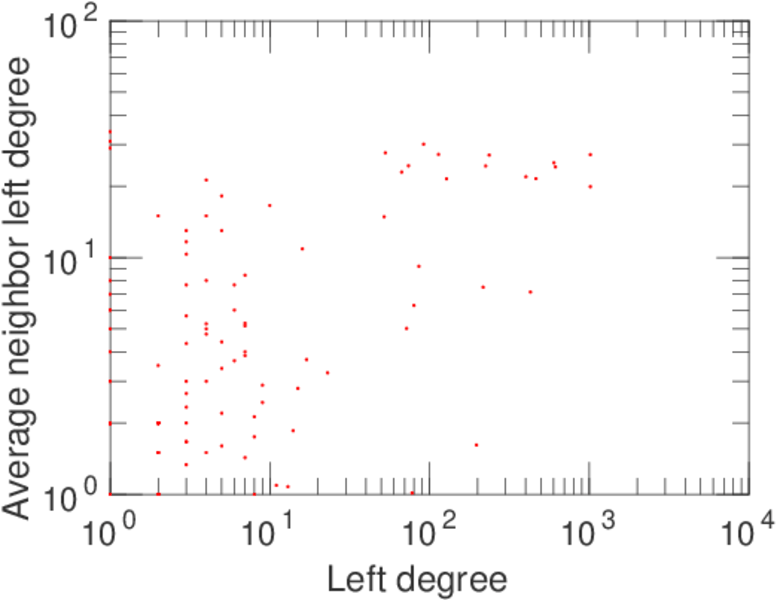
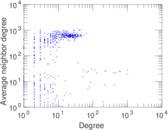
| Degree assortativity | ρ = | +0.241 431
|
| Degree assortativity p-value | pρ = | 1.471 05 × 10−44
|
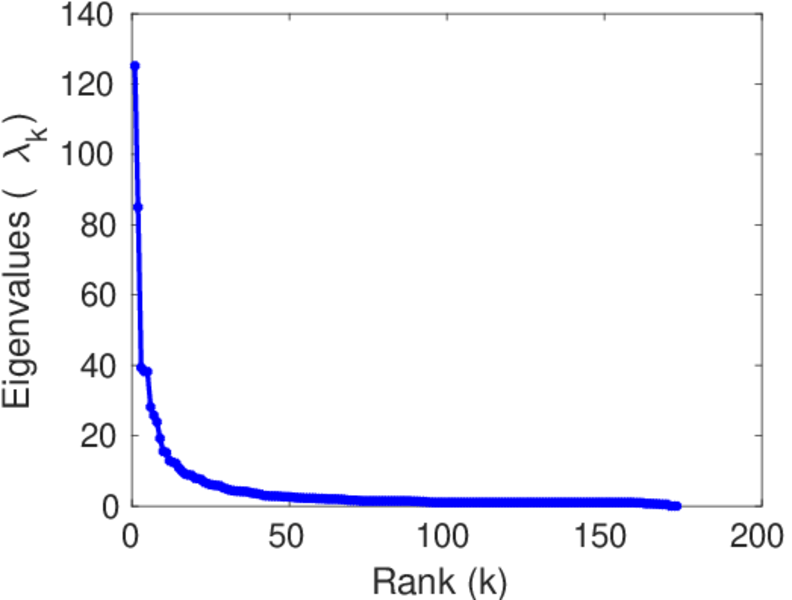
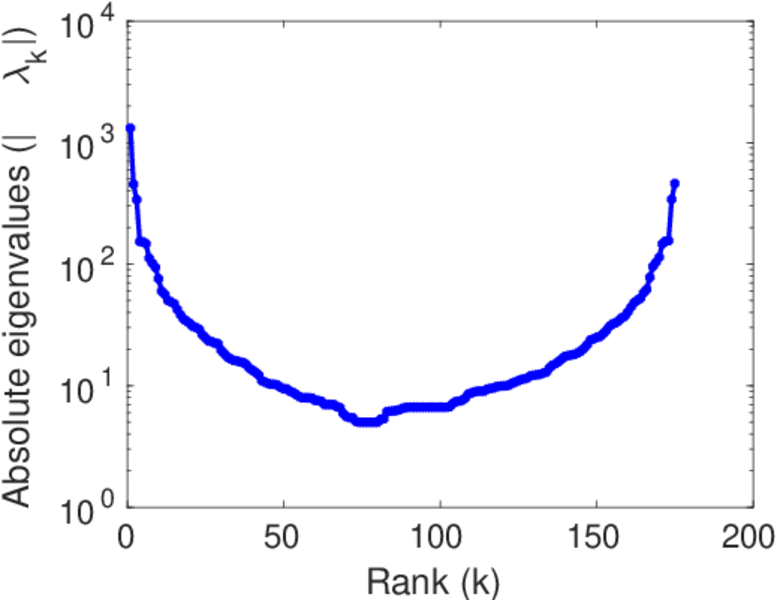
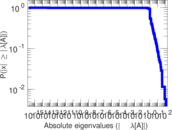
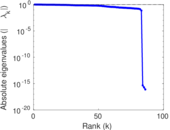
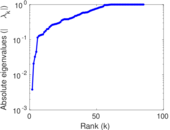
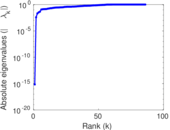
| Spectral norm | α = | 125.151
|
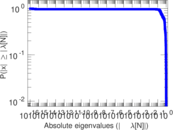
| Algebraic connectivity | a = | 0.003 797 35
|
| Spectral separation | |λ1[A] / λ2[A]| = | 1.472 41
|
| Controllability | C = | 961
|
| Relative controllability | Cr = | 0.738 663
|
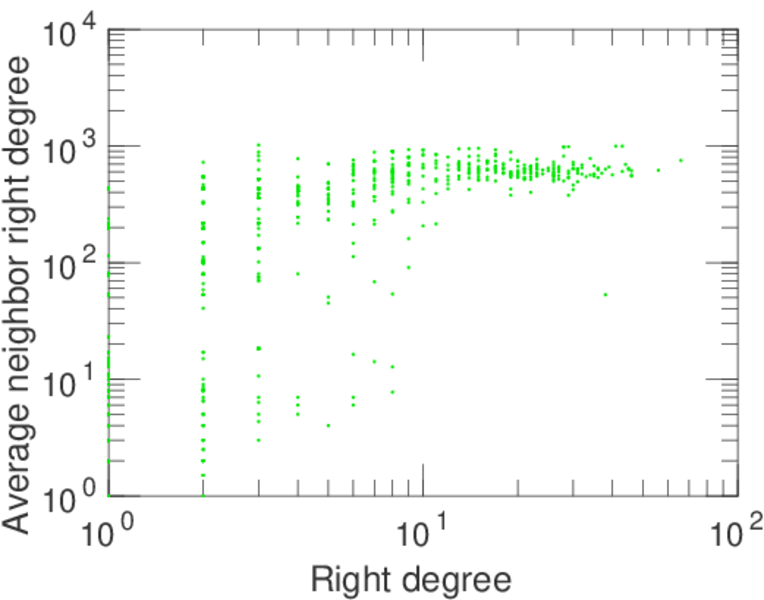
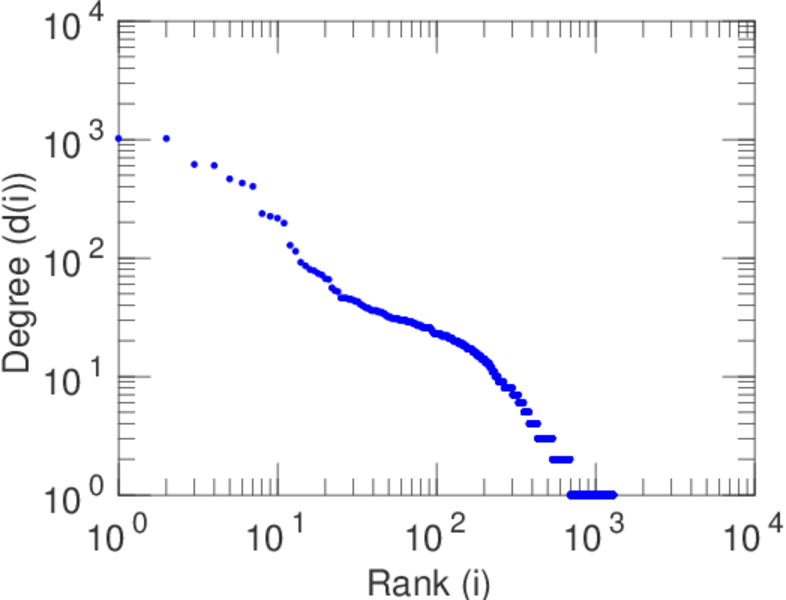
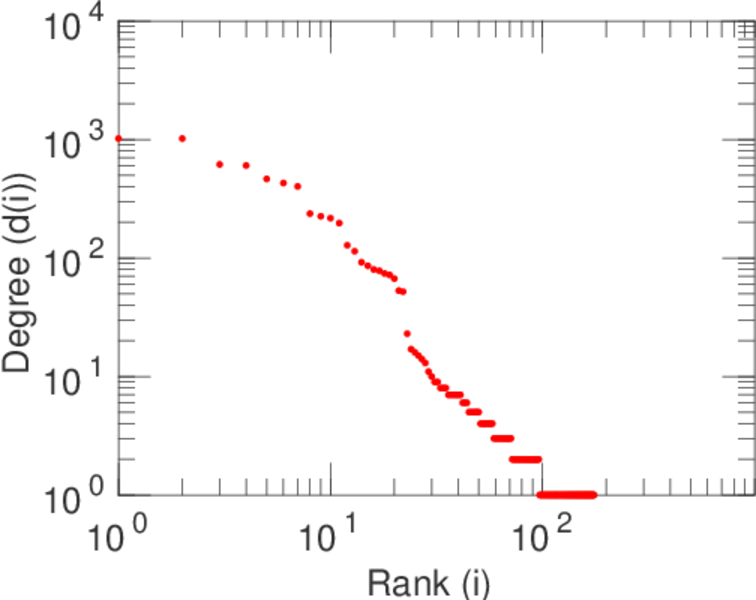
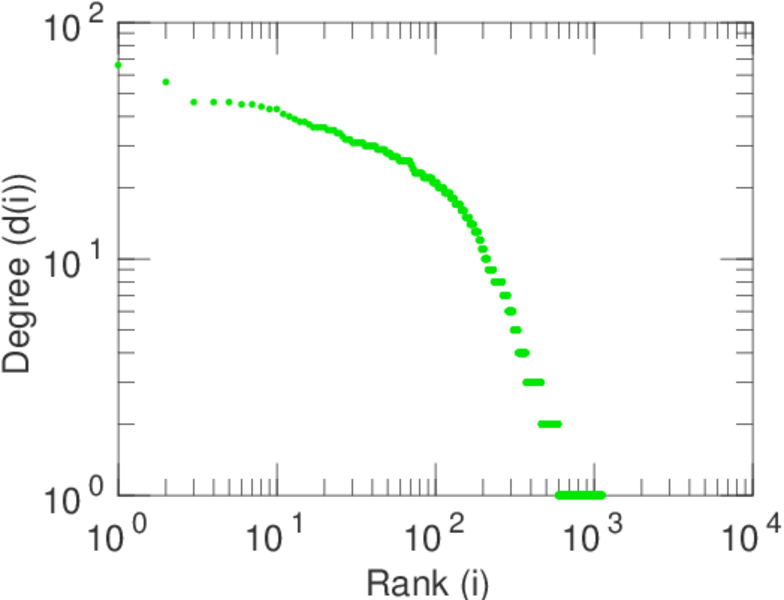
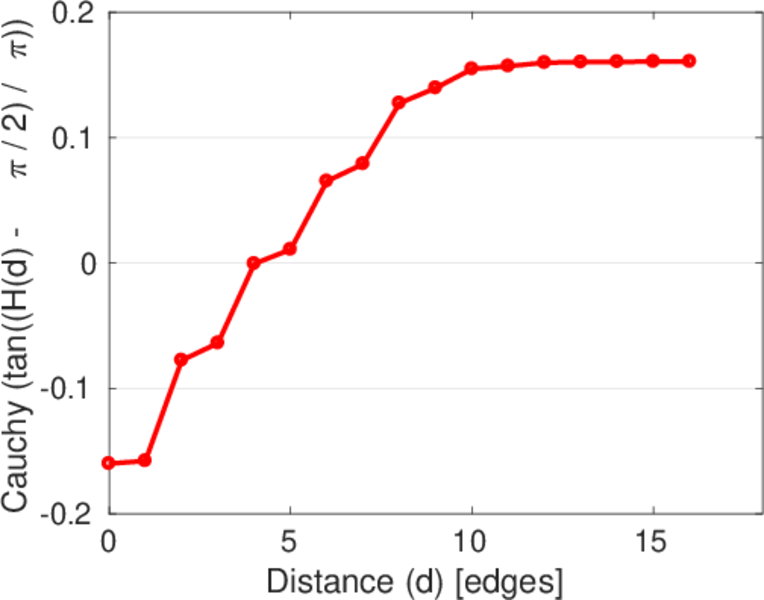
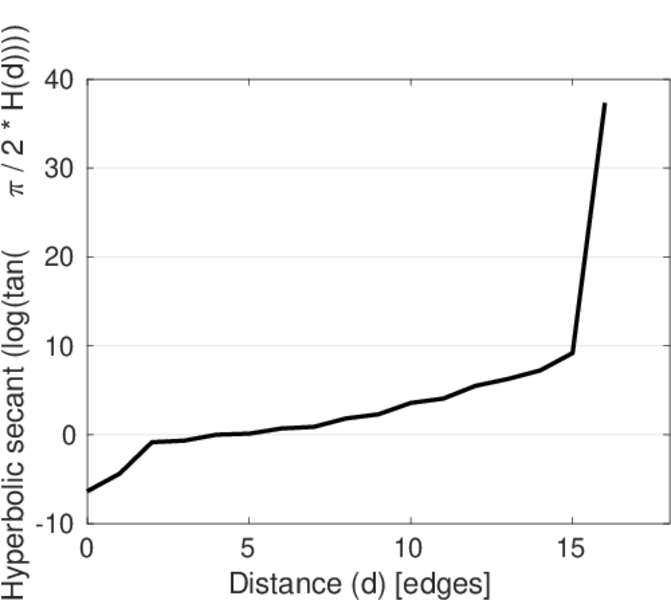
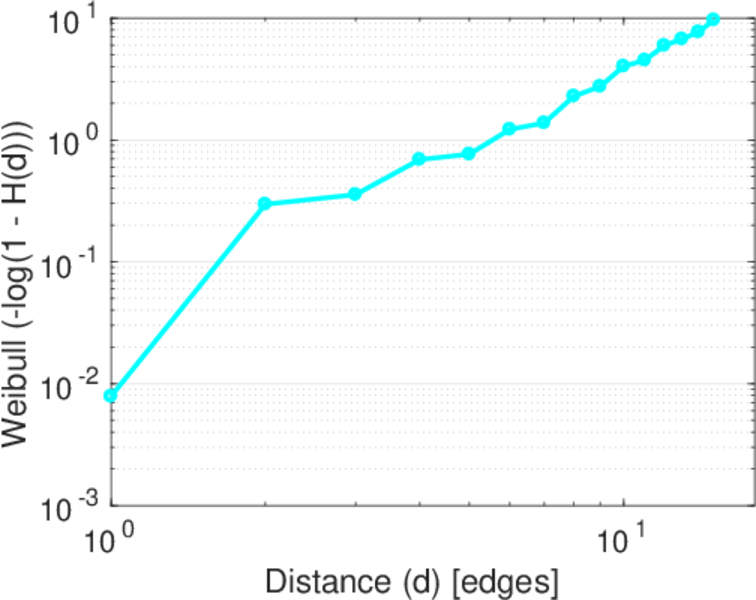
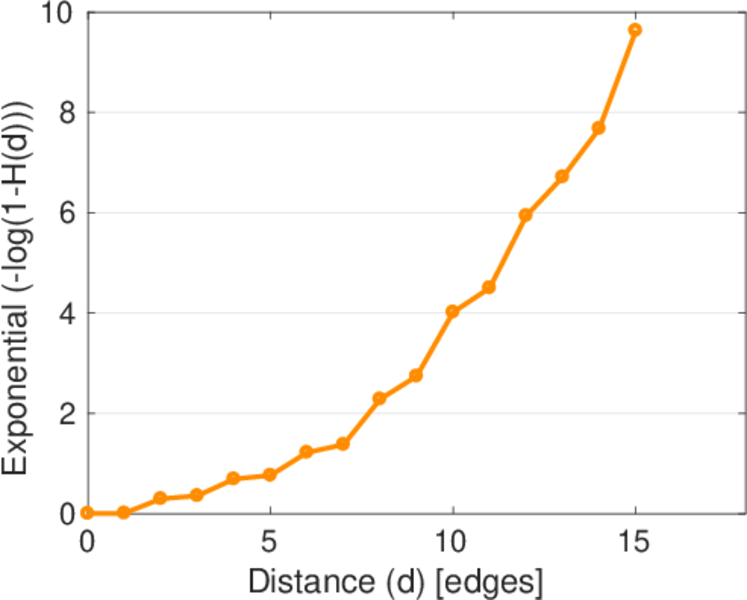
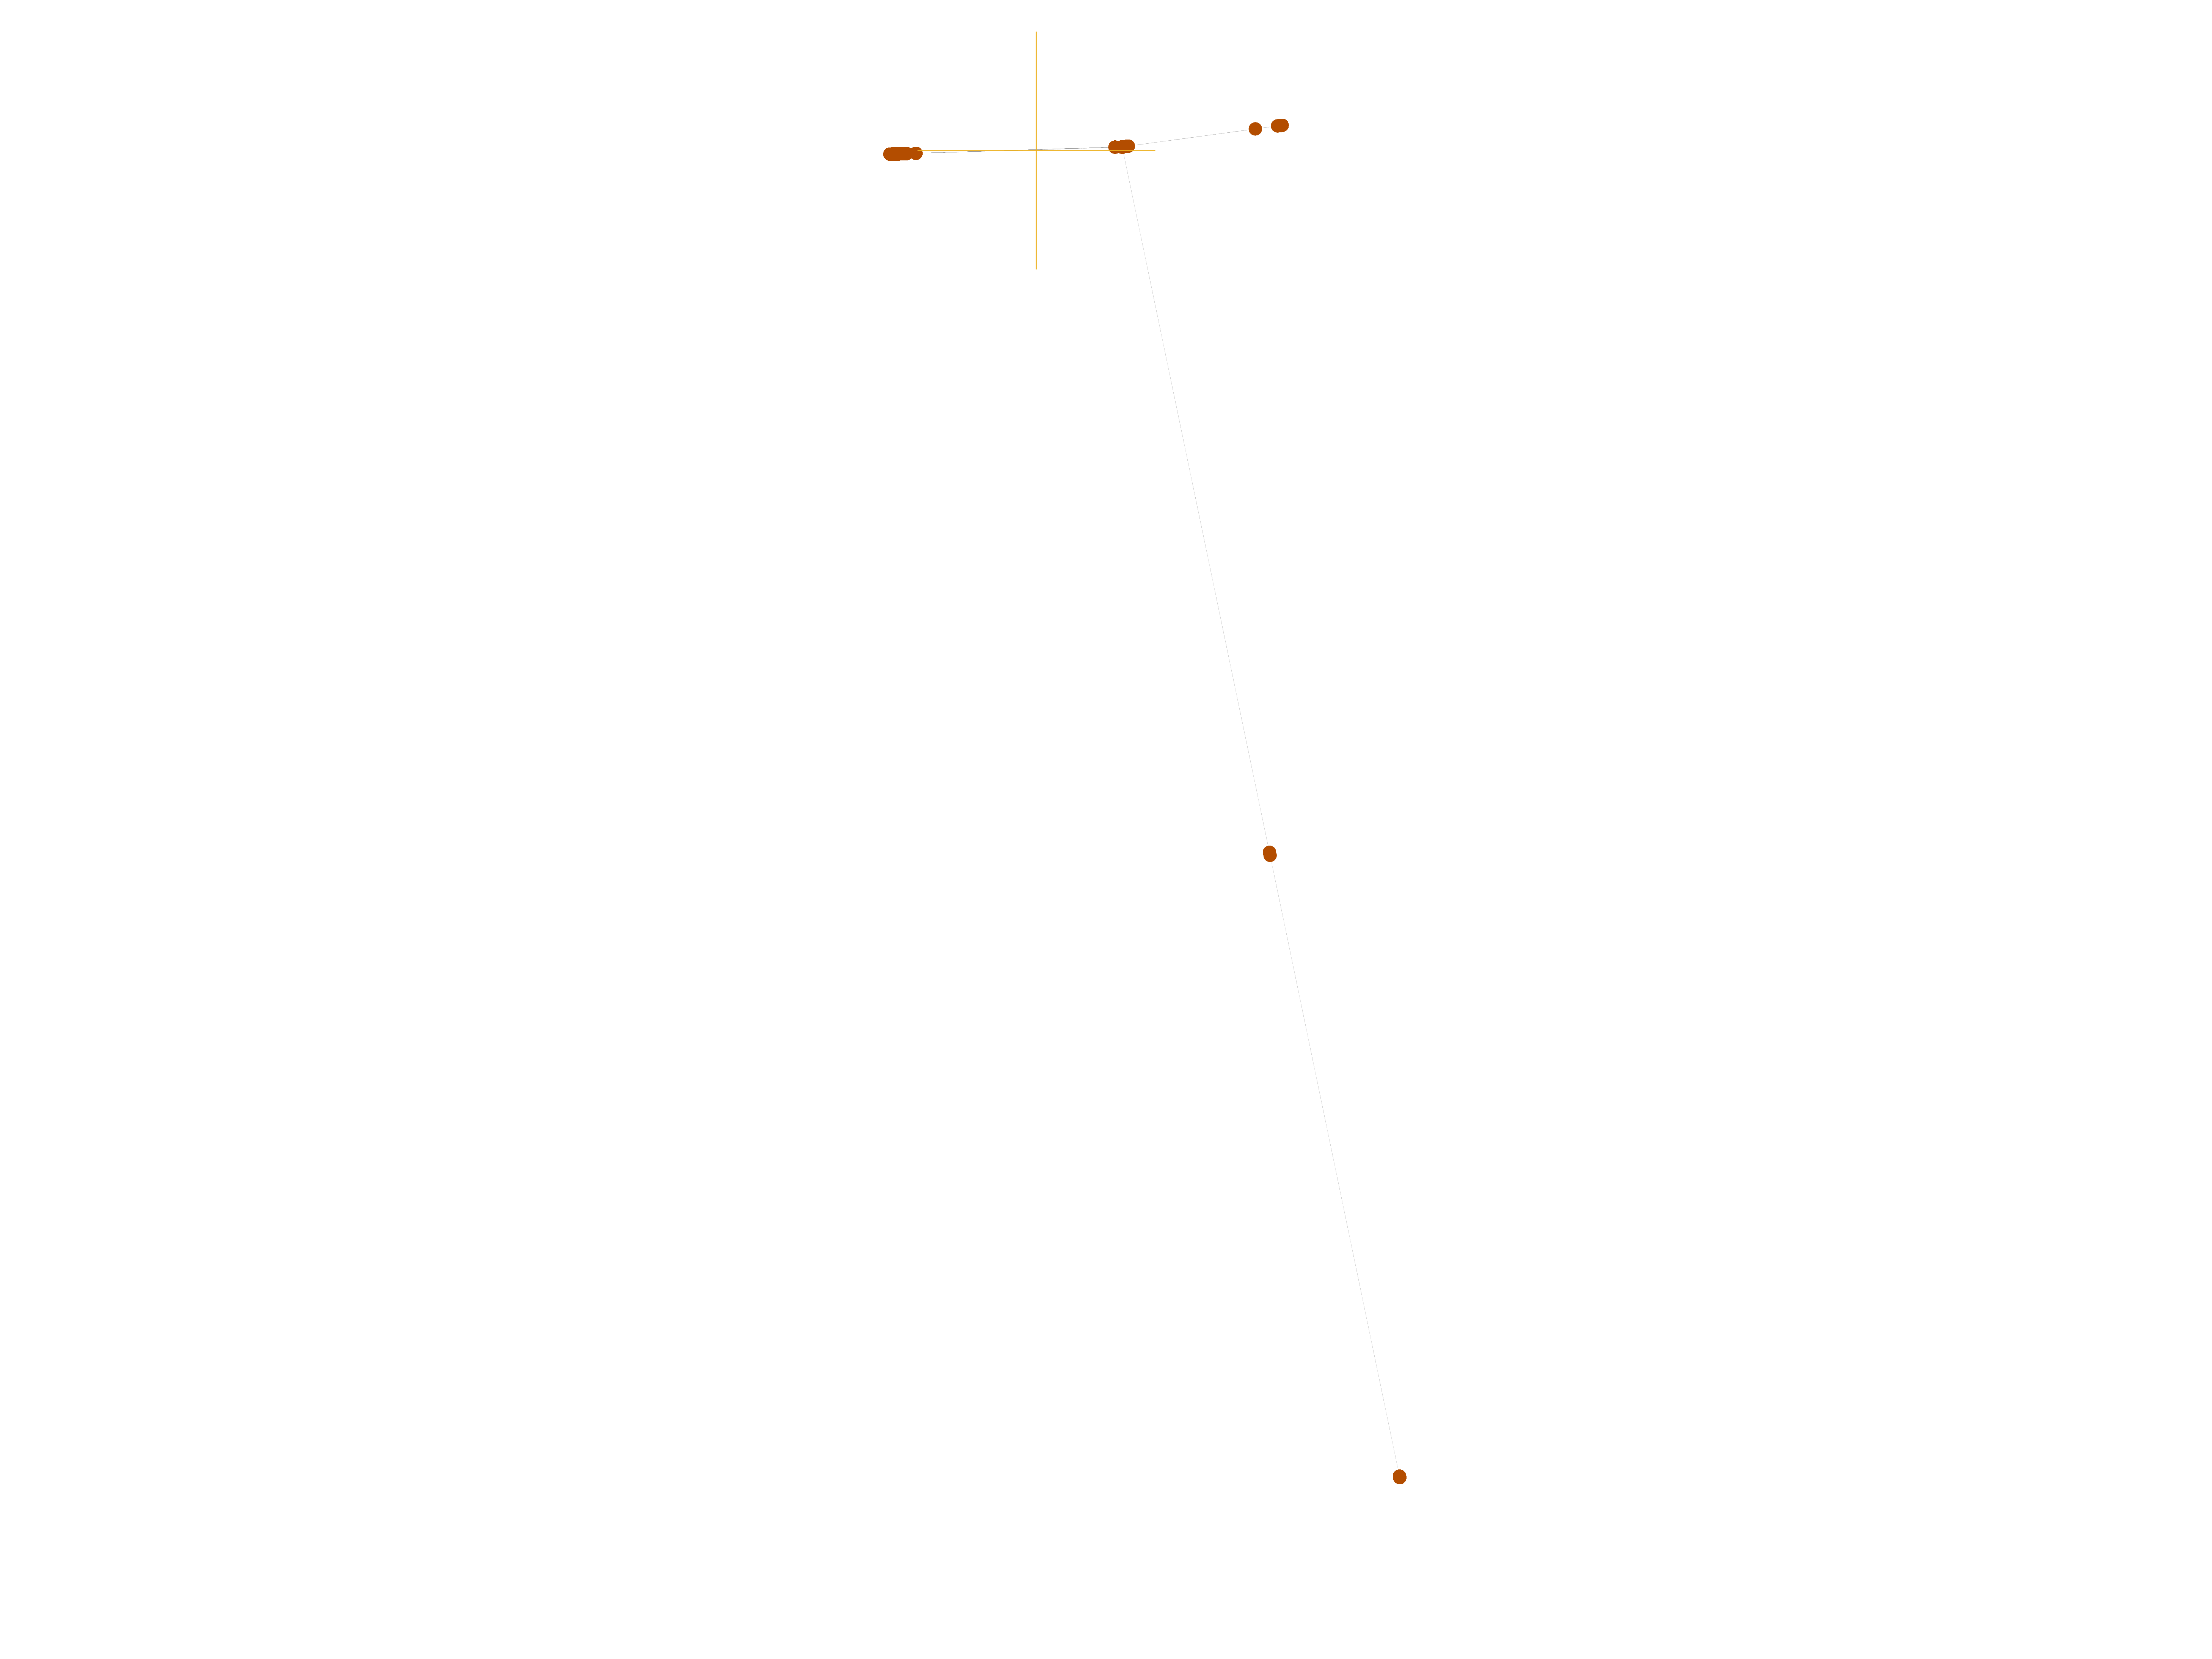
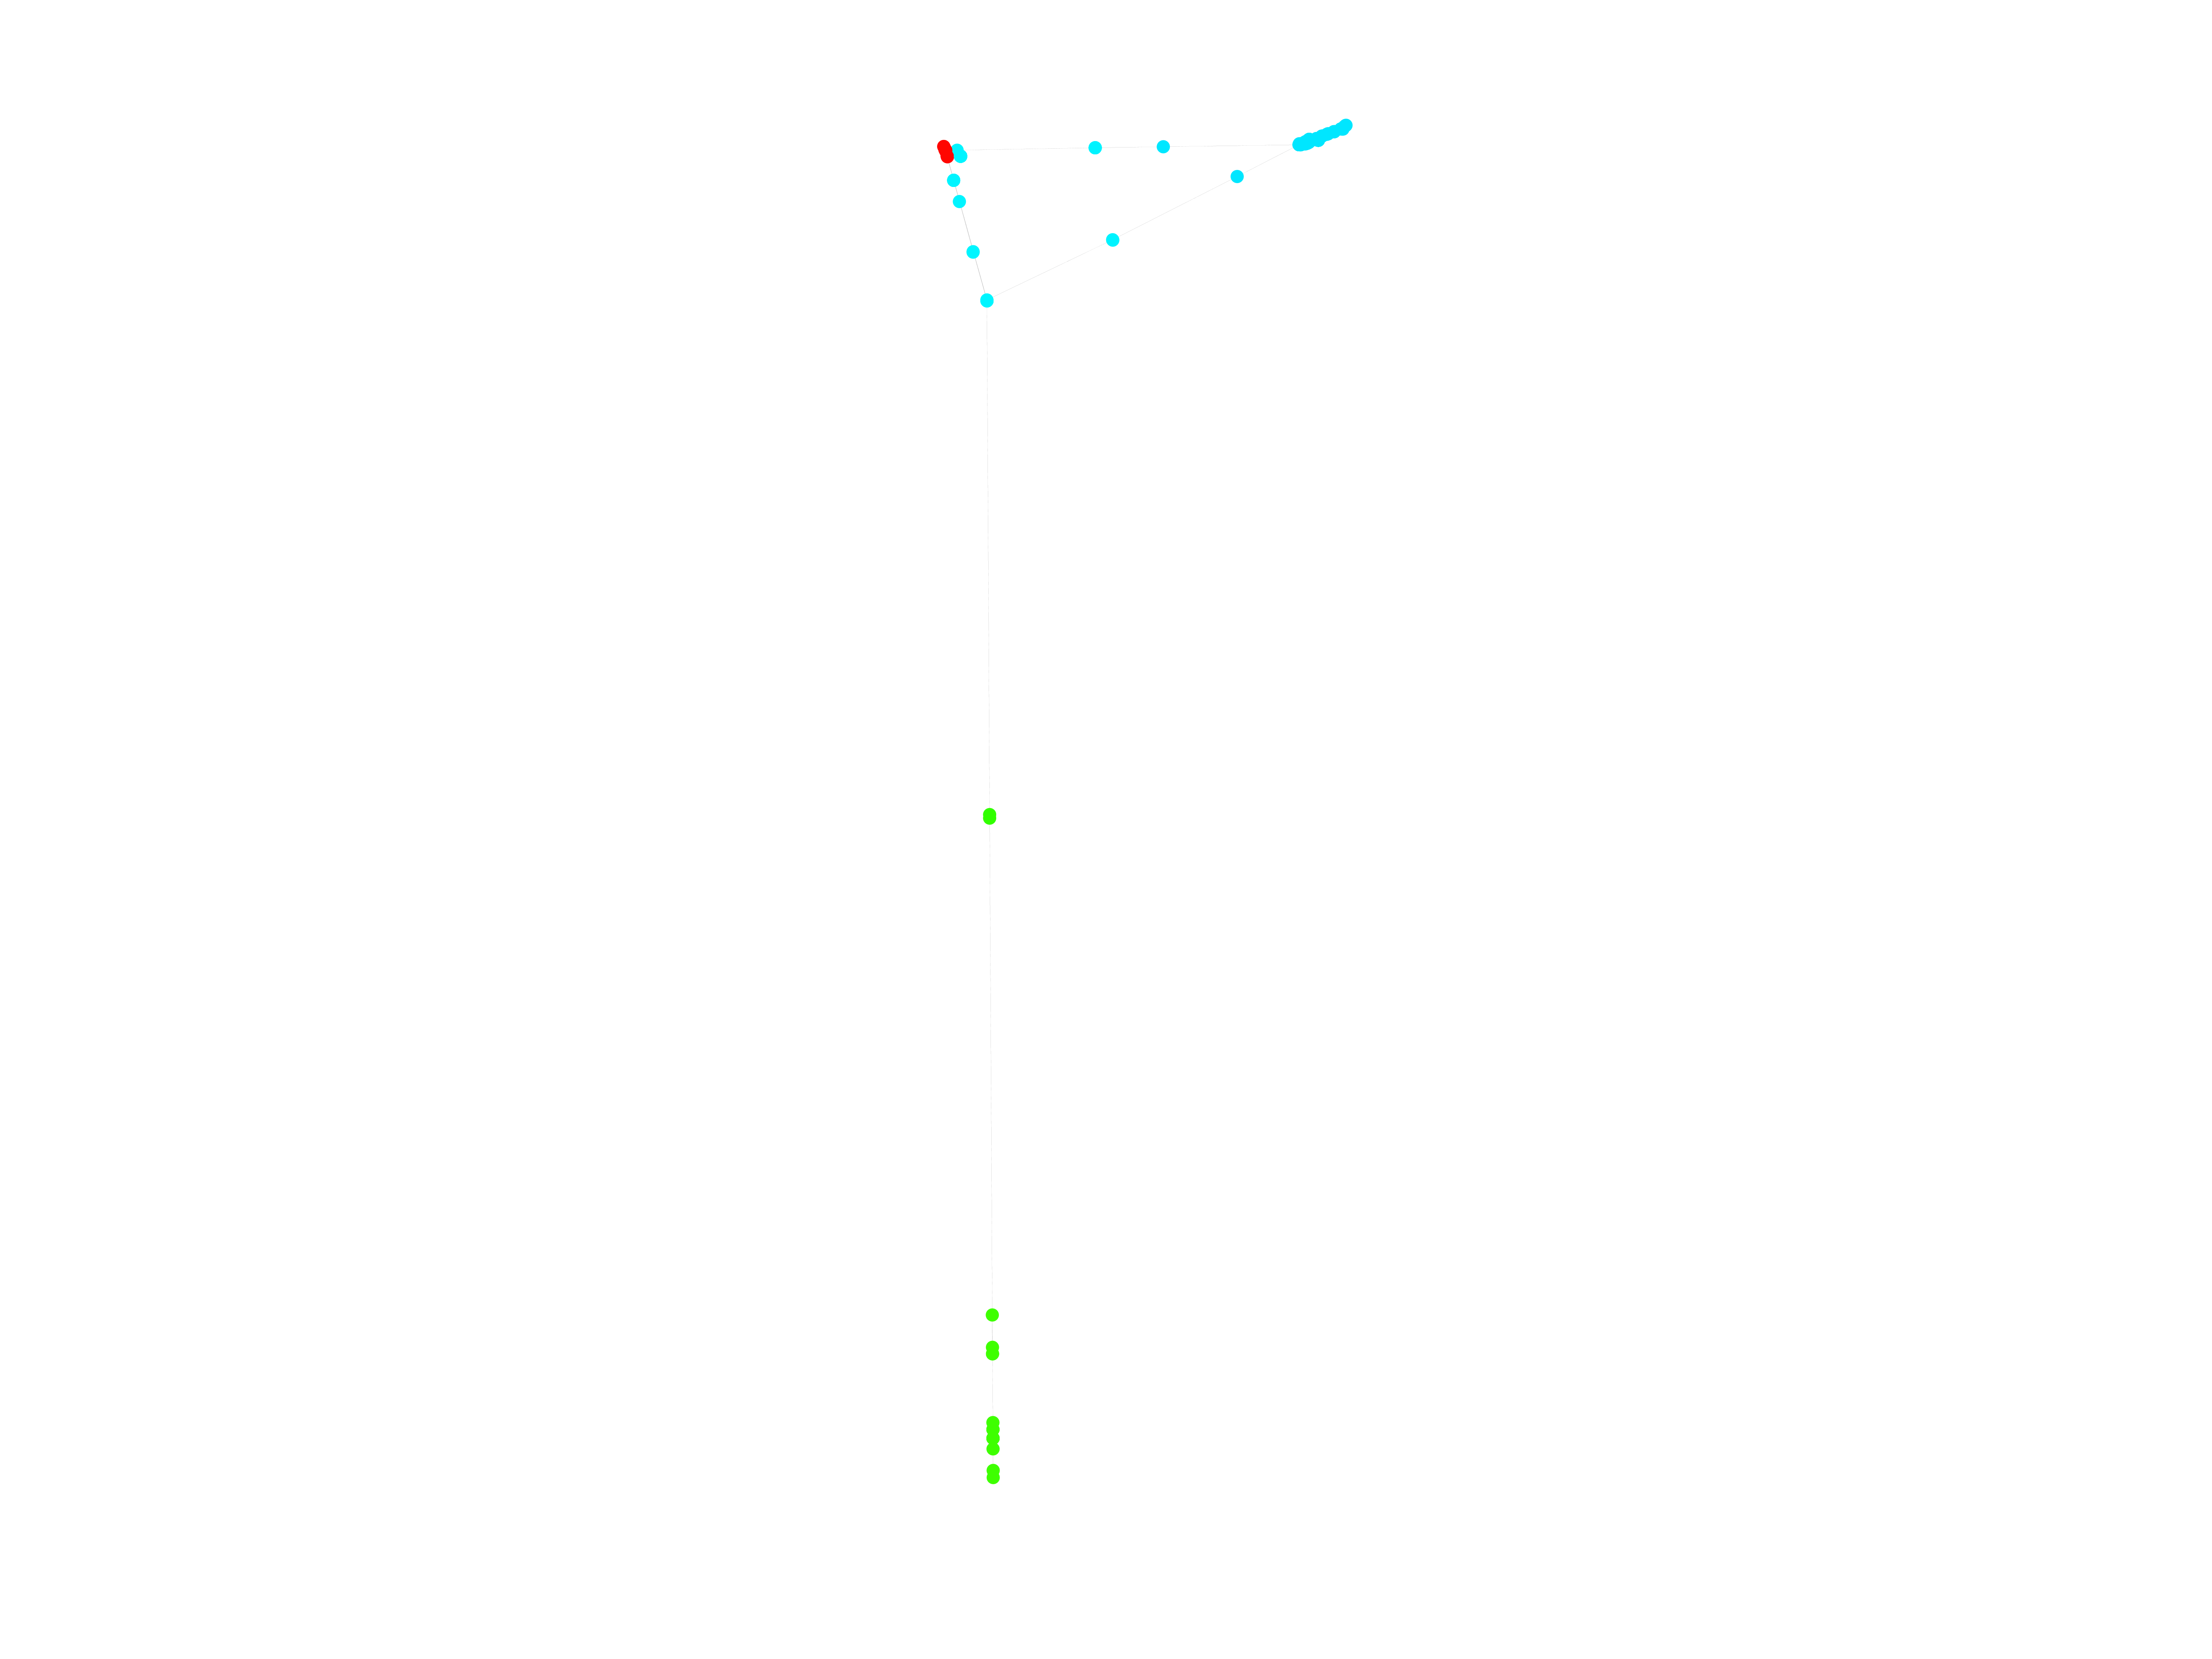
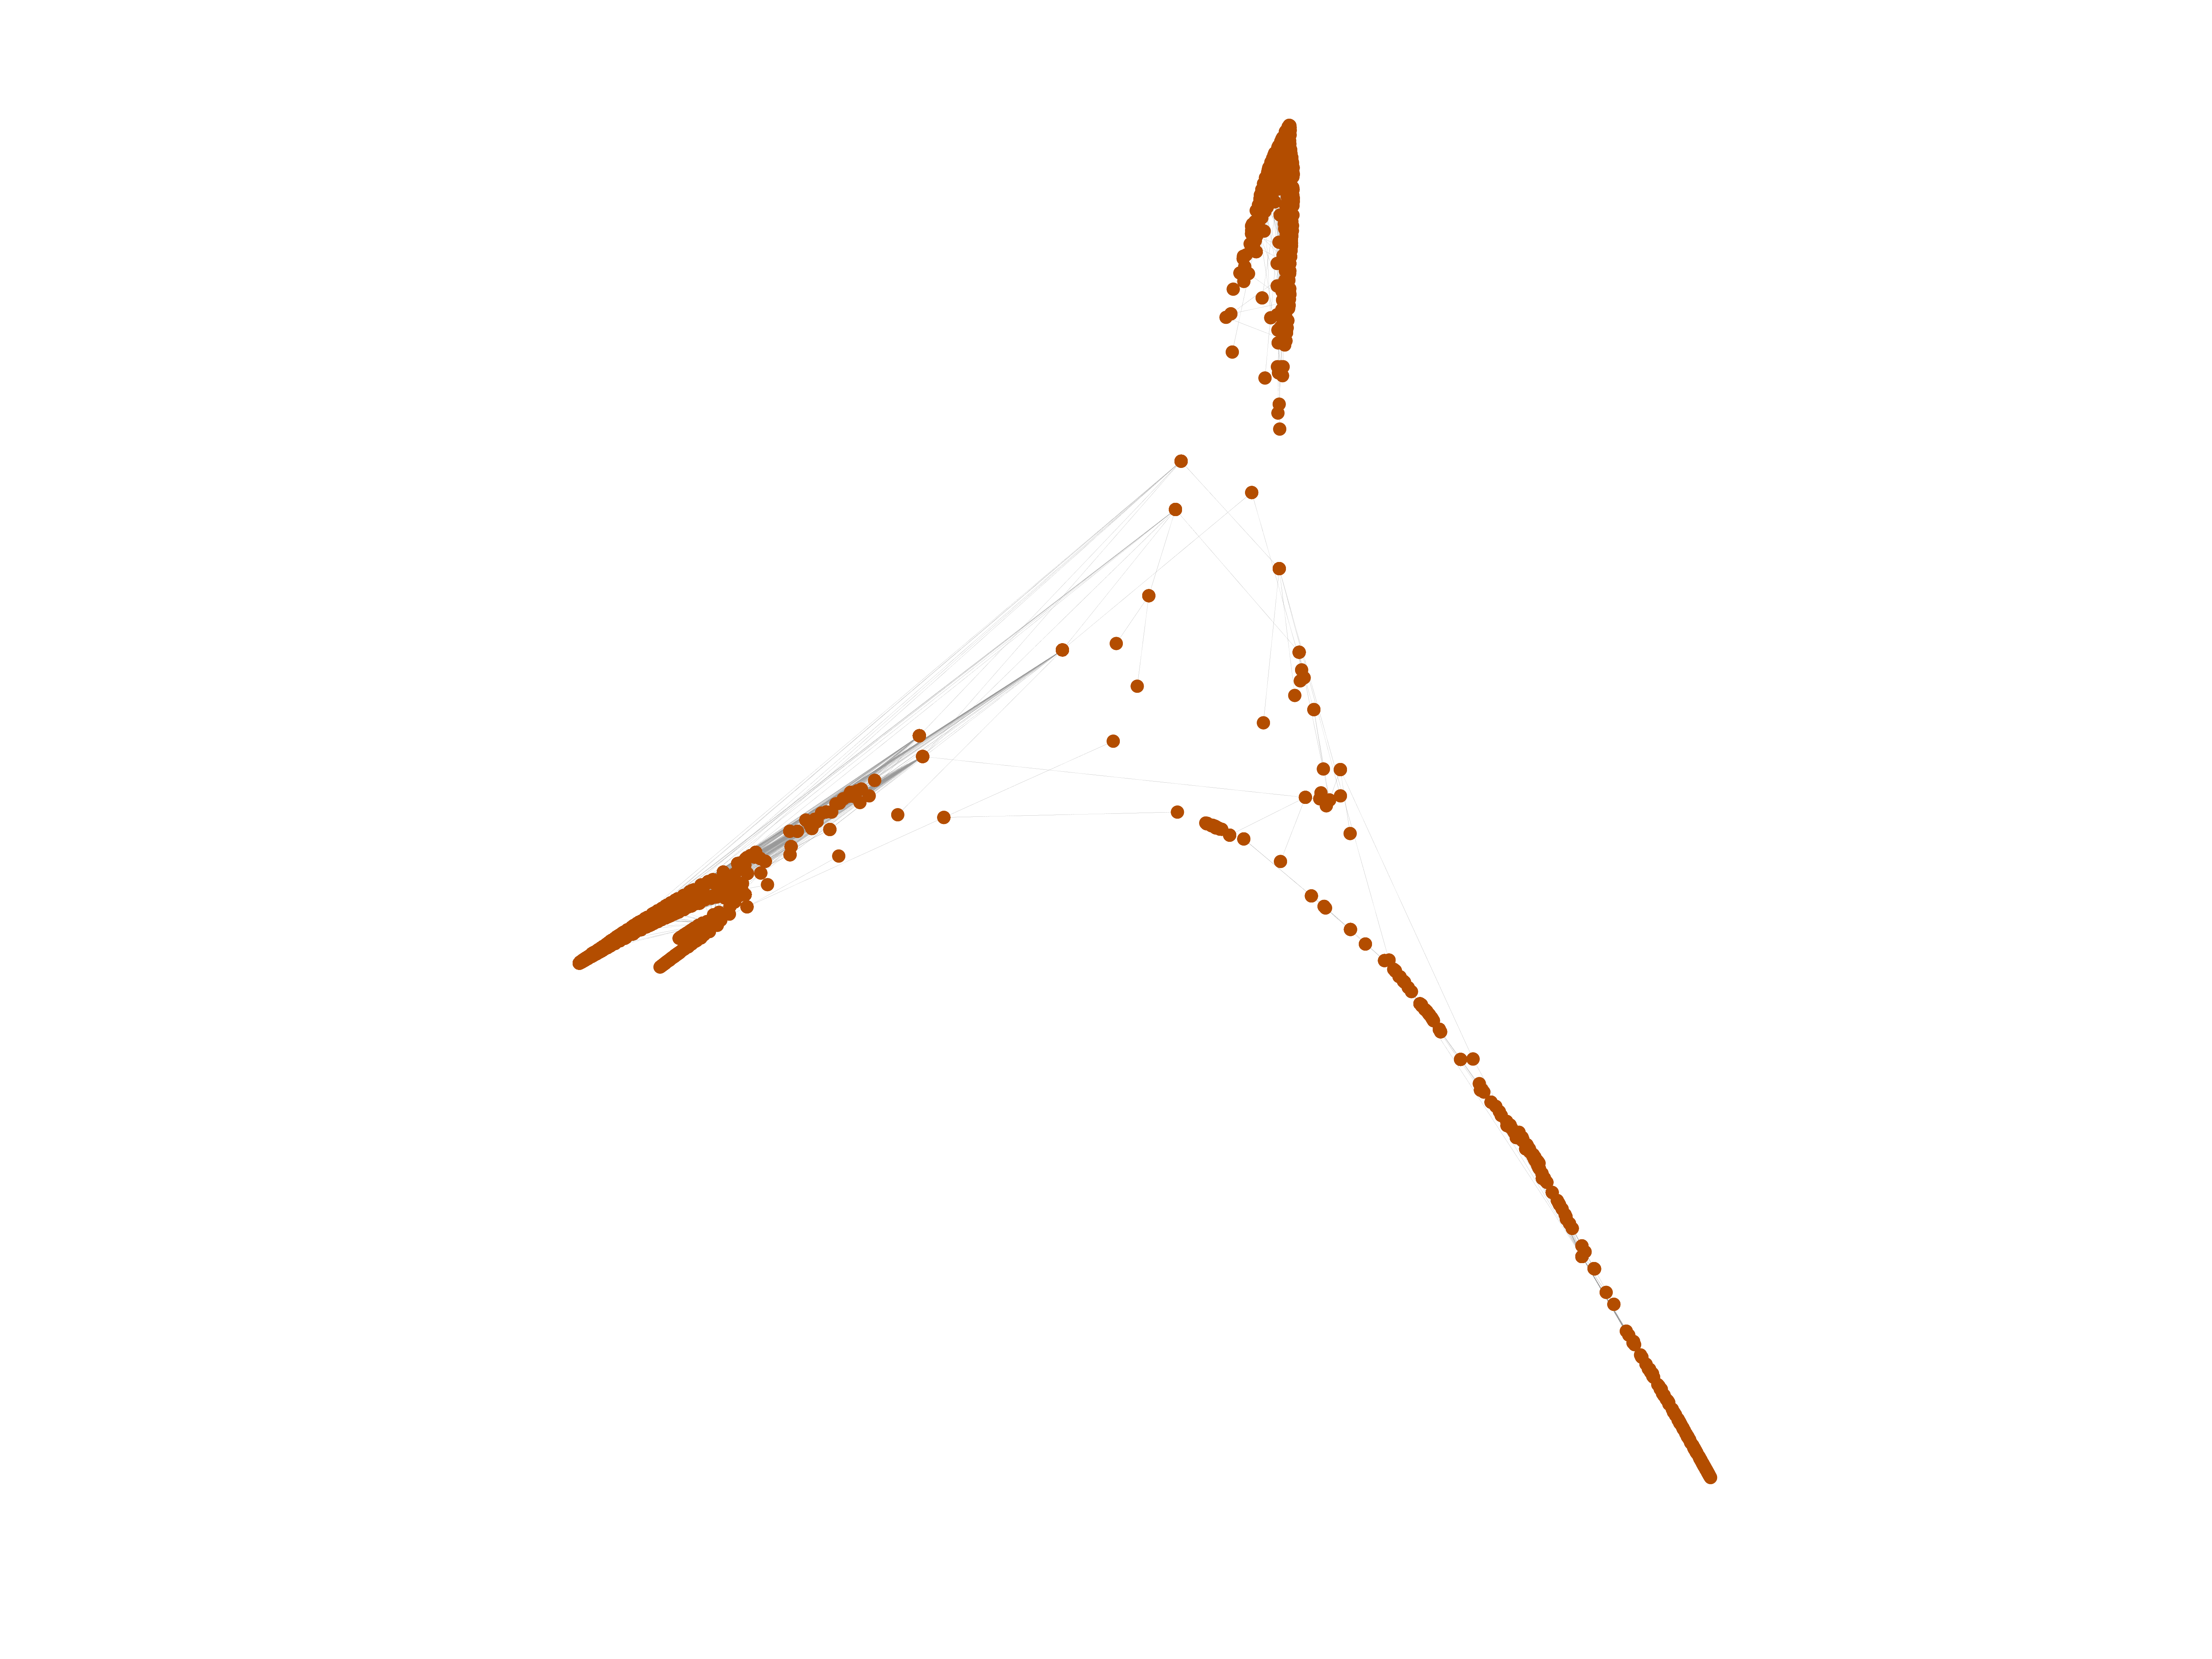
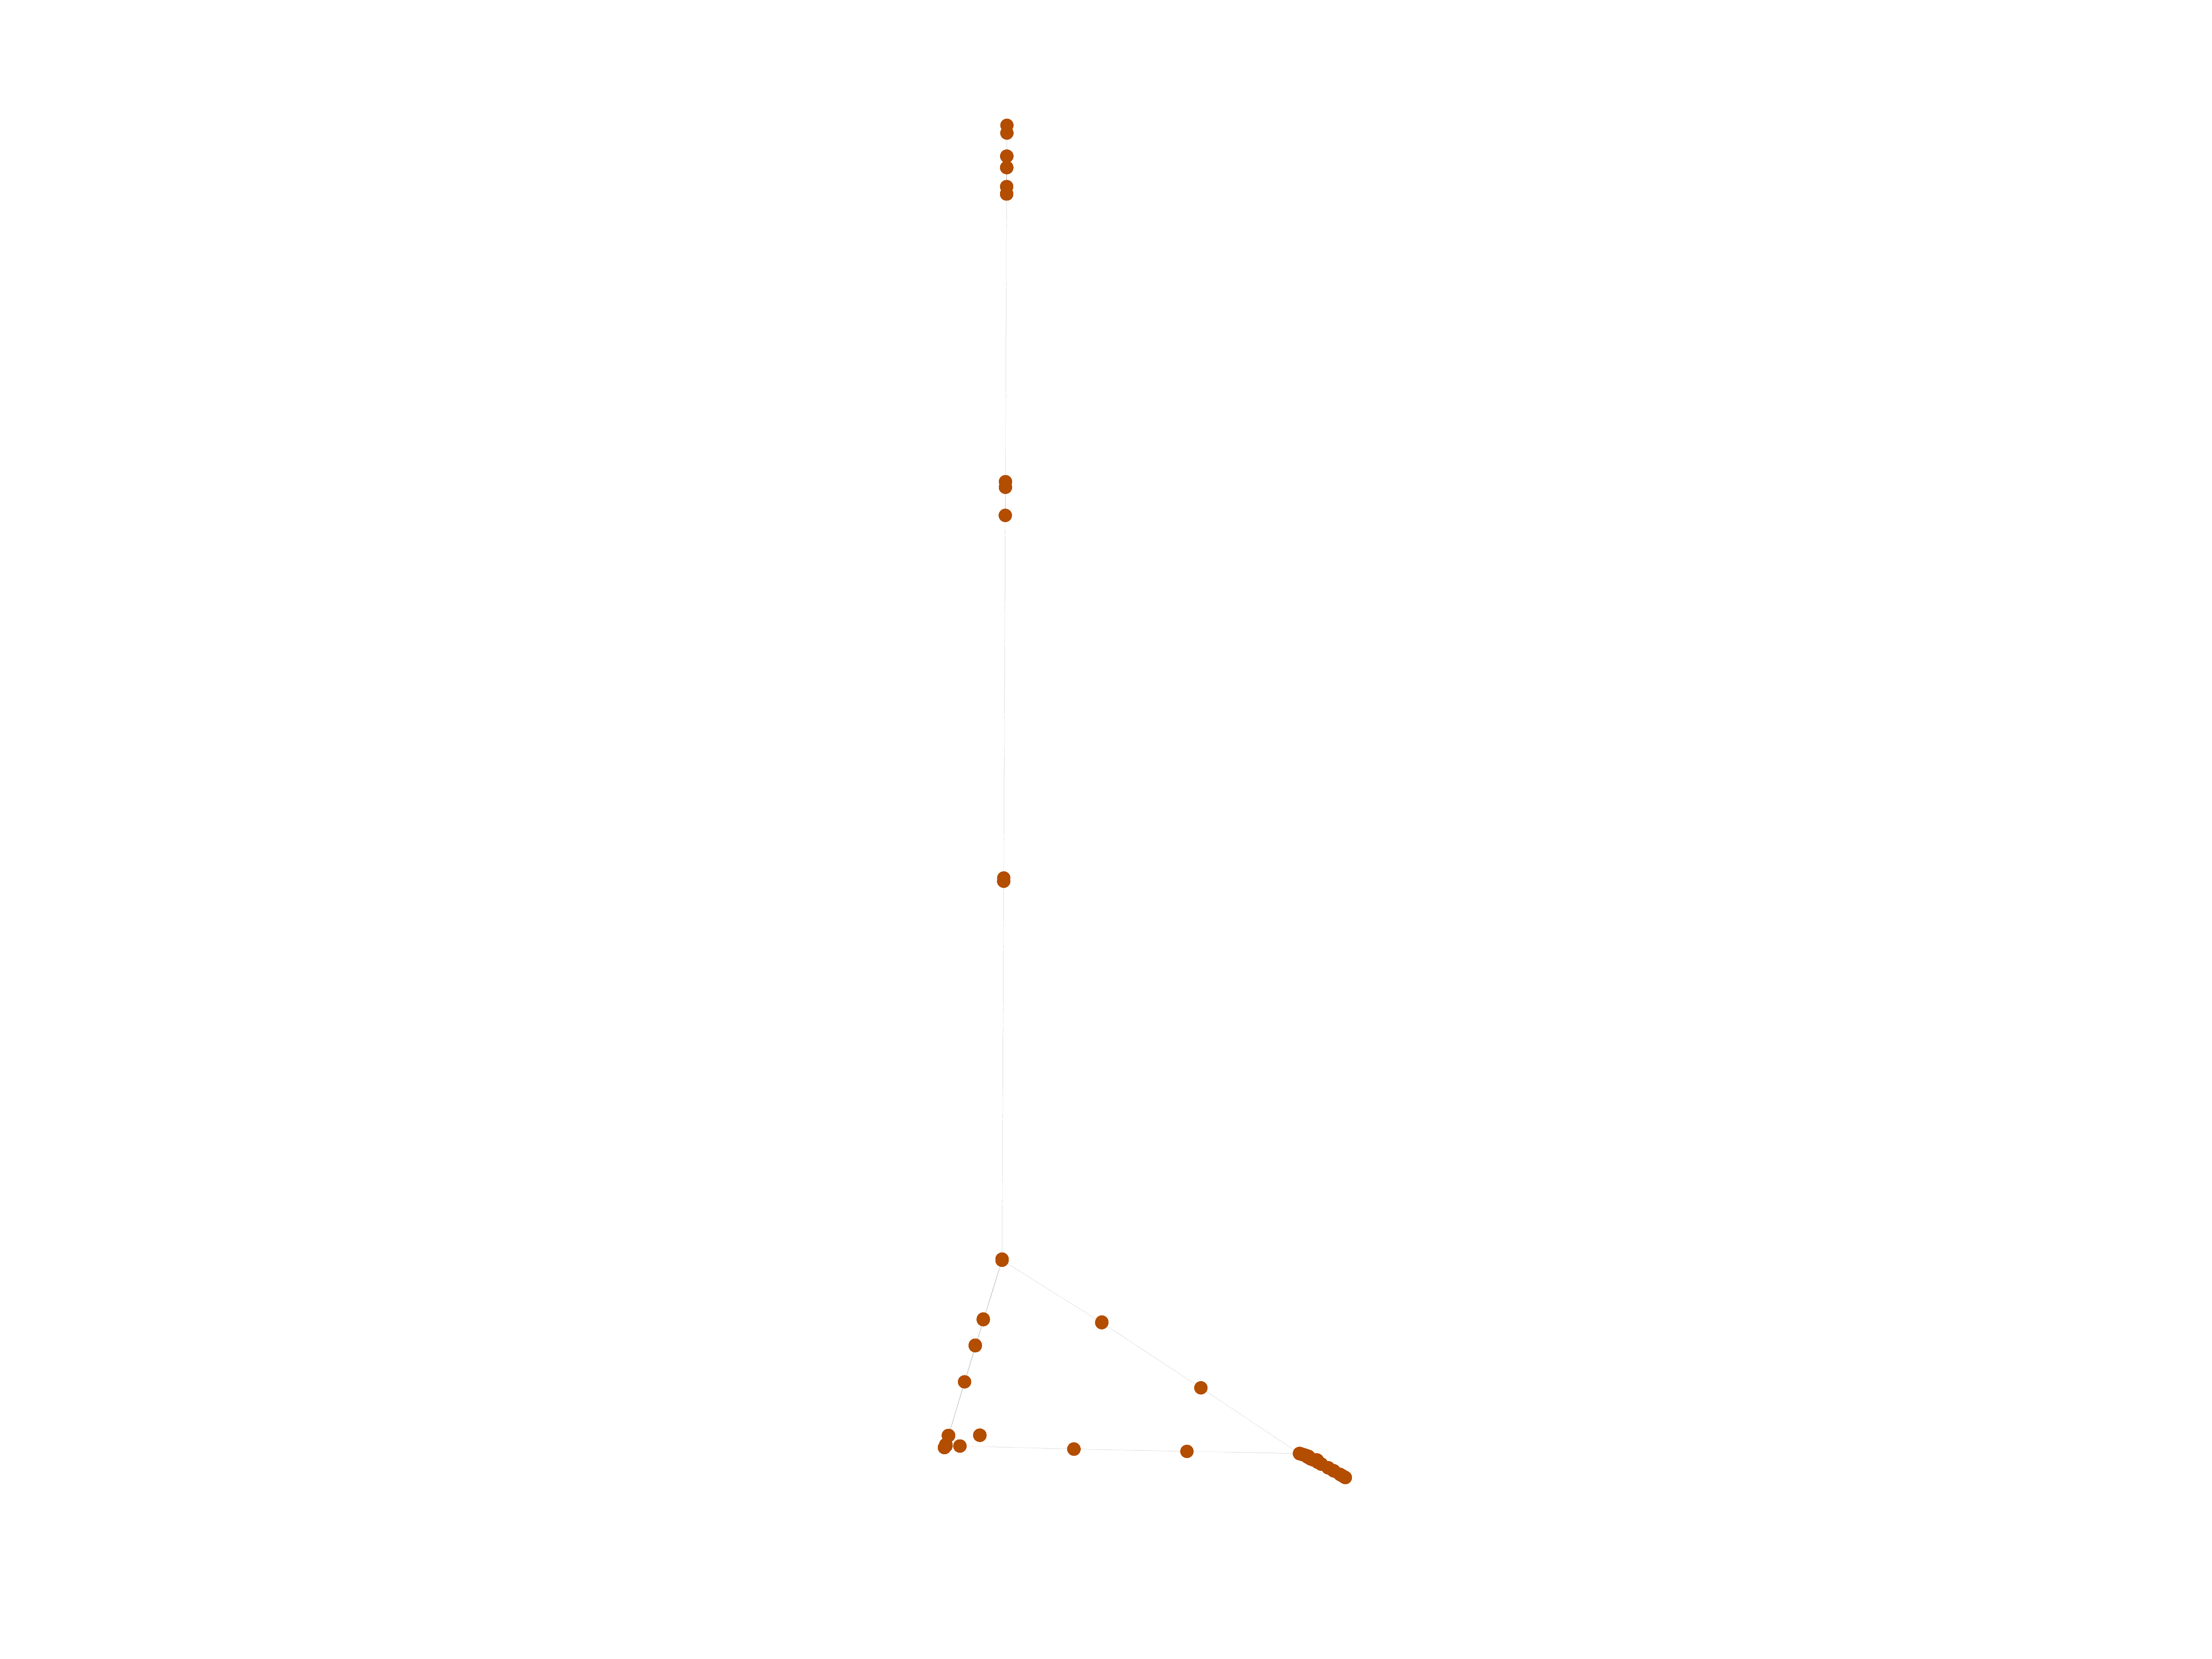
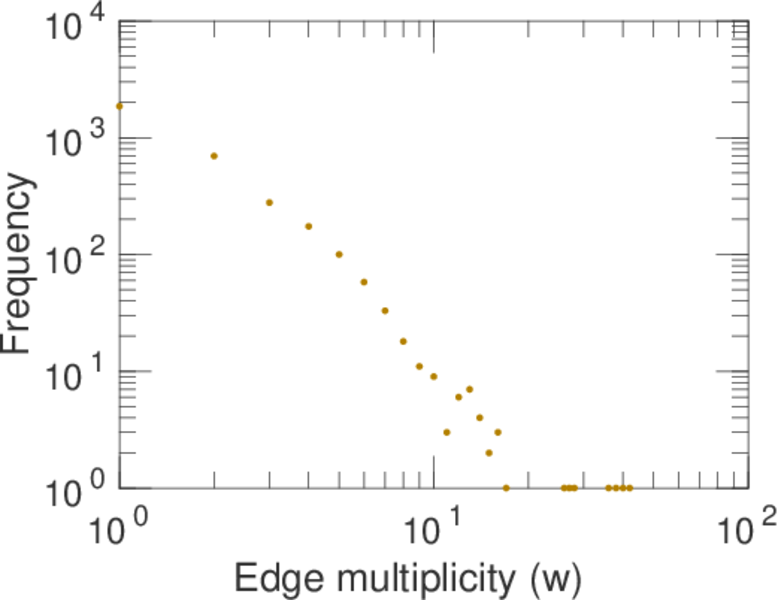
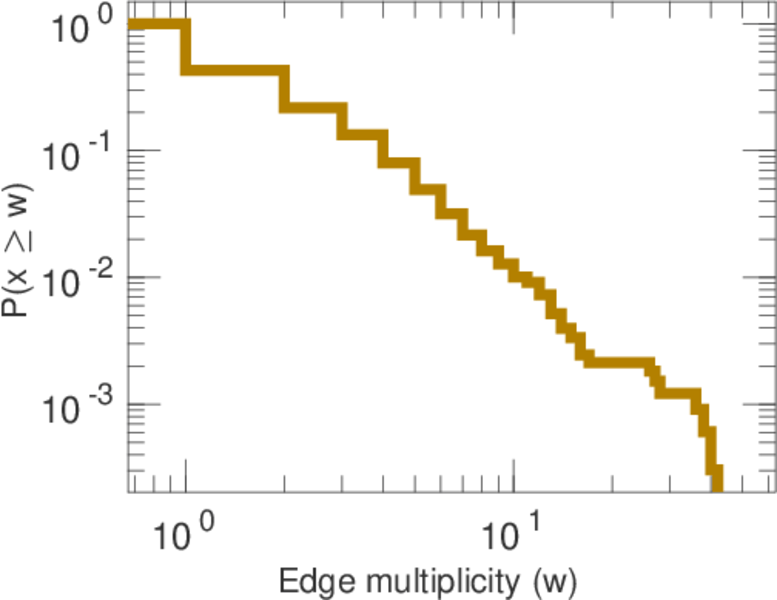
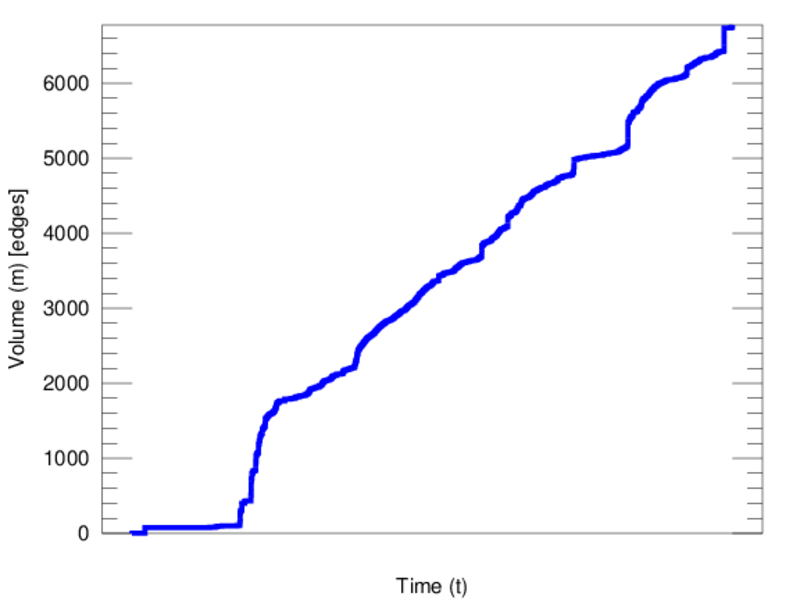
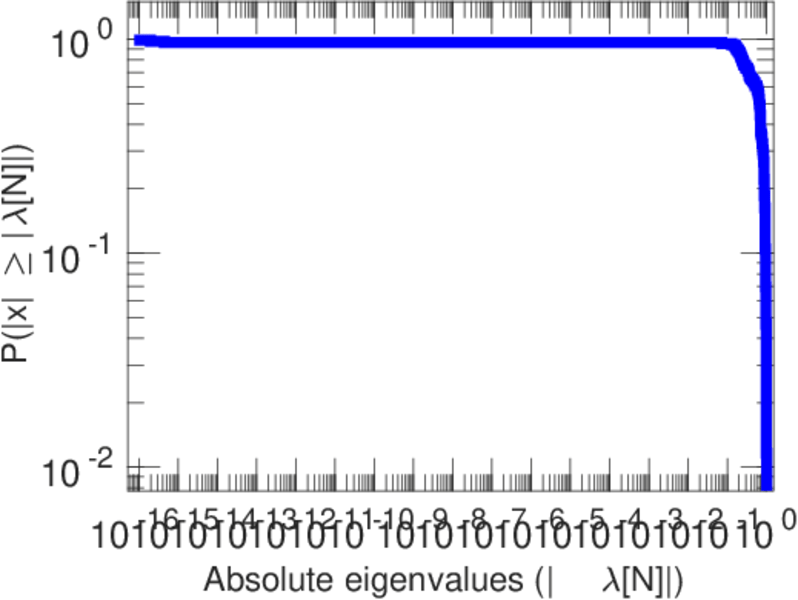
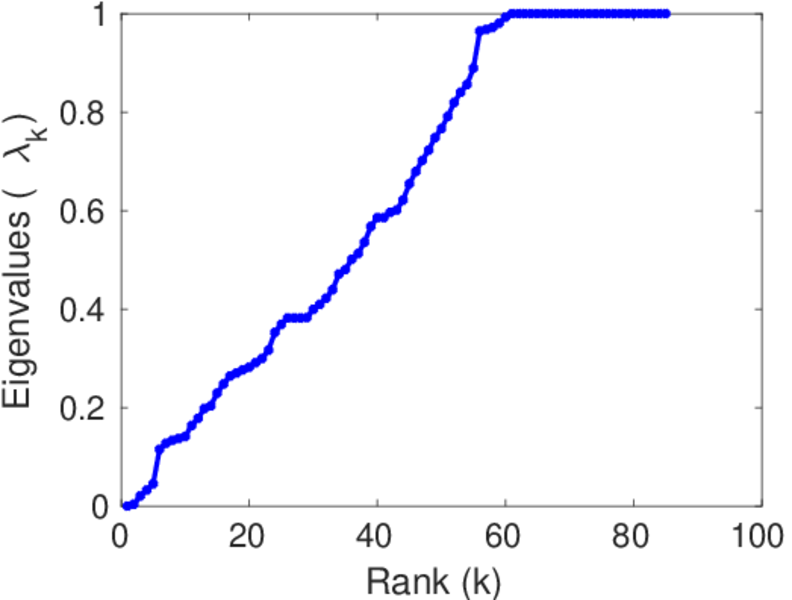
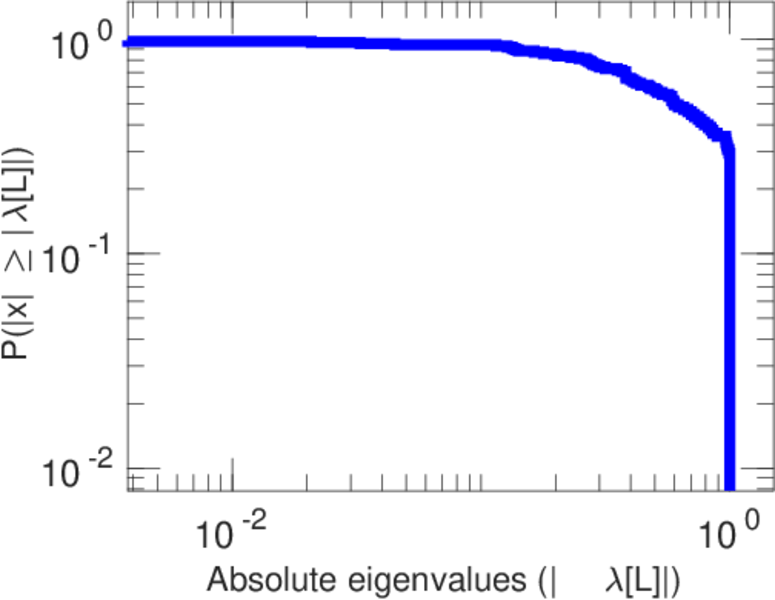
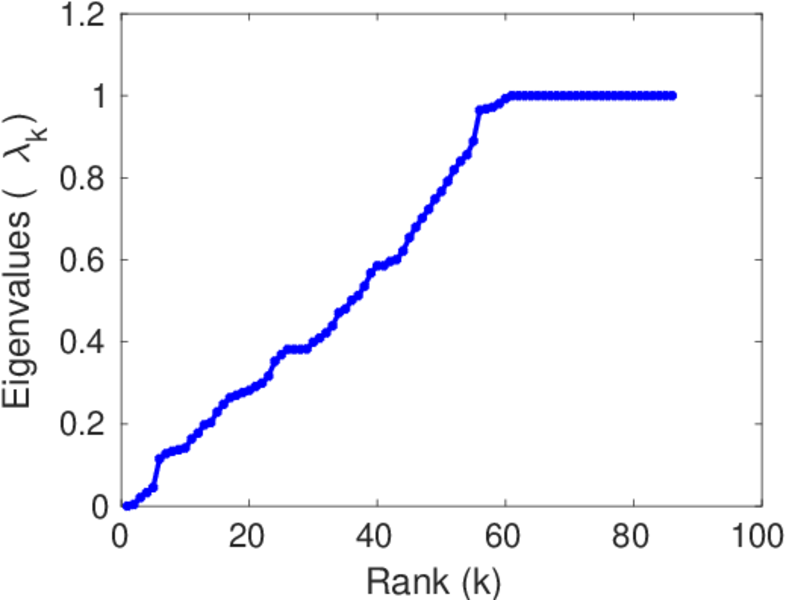
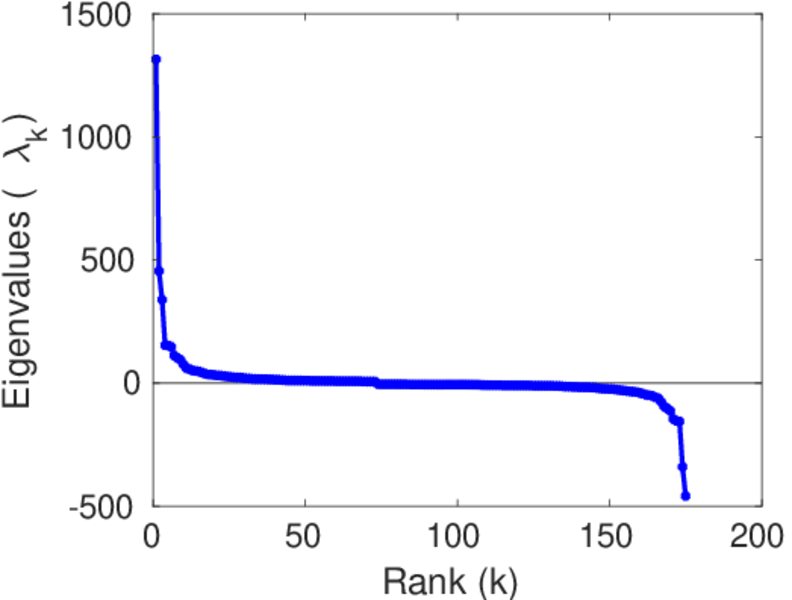
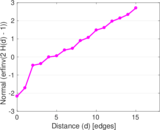
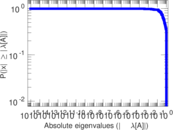
Plots


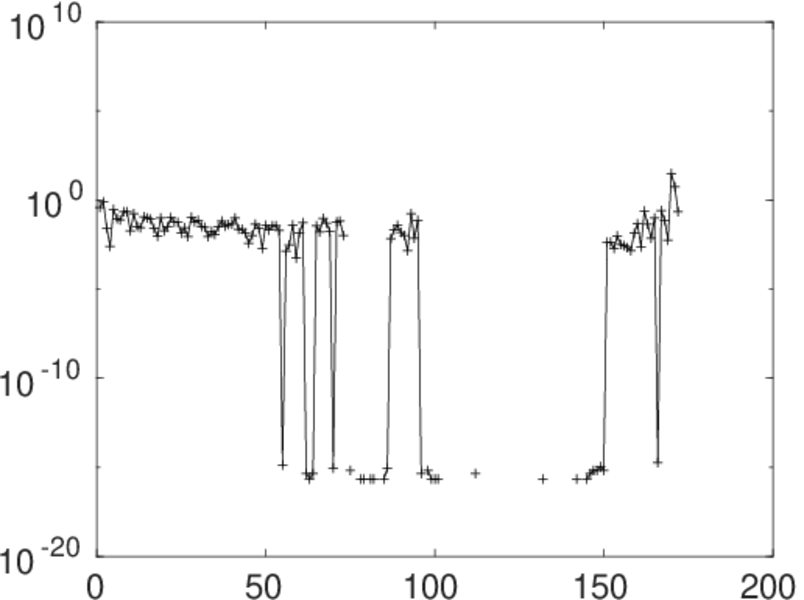
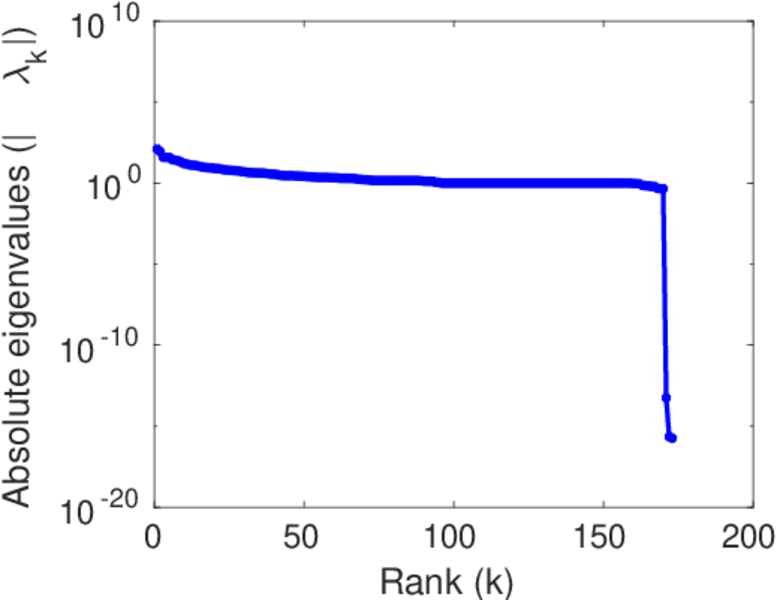
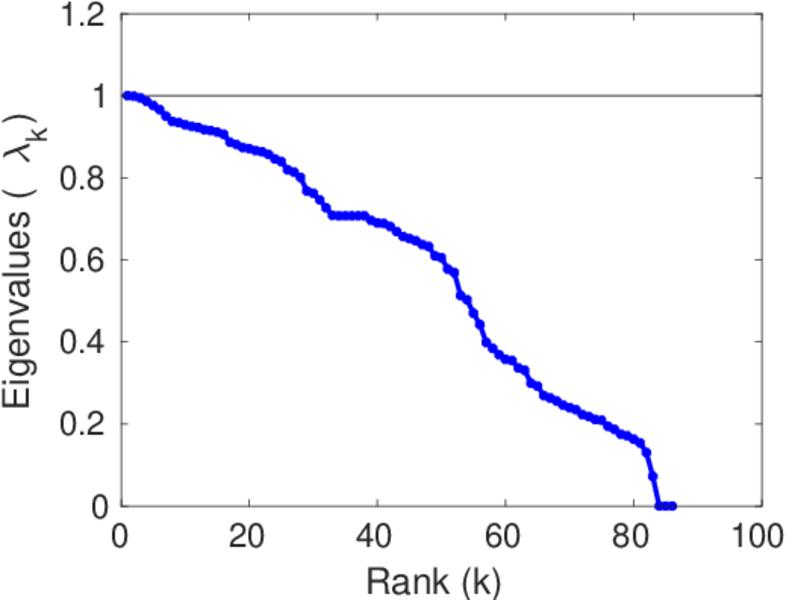
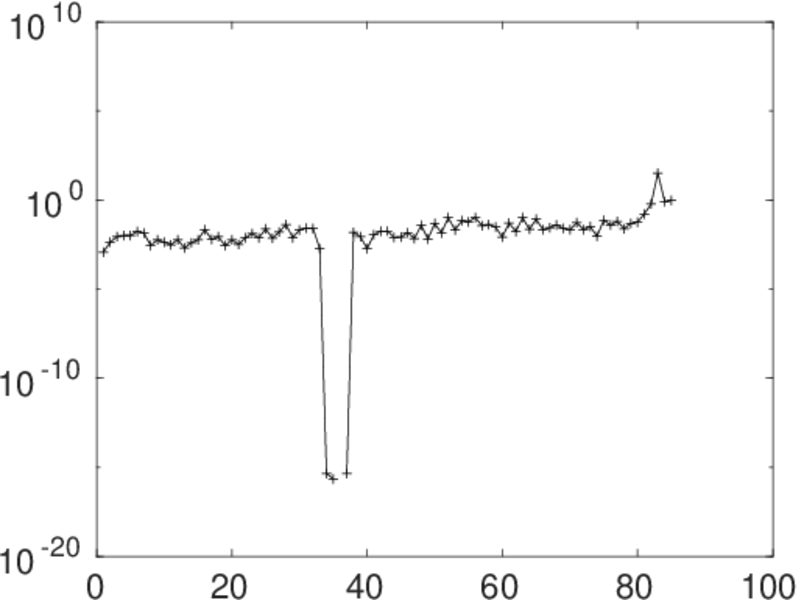
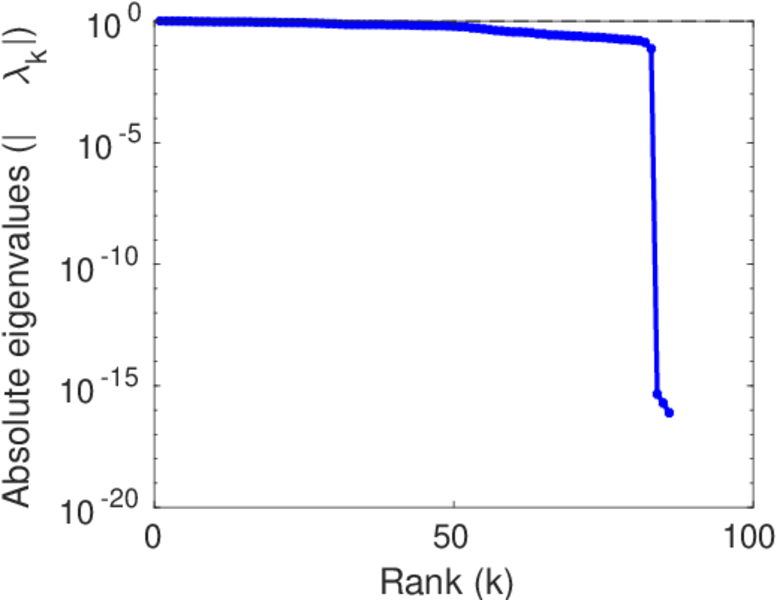
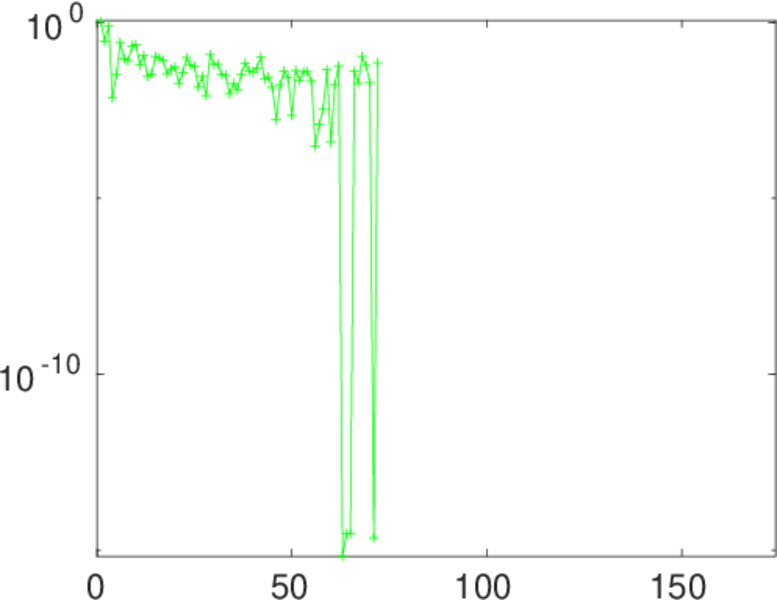
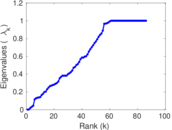
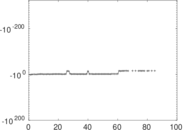
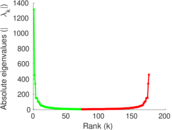
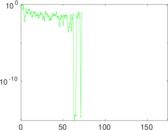
Matrix decompositions plots


Downloads
References
|
[1]
|
Jérôme Kunegis.
KONECT – The Koblenz Network Collection.
In Proc. Int. Conf. on World Wide Web Companion, pages
1343–1350, 2013.
[ http ]
|
|
[2]
|
Wikimedia Foundation.
Wikimedia downloads.
http://dumps.wikimedia.org/, January 2010.
|
 KONECT ‣ Networks ‣
Buy Me a Coffee
KONECT ‣ Networks ‣
Buy Me a Coffee