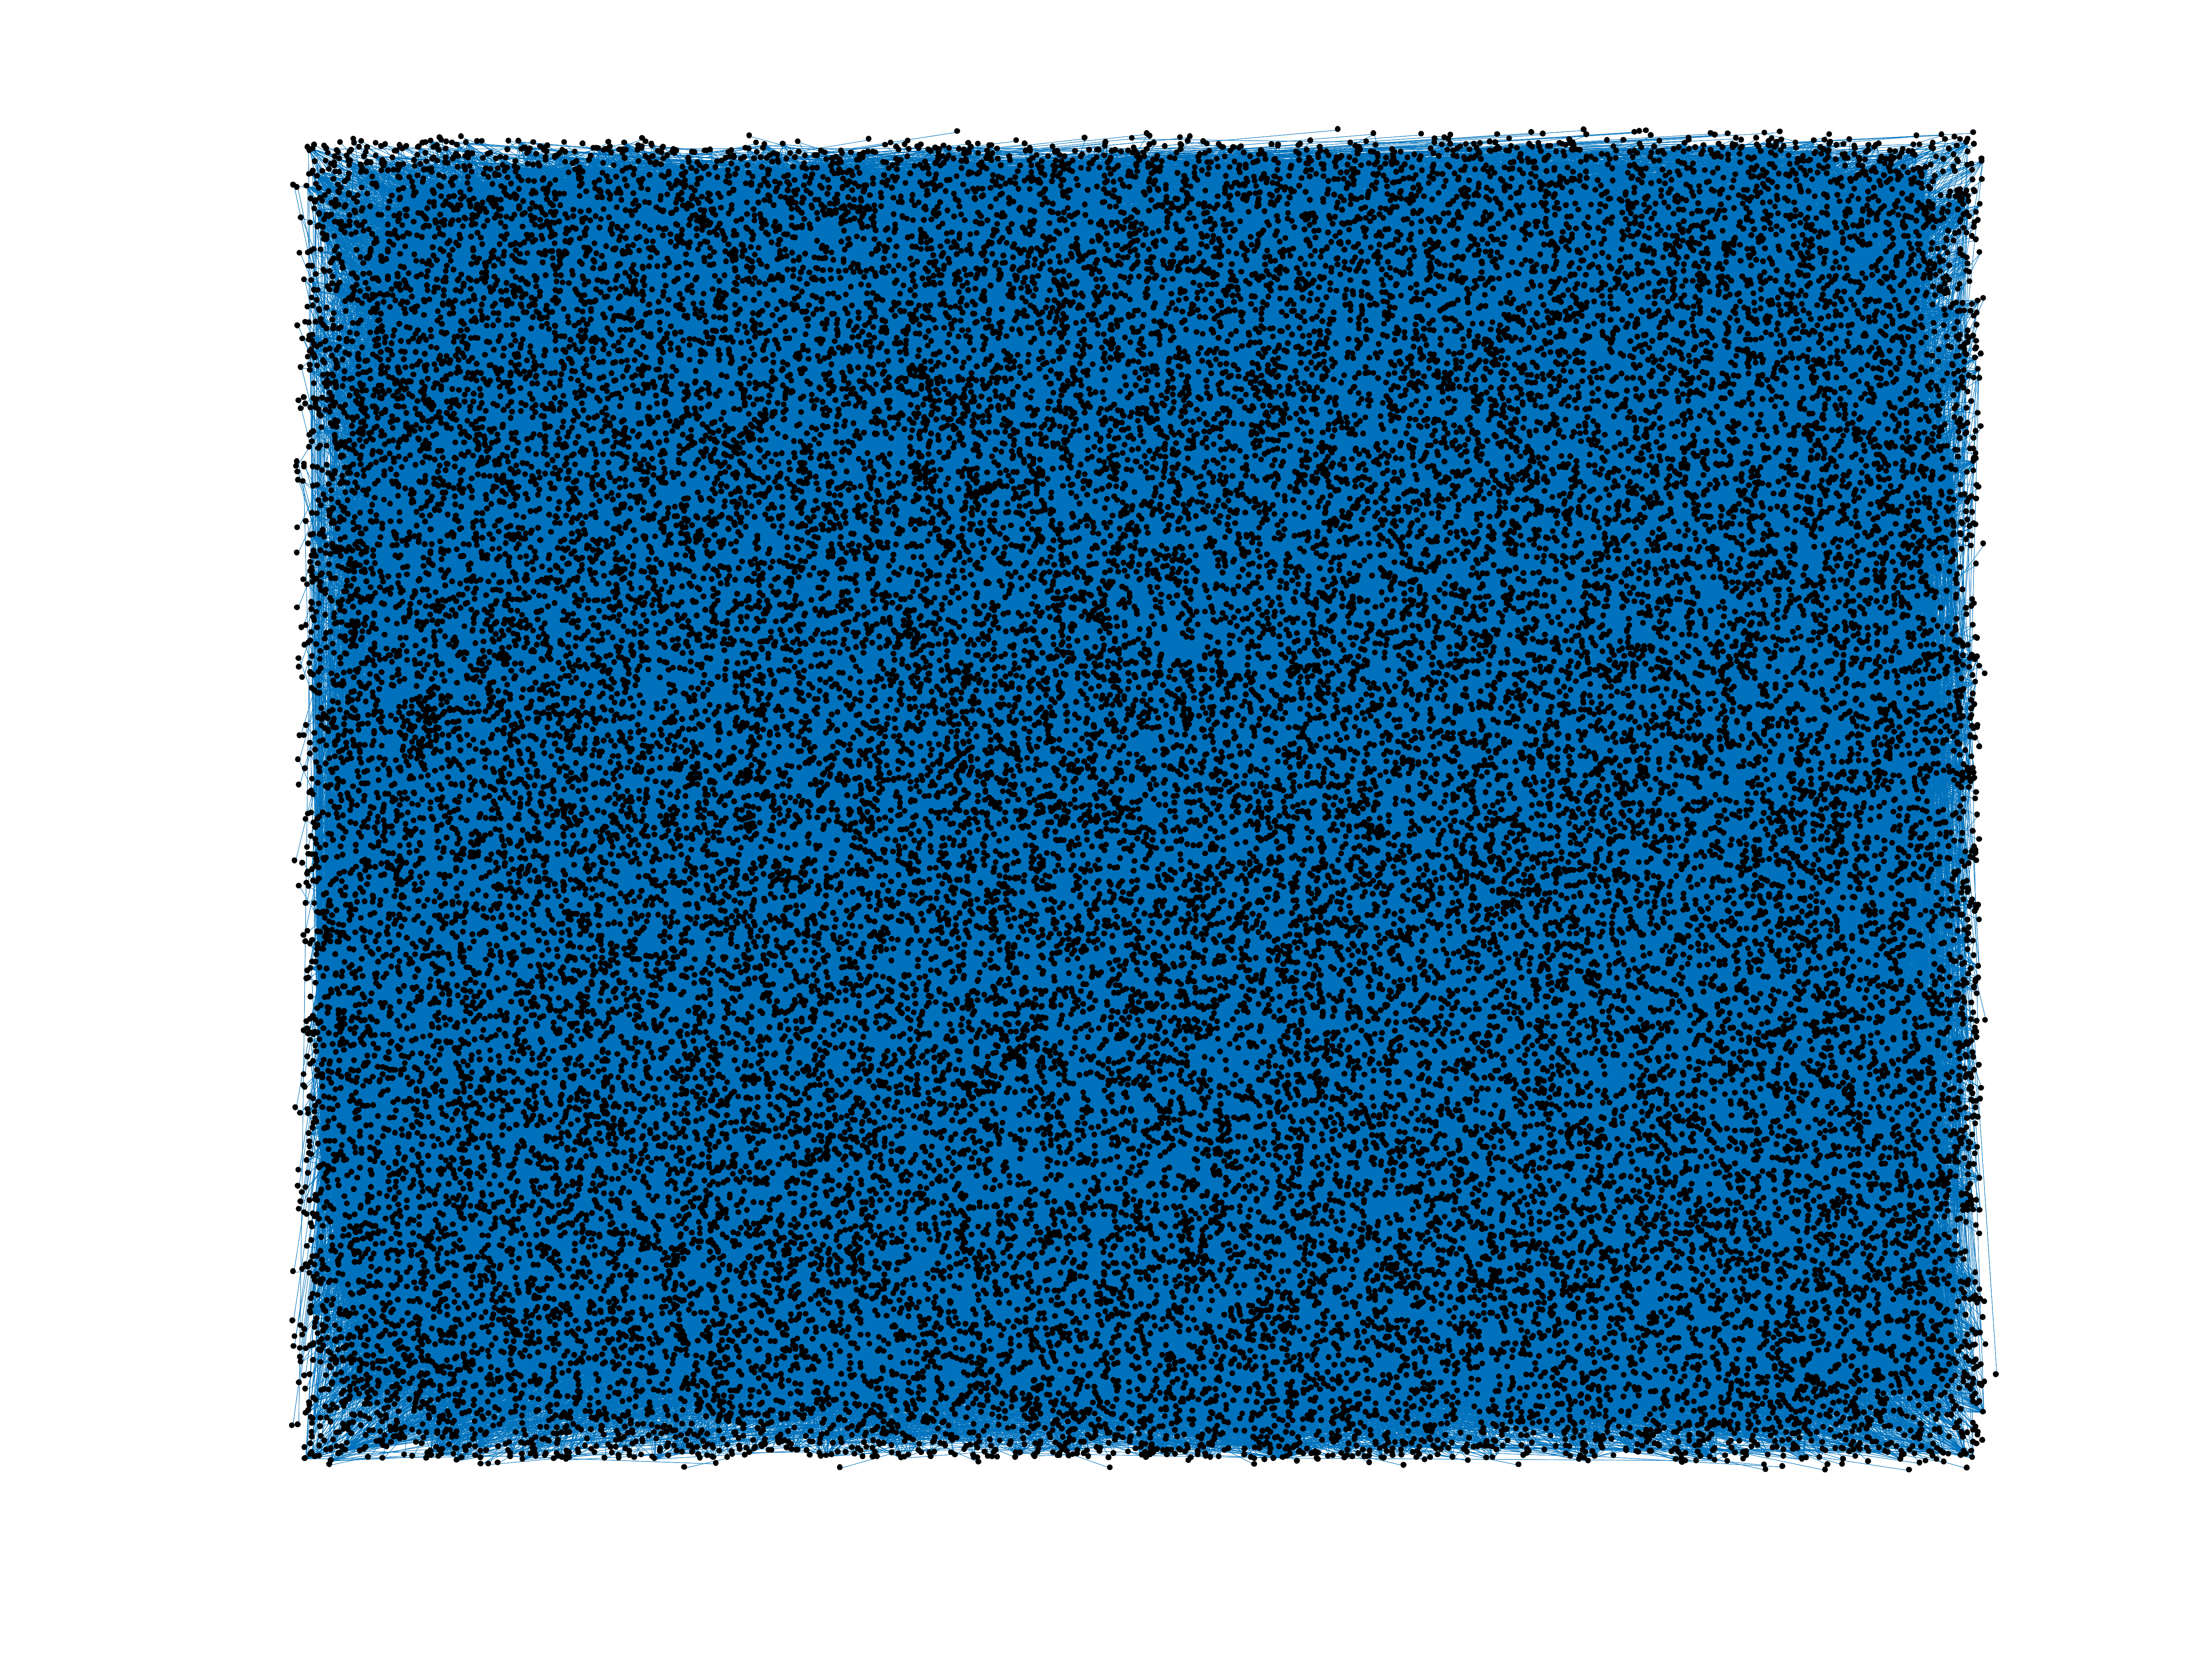
Wikipedia edits (sah)
This is the bipartite edit network of the Sakha Wikipedia. It contains users
and pages from the Sakha Wikipedia, connected by edit events. Each edge
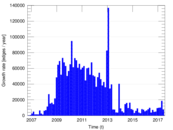
represents an edit. The dataset includes the timestamp of each edit.
Metadata
Statistics
| Size | n = | 39,858
|
| Left size | n1 = | 1,763
|
| Right size | n2 = | 38,095
|
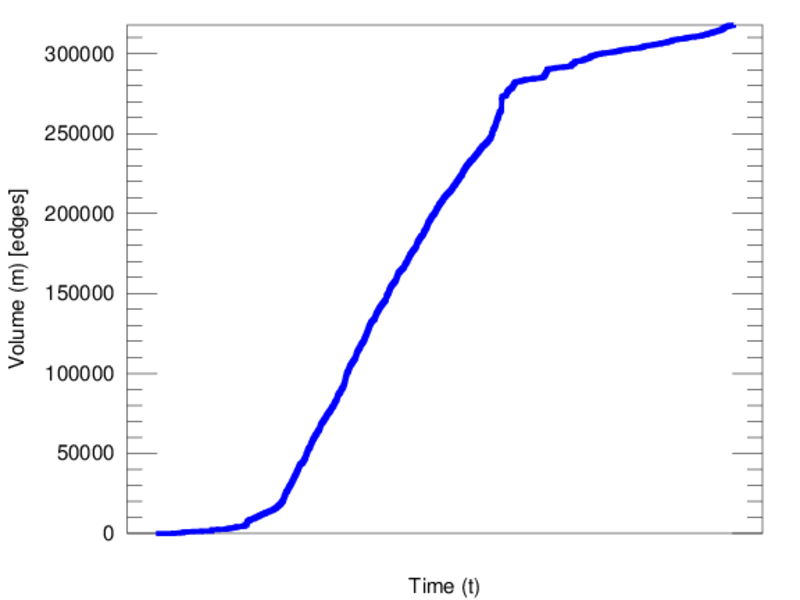
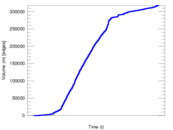
| Volume | m = | 317,875
|
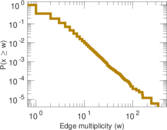
| Unique edge count | m̿ = | 165,493
|
| Wedge count | s = | 368,985,064
|
| Claw count | z = | 1,000,775,111,835
|
| Cross count | x = | 2,702,539,435,571,483
|
| Square count | q = | 693,625,954
|
| 4-Tour count | T4 = | 7,025,432,482
|
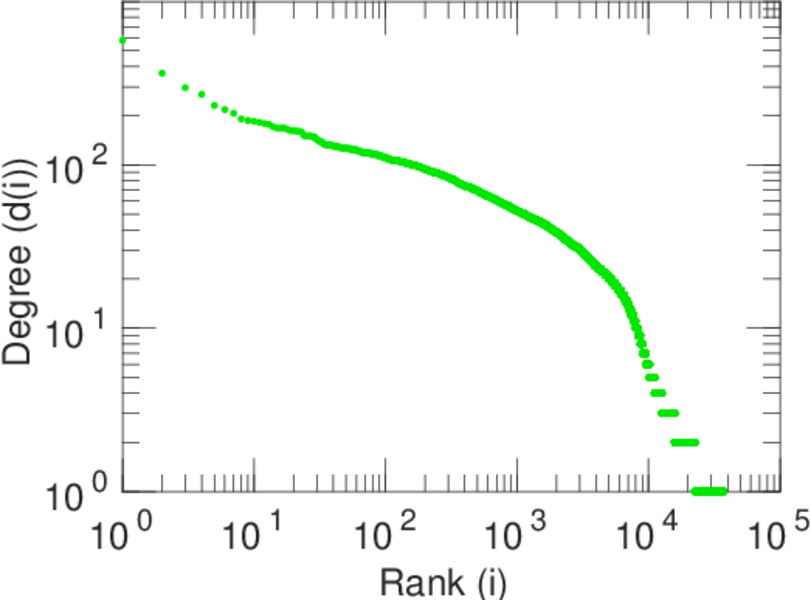
| Maximum degree | dmax = | 32,513
|
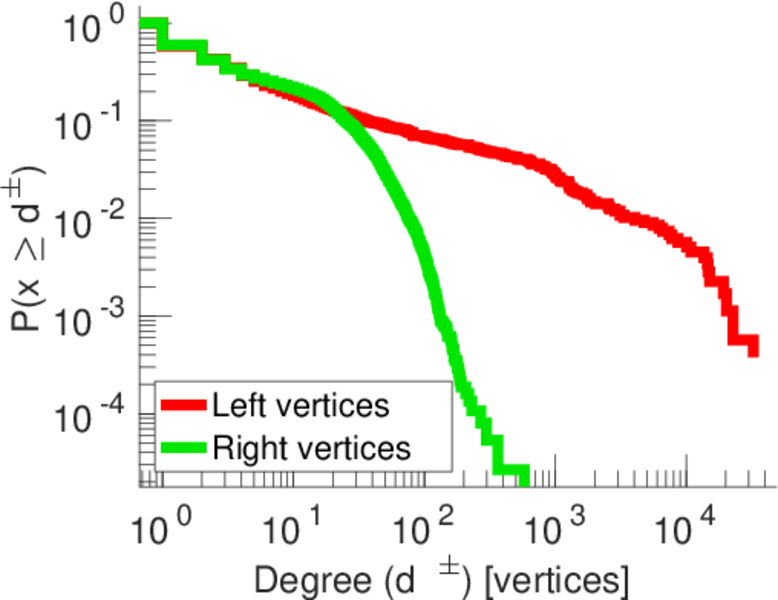
| Maximum left degree | d1max = | 32,513
|
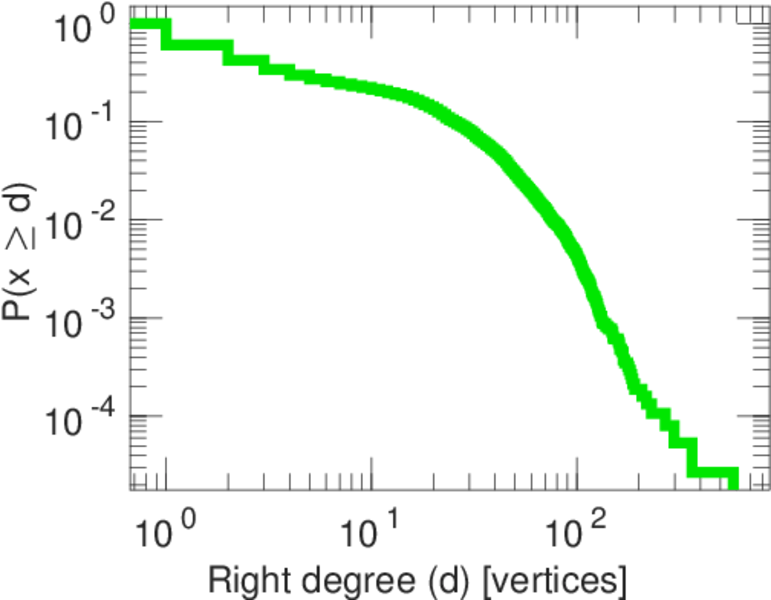
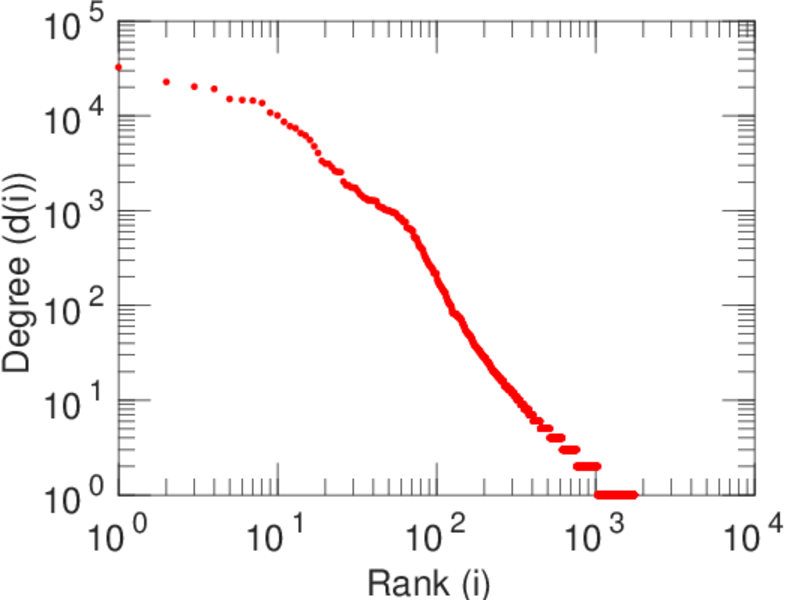
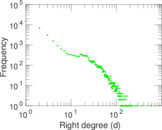
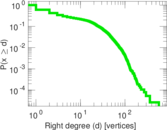
| Maximum right degree | d2max = | 578
|
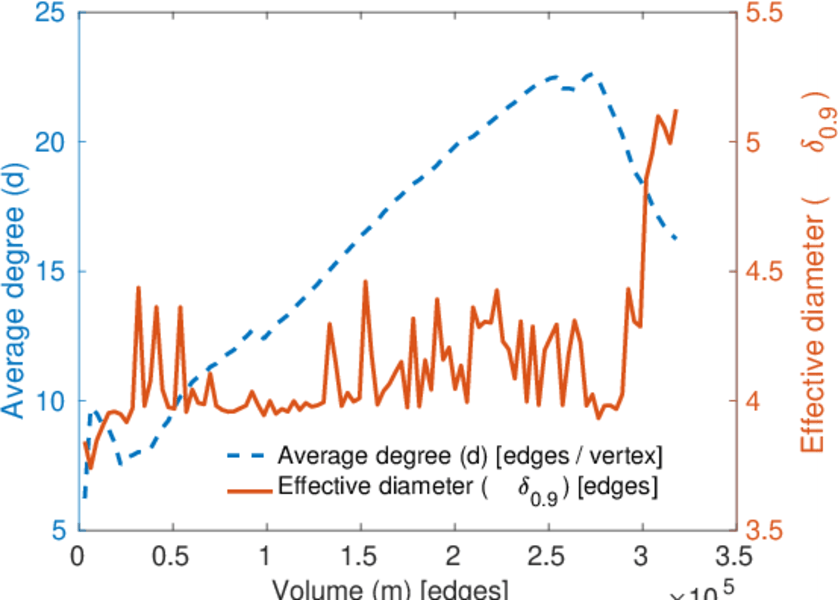
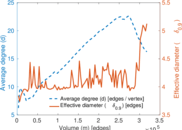
| Average degree | d = | 15.950 4
|
| Average left degree | d1 = | 180.303
|
| Average right degree | d2 = | 8.344 27
|
| Fill | p = | 0.002 464 11
|
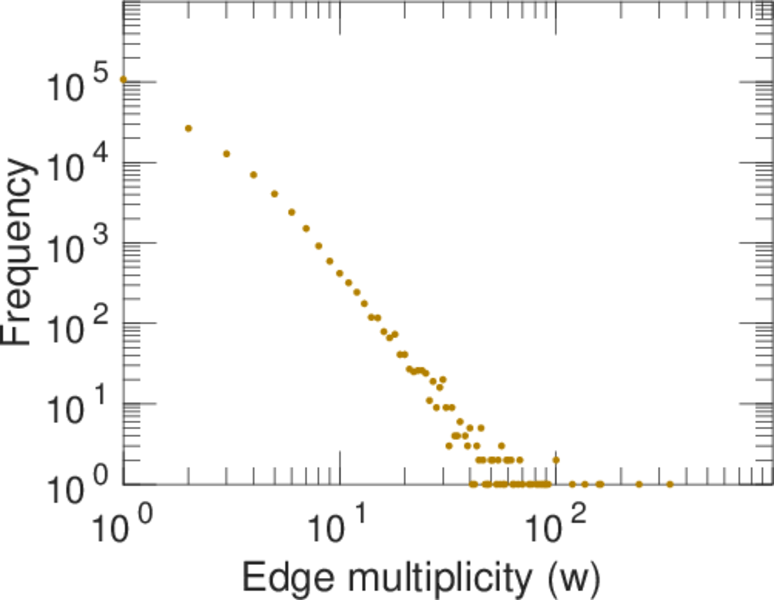
| Average edge multiplicity | m̃ = | 1.920 78
|
| Size of LCC | N = | 38,581
|
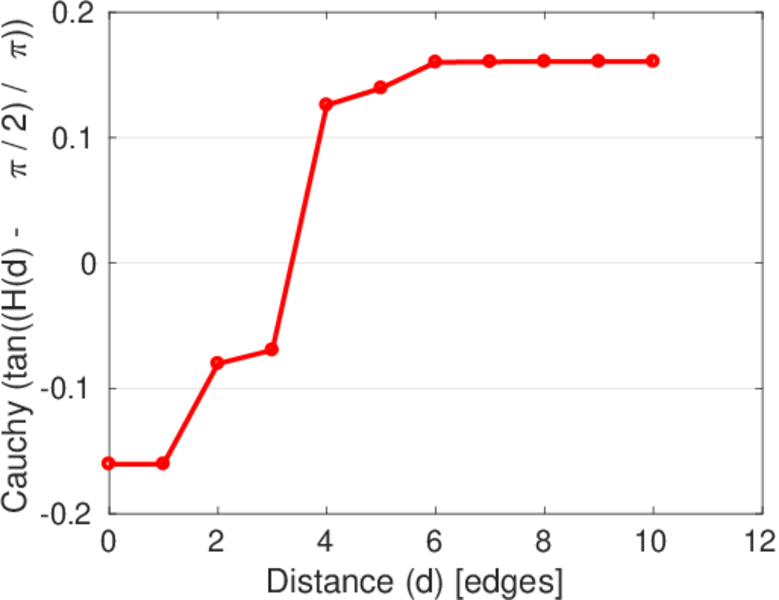
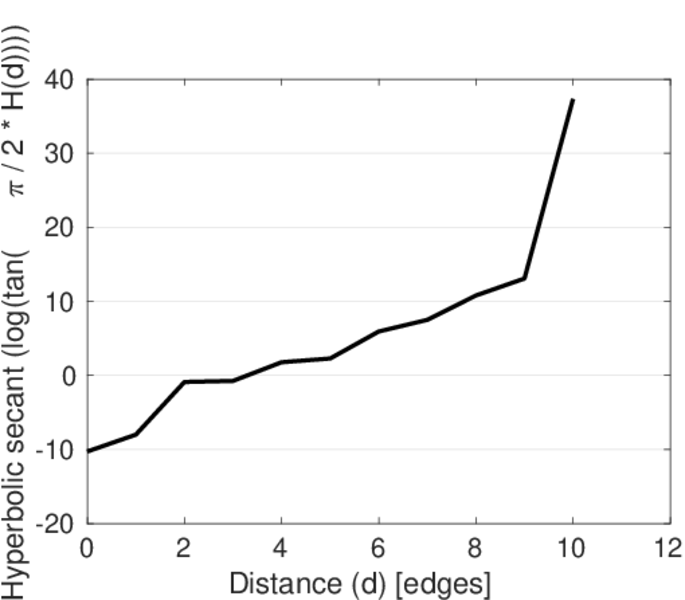
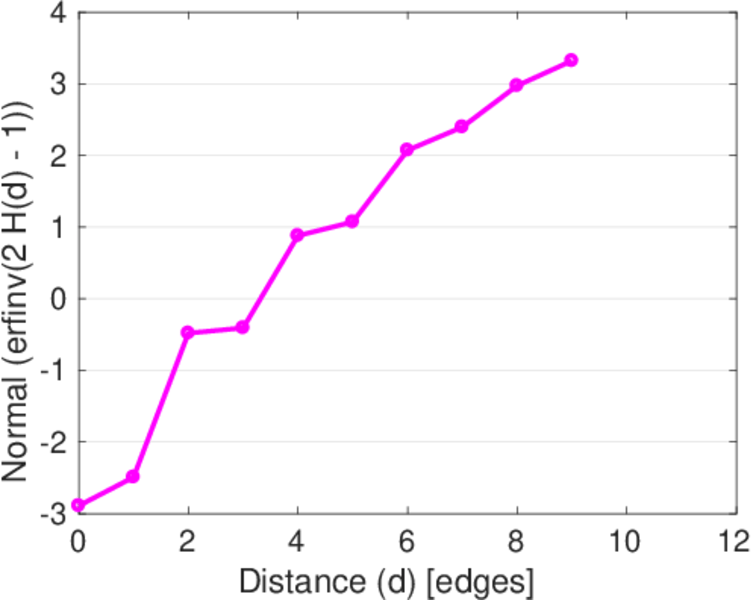
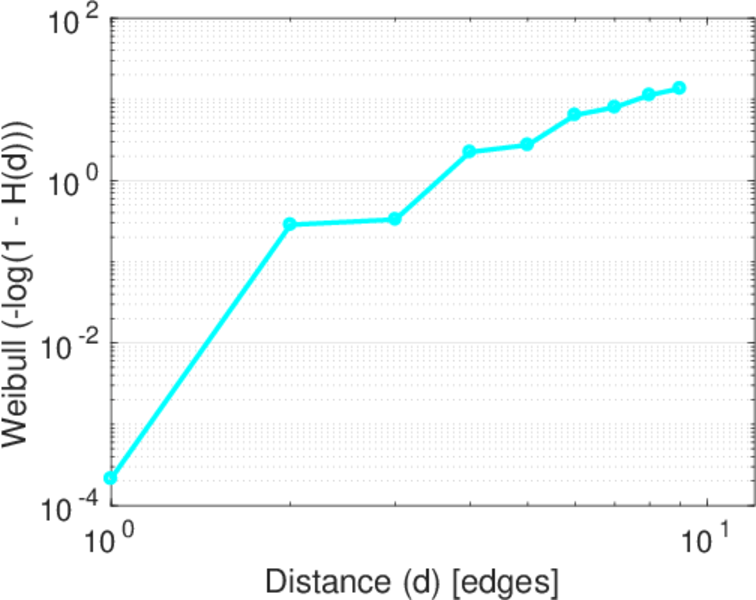
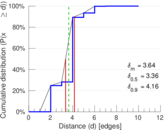
| Diameter | δ = | 11
|
| 50-Percentile effective diameter | δ0.5 = | 3.356 86
|
| 90-Percentile effective diameter | δ0.9 = | 4.161 69
|
| Median distance | δM = | 4
|
| Mean distance | δm = | 3.643 89
|
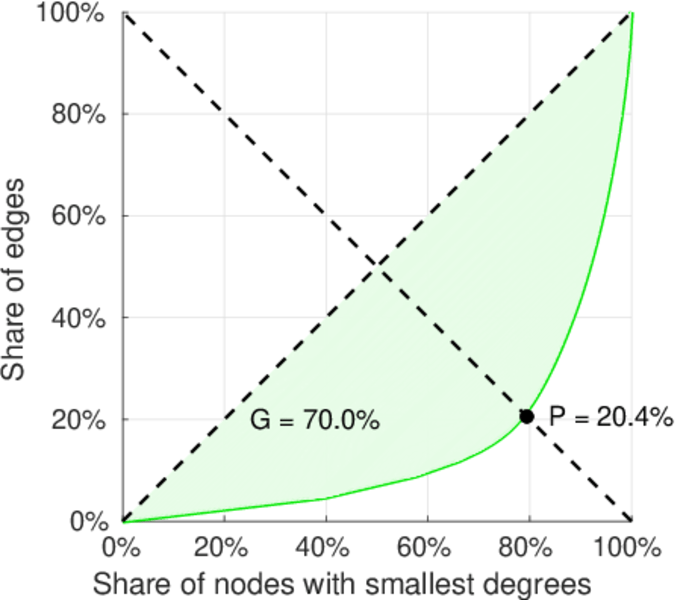
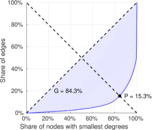
| Gini coefficient | G = | 0.843 909
|
| Balanced inequality ratio | P = | 0.154 499
|
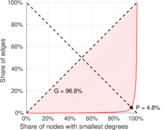
| Left balanced inequality ratio | P1 = | 0.047 896 2
|
| Right balanced inequality ratio | P2 = | 0.204 159
|
| Relative edge distribution entropy | Her = | 0.729 952
|
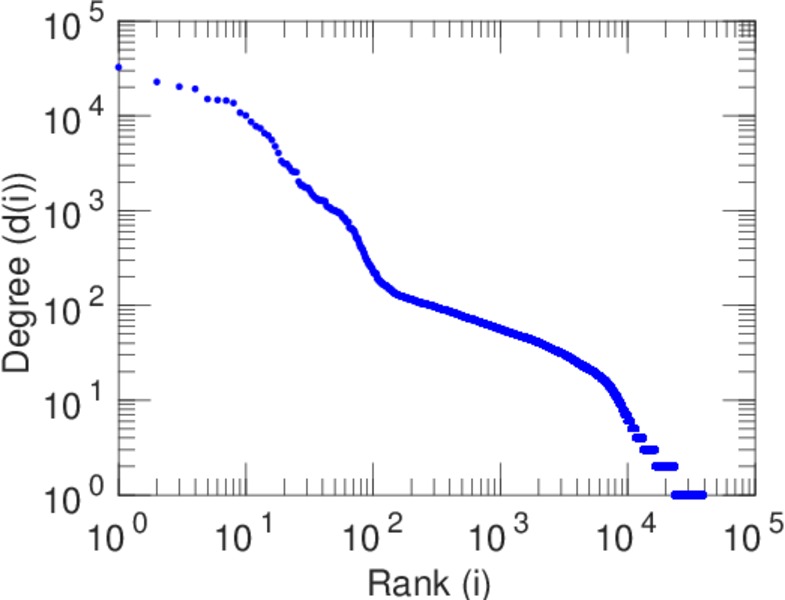
| Power law exponent | γ = | 2.264 15
|
| Tail power law exponent | γt = | 1.801 00
|
| Tail power law exponent with p | γ3 = | 1.801 00
|
| p-value | p = | 0.000 00
|
| Left tail power law exponent with p | γ3,1 = | 1.671 00
|
| Left p-value | p1 = | 0.000 00
|
| Right tail power law exponent with p | γ3,2 = | 6.931 00
|
| Right p-value | p2 = | 0.053 000 0
|
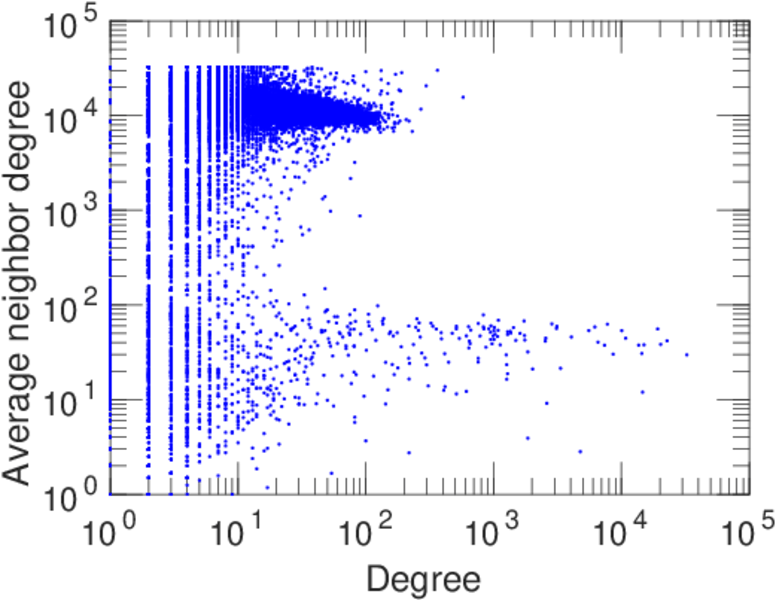
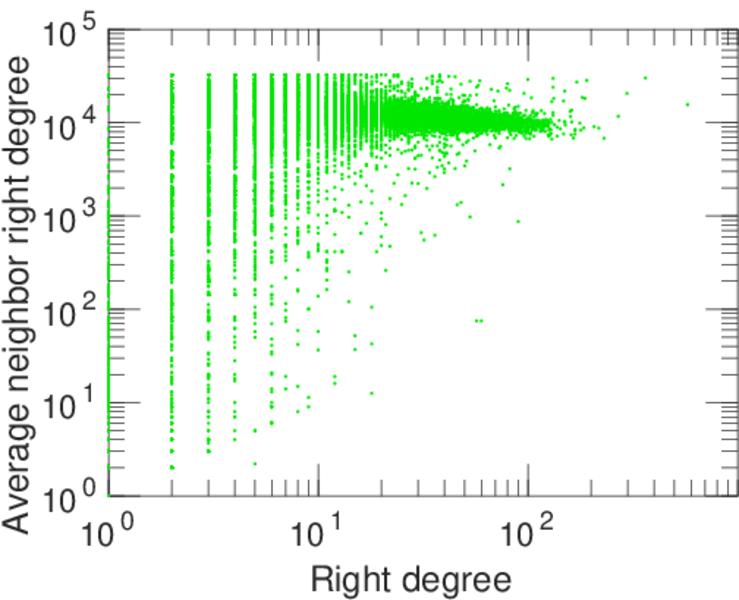
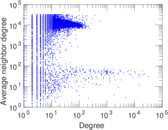
| Degree assortativity | ρ = | −0.352 092
|
| Degree assortativity p-value | pρ = | 0.000 00
|
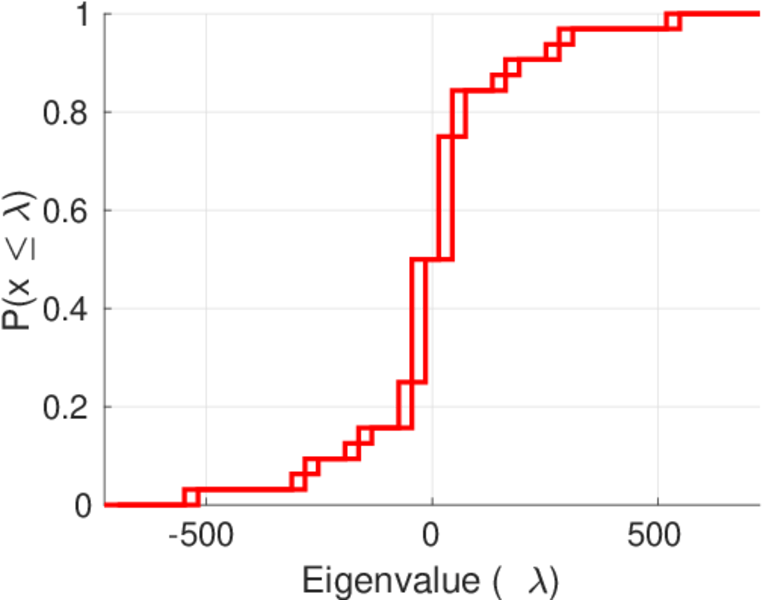
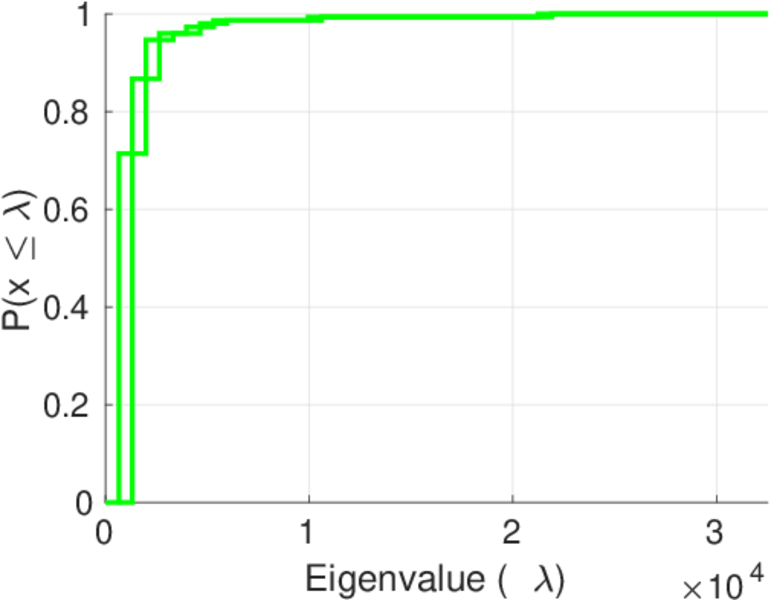
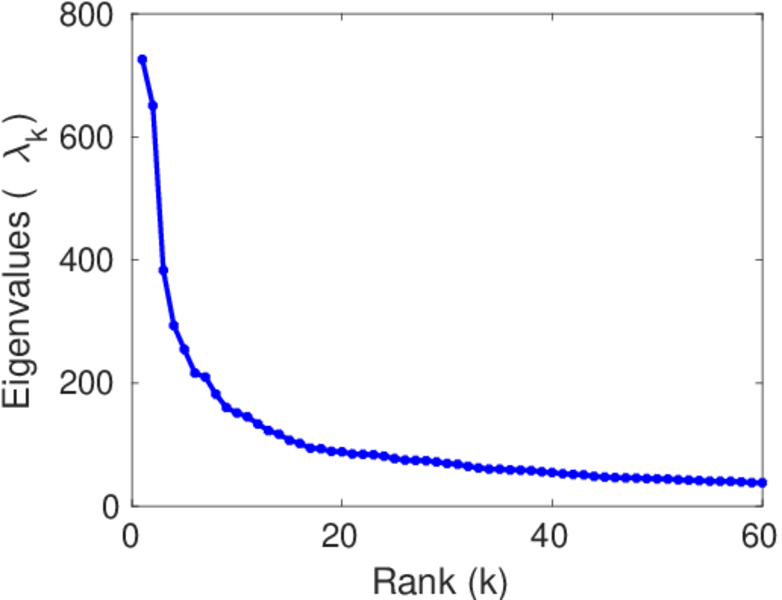
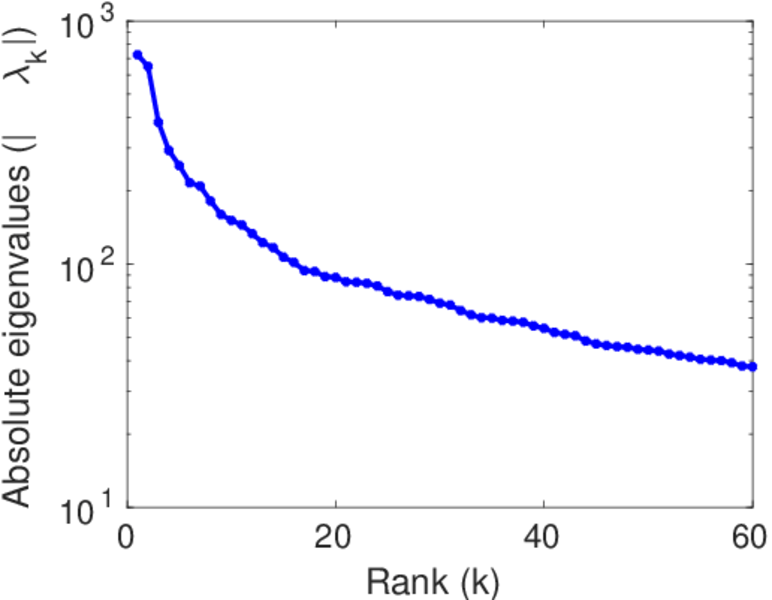
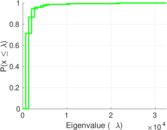
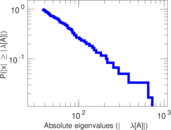
| Spectral norm | α = | 725.669
|
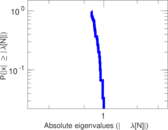
| Algebraic connectivity | a = | 0.044 143 3
|
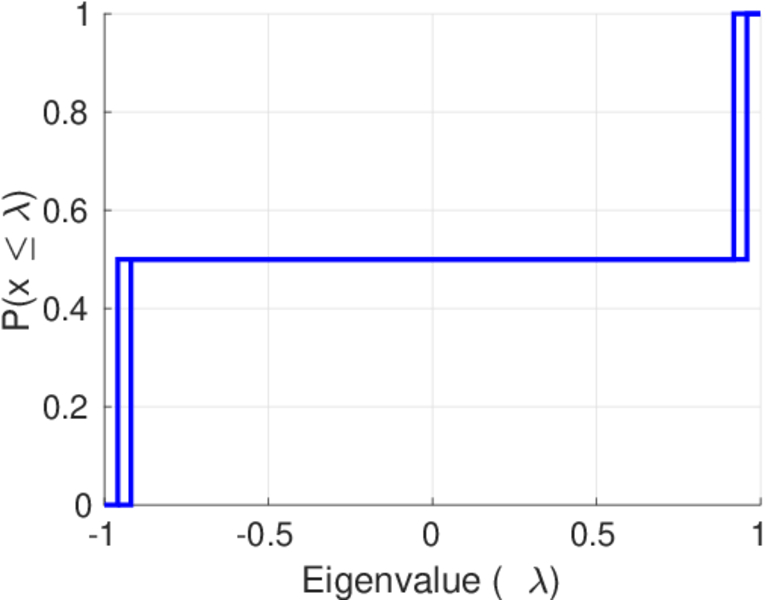
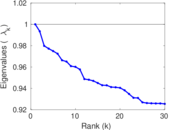
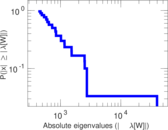
| Spectral separation | |λ1[A] / λ2[A]| = | 1.115 34
|
| Controllability | C = | 35,837
|
| Relative controllability | Cr = | 0.915 634
|
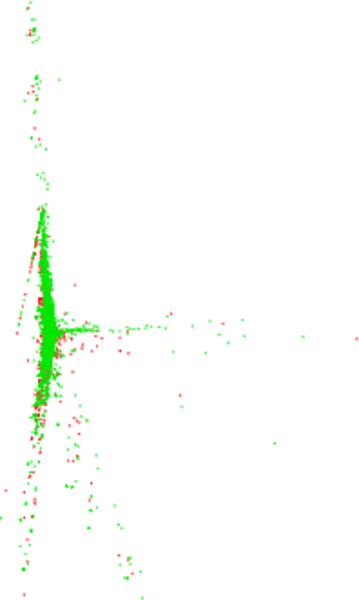
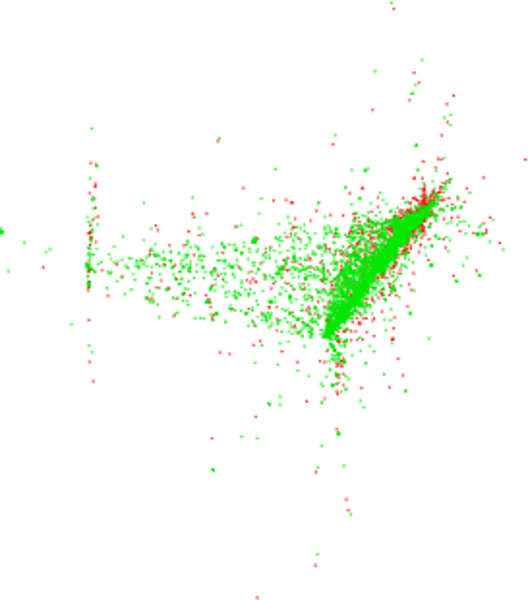
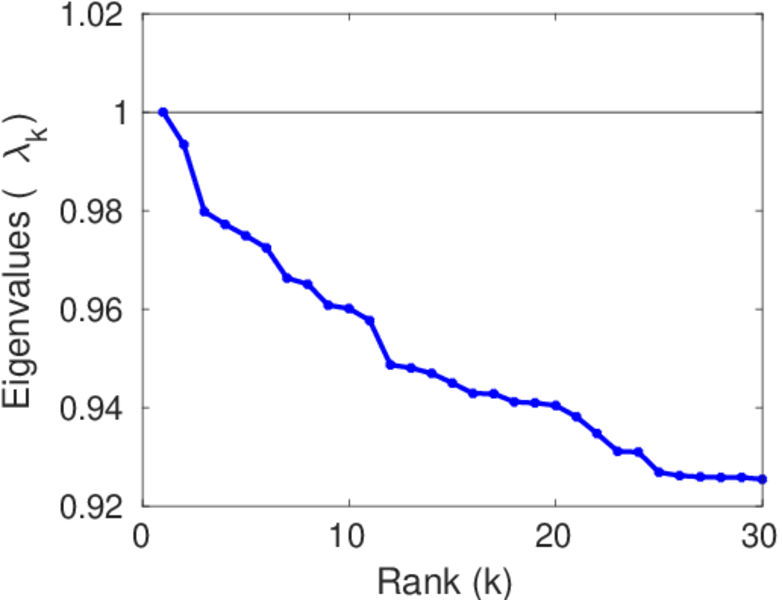
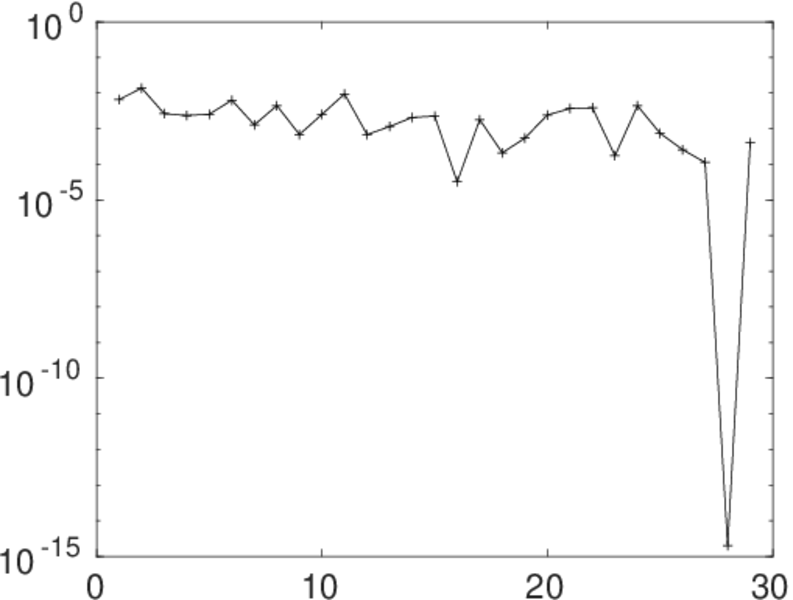
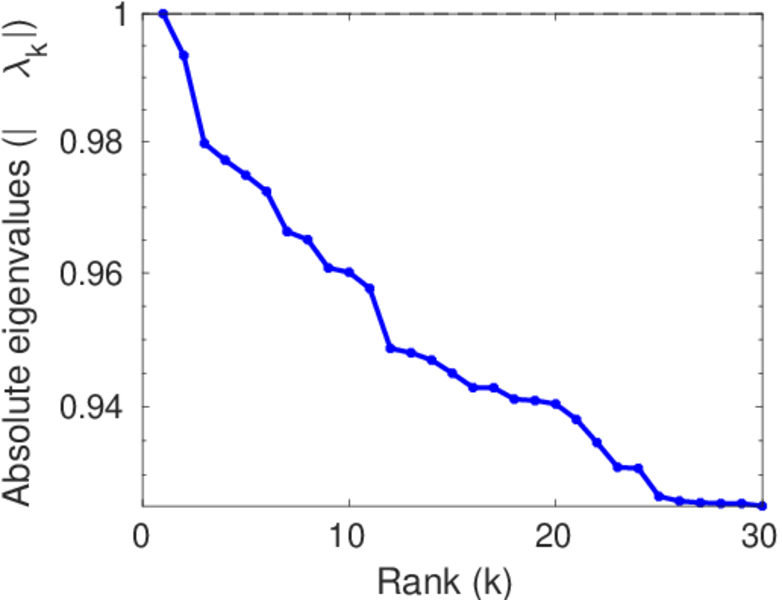
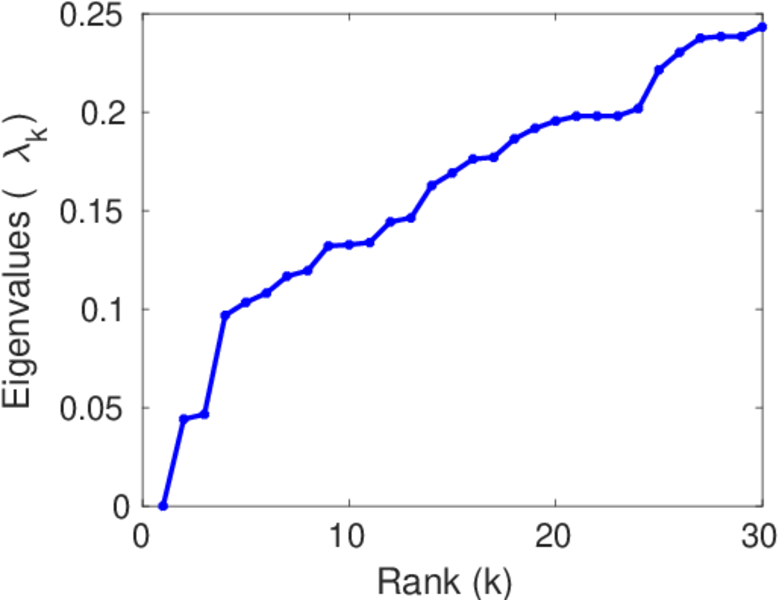
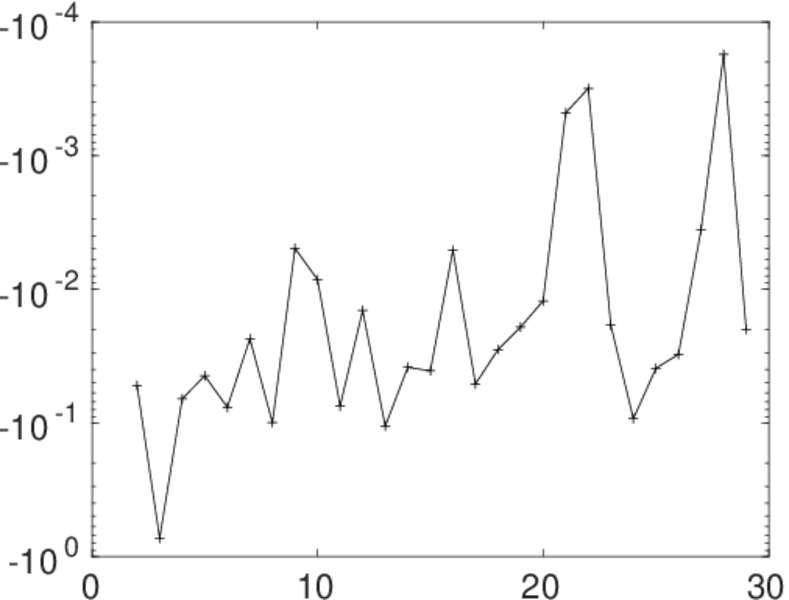
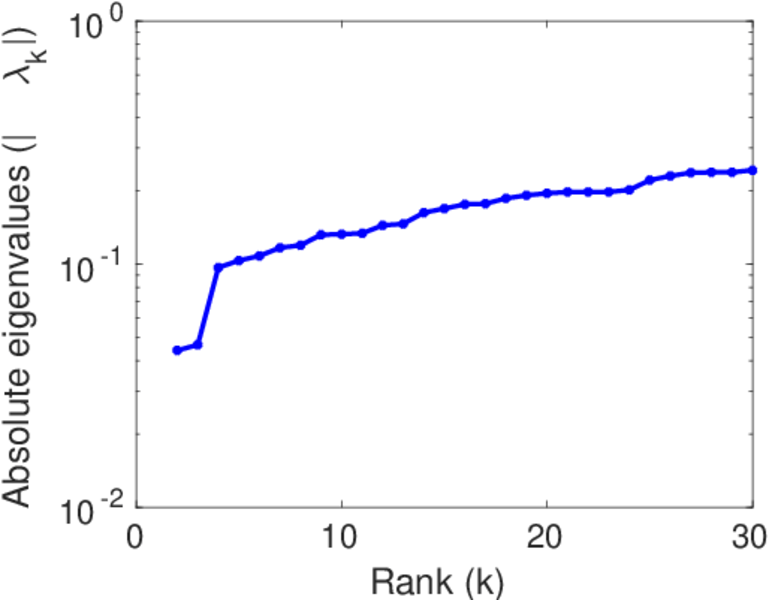
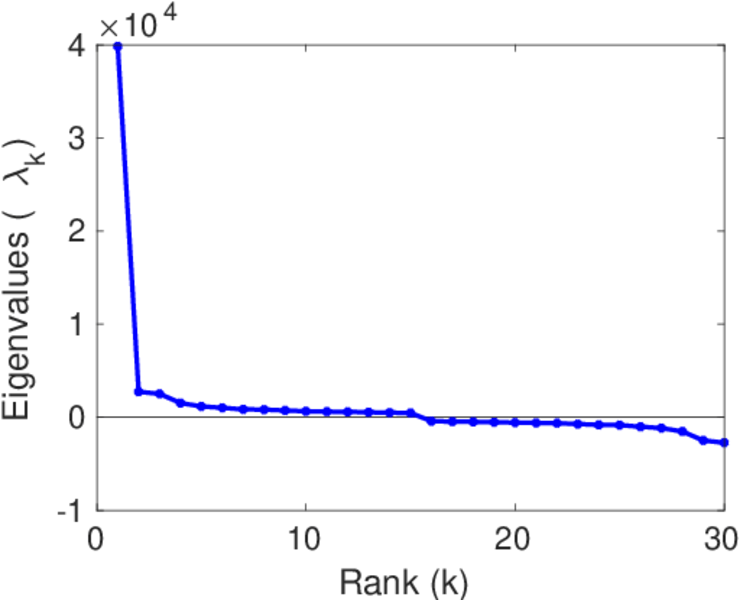
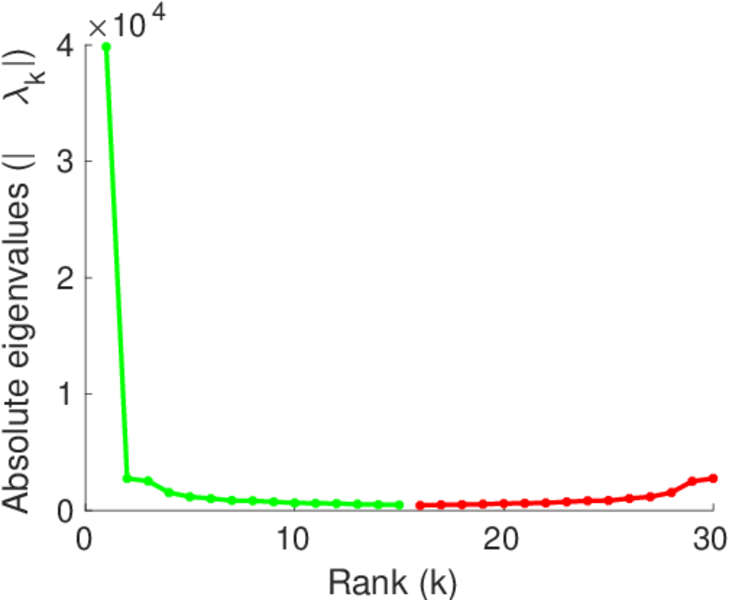
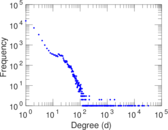
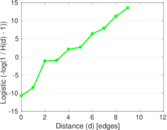
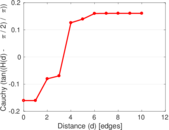
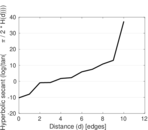
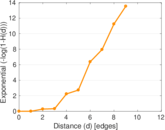
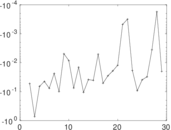
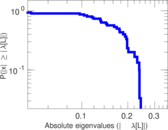
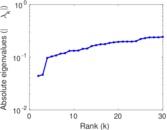
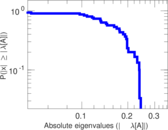
Plots


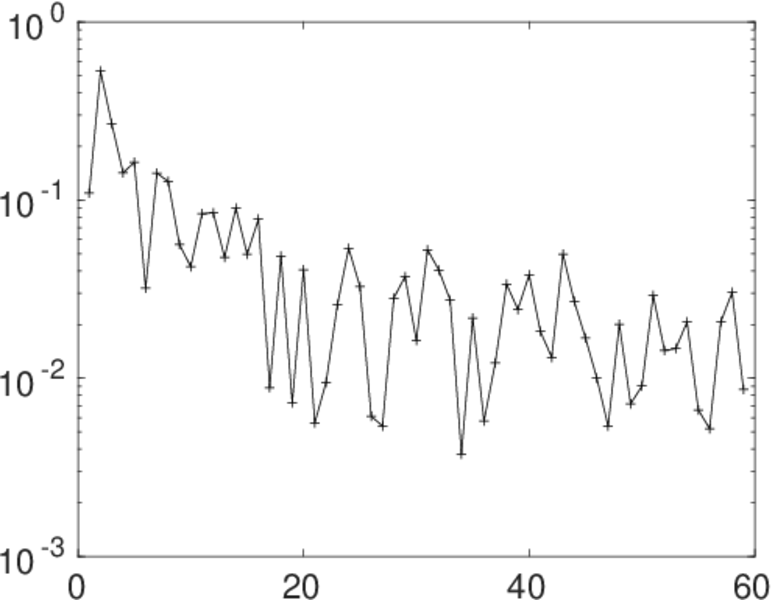
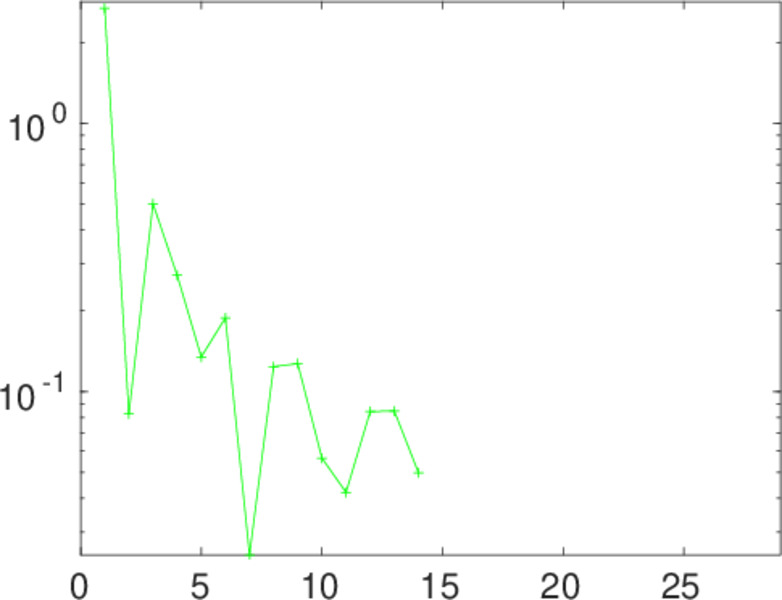
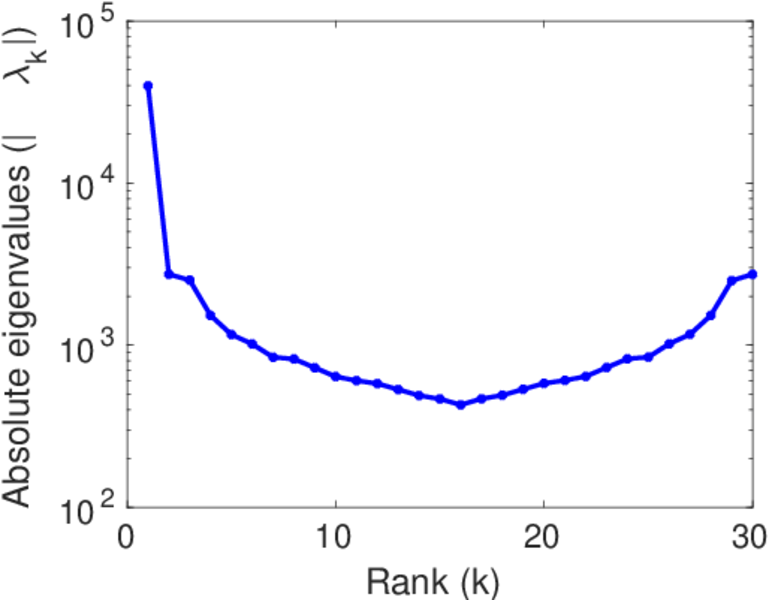
Matrix decompositions plots


Downloads
References
|
[1]
|
Jérôme Kunegis.
KONECT – The Koblenz Network Collection.
In Proc. Int. Conf. on World Wide Web Companion, pages
1343–1350, 2013.
[ http ]
|
|
[2]
|
Wikimedia Foundation.
Wikimedia downloads.
http://dumps.wikimedia.org/, January 2010.
|
 KONECT ‣ Networks ‣
Buy Me a Coffee
KONECT ‣ Networks ‣
Buy Me a Coffee