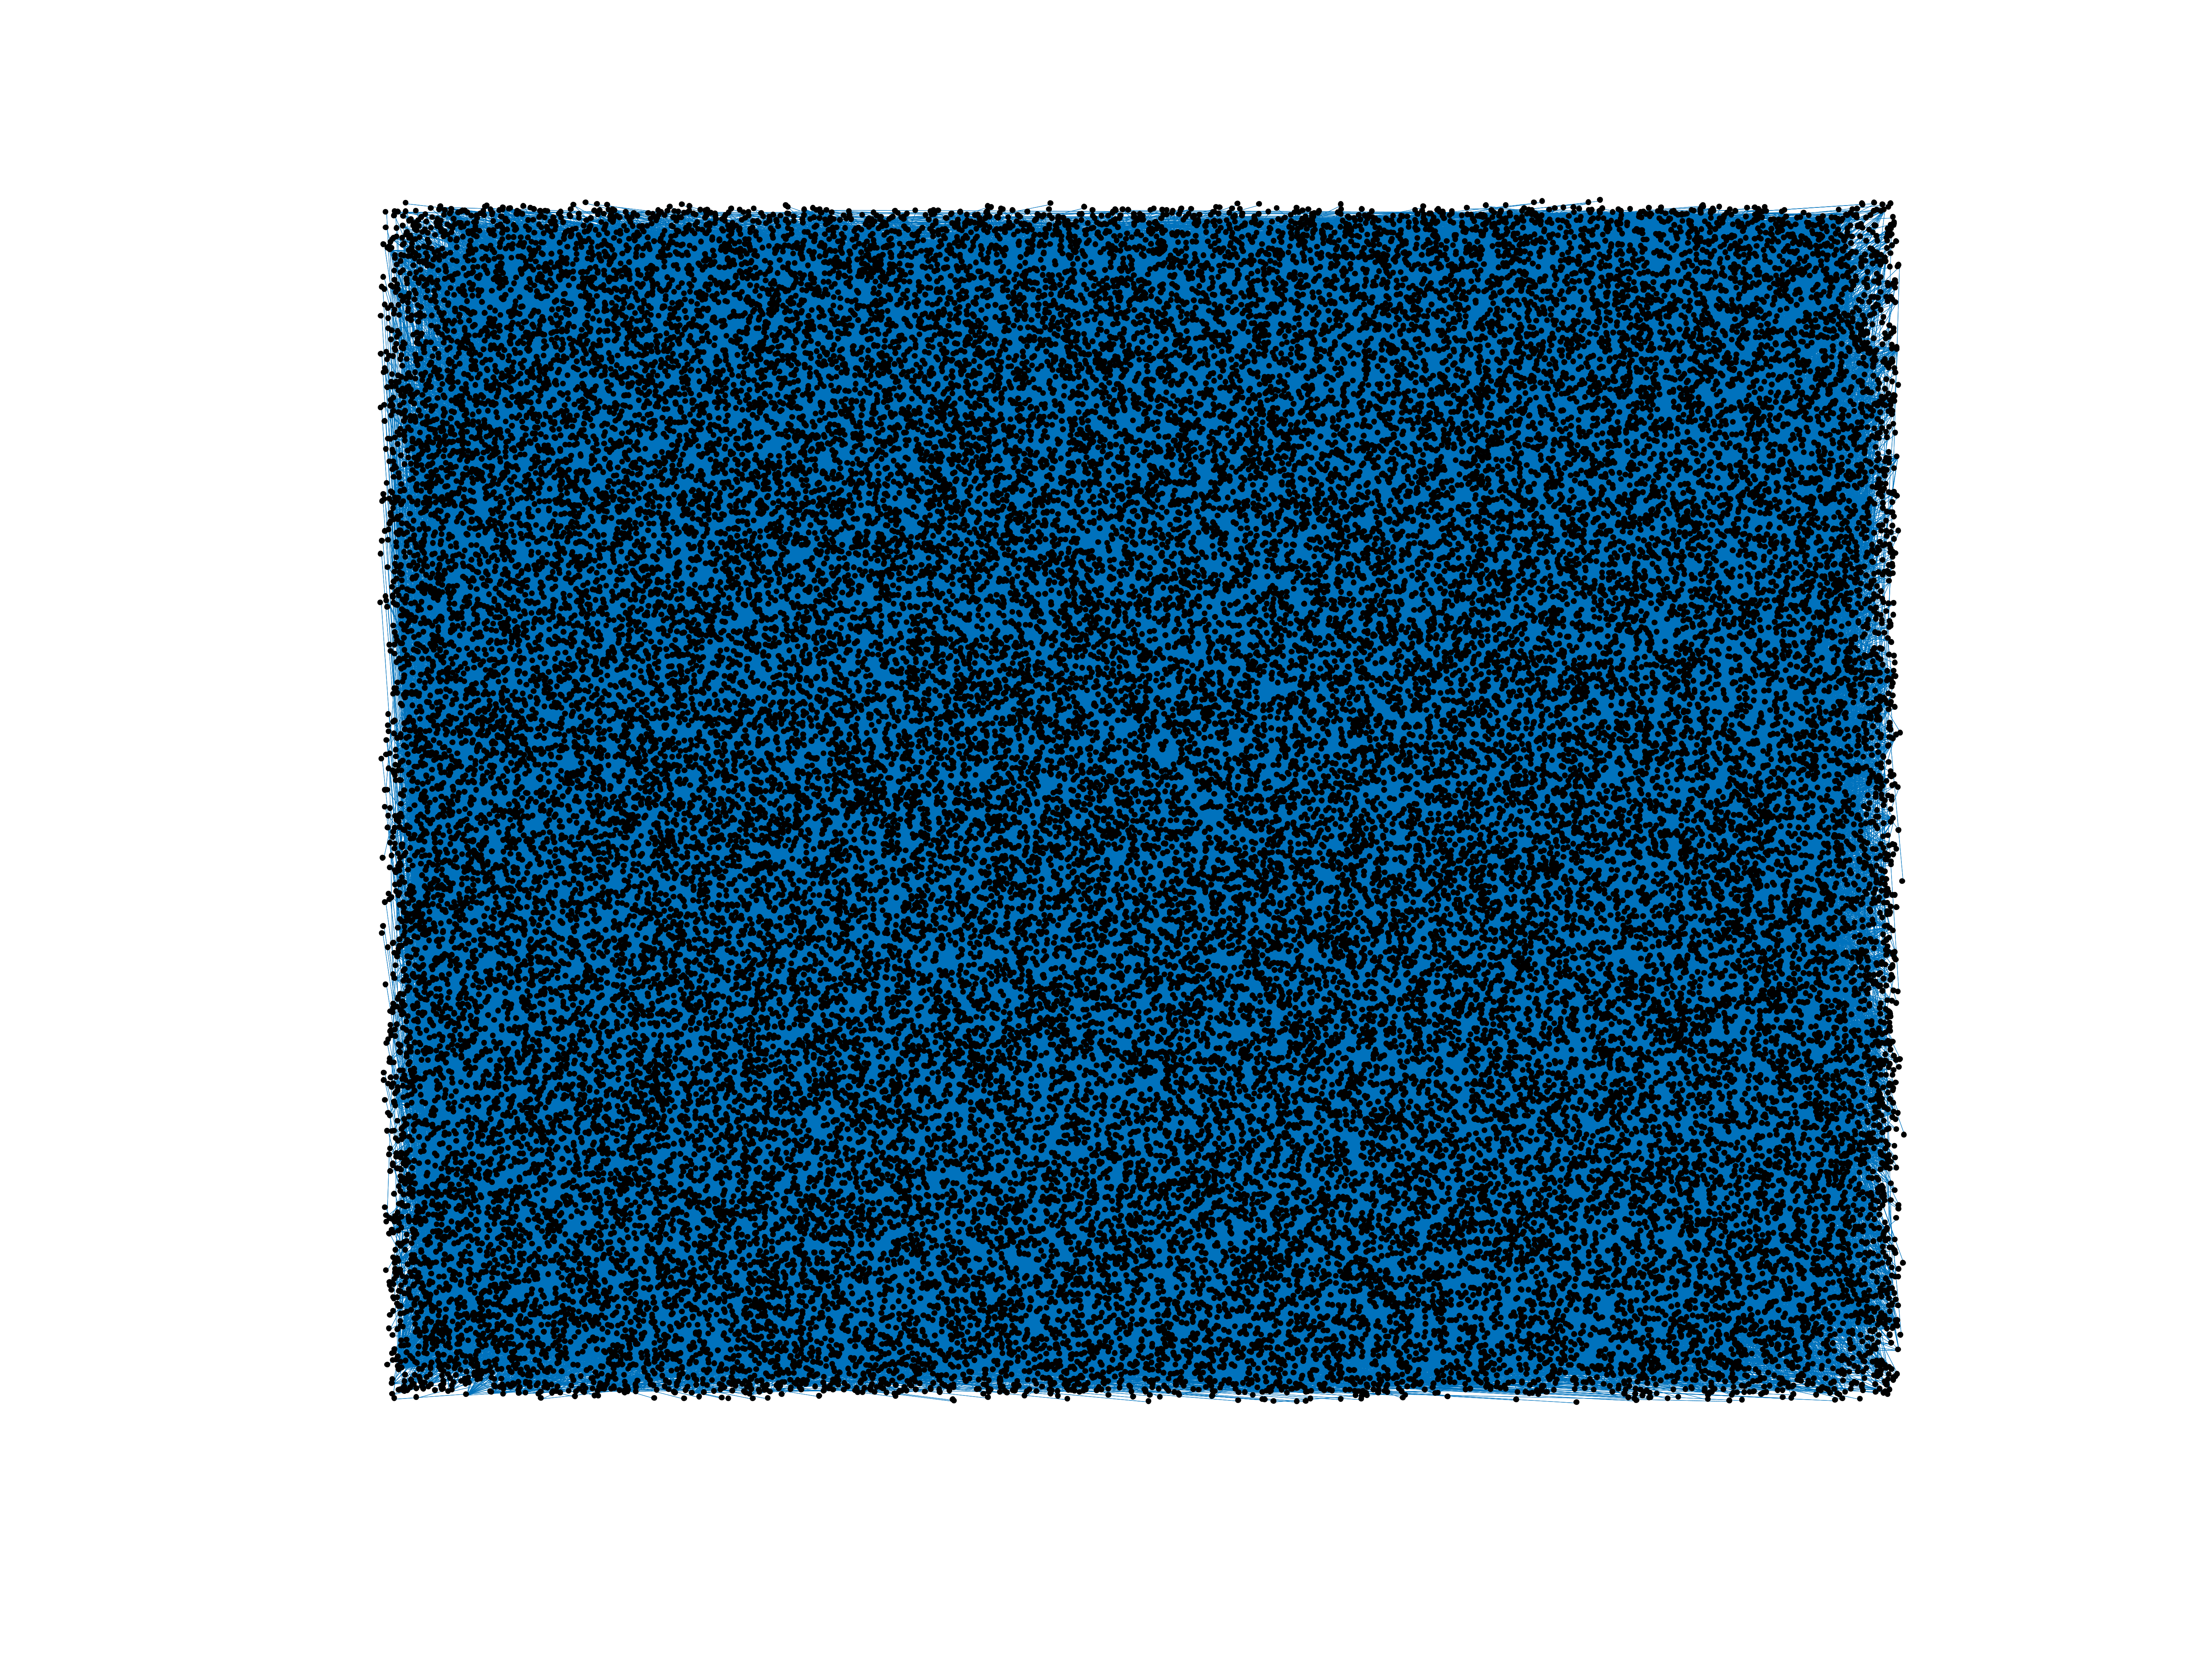
Wikipedia edits (sa)
This is the bipartite edit network of the Sanskrit Wikipedia. It contains users
and pages from the Sanskrit Wikipedia, connected by edit events. Each edge
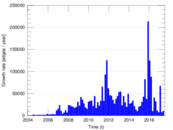
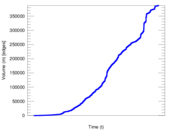
represents an edit. The dataset includes the timestamp of each edit.
Metadata
Statistics
| Size | n = | 53,467
|
| Left size | n1 = | 4,505
|
| Right size | n2 = | 48,962
|
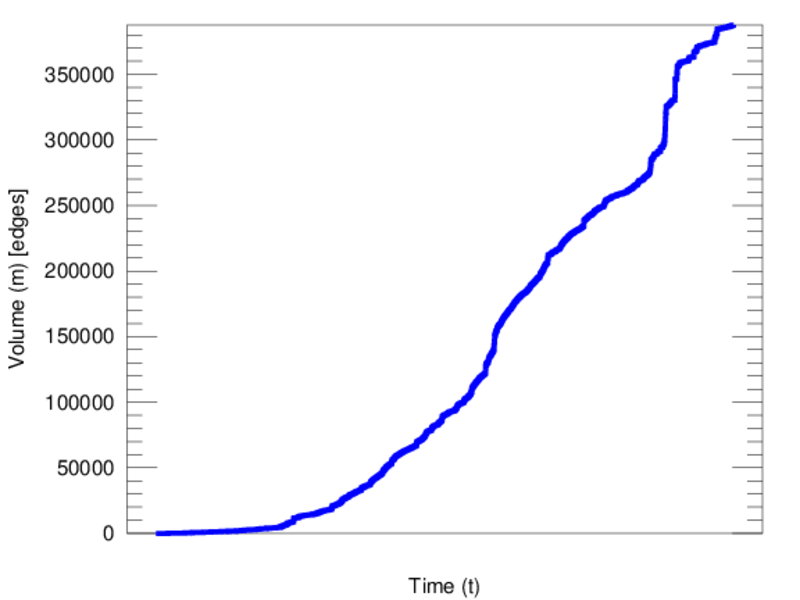
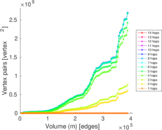
| Volume | m = | 387,592
|
| Unique edge count | m̿ = | 181,413
|
| Wedge count | s = | 447,520,782
|
| Claw count | z = | 1,695,798,741,361
|
| Cross count | x = | 6,135,197,967,013,632
|
| Square count | q = | 546,411,652
|
| 4-Tour count | T4 = | 6,162,075,710
|
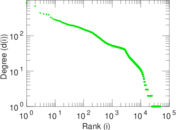
| Maximum degree | dmax = | 73,603
|
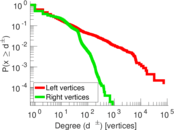
| Maximum left degree | d1max = | 73,603
|
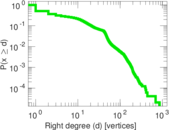
| Maximum right degree | d2max = | 856
|
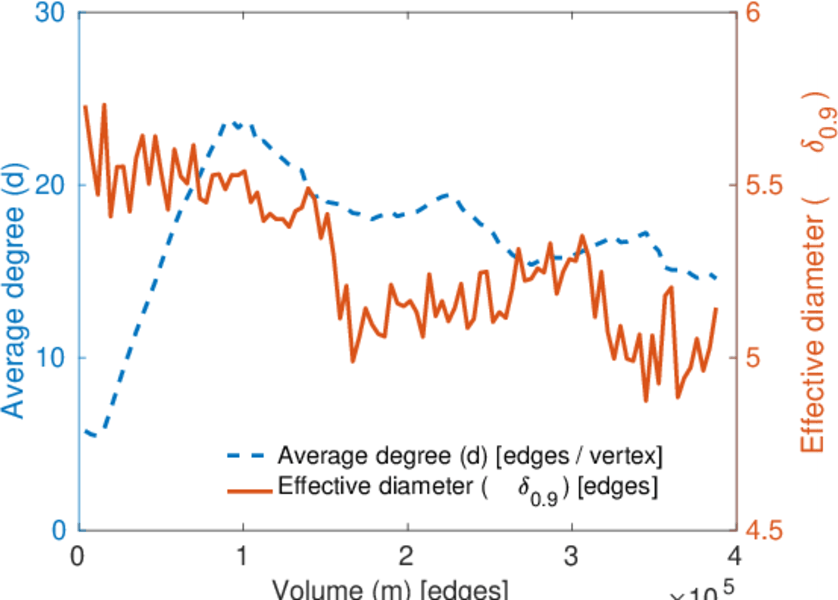
| Average degree | d = | 14.498 4
|
| Average left degree | d1 = | 86.036 0
|
| Average right degree | d2 = | 7.916 18
|
| Fill | p = | 0.000 822 459
|
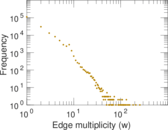
| Average edge multiplicity | m̃ = | 2.136 52
|
| Size of LCC | N = | 51,857
|
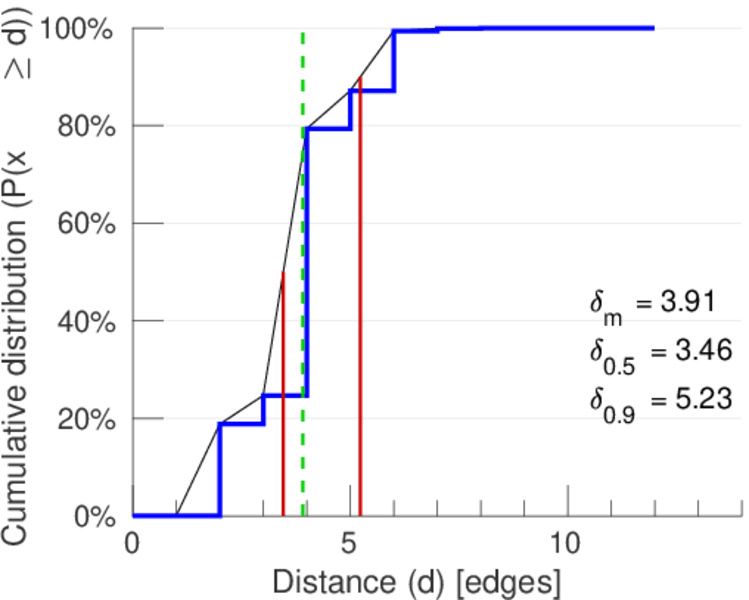
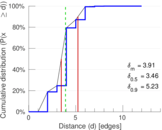
| Diameter | δ = | 14
|
| 50-Percentile effective diameter | δ0.5 = | 3.463 22
|
| 90-Percentile effective diameter | δ0.9 = | 5.234 11
|
| Median distance | δM = | 4
|
| Mean distance | δm = | 3.907 60
|
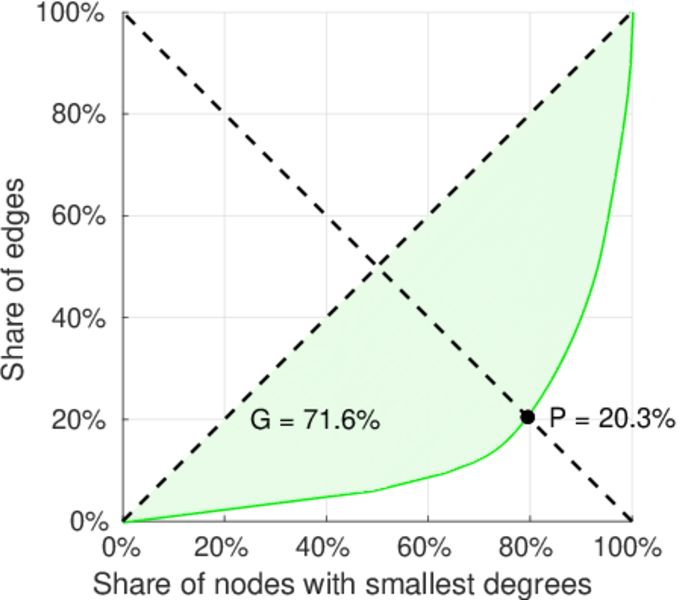
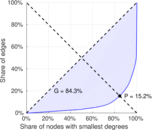
| Gini coefficient | G = | 0.851 157
|
| Balanced inequality ratio | P = | 0.150 367
|
| Left balanced inequality ratio | P1 = | 0.054 941 8
|
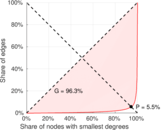
| Right balanced inequality ratio | P2 = | 0.202 963
|
| Relative edge distribution entropy | Her = | 0.739 314
|
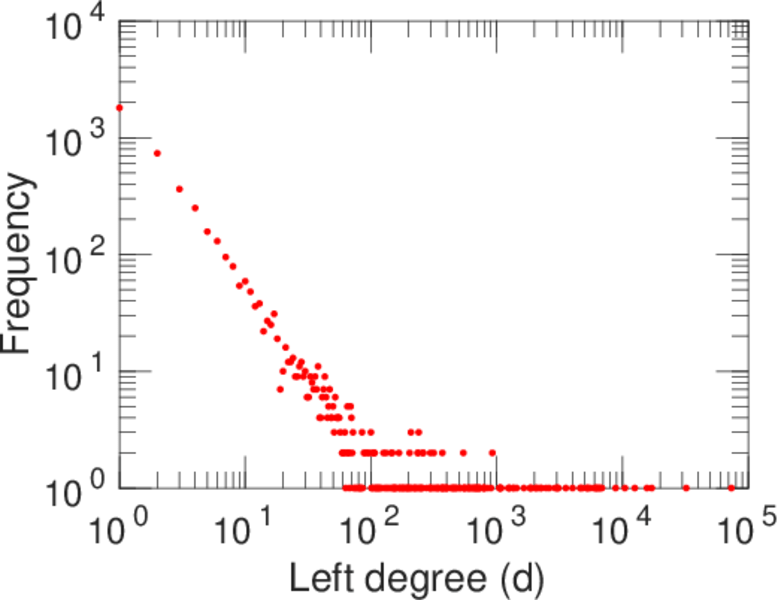
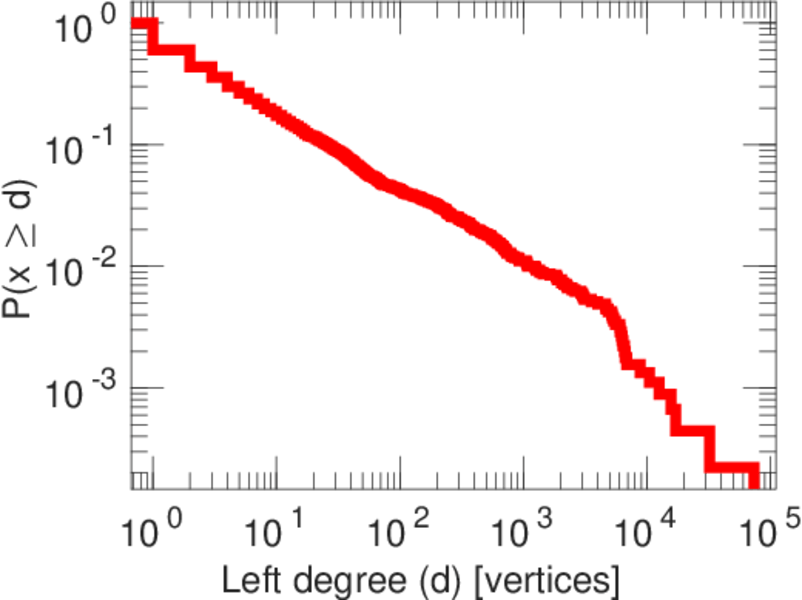
| Power law exponent | γ = | 2.506 12
|
| Tail power law exponent | γt = | 1.901 00
|
| Tail power law exponent with p | γ3 = | 1.901 00
|
| p-value | p = | 0.000 00
|
| Left tail power law exponent with p | γ3,1 = | 1.791 00
|
| Left p-value | p1 = | 0.000 00
|
| Right tail power law exponent with p | γ3,2 = | 1.921 00
|
| Right p-value | p2 = | 0.000 00
|
| Degree assortativity | ρ = | −0.335 059
|
| Degree assortativity p-value | pρ = | 0.000 00
|
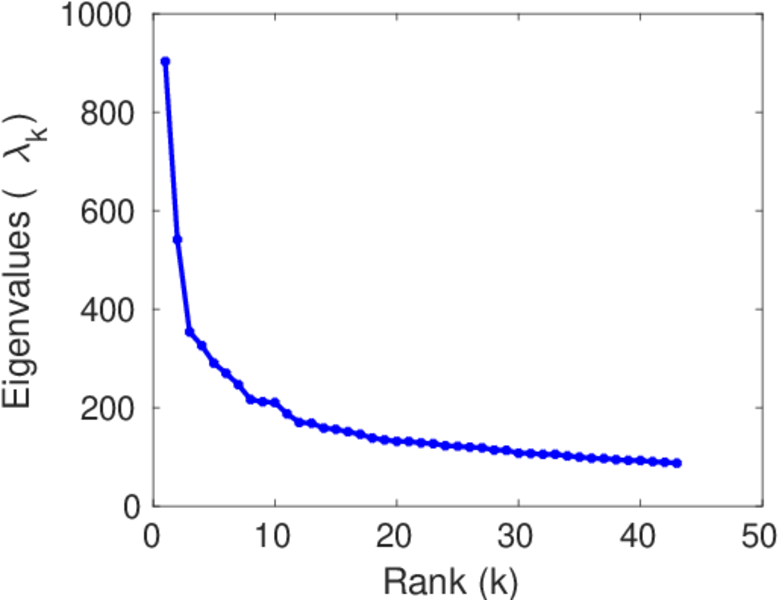
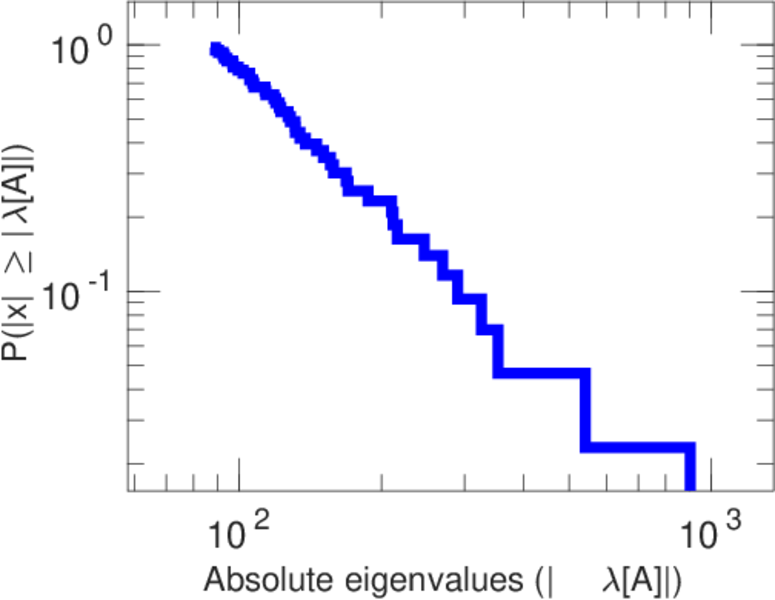
| Spectral norm | α = | 903.079
|
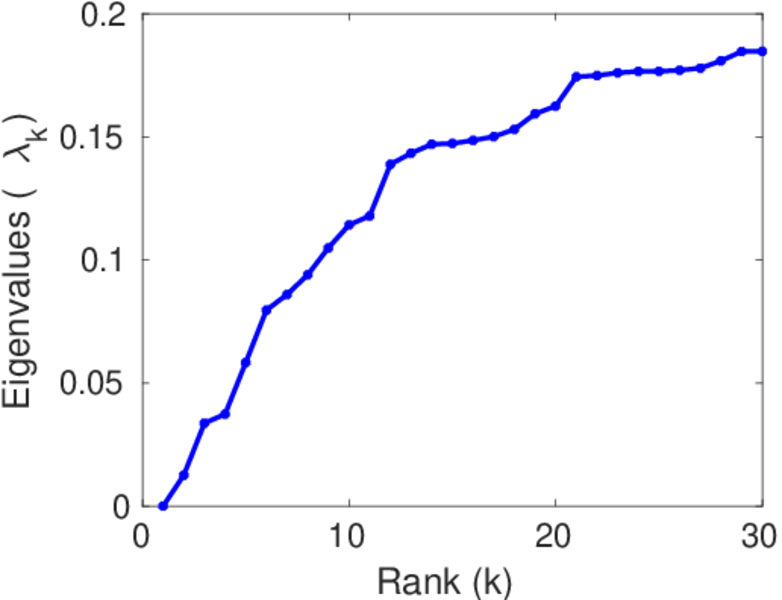
| Algebraic connectivity | a = | 0.012 513 0
|
| Spectral separation | |λ1[A] / λ2[A]| = | 1.668 95
|
| Controllability | C = | 47,702
|
| Relative controllability | Cr = | 0.896 856
|
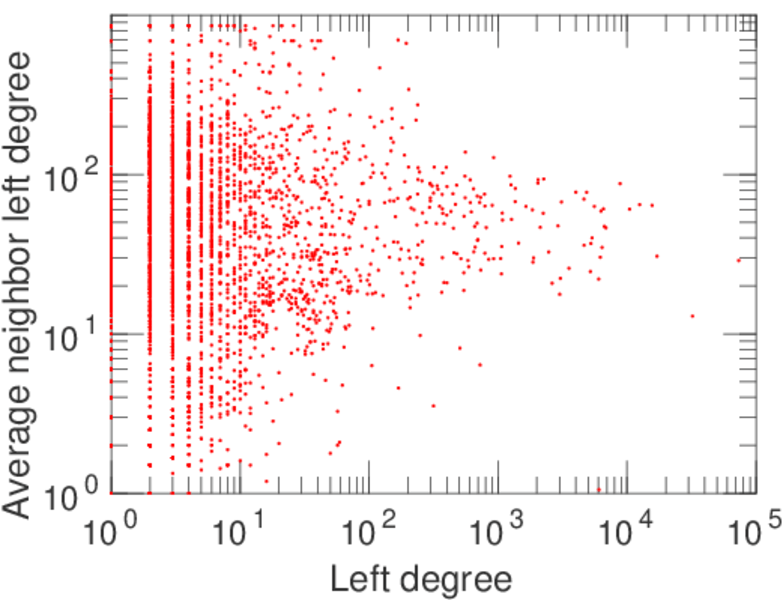
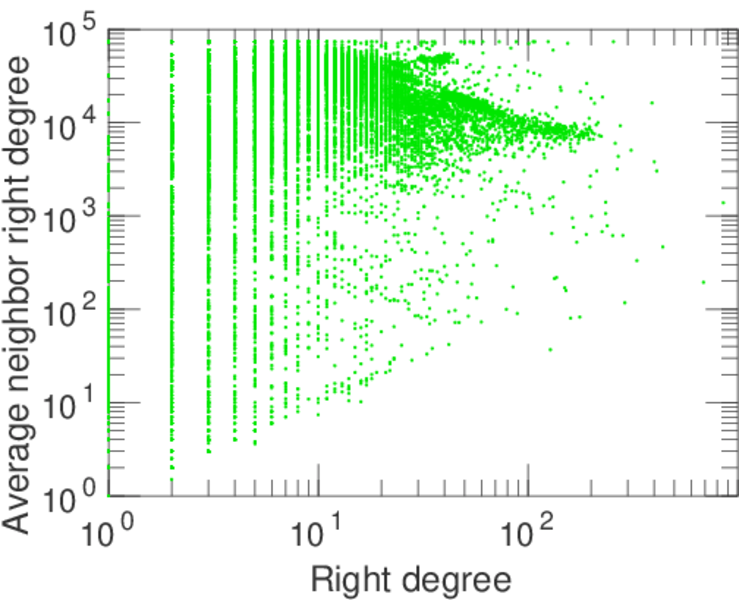
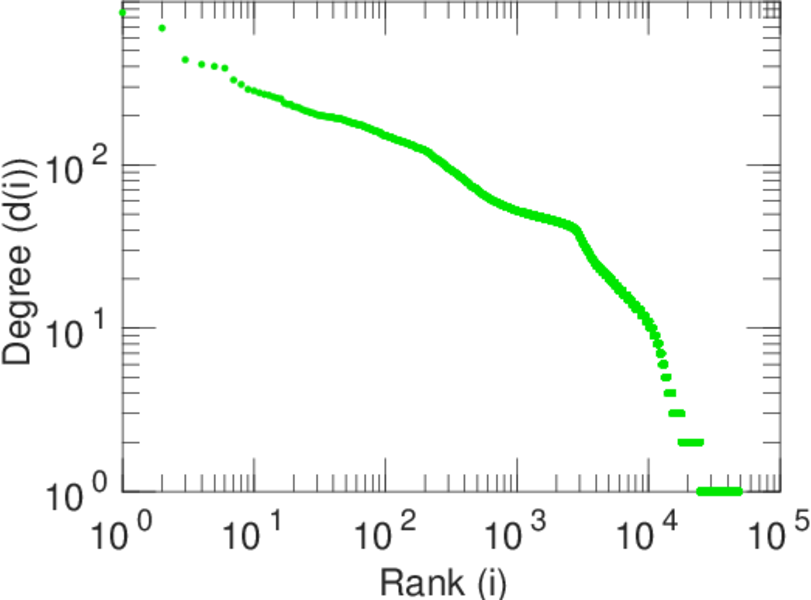
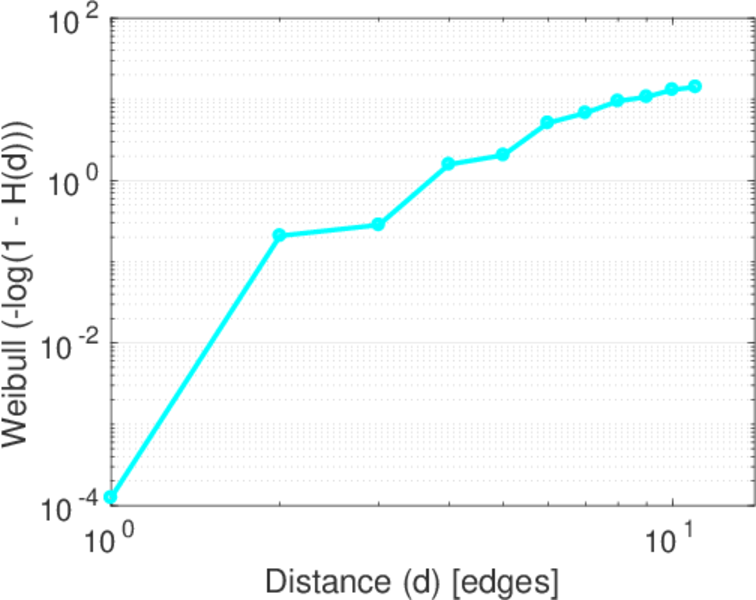
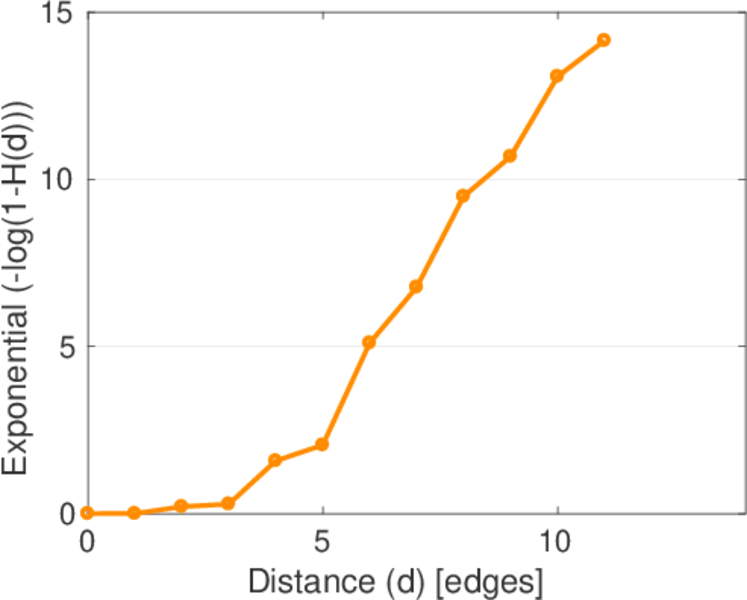
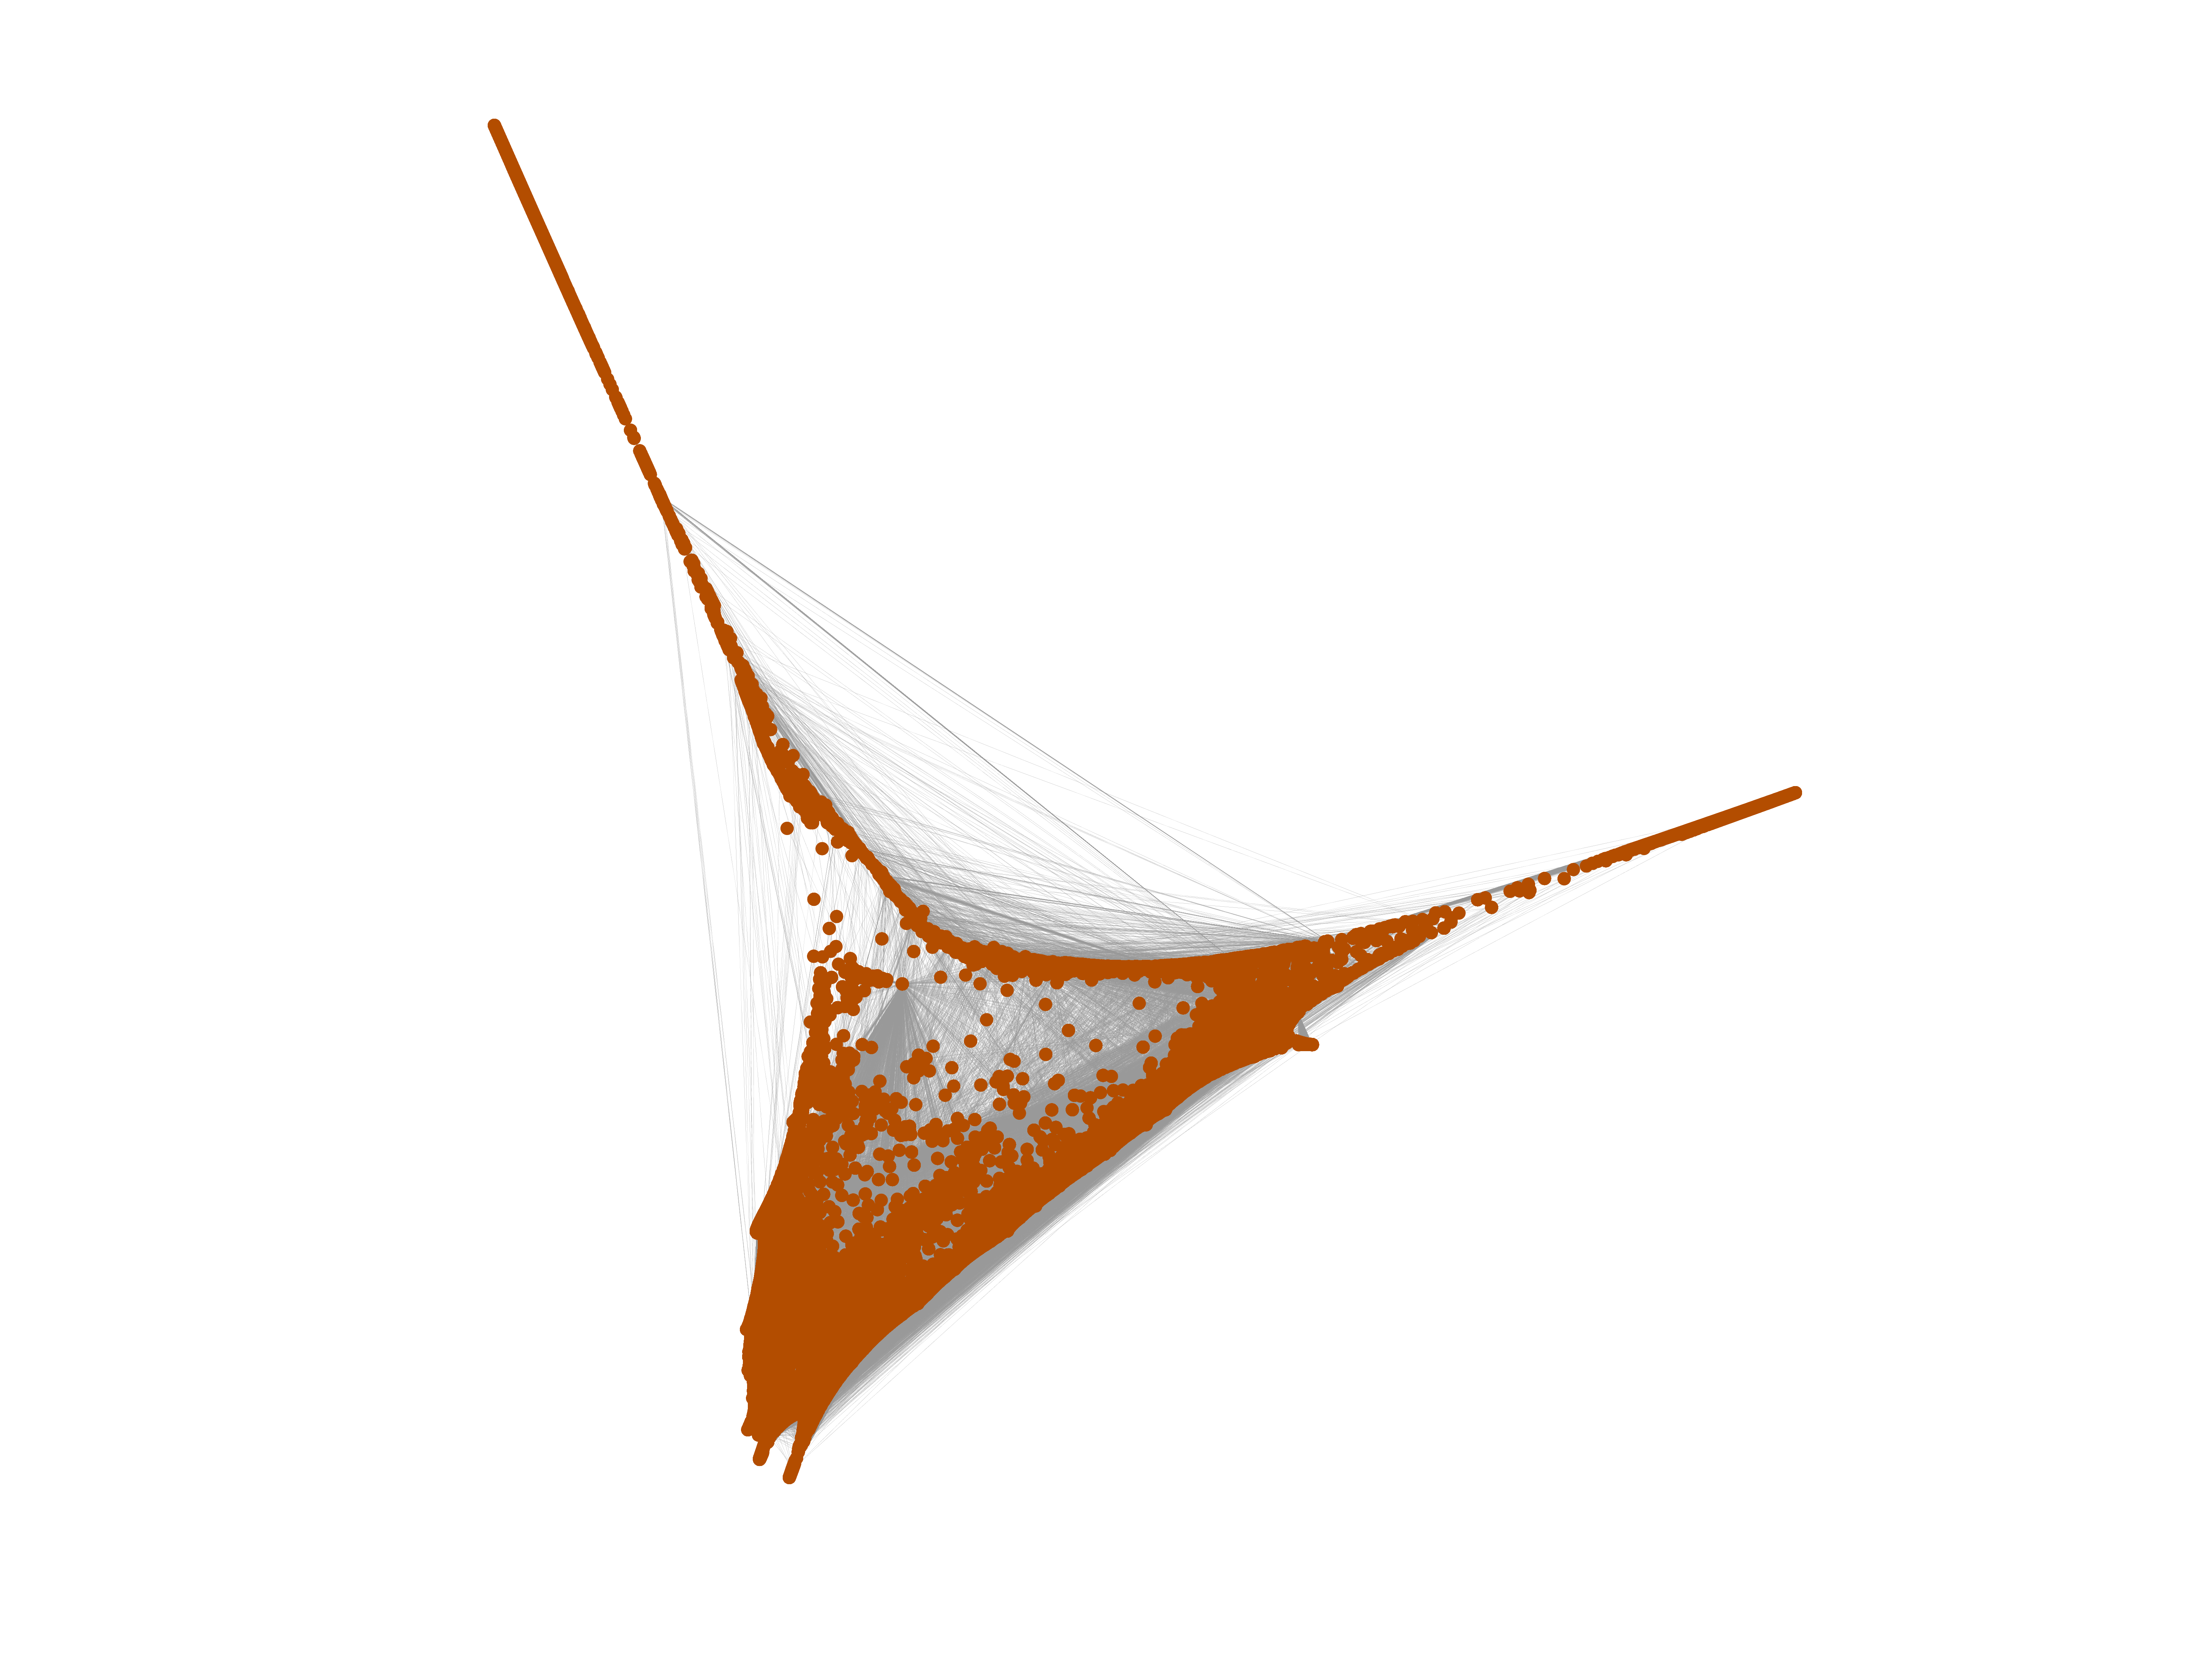
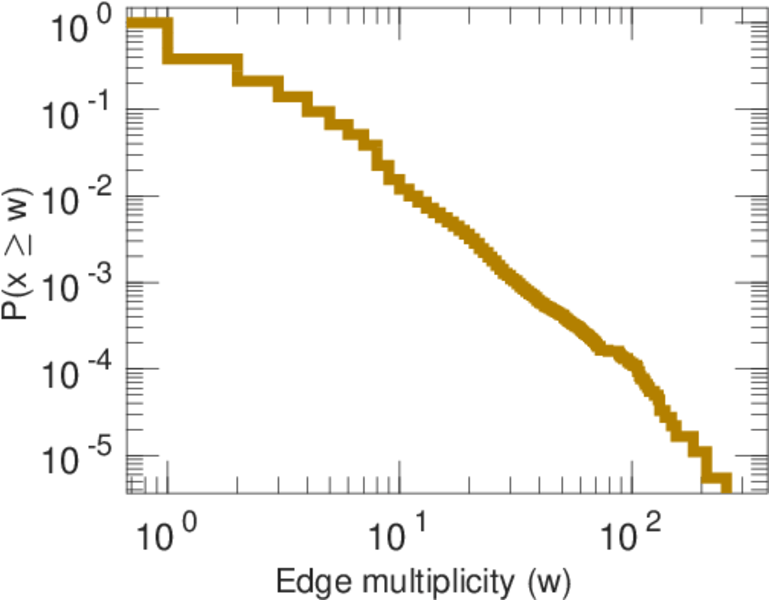
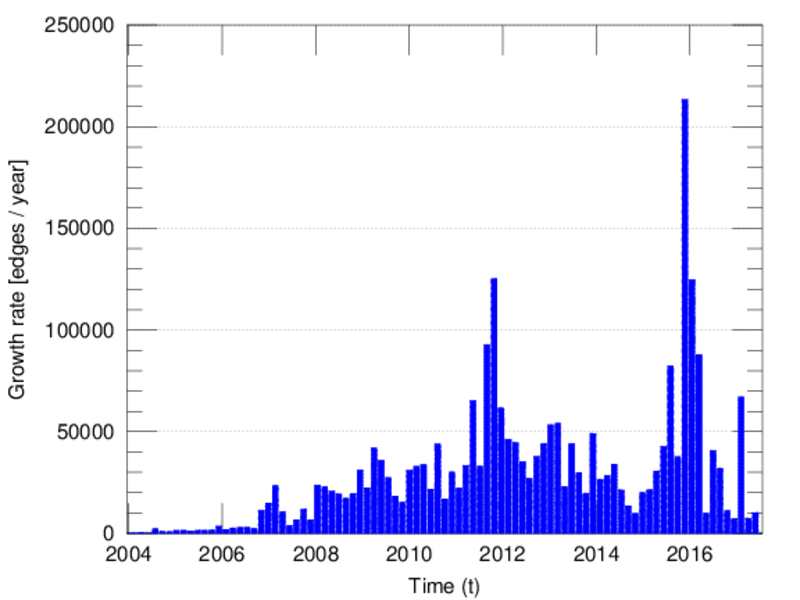
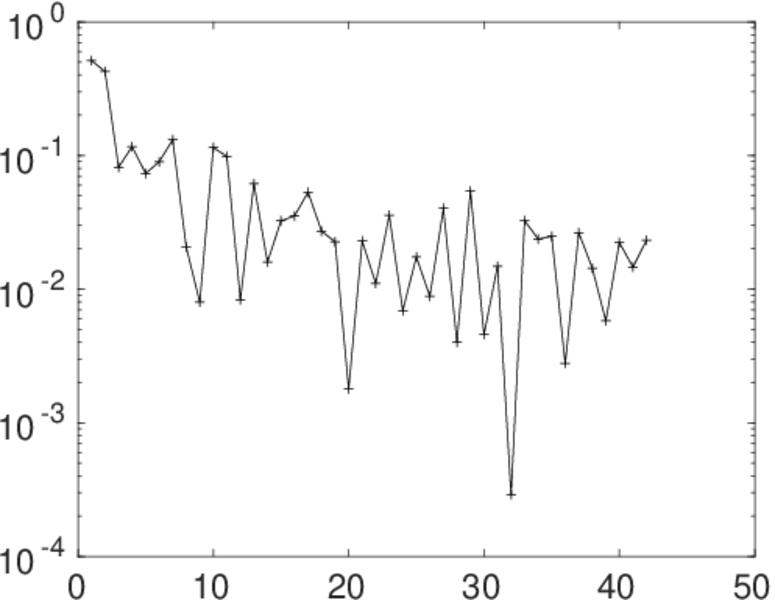
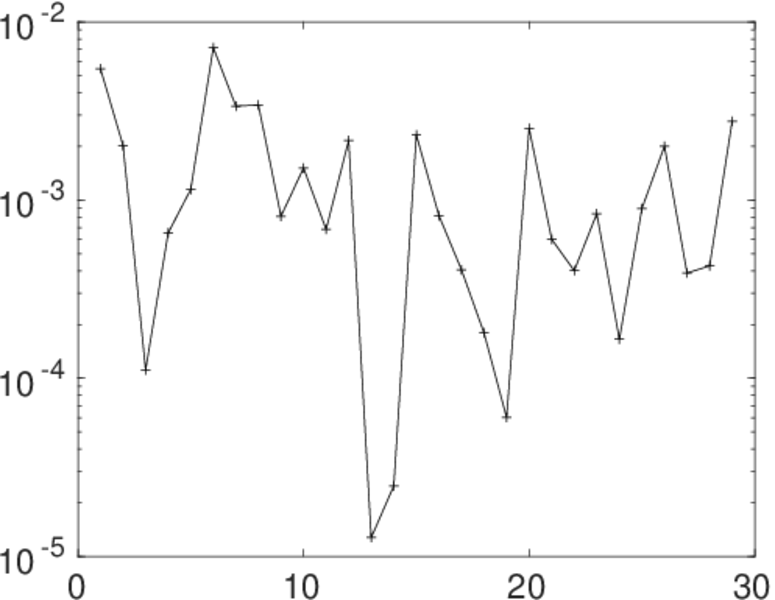
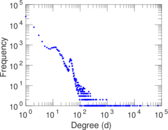
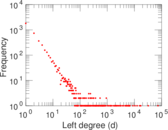
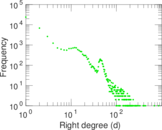
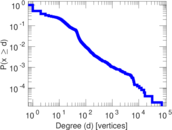
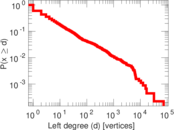
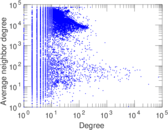
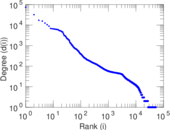
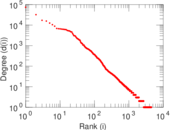
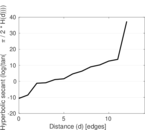
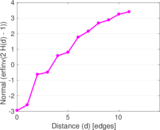
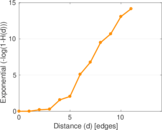
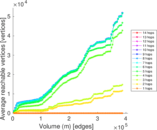
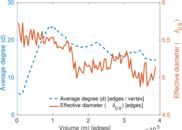
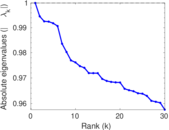
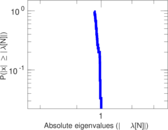
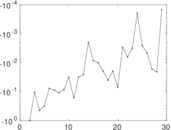
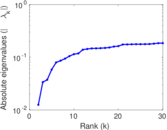
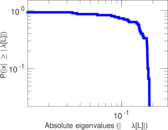
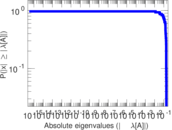
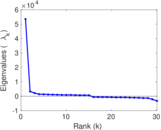
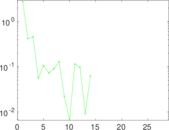
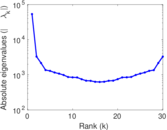
Plots

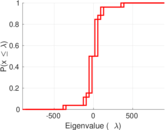
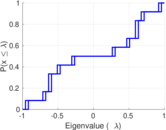
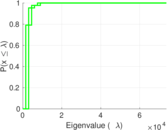
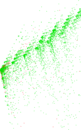


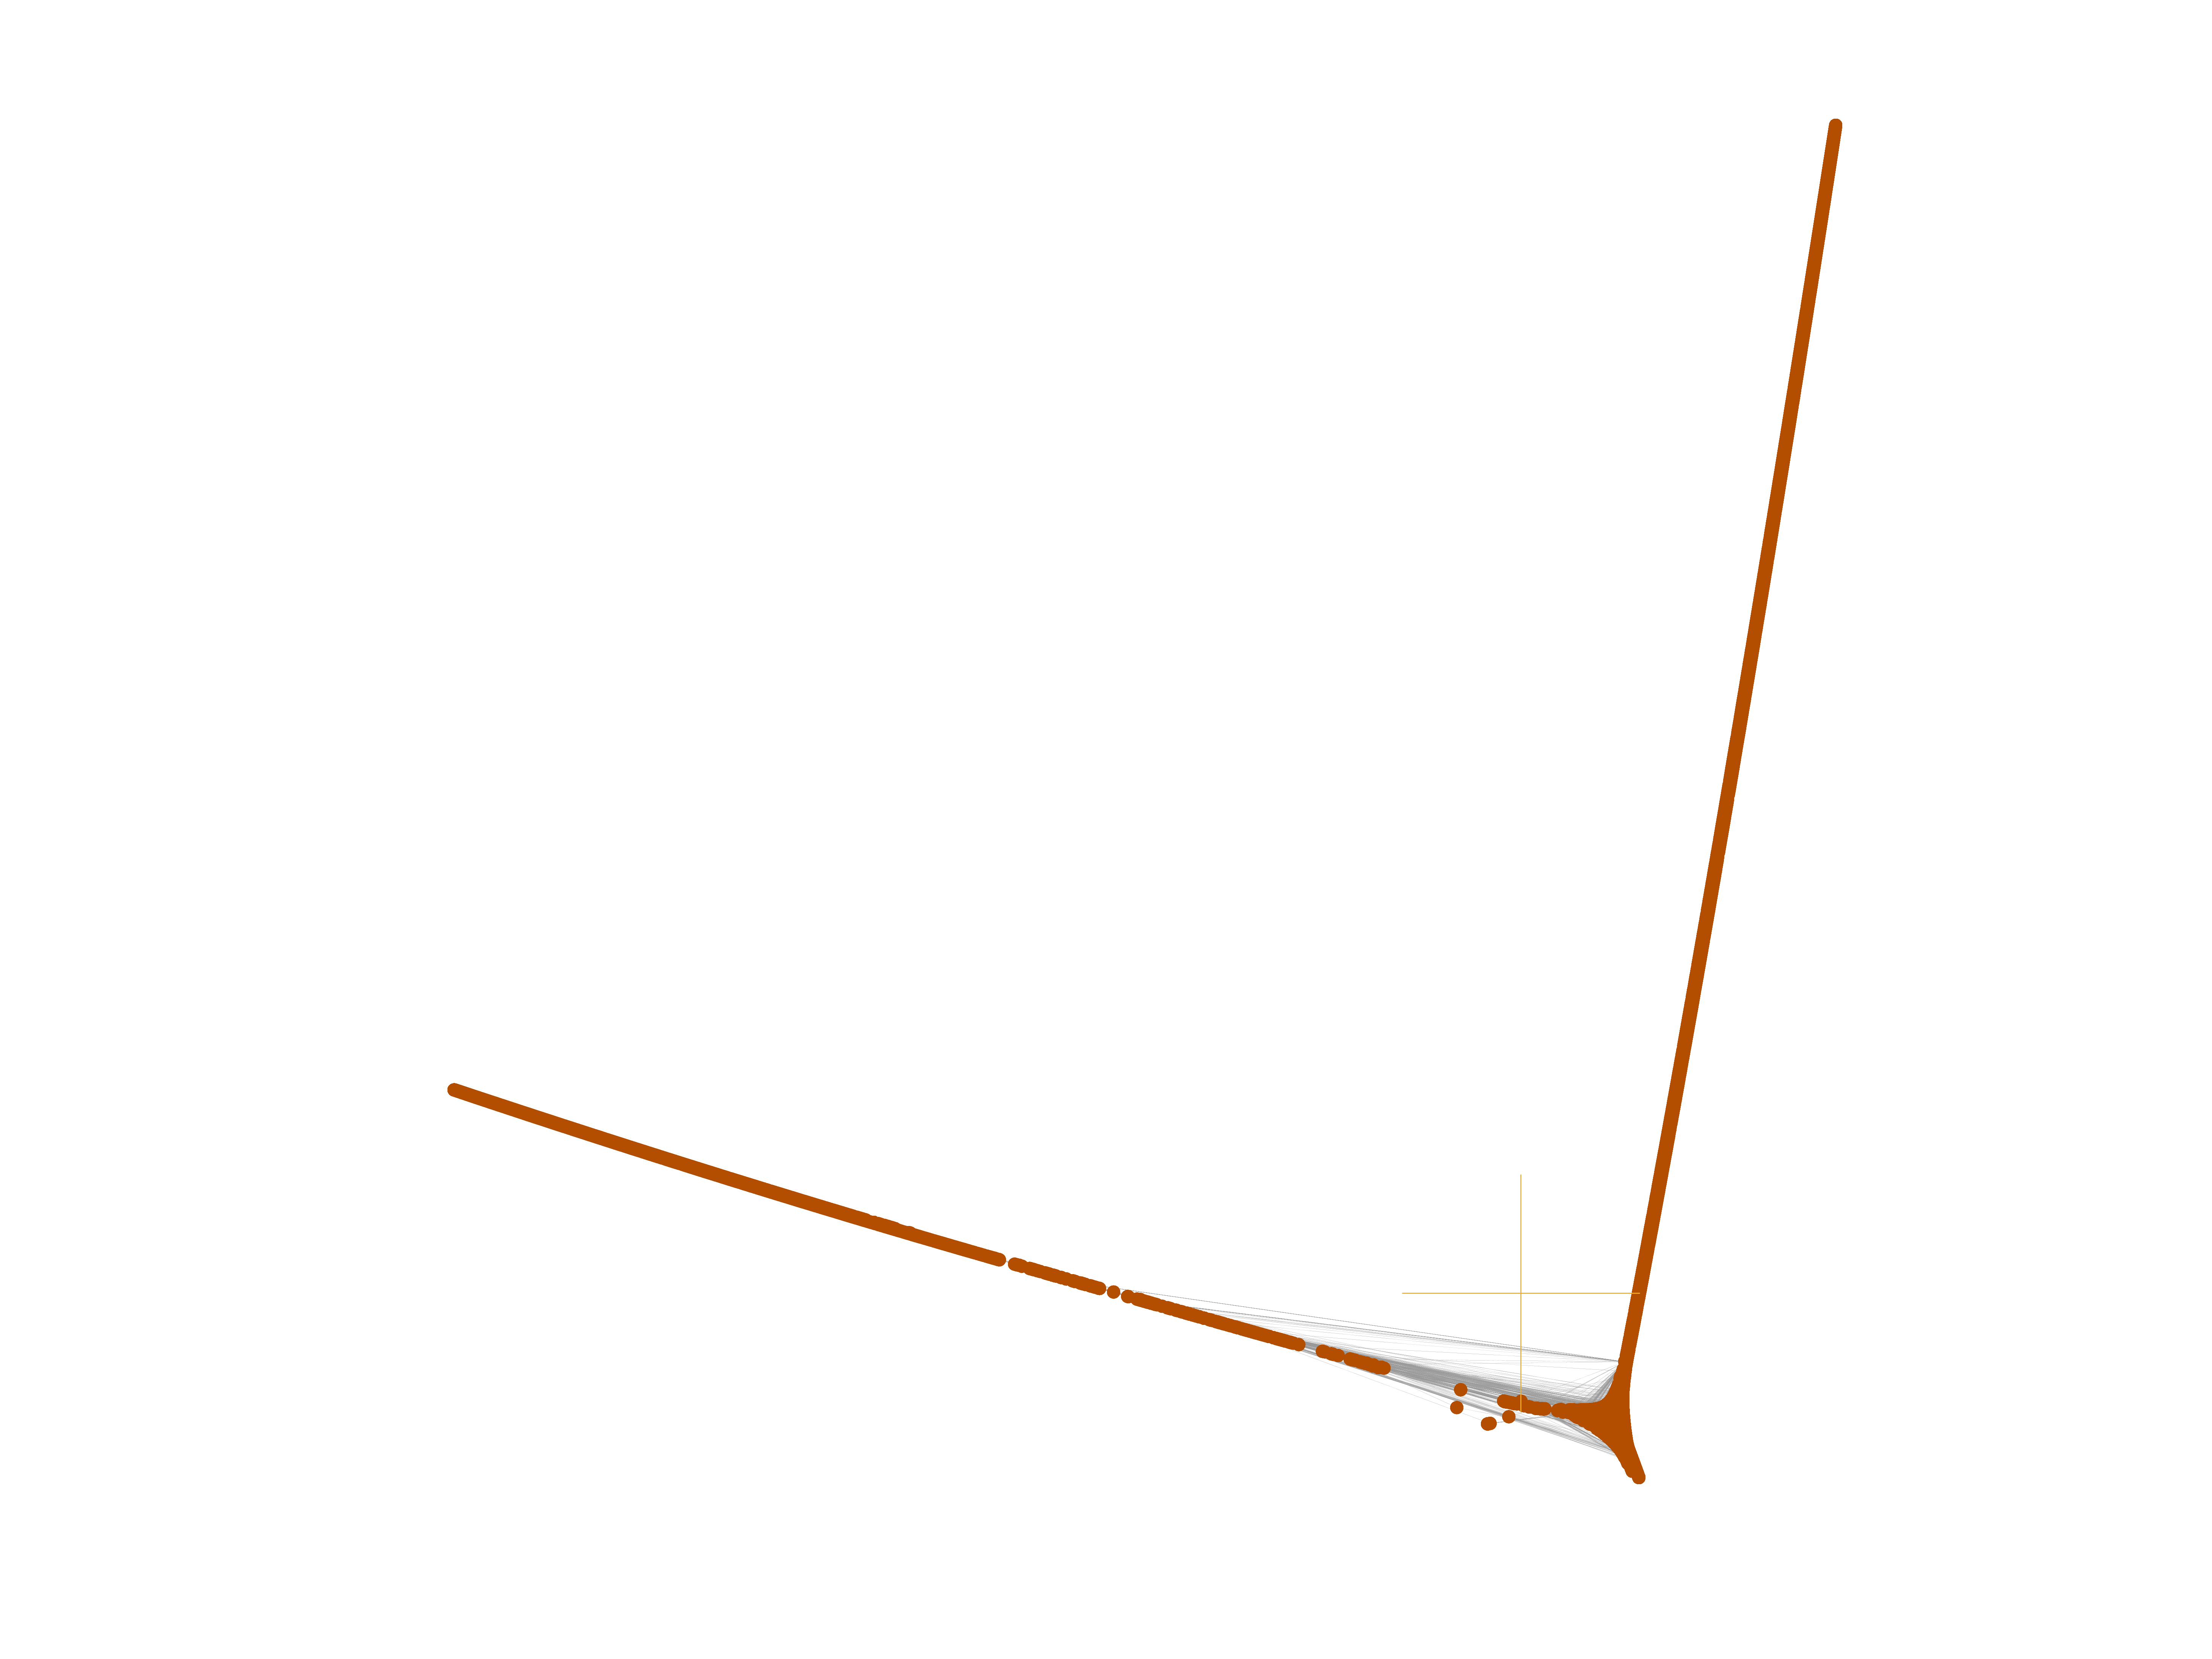
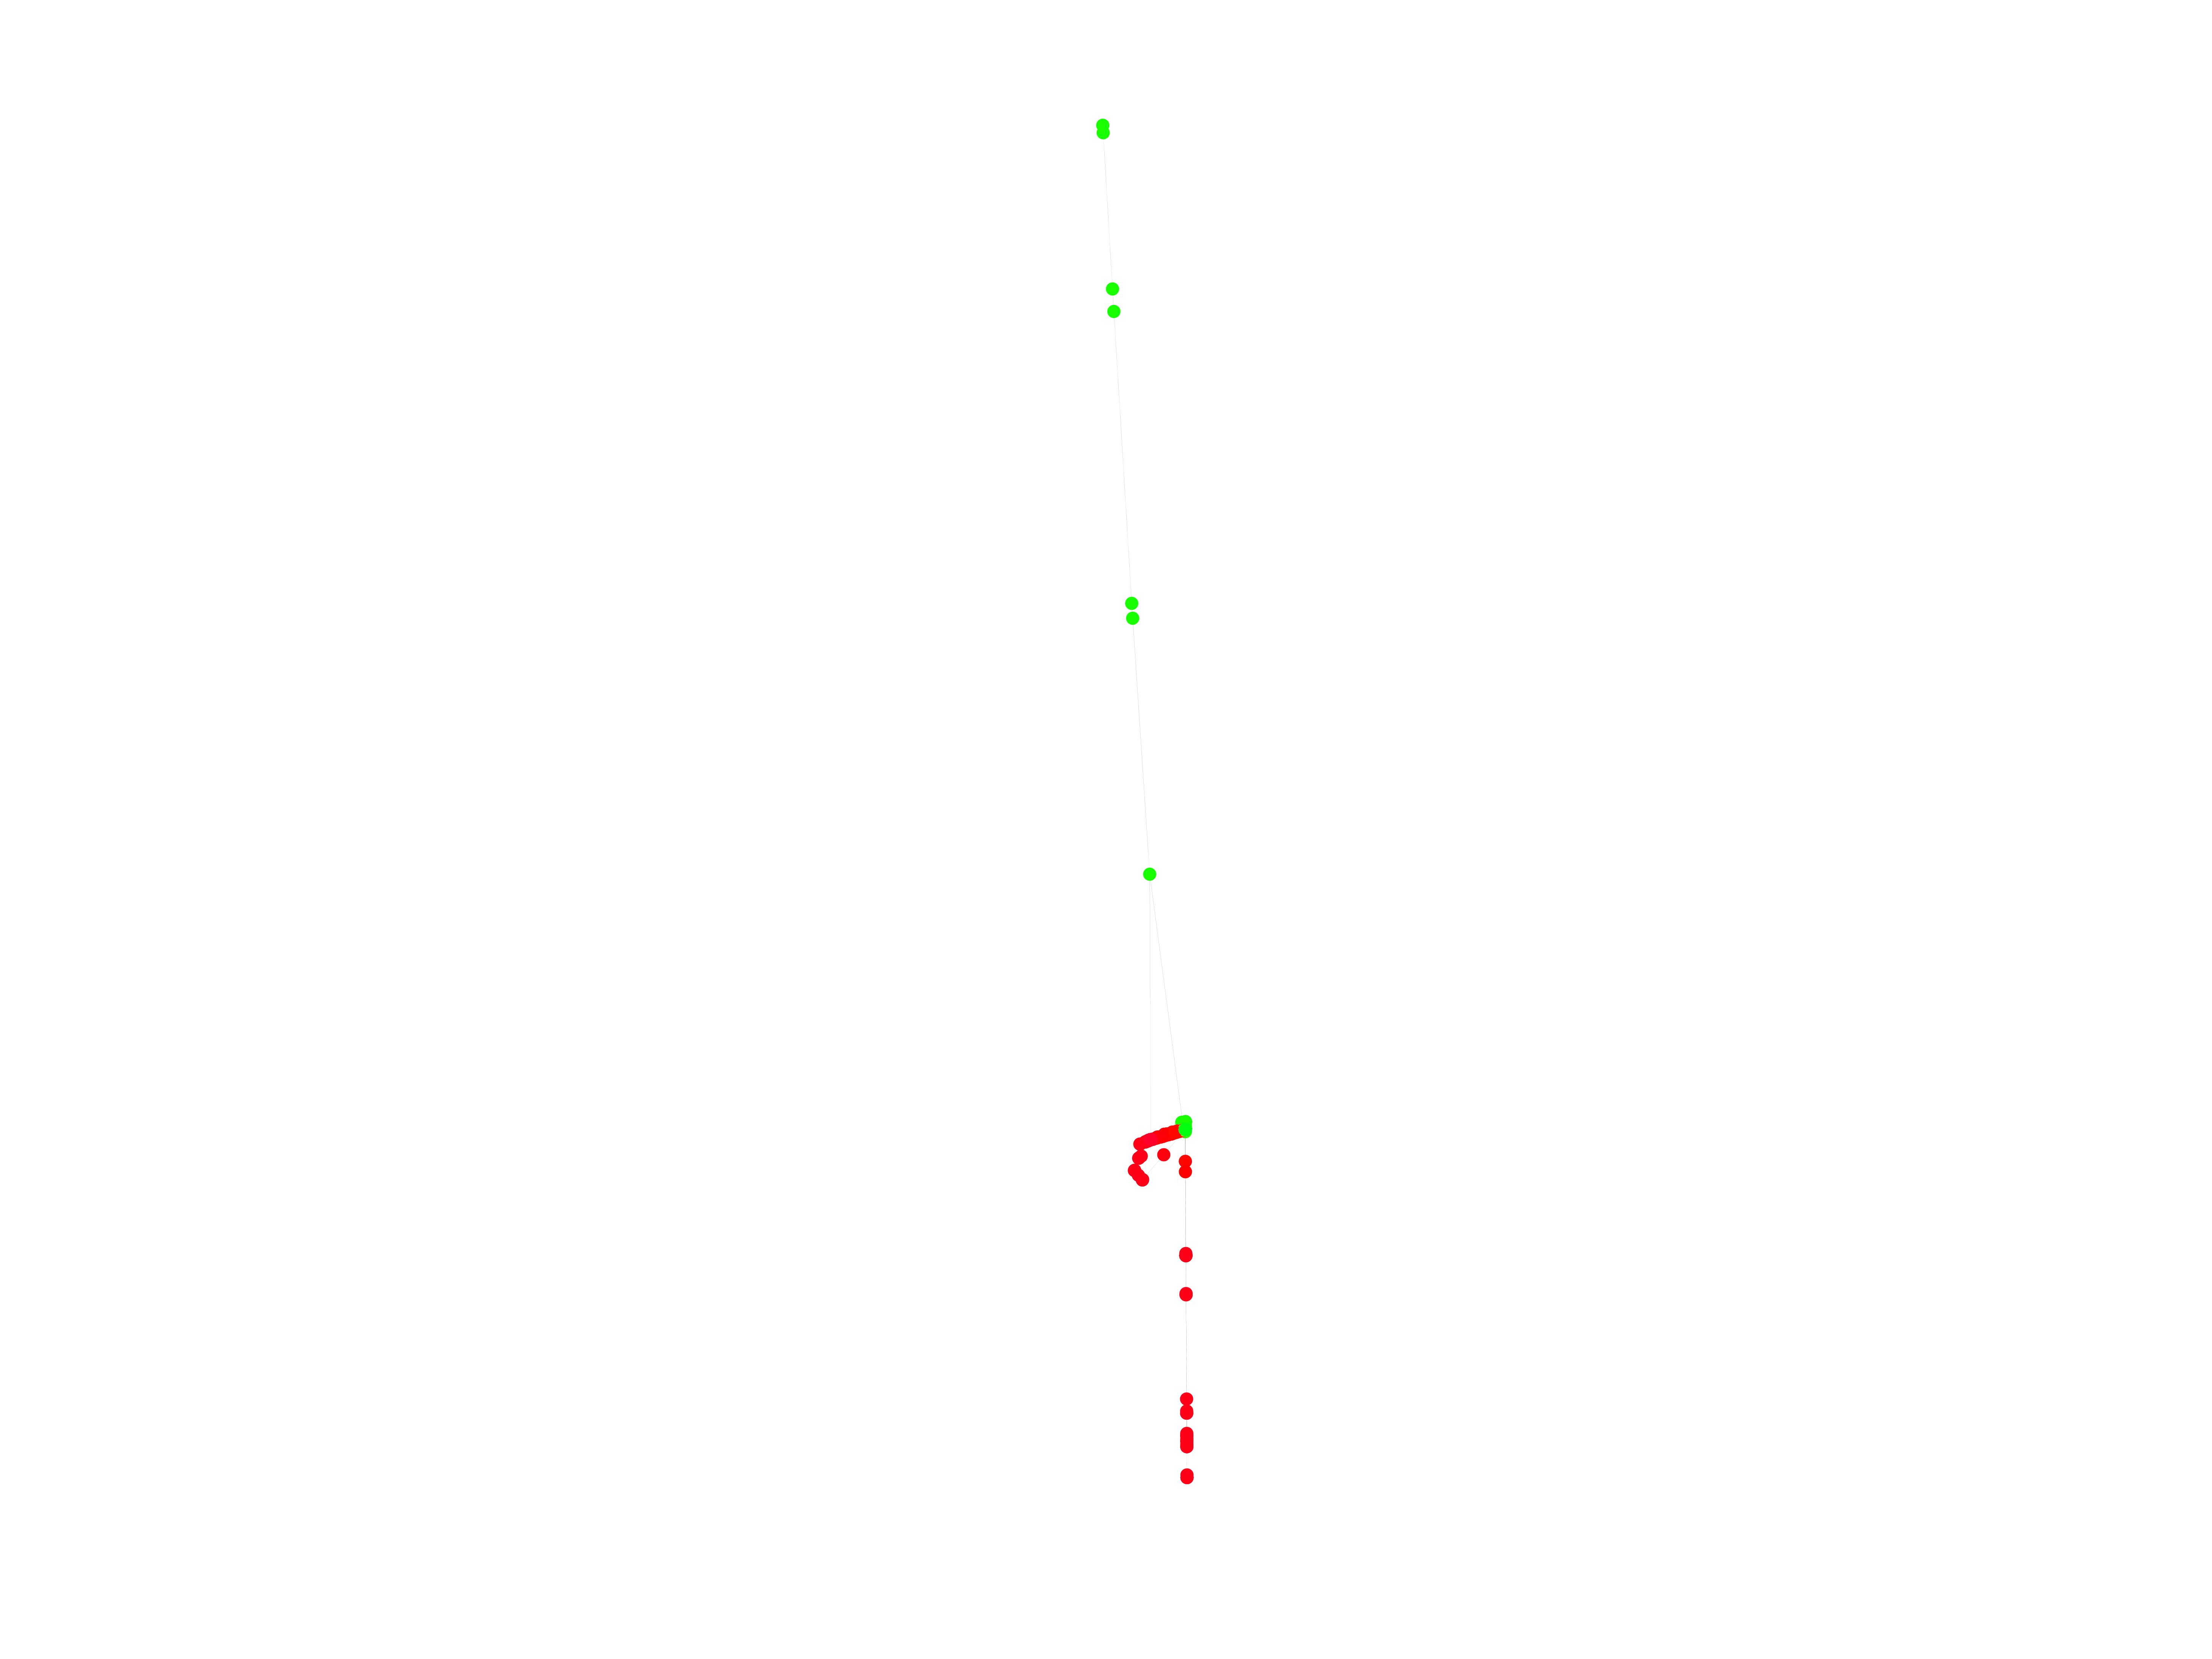
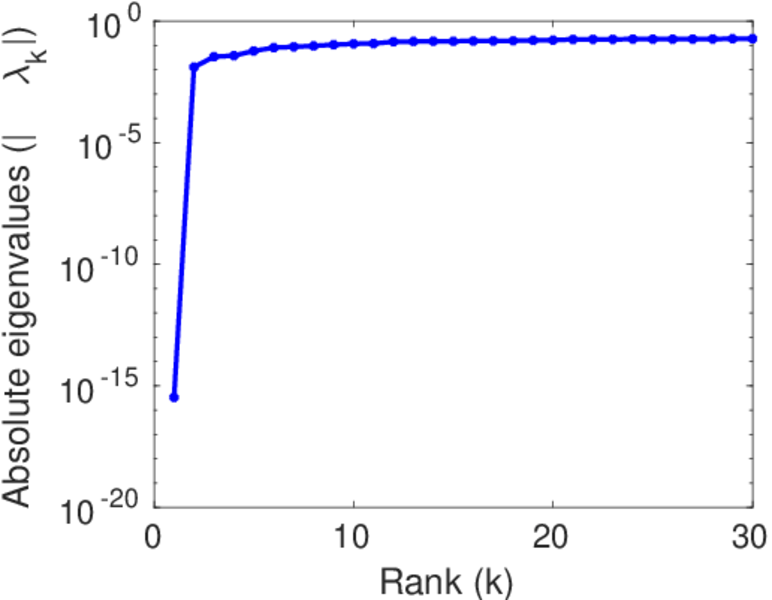
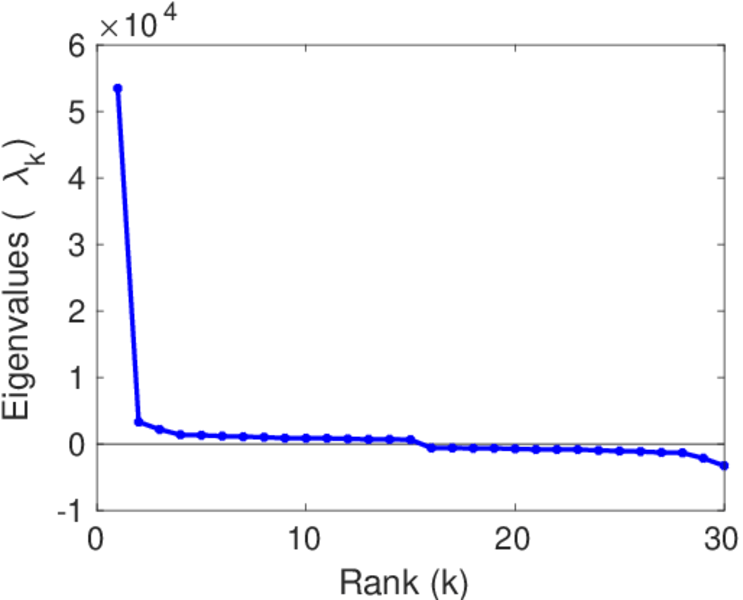
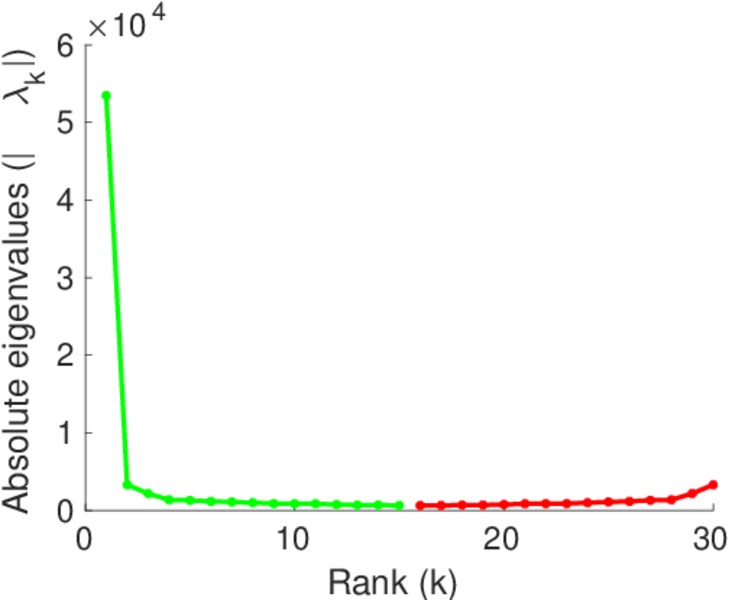
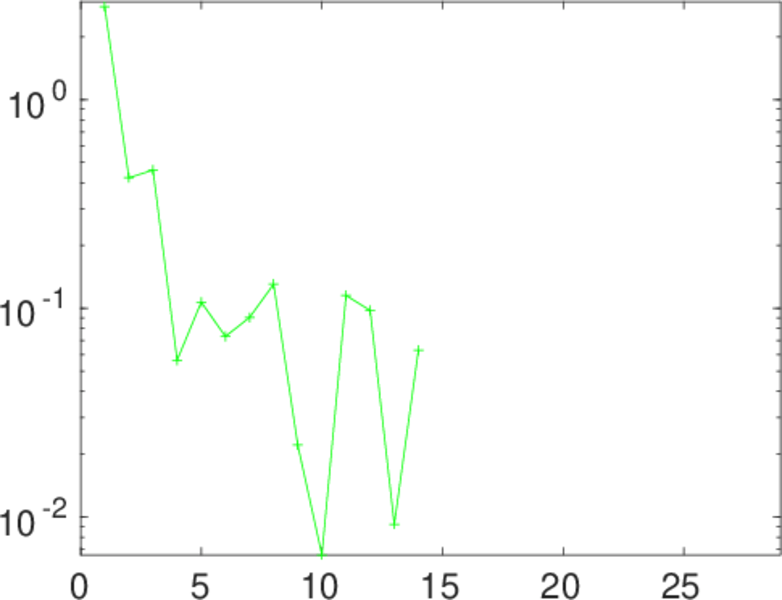
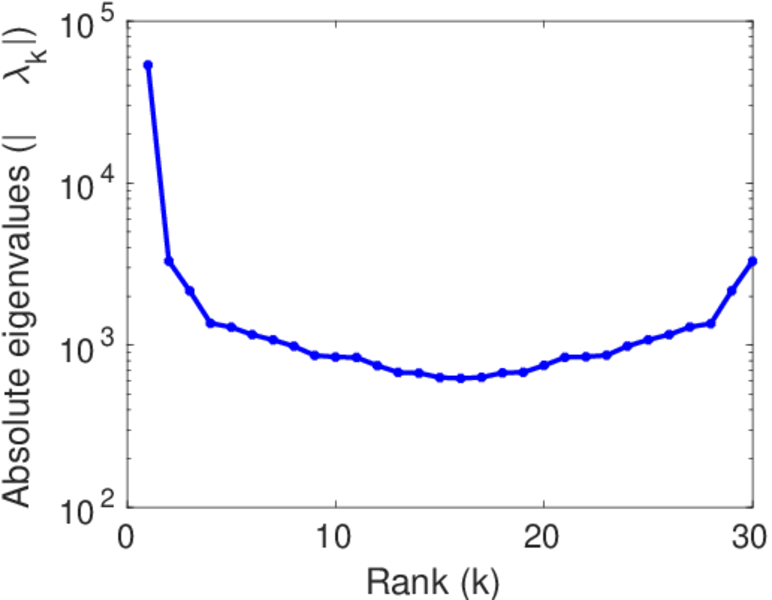
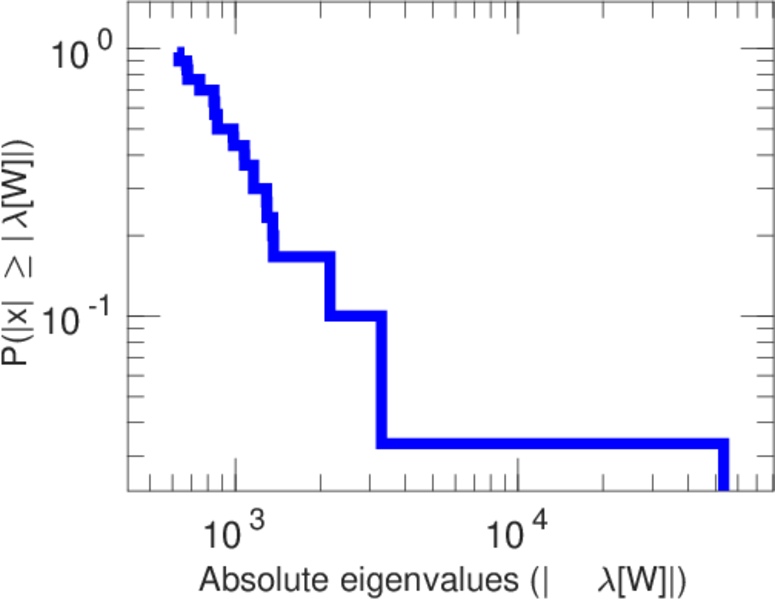
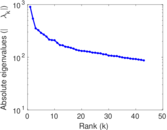
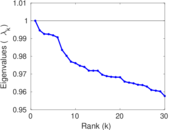
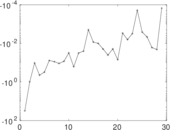
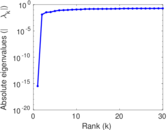
Matrix decompositions plots


Downloads
References
|
[1]
|
Jérôme Kunegis.
KONECT – The Koblenz Network Collection.
In Proc. Int. Conf. on World Wide Web Companion, pages
1343–1350, 2013.
[ http ]
|
|
[2]
|
Wikimedia Foundation.
Wikimedia downloads.
http://dumps.wikimedia.org/, January 2010.
|
 KONECT ‣ Networks ‣
Buy Me a Coffee
KONECT ‣ Networks ‣
Buy Me a Coffee