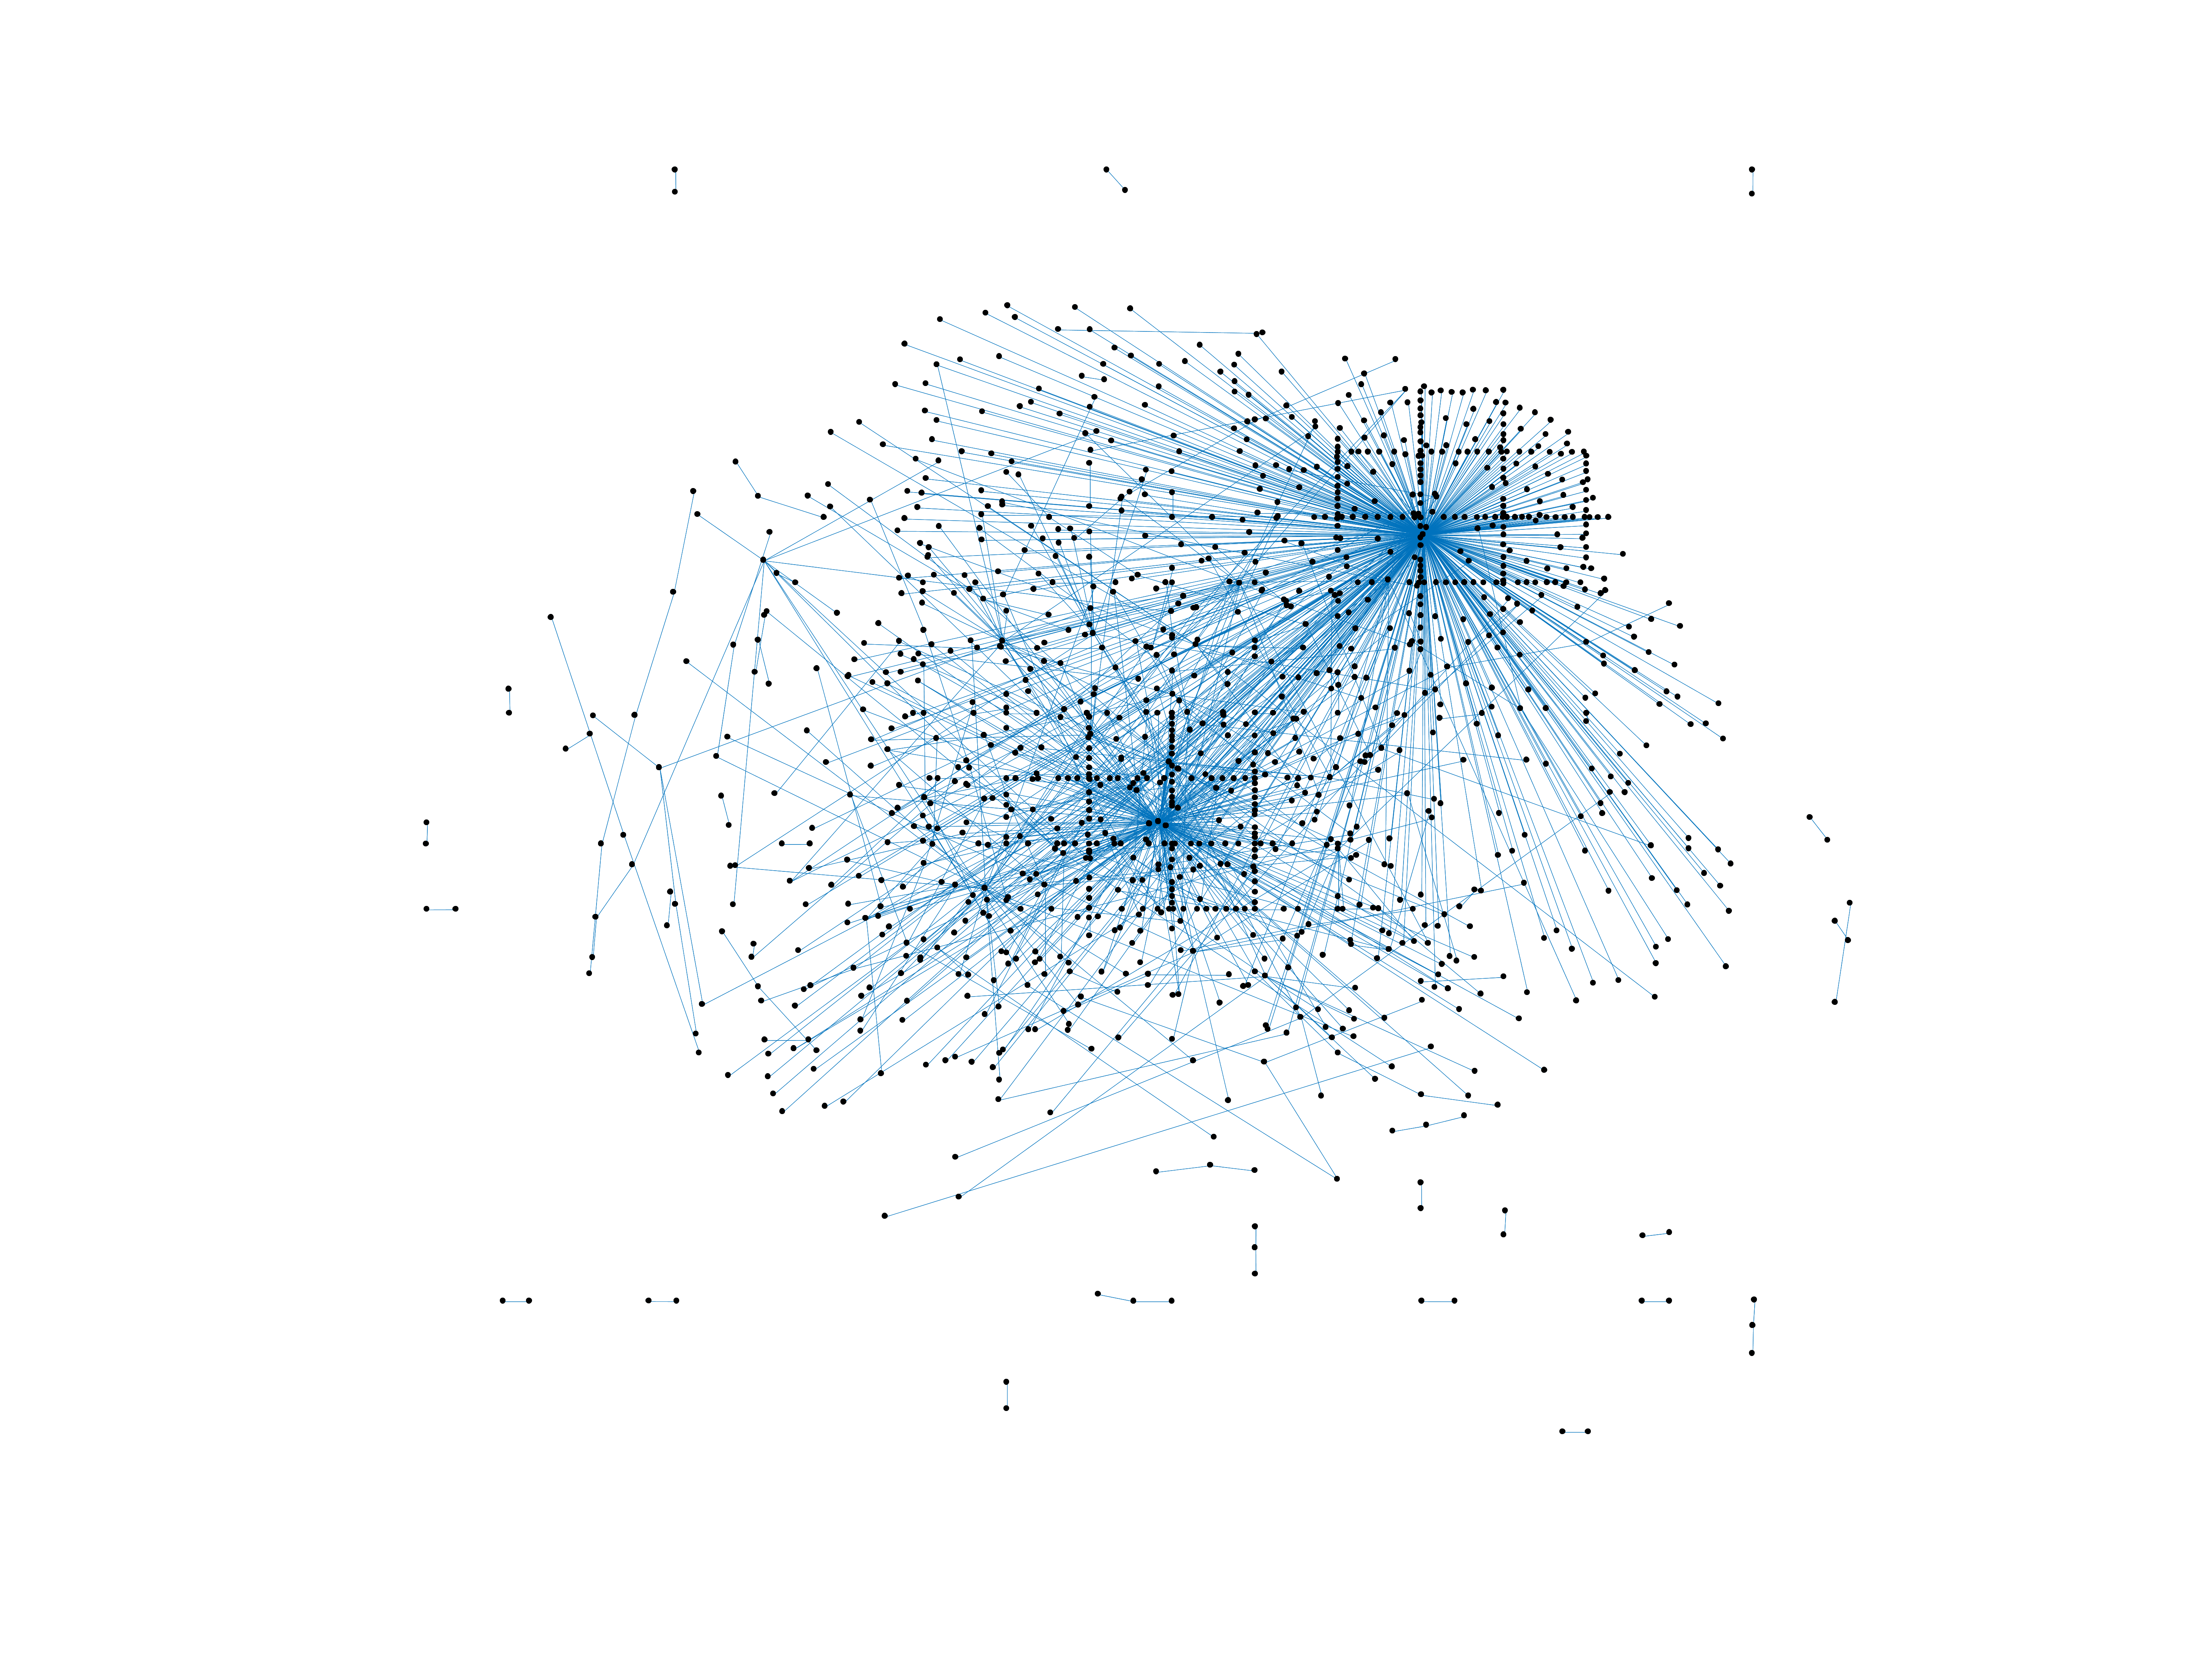
Wikibooks edits (sa)
This is the bipartite edit network of the Sanskrit Wikibooks. It contains users
and pages from the Sanskrit Wikibooks, connected by edit events. Each edge
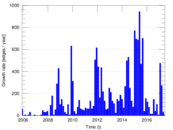
represents an edit. The dataset includes the timestamp of each edit.
Metadata
Statistics
| Size | n = | 1,493
|
| Left size | n1 = | 165
|
| Right size | n2 = | 1,328
|
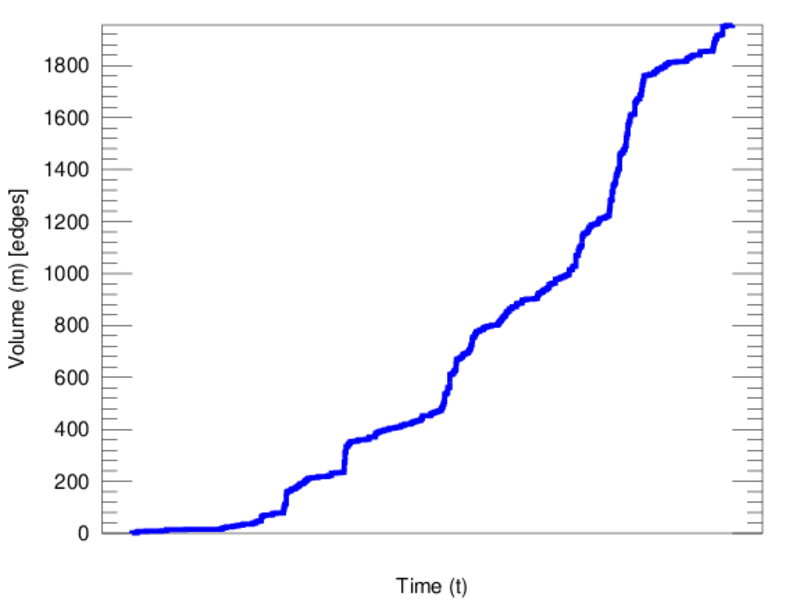
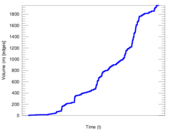
| Volume | m = | 1,956
|
| Unique edge count | m̿ = | 1,223
|
| Wedge count | s = | 153,628
|
| Claw count | z = | 24,299,566
|
| Cross count | x = | 3,055,754,961
|
| Square count | q = | 327
|
| 4-Tour count | T4 = | 620,474
|
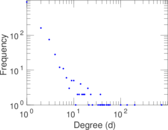
| Maximum degree | dmax = | 742
|
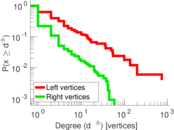
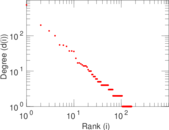
| Maximum left degree | d1max = | 742
|
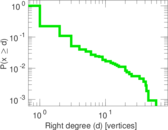
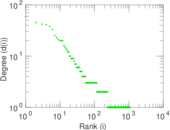
| Maximum right degree | d2max = | 59
|
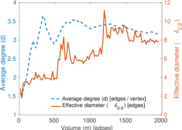
| Average degree | d = | 2.620 23
|
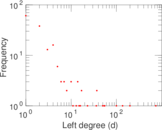
| Average left degree | d1 = | 11.854 5
|
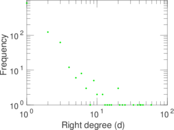
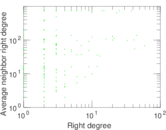
| Average right degree | d2 = | 1.472 89
|
| Fill | p = | 0.005 581 42
|
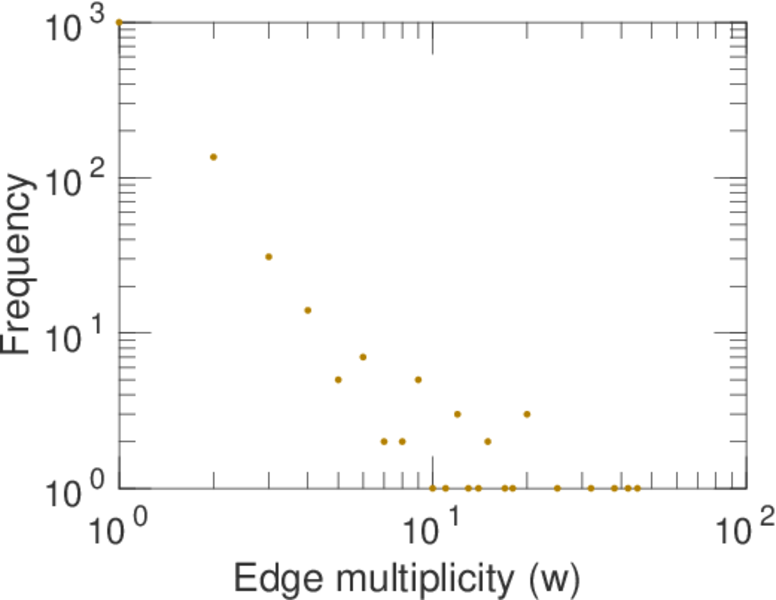
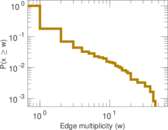
| Average edge multiplicity | m̃ = | 1.599 35
|
| Size of LCC | N = | 957
|
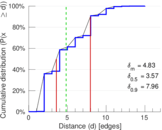
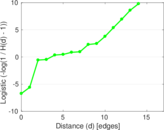
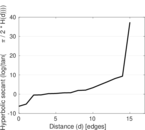
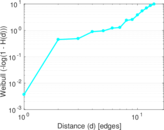
| Diameter | δ = | 15
|
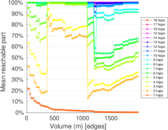
| 50-Percentile effective diameter | δ0.5 = | 3.572 61
|
| 90-Percentile effective diameter | δ0.9 = | 7.957 33
|
| Median distance | δM = | 4
|
| Mean distance | δm = | 4.826 69
|
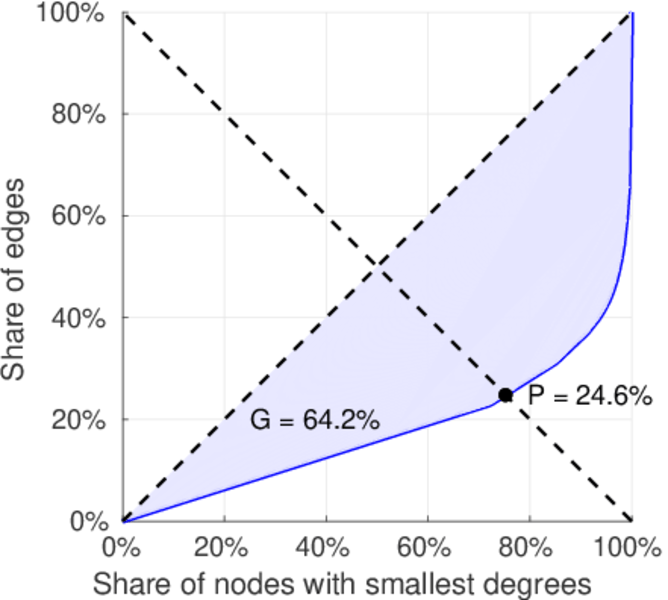
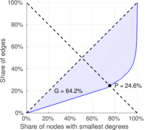
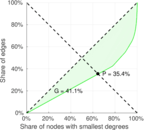
| Gini coefficient | G = | 0.649 525
|
| Balanced inequality ratio | P = | 0.243 865
|
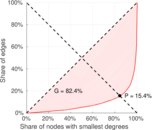
| Left balanced inequality ratio | P1 = | 0.154 397
|
| Right balanced inequality ratio | P2 = | 0.354 294
|
| Relative edge distribution entropy | Her = | 0.788 597
|
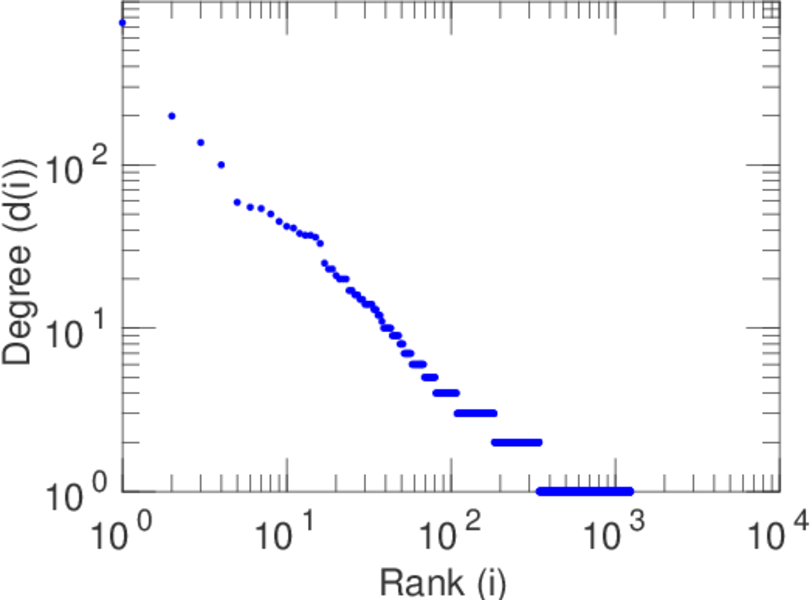
| Power law exponent | γ = | 6.945 85
|
| Tail power law exponent | γt = | 2.981 00
|
| Tail power law exponent with p | γ3 = | 2.981 00
|
| p-value | p = | 0.001 000 00
|
| Left tail power law exponent with p | γ3,1 = | 2.071 00
|
| Left p-value | p1 = | 0.462 000
|
| Right tail power law exponent with p | γ3,2 = | 3.781 00
|
| Right p-value | p2 = | 0.248 000
|
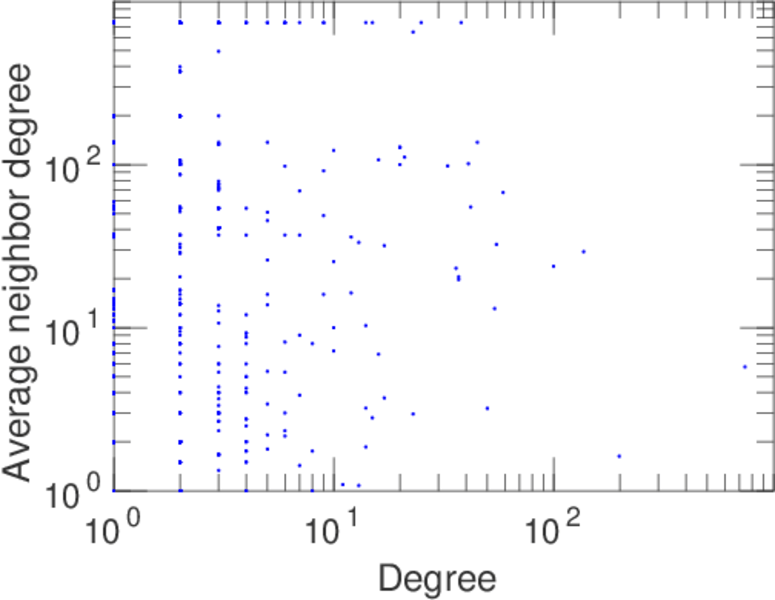
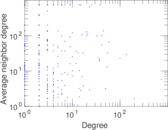
| Degree assortativity | ρ = | −0.237 089
|
| Degree assortativity p-value | pρ = | 4.353 94 × 10−17
|
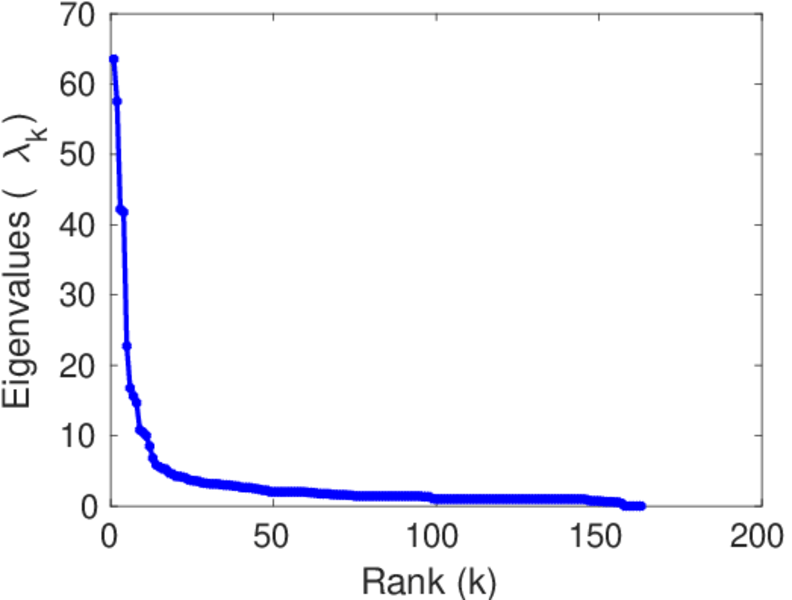
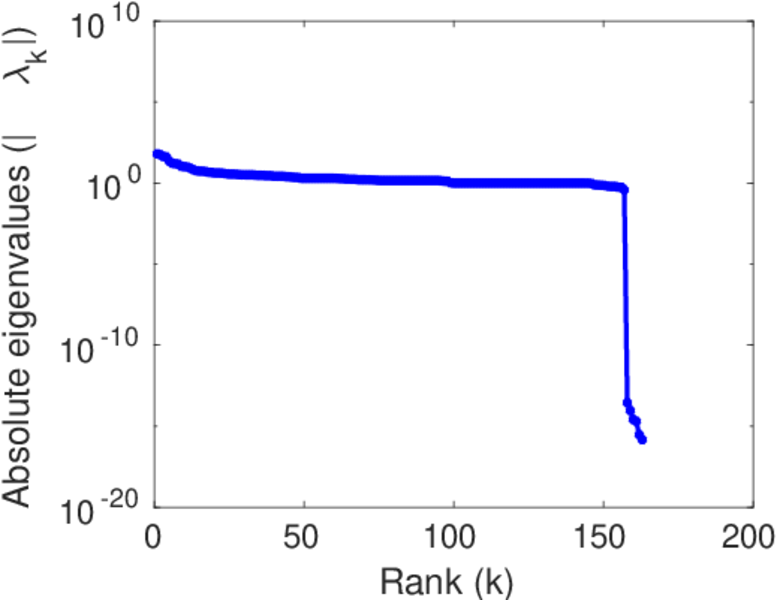
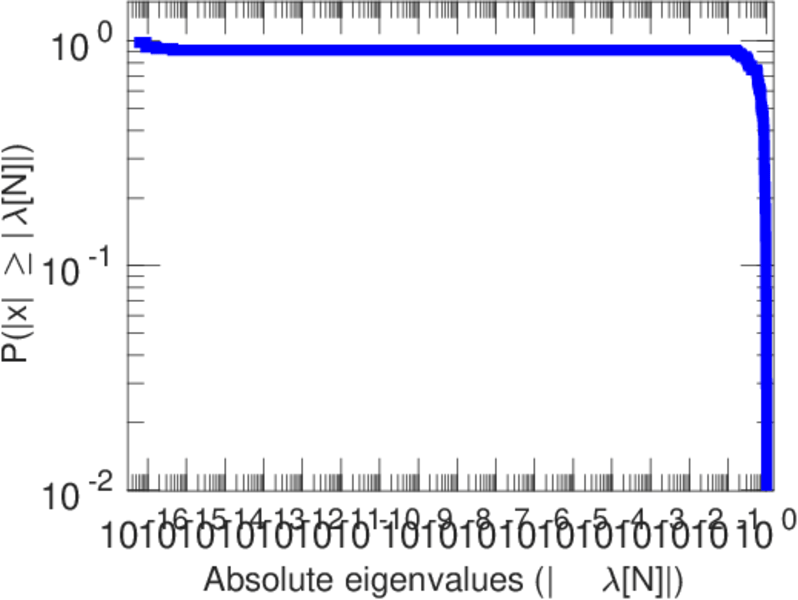
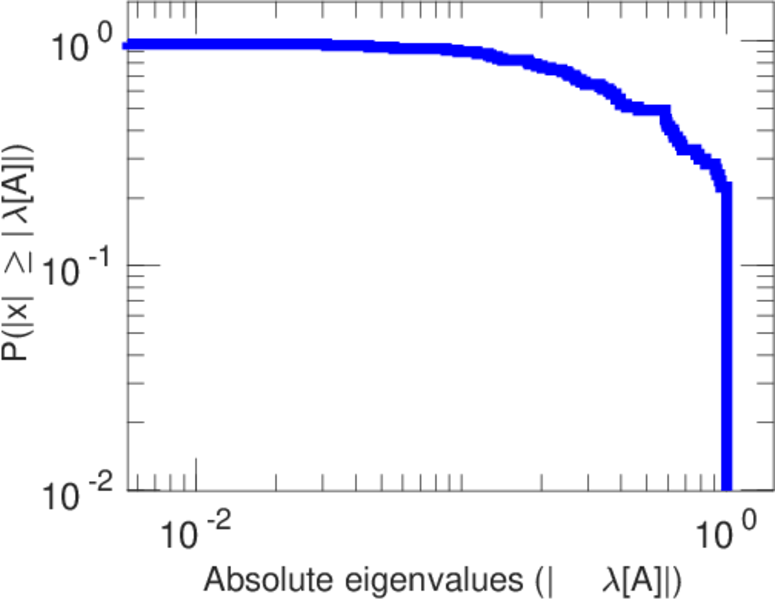
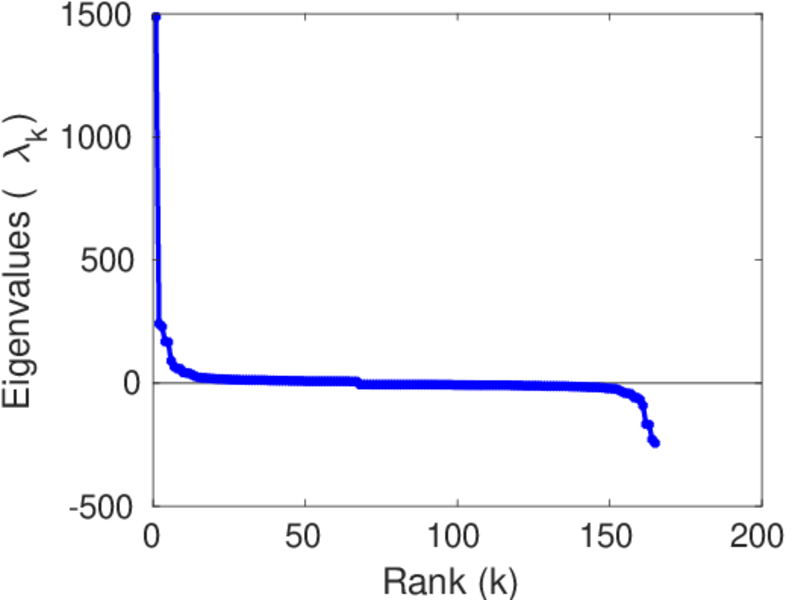
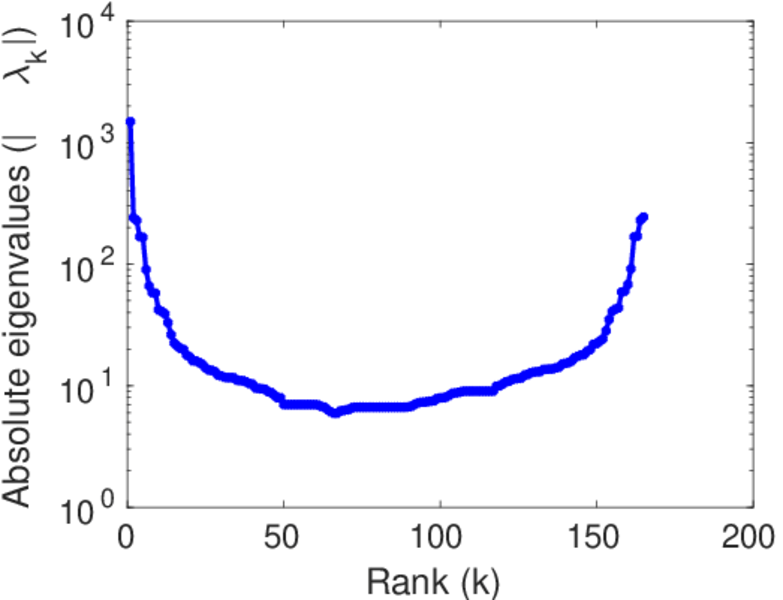
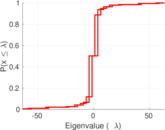
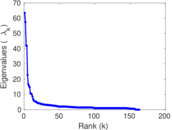
| Spectral norm | α = | 63.520 4
|
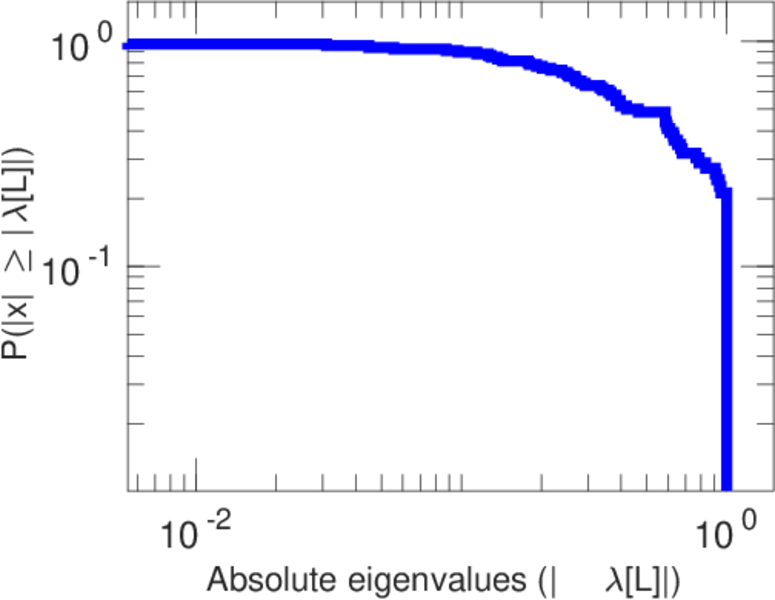
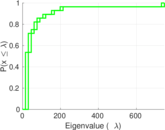
| Algebraic connectivity | a = | 0.005 510 41
|
| Spectral separation | |λ1[A] / λ2[A]| = | 1.103 81
|
| Controllability | C = | 927
|
| Relative controllability | Cr = | 0.747 581
|
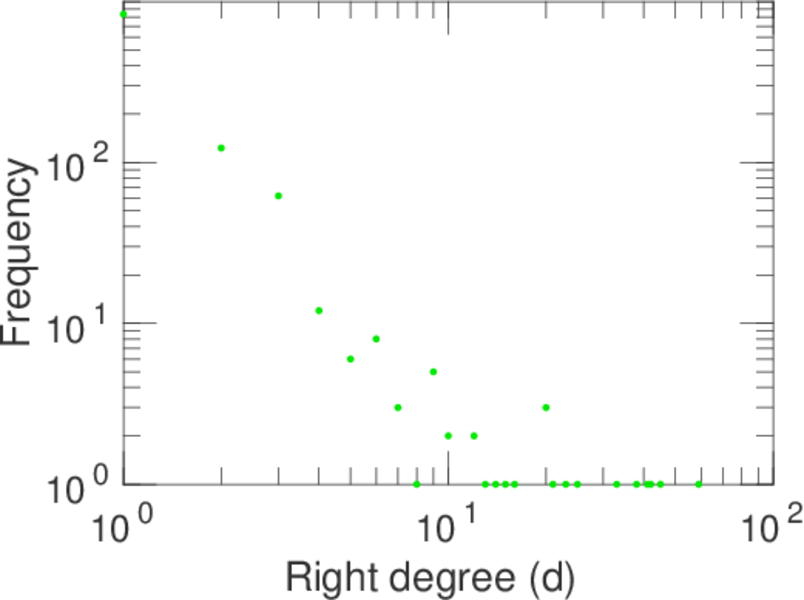
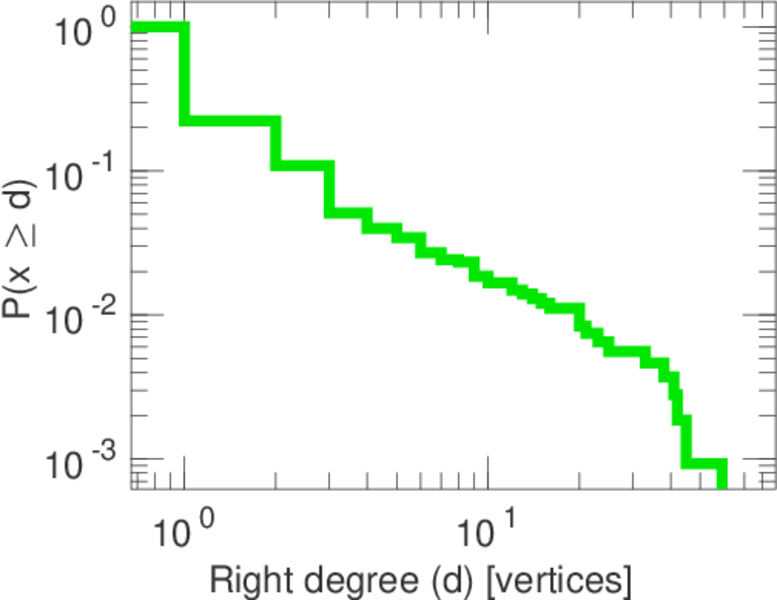
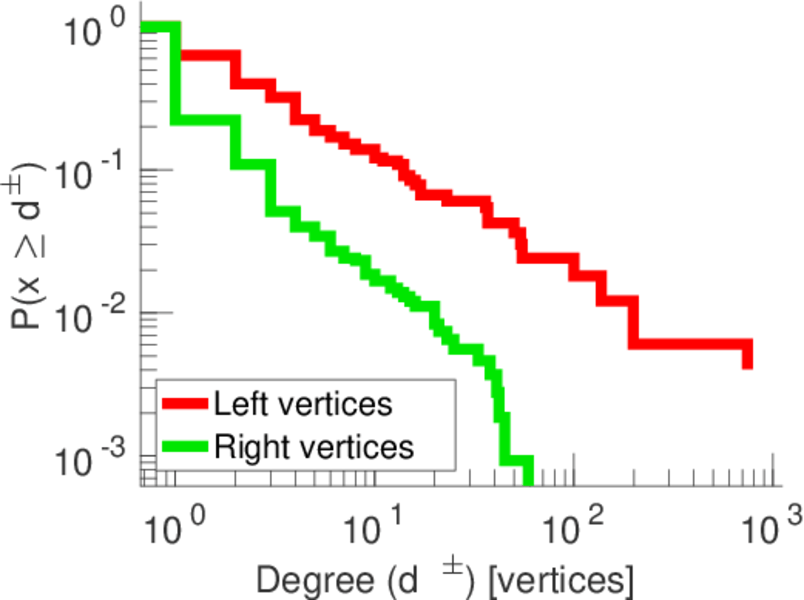
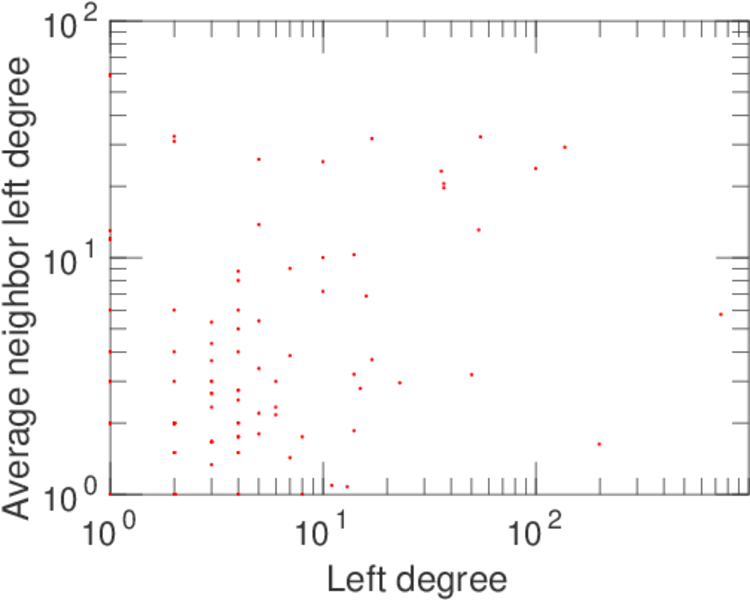
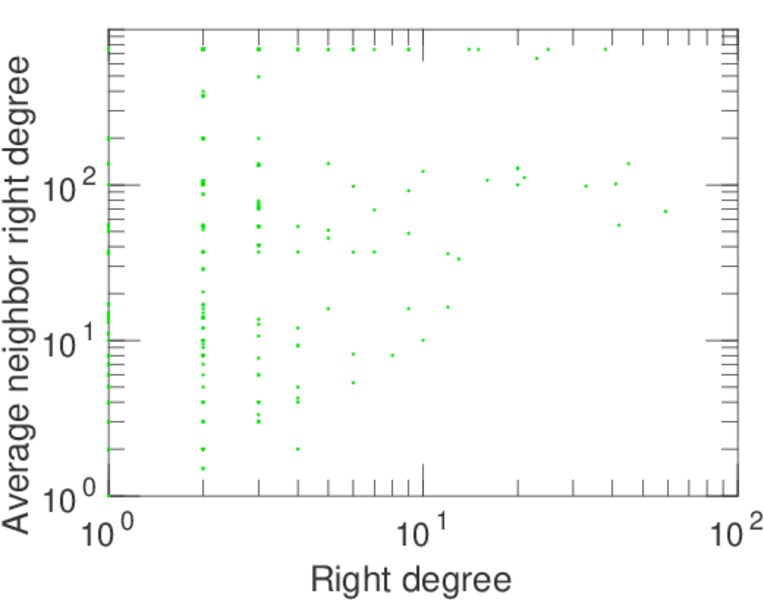
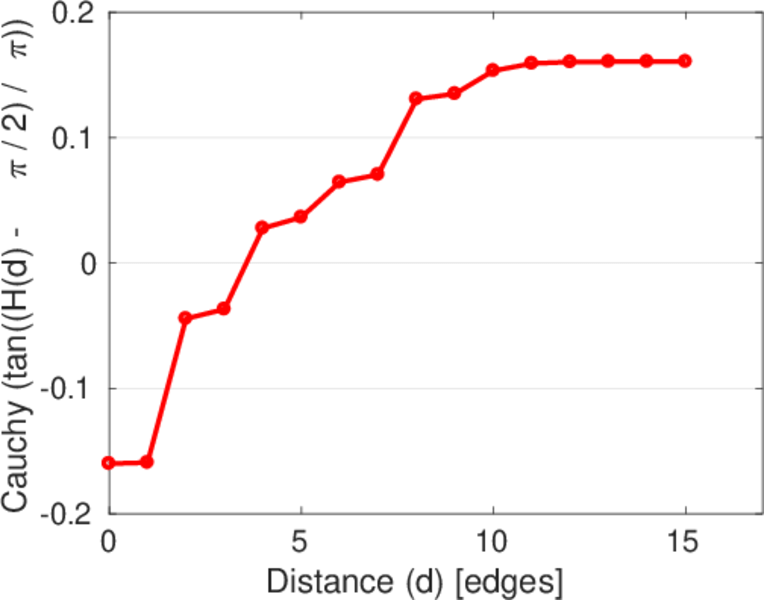
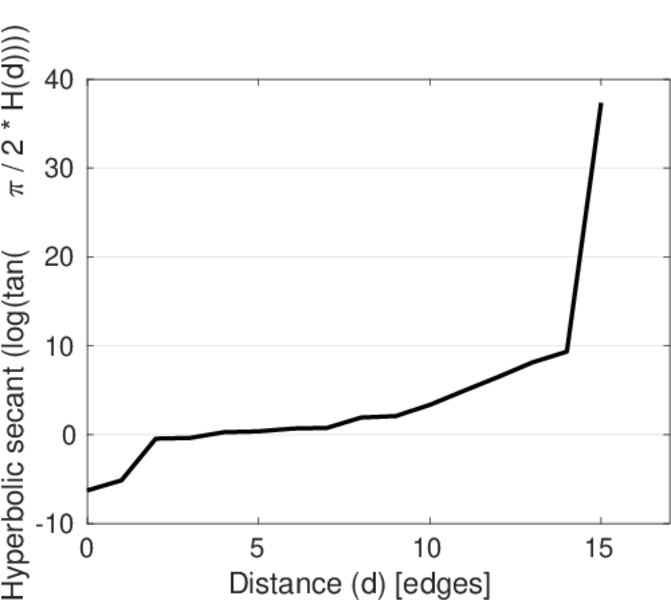
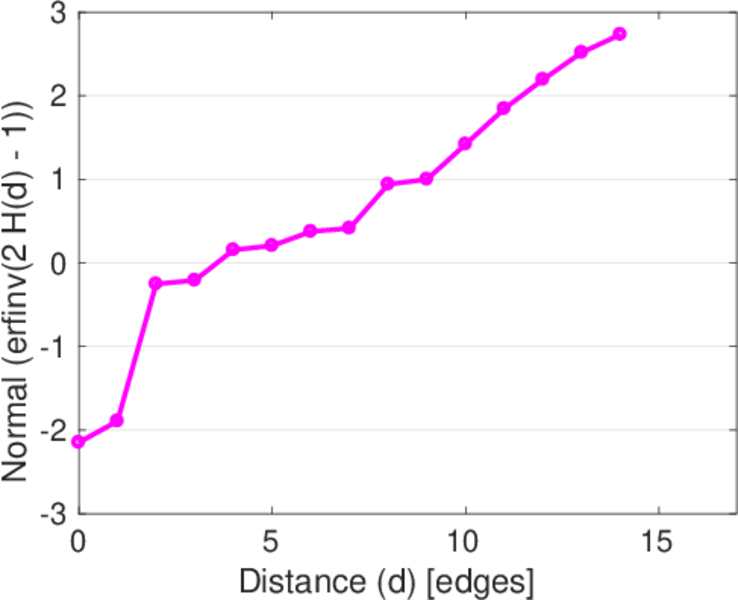
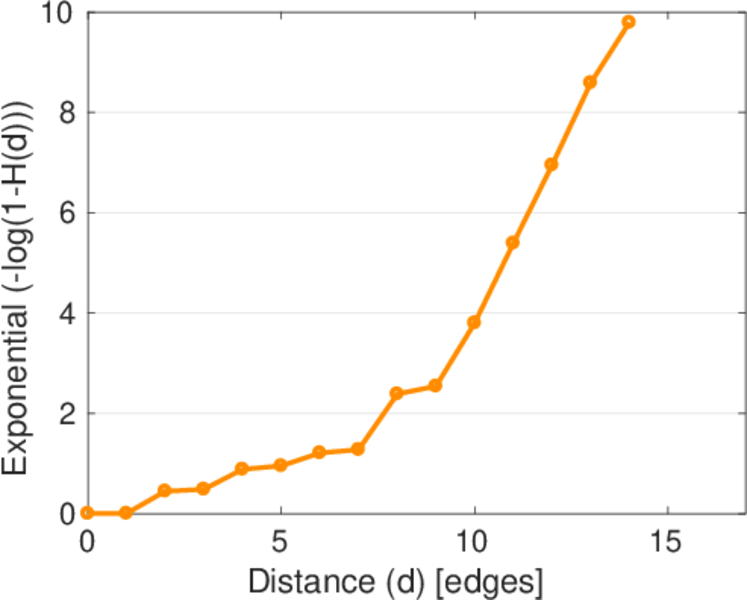
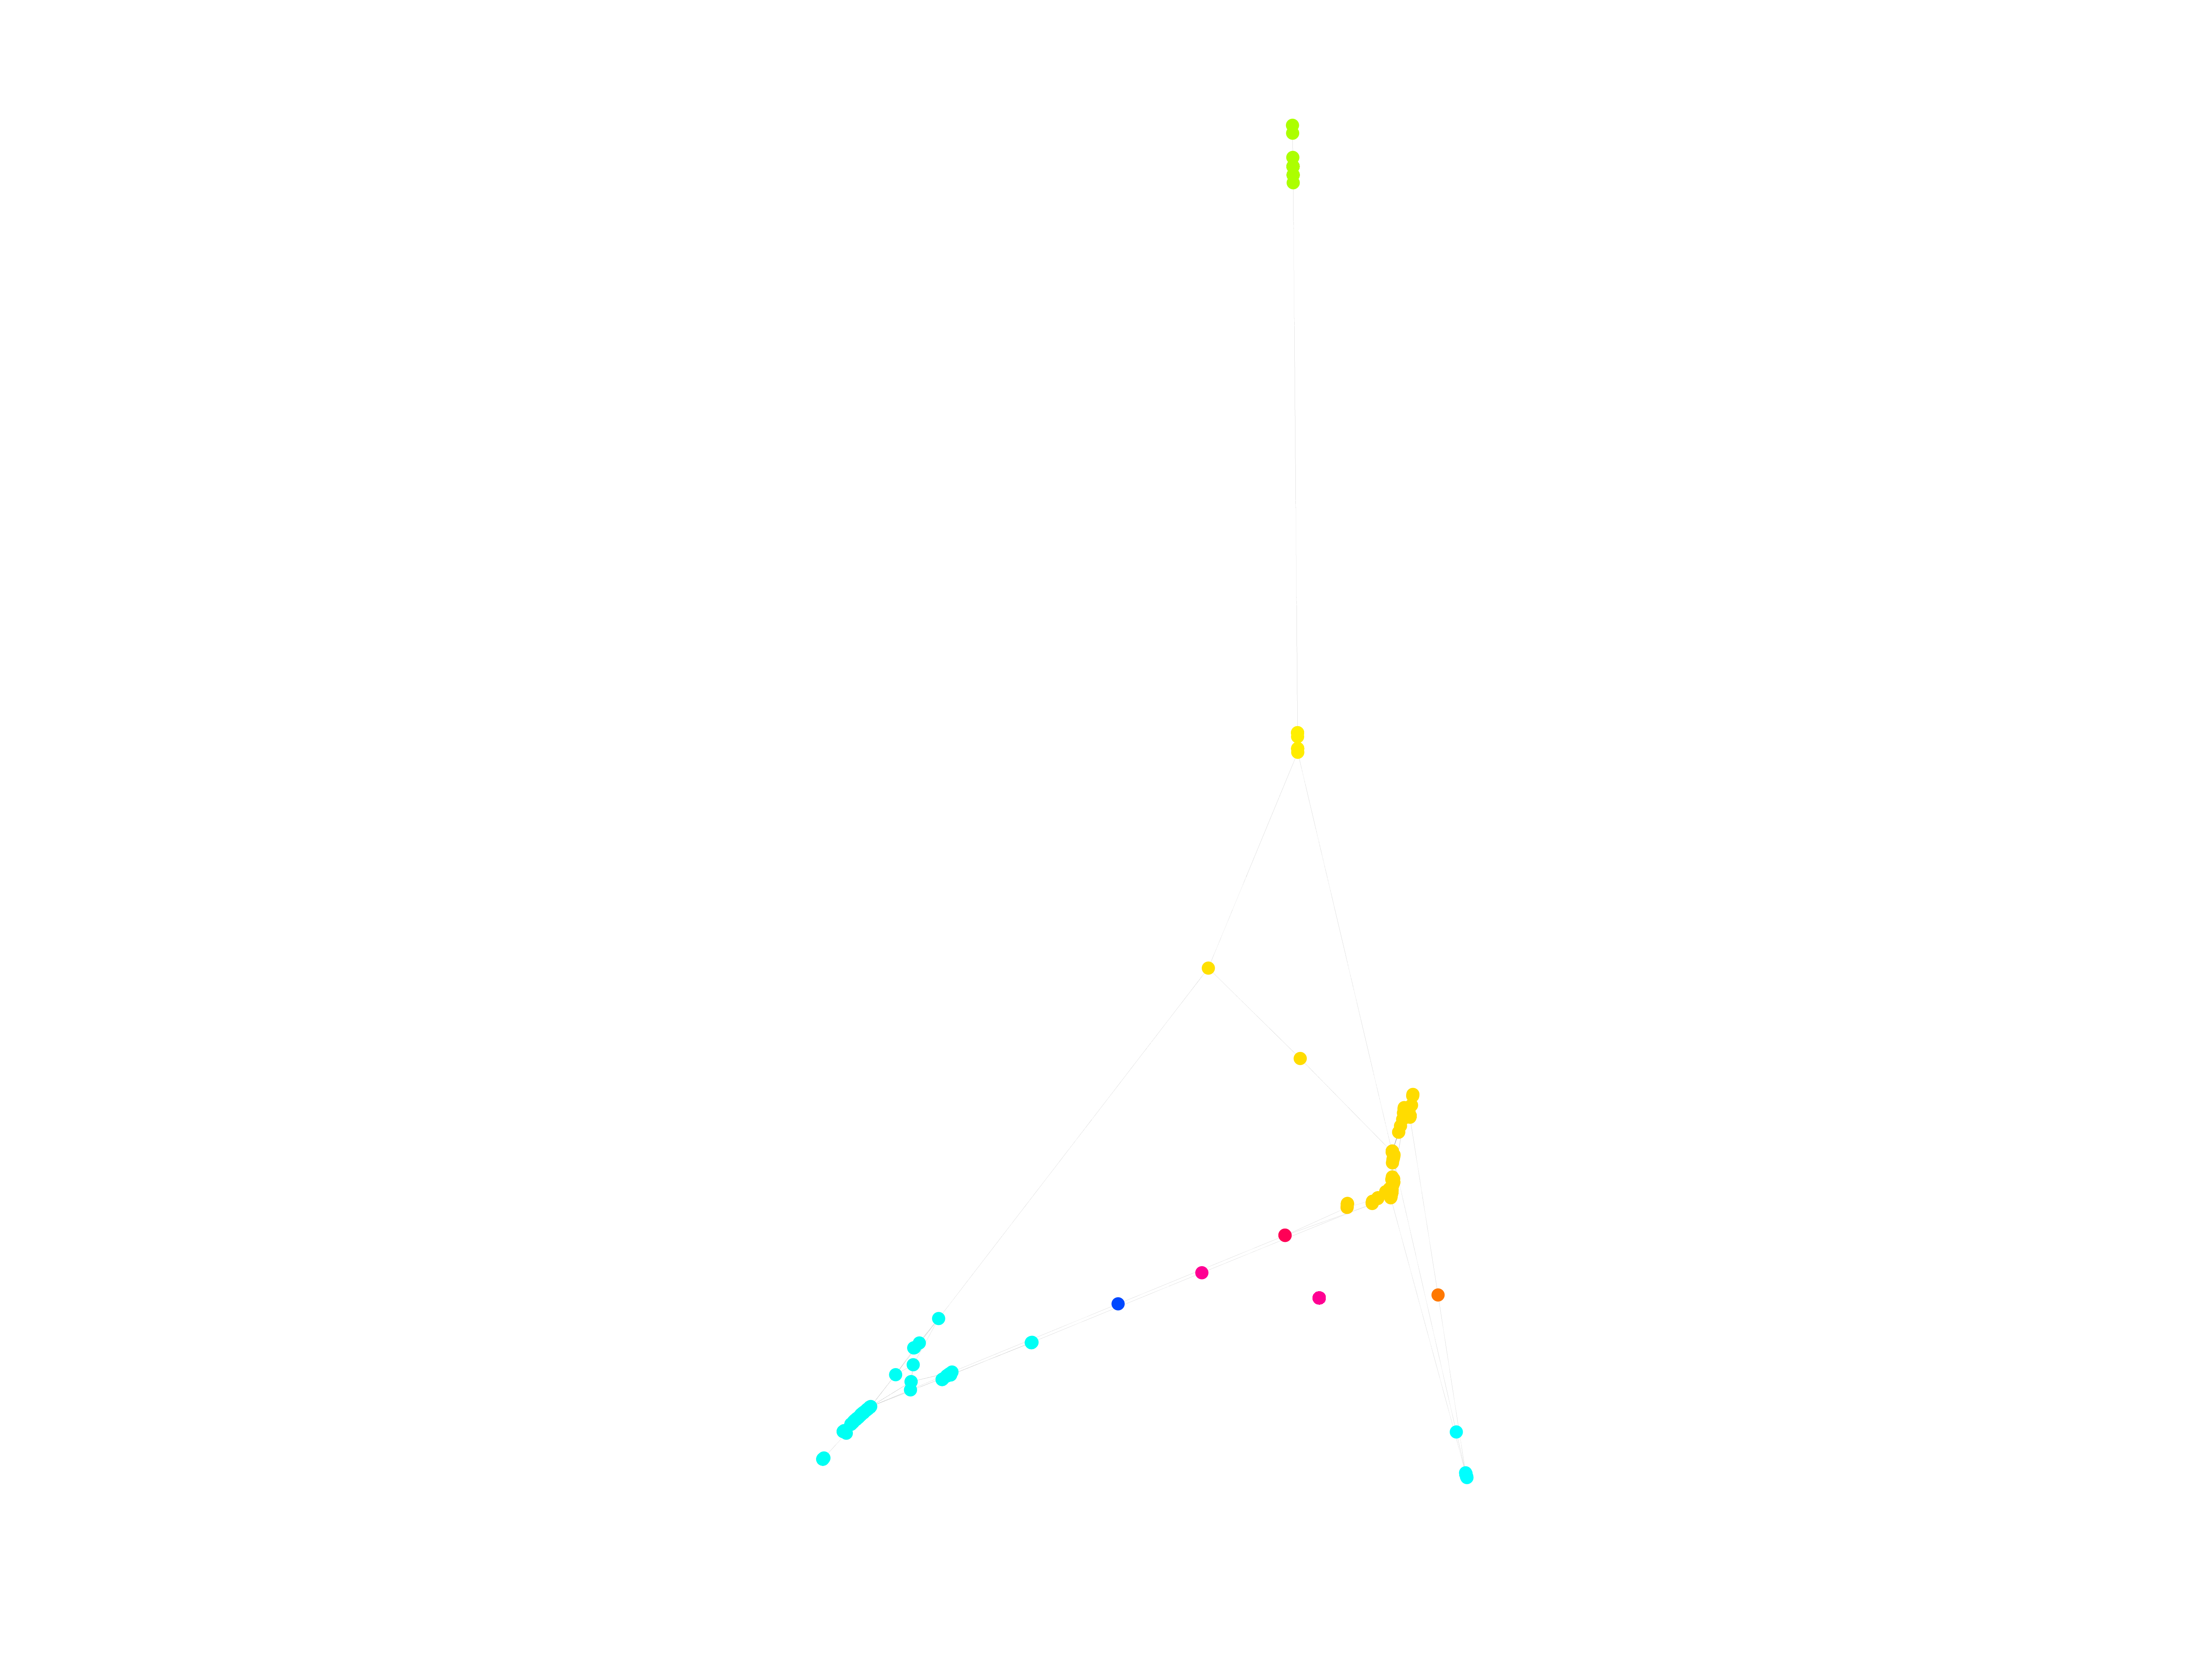
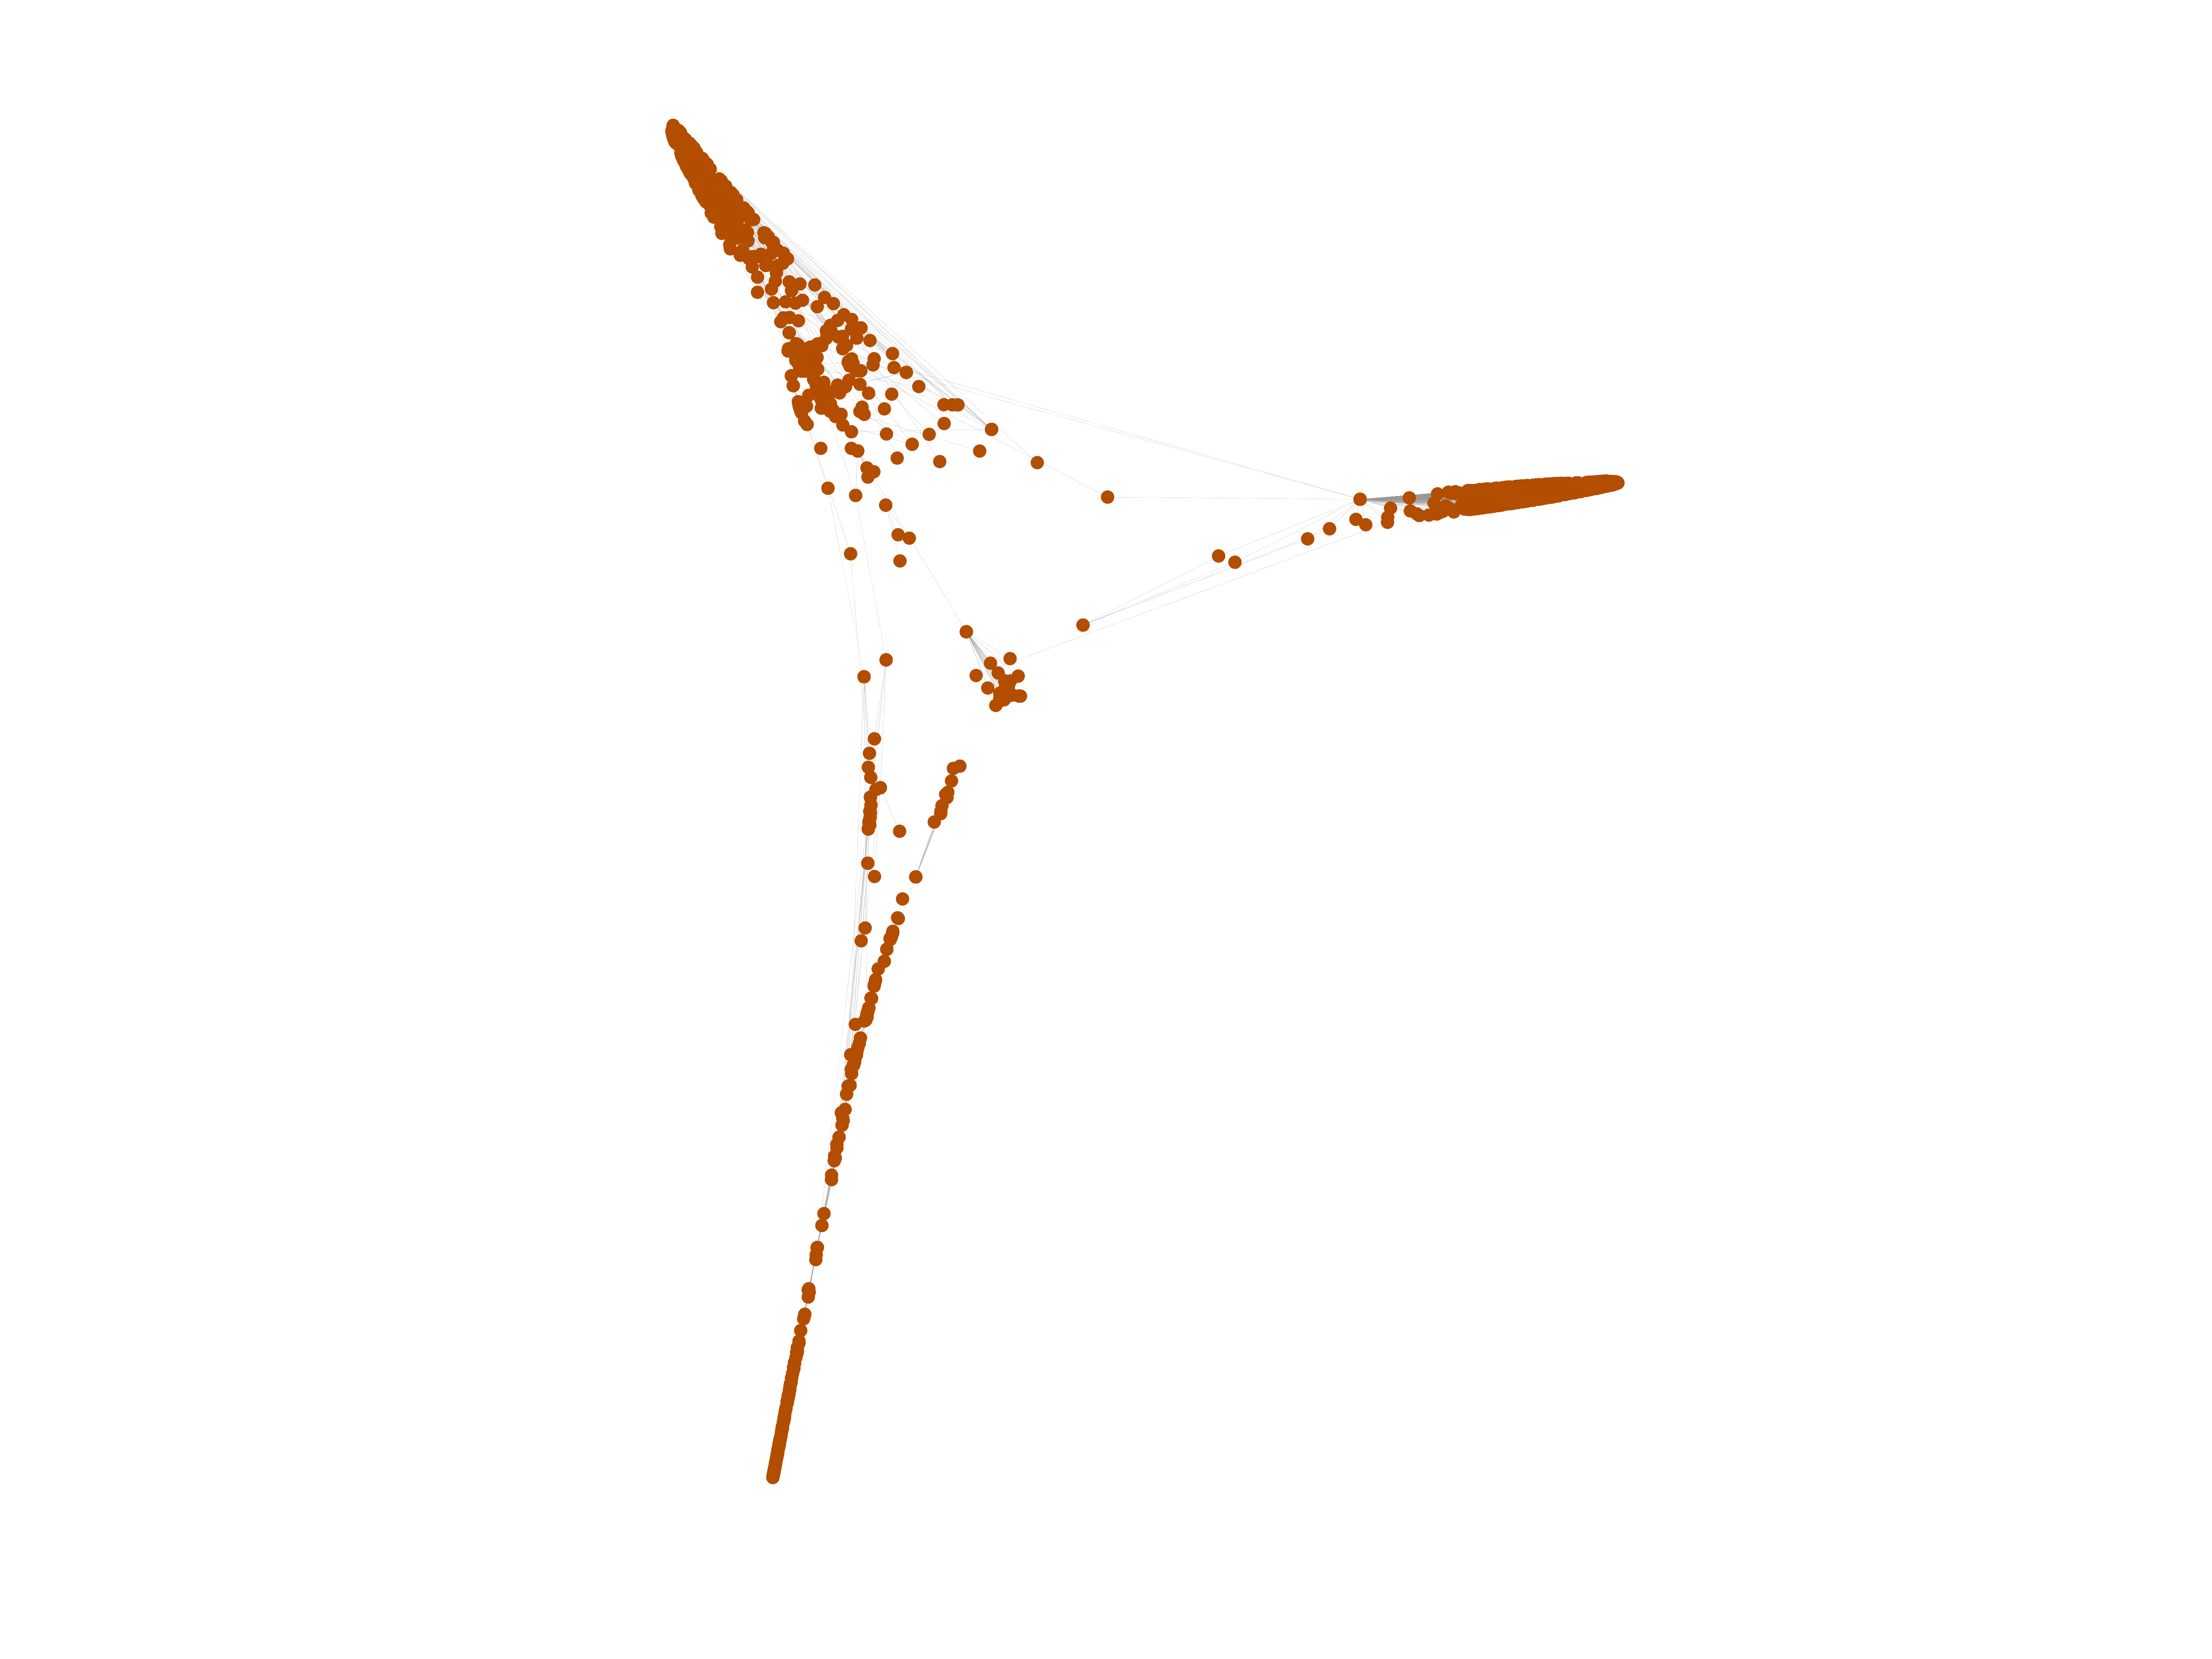
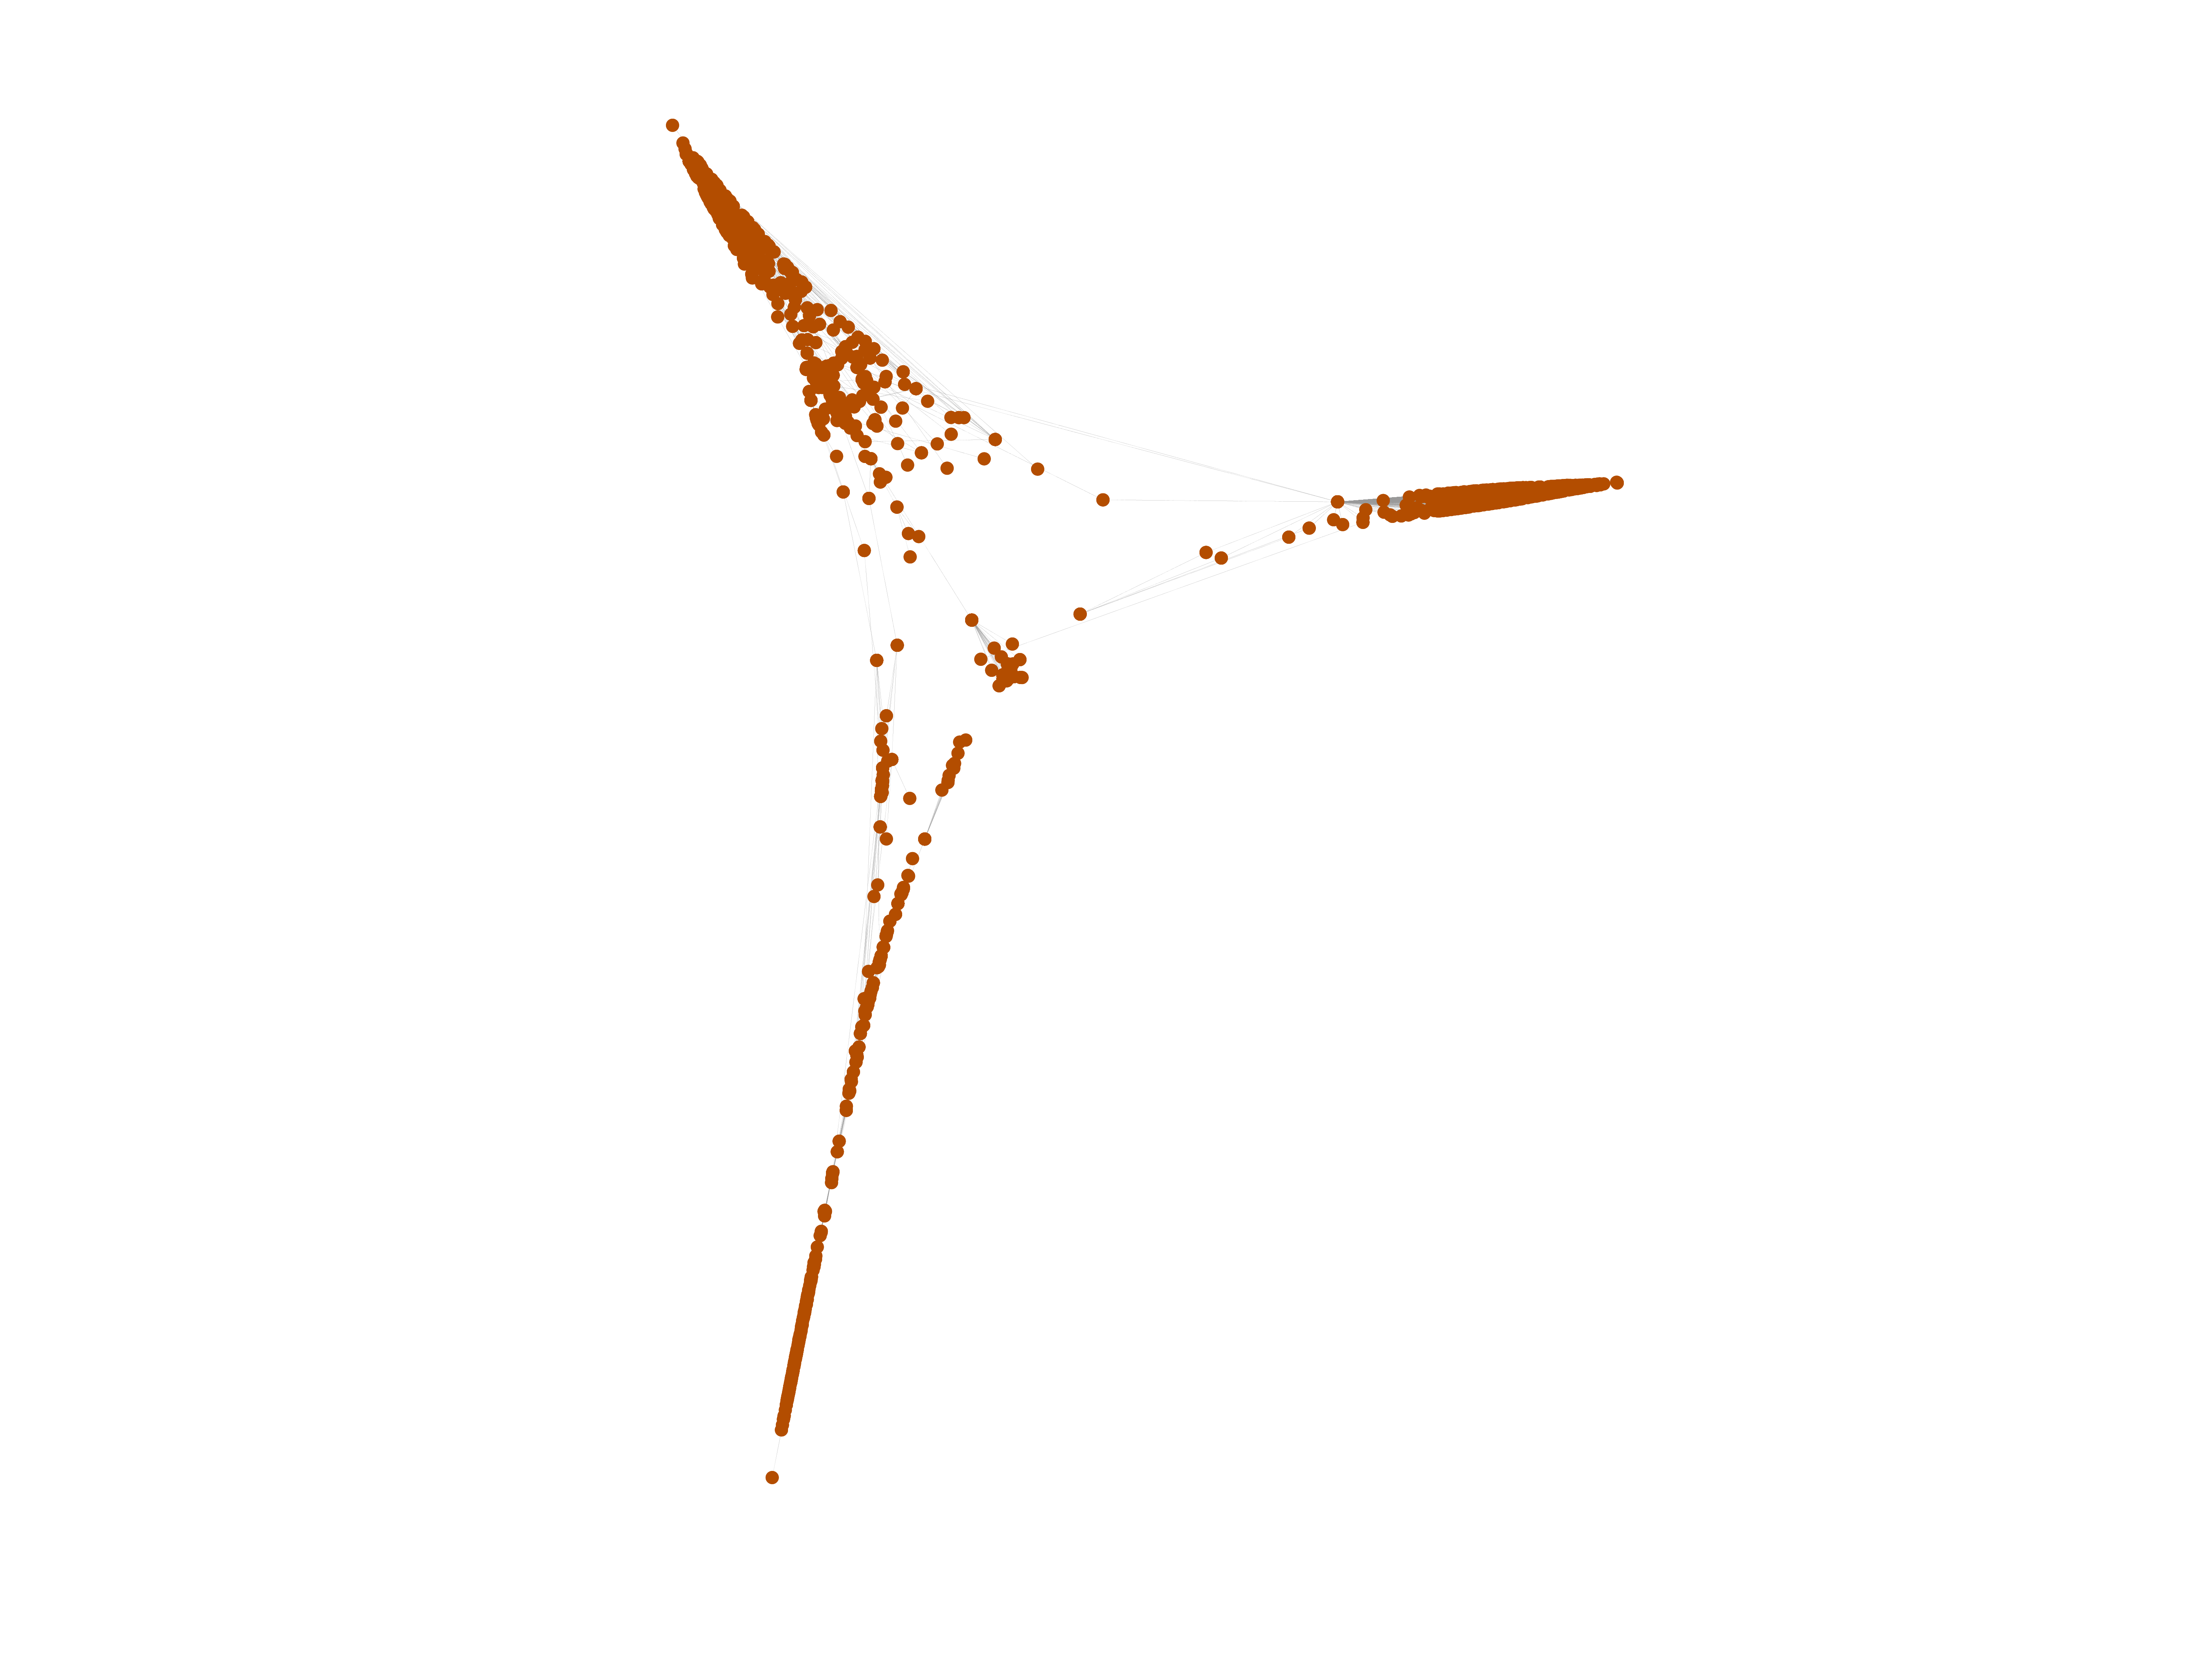
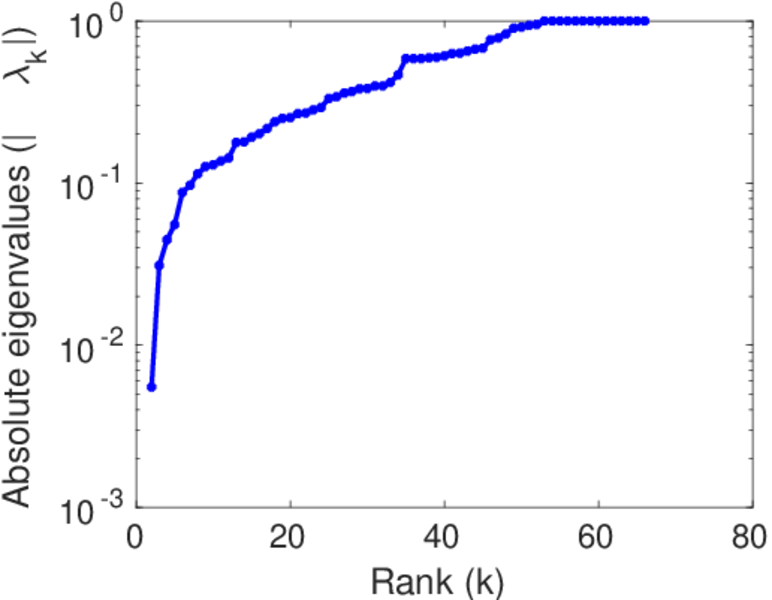
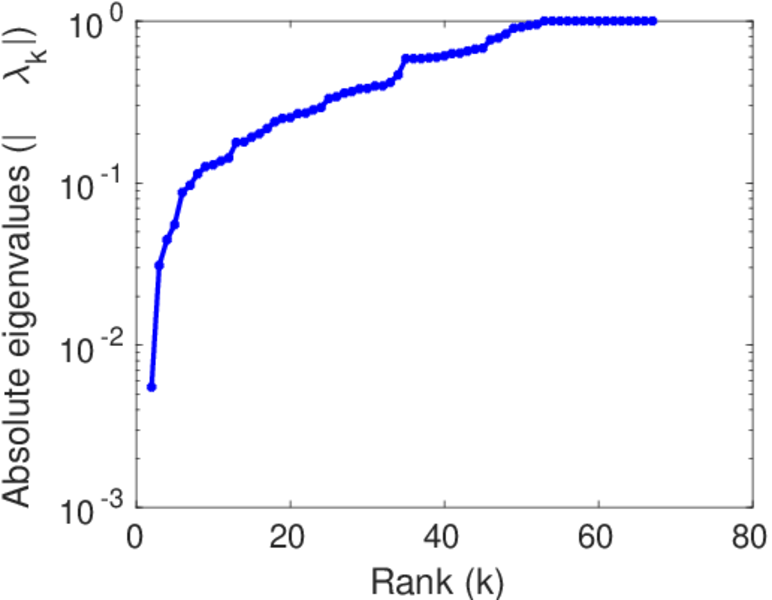
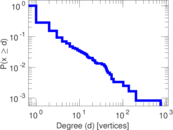
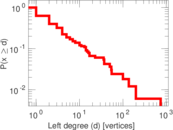
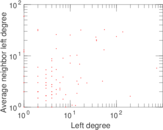
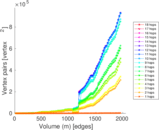
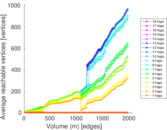
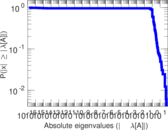
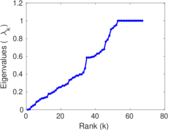
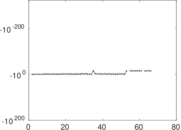
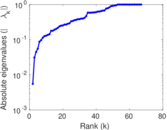
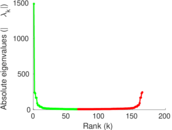
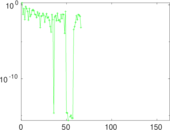
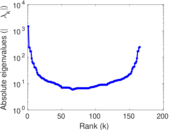
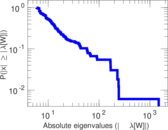
Plots


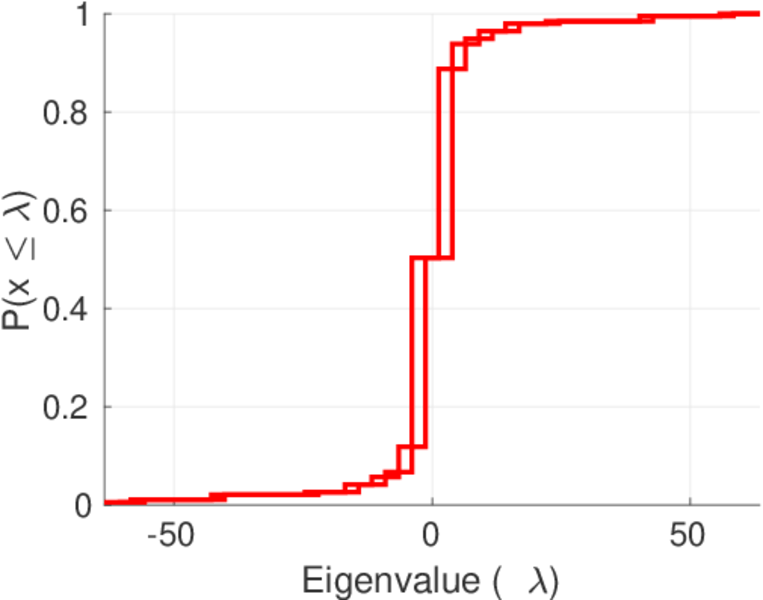
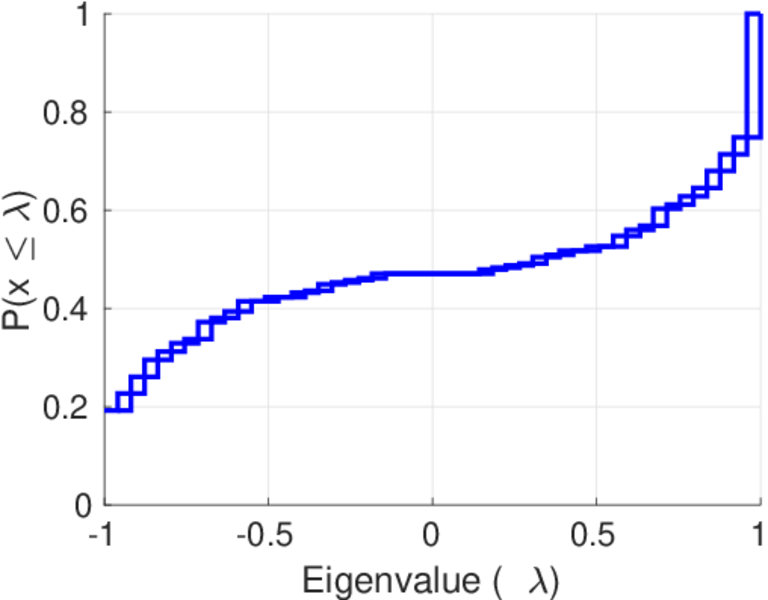
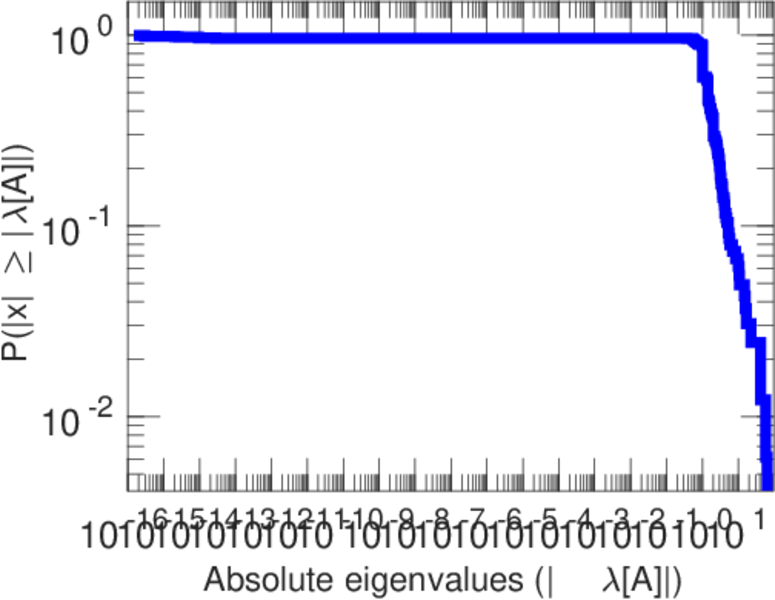
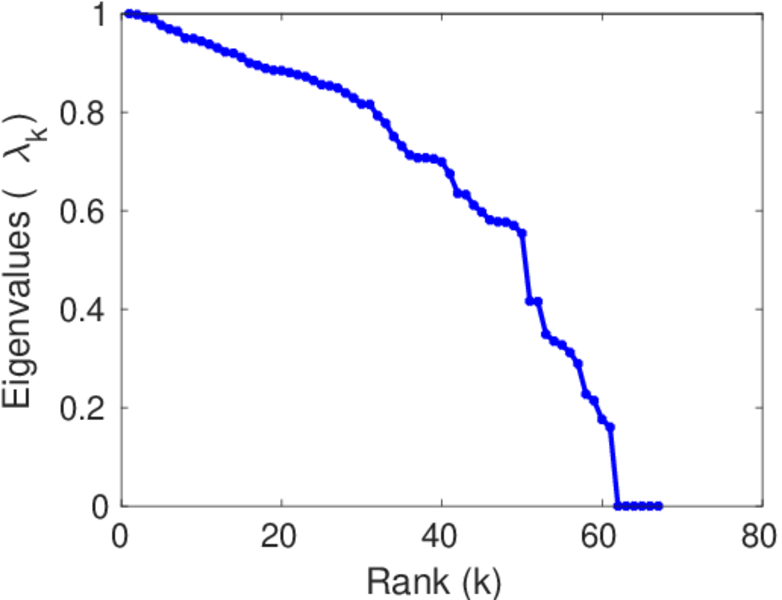
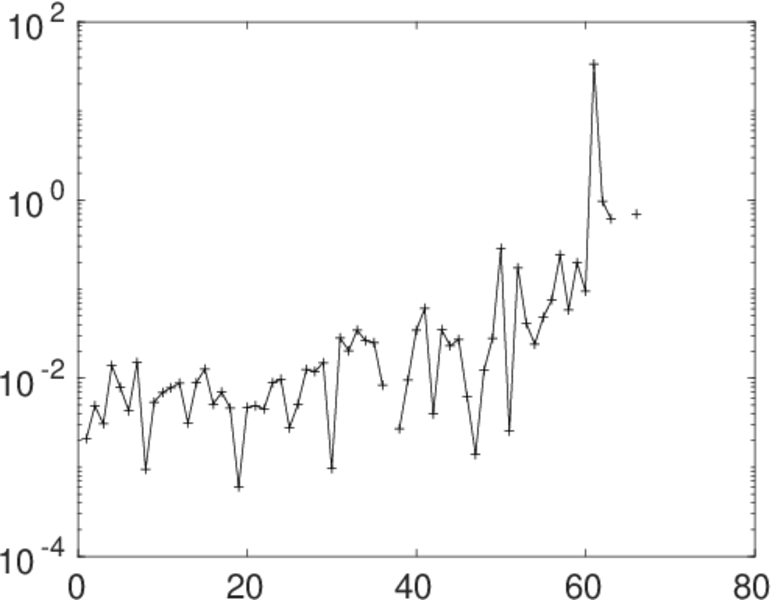
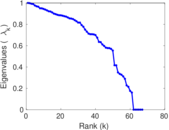
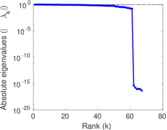
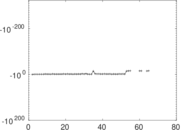
Matrix decompositions plots


Downloads
References
|
[1]
|
Jérôme Kunegis.
KONECT – The Koblenz Network Collection.
In Proc. Int. Conf. on World Wide Web Companion, pages
1343–1350, 2013.
[ http ]
|
|
[2]
|
Wikimedia Foundation.
Wikimedia downloads.
http://dumps.wikimedia.org/, January 2010.
|
 KONECT ‣ Networks ‣
Buy Me a Coffee
KONECT ‣ Networks ‣
Buy Me a Coffee