Wiktionary edits (sa)
This is the bipartite edit network of the Sanskrit Wiktionary. It contains
users and pages from the Sanskrit Wiktionary, connected by edit events. Each
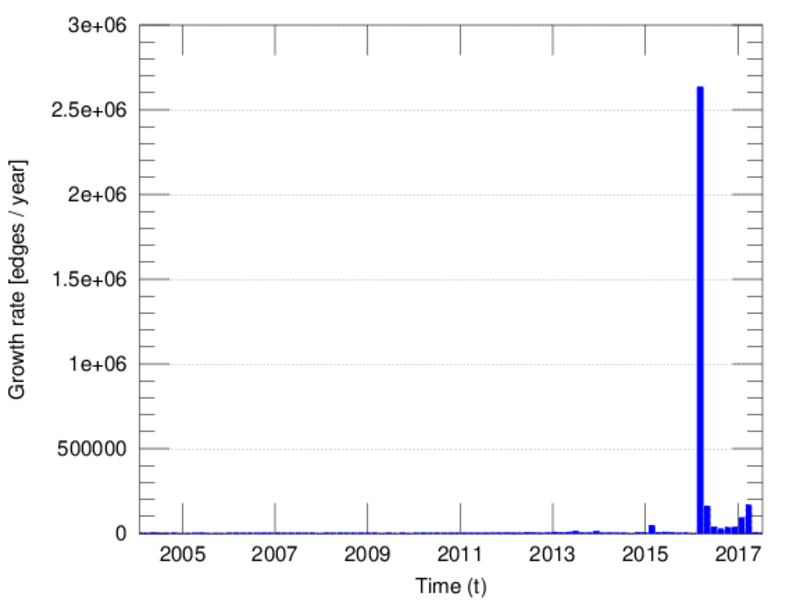
edge represents an edit. The dataset includes the timestamp of each edit.
Metadata
Statistics
| Size | n = | 263,998
|
| Left size | n1 = | 623
|
| Right size | n2 = | 263,375
|
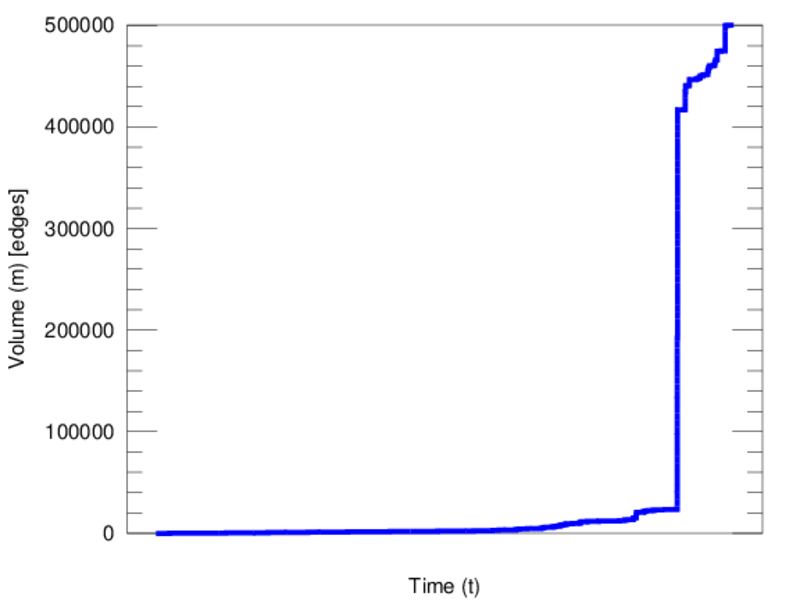
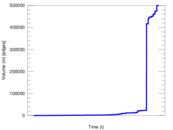
| Volume | m = | 500,298
|
| Unique edge count | m̿ = | 322,251
|
| Wedge count | s = | 34,374,045,834
|
| Claw count | z = | 2,940,988,042,976,340
|
| Cross count | x = | 1.911 13 × 1020
|
| Square count | q = | 649,273,162
|
| 4-Tour count | T4 = | 142,691,013,478
|
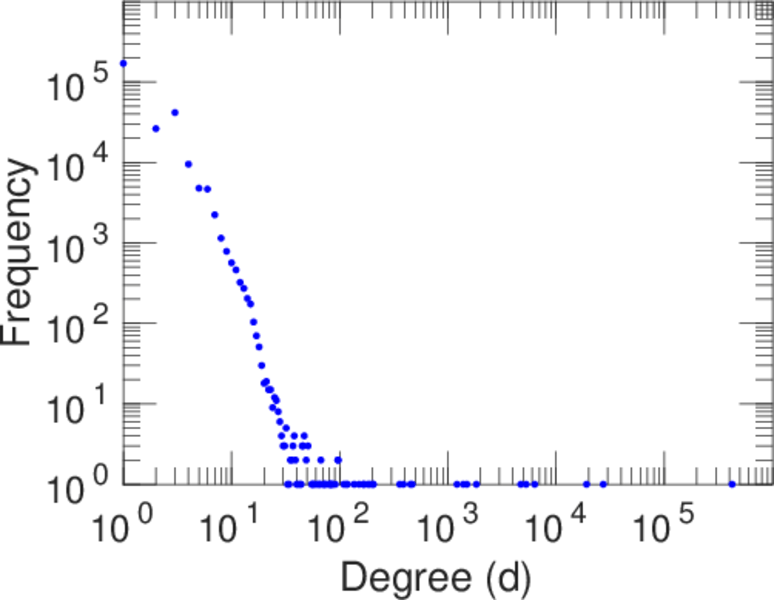
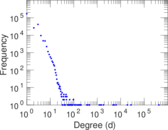
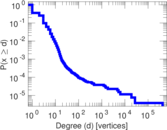
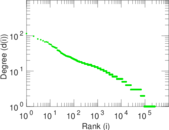
| Maximum degree | dmax = | 424,346
|
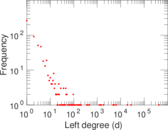
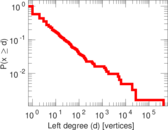
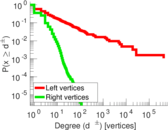
| Maximum left degree | d1max = | 424,346
|
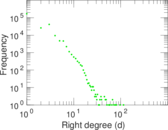
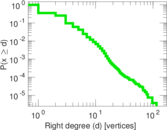
| Maximum right degree | d2max = | 115
|
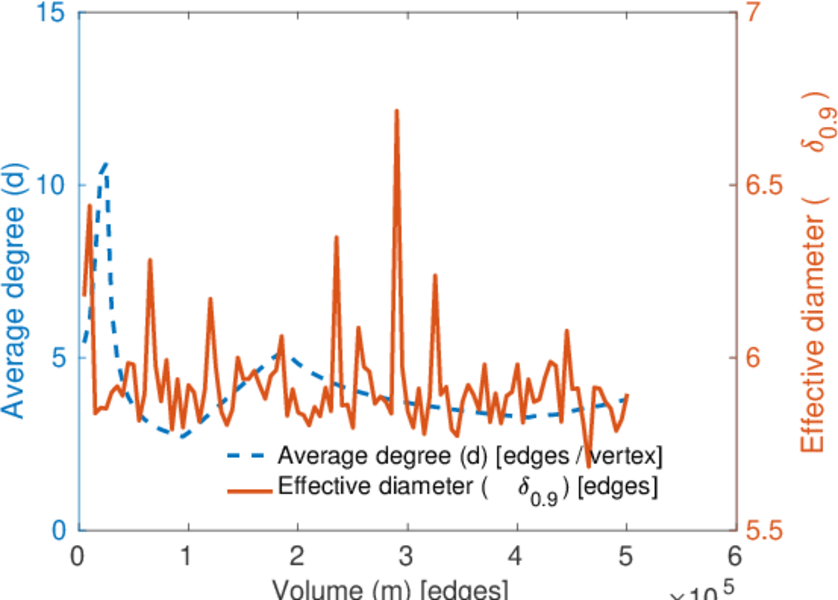
| Average degree | d = | 3.790 17
|
| Average left degree | d1 = | 803.047
|
| Average right degree | d2 = | 1.899 57
|
| Fill | p = | 0.001 963 96
|
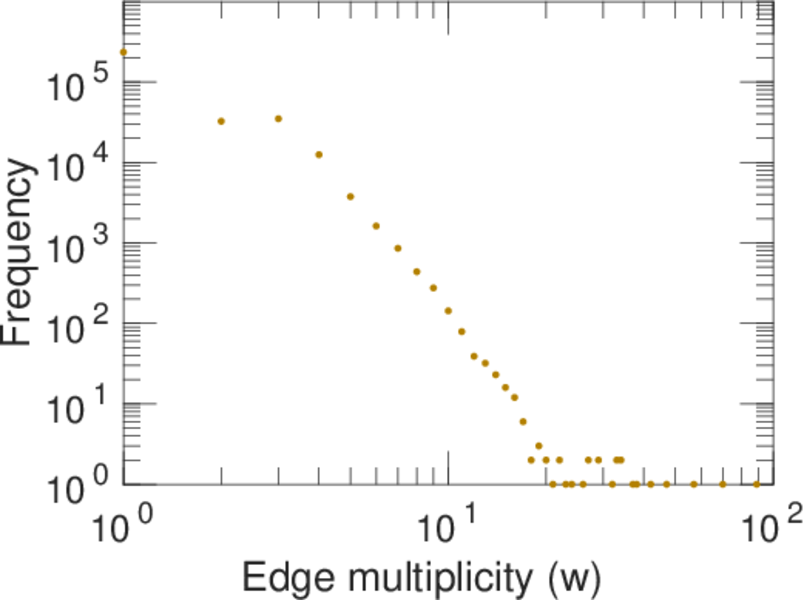
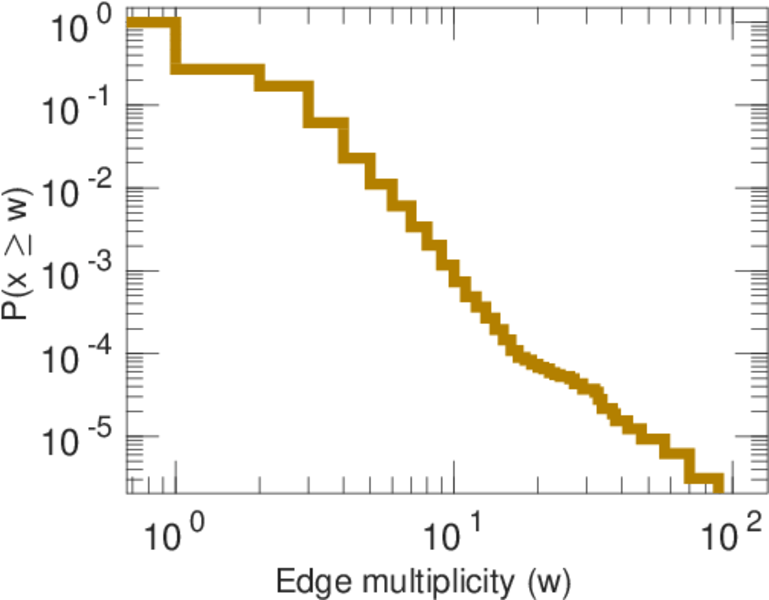
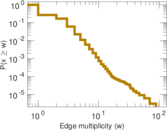
| Average edge multiplicity | m̃ = | 1.552 51
|
| Size of LCC | N = | 263,491
|
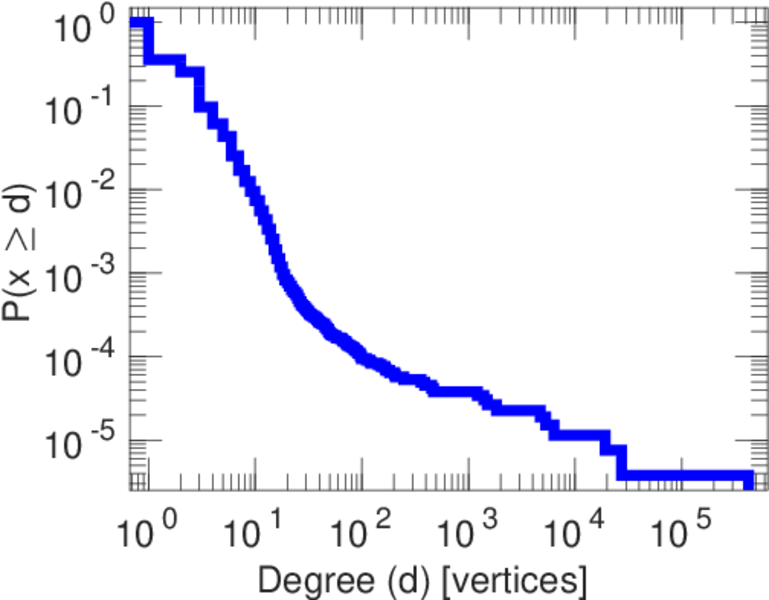
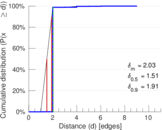
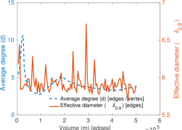
| Diameter | δ = | 13
|
| 50-Percentile effective diameter | δ0.5 = | 1.505 82
|
| 90-Percentile effective diameter | δ0.9 = | 1.910 48
|
| Median distance | δM = | 2
|
| Mean distance | δm = | 2.027 92
|
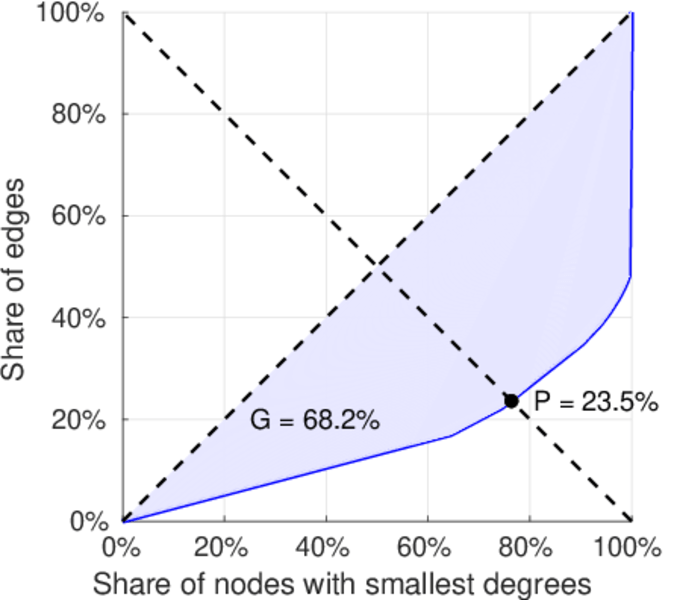
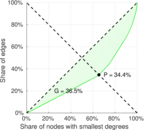
| Gini coefficient | G = | 0.682 150
|
| Balanced inequality ratio | P = | 0.234 390
|
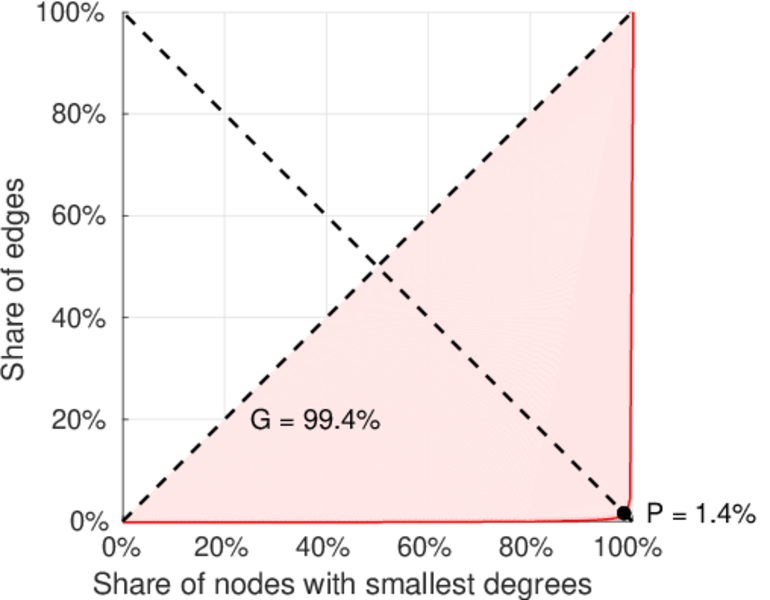
| Left balanced inequality ratio | P1 = | 0.014 407 4
|
| Right balanced inequality ratio | P2 = | 0.344 273
|
| Relative edge distribution entropy | Her = | 0.585 304
|
| Power law exponent | γ = | 9.655 10
|
| Tail power law exponent | γt = | 3.351 00
|
| Tail power law exponent with p | γ3 = | 3.351 00
|
| p-value | p = | 0.000 00
|
| Left tail power law exponent with p | γ3,1 = | 1.661 00
|
| Left p-value | p1 = | 0.173 000
|
| Right tail power law exponent with p | γ3,2 = | 7.031 00
|
| Right p-value | p2 = | 0.000 00
|
| Degree assortativity | ρ = | −0.680 770
|
| Degree assortativity p-value | pρ = | 0.000 00
|
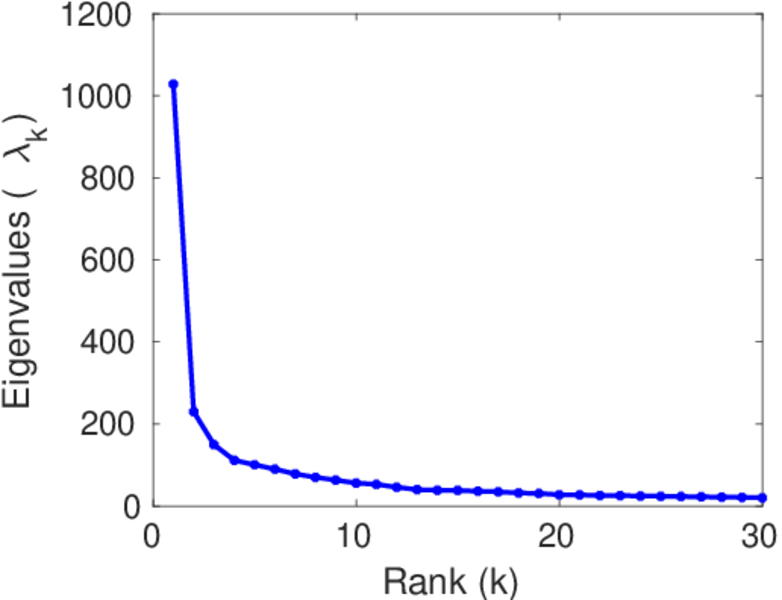
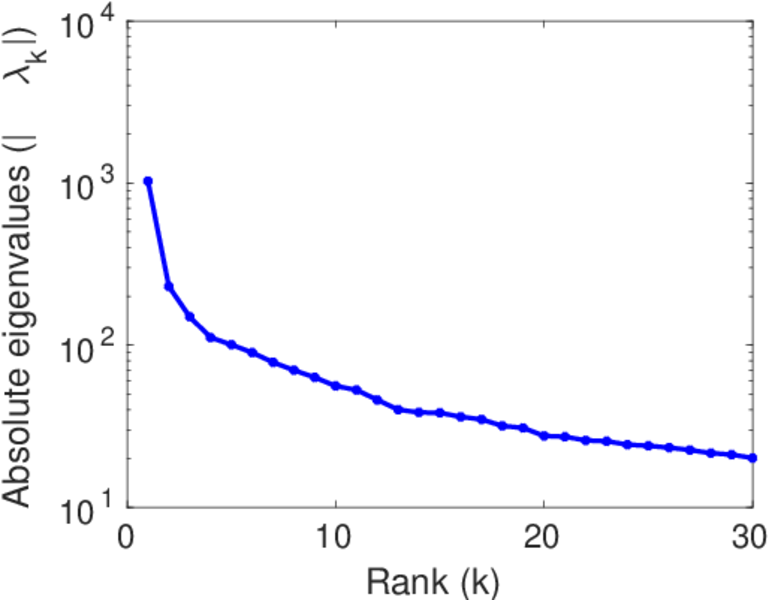
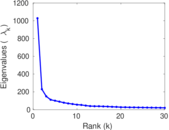
| Spectral norm | α = | 1,028.16
|
| Algebraic connectivity | a = | 0.015 586 1
|
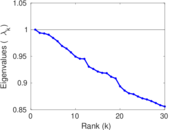
| Spectral separation | |λ1[A] / λ2[A]| = | 4.469 38
|
| Controllability | C = | 262,949
|
| Relative controllability | Cr = | 0.996 234
|
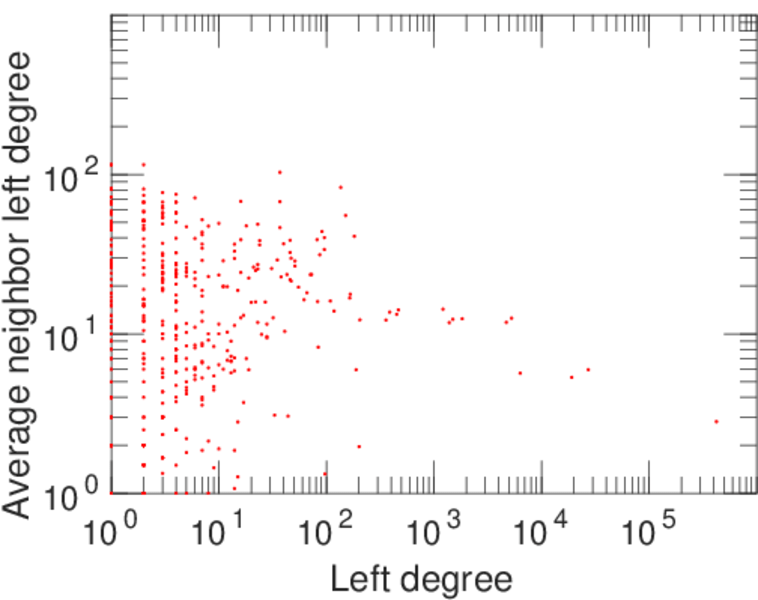
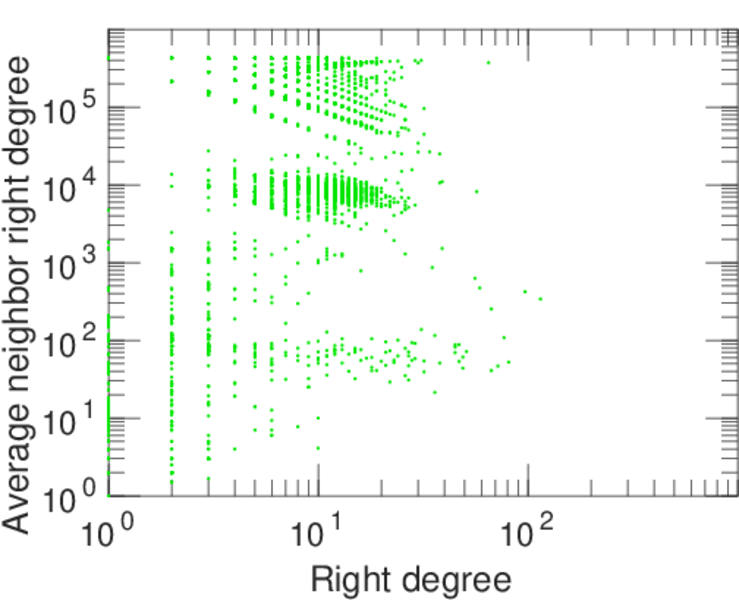
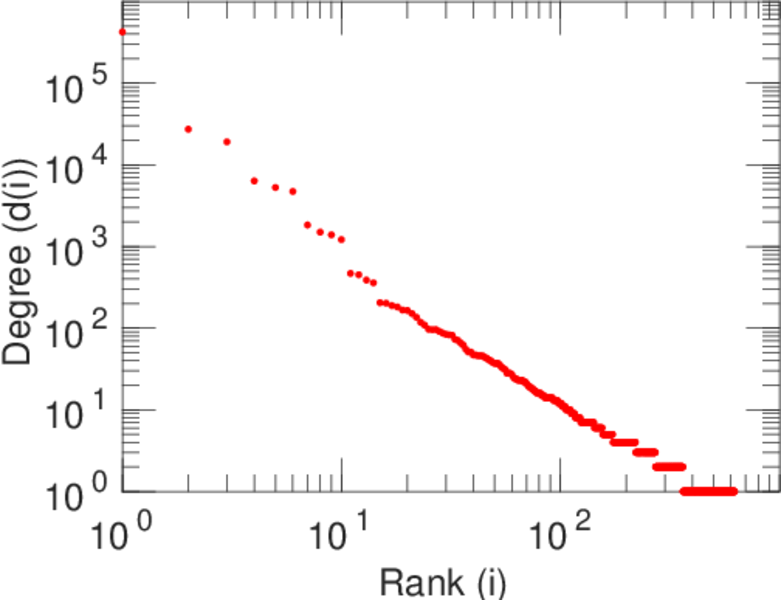
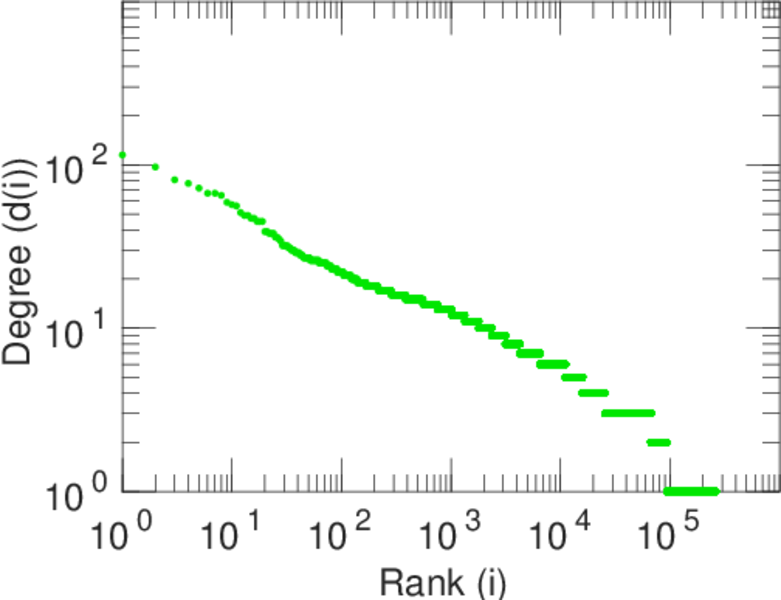
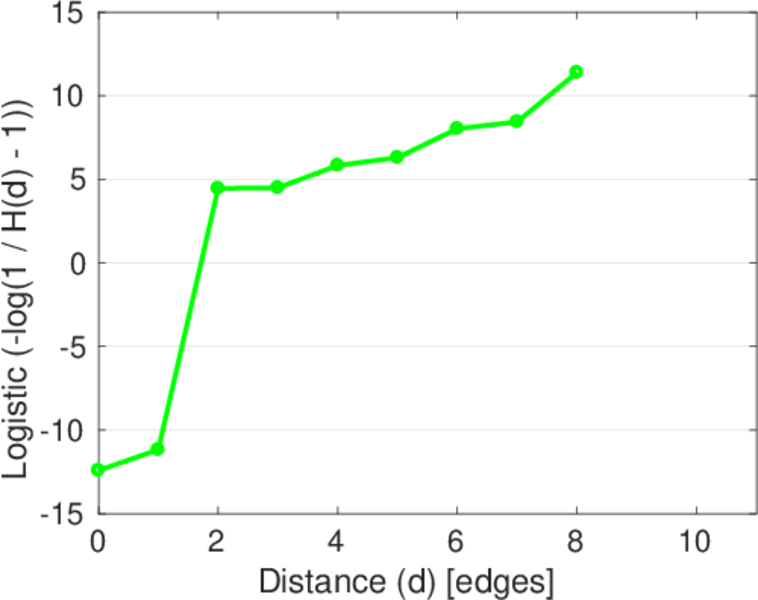
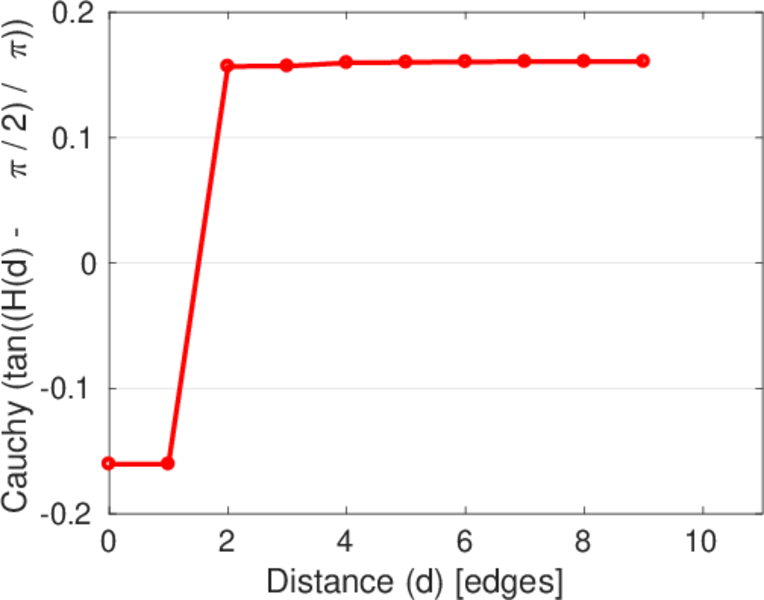
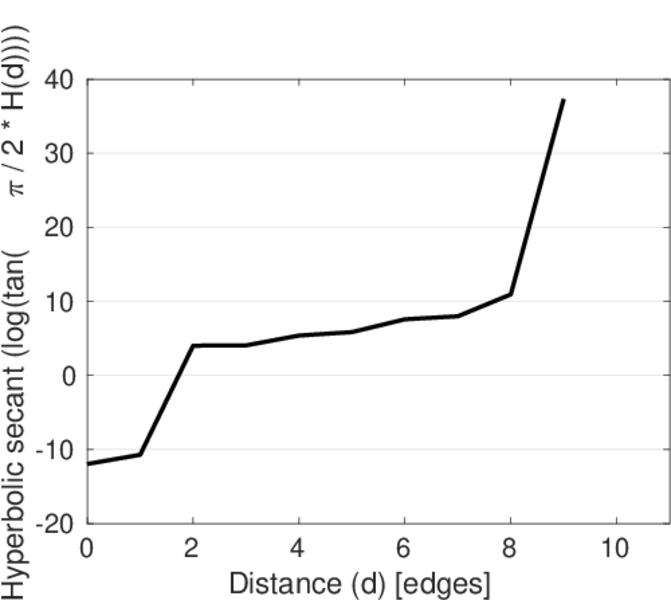
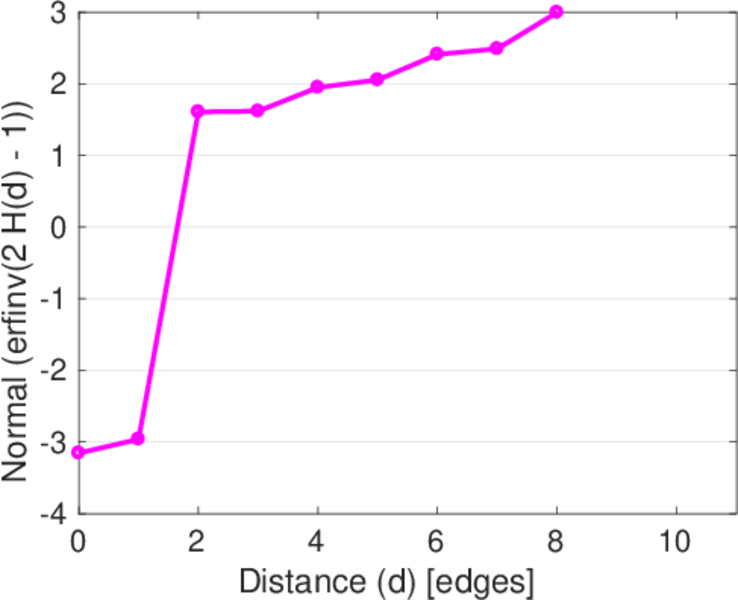
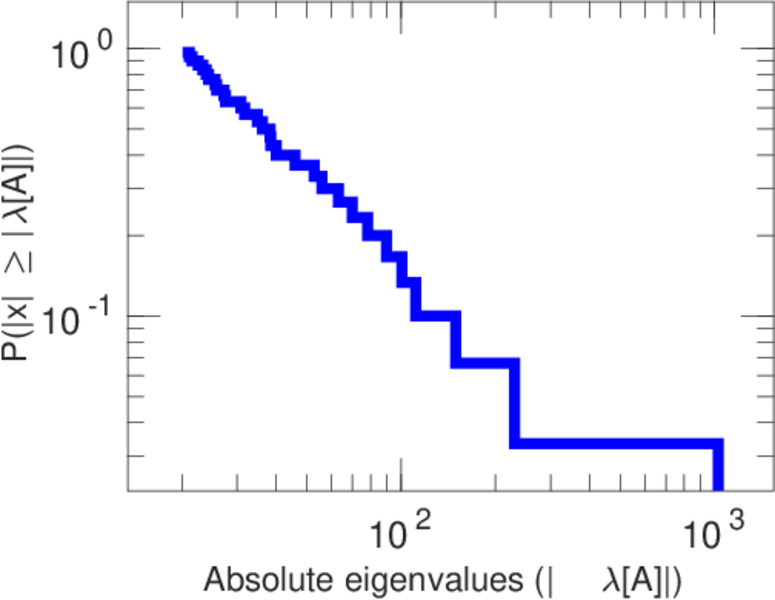
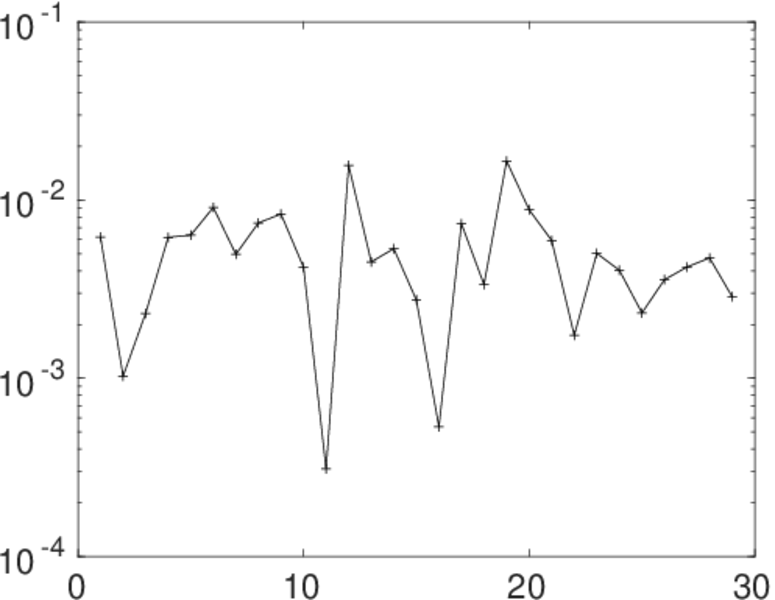
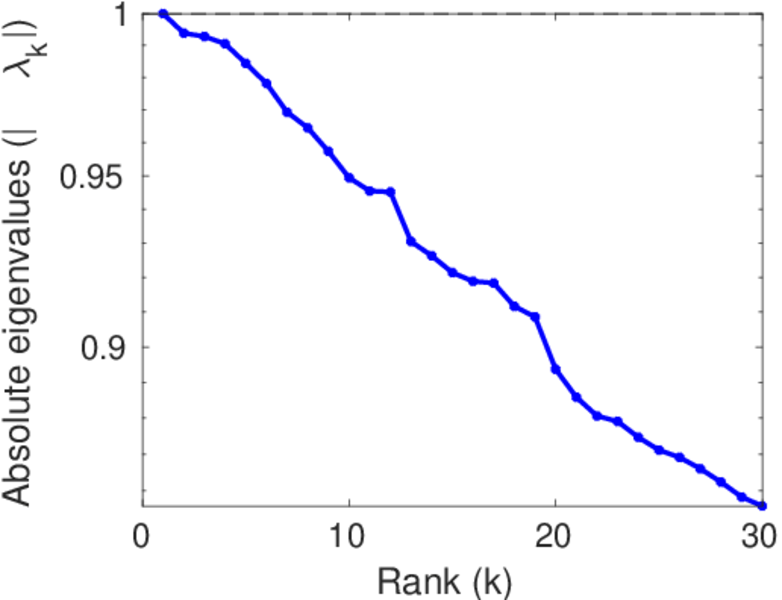
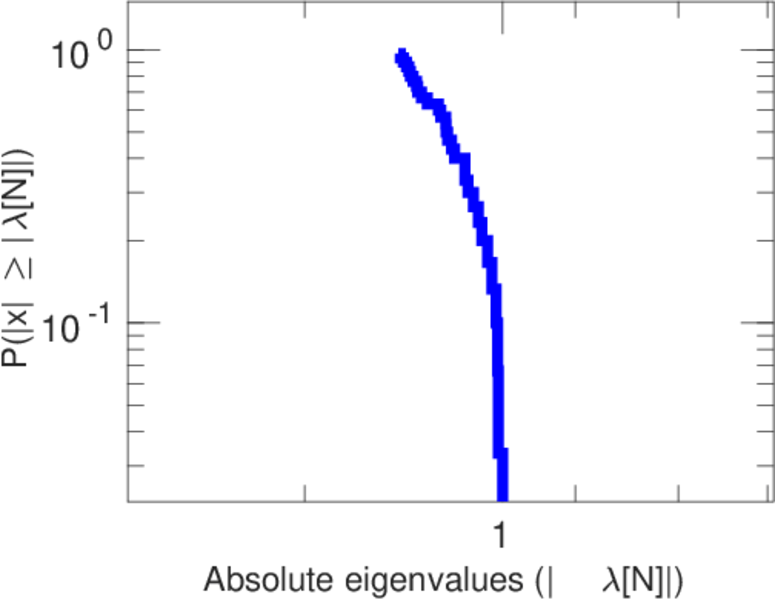
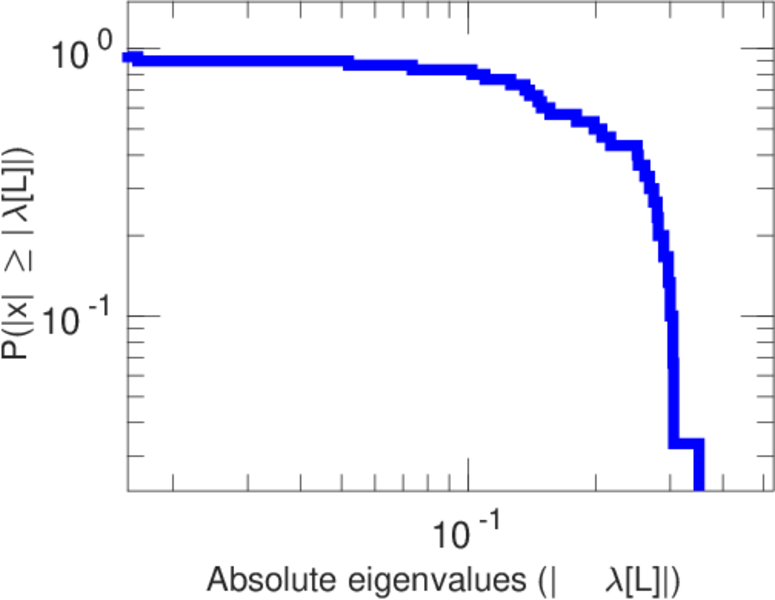
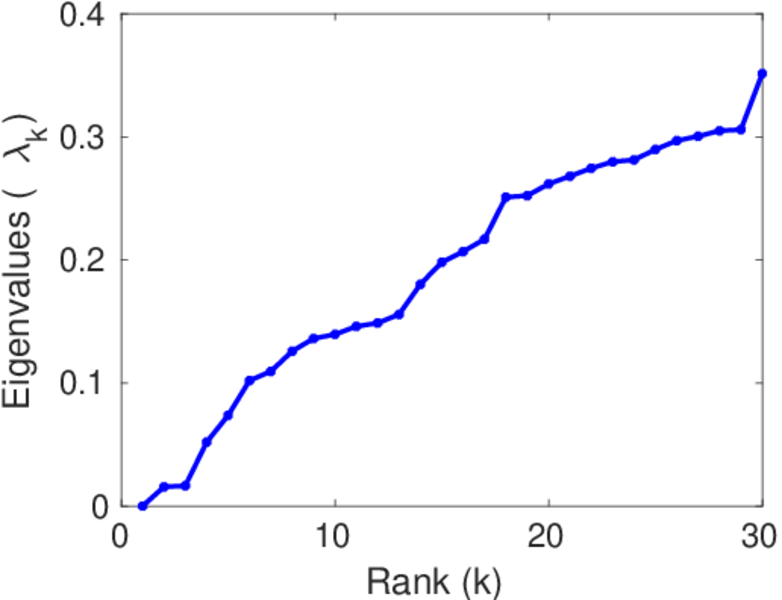
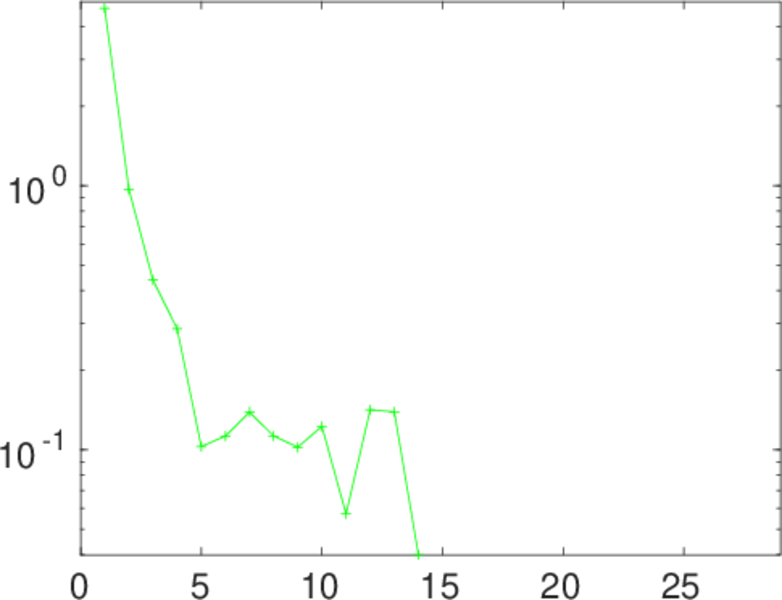
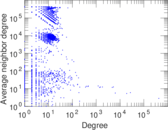
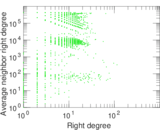
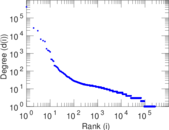
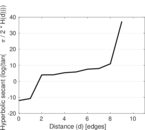
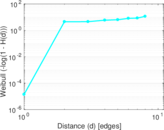
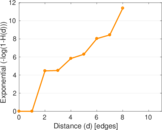
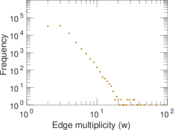
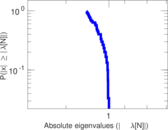
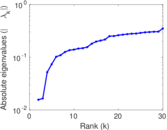
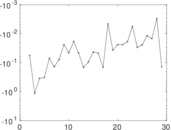
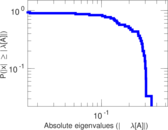
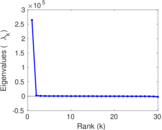
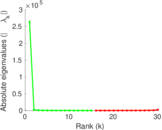
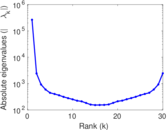
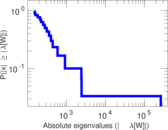
Plots


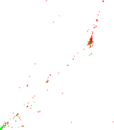


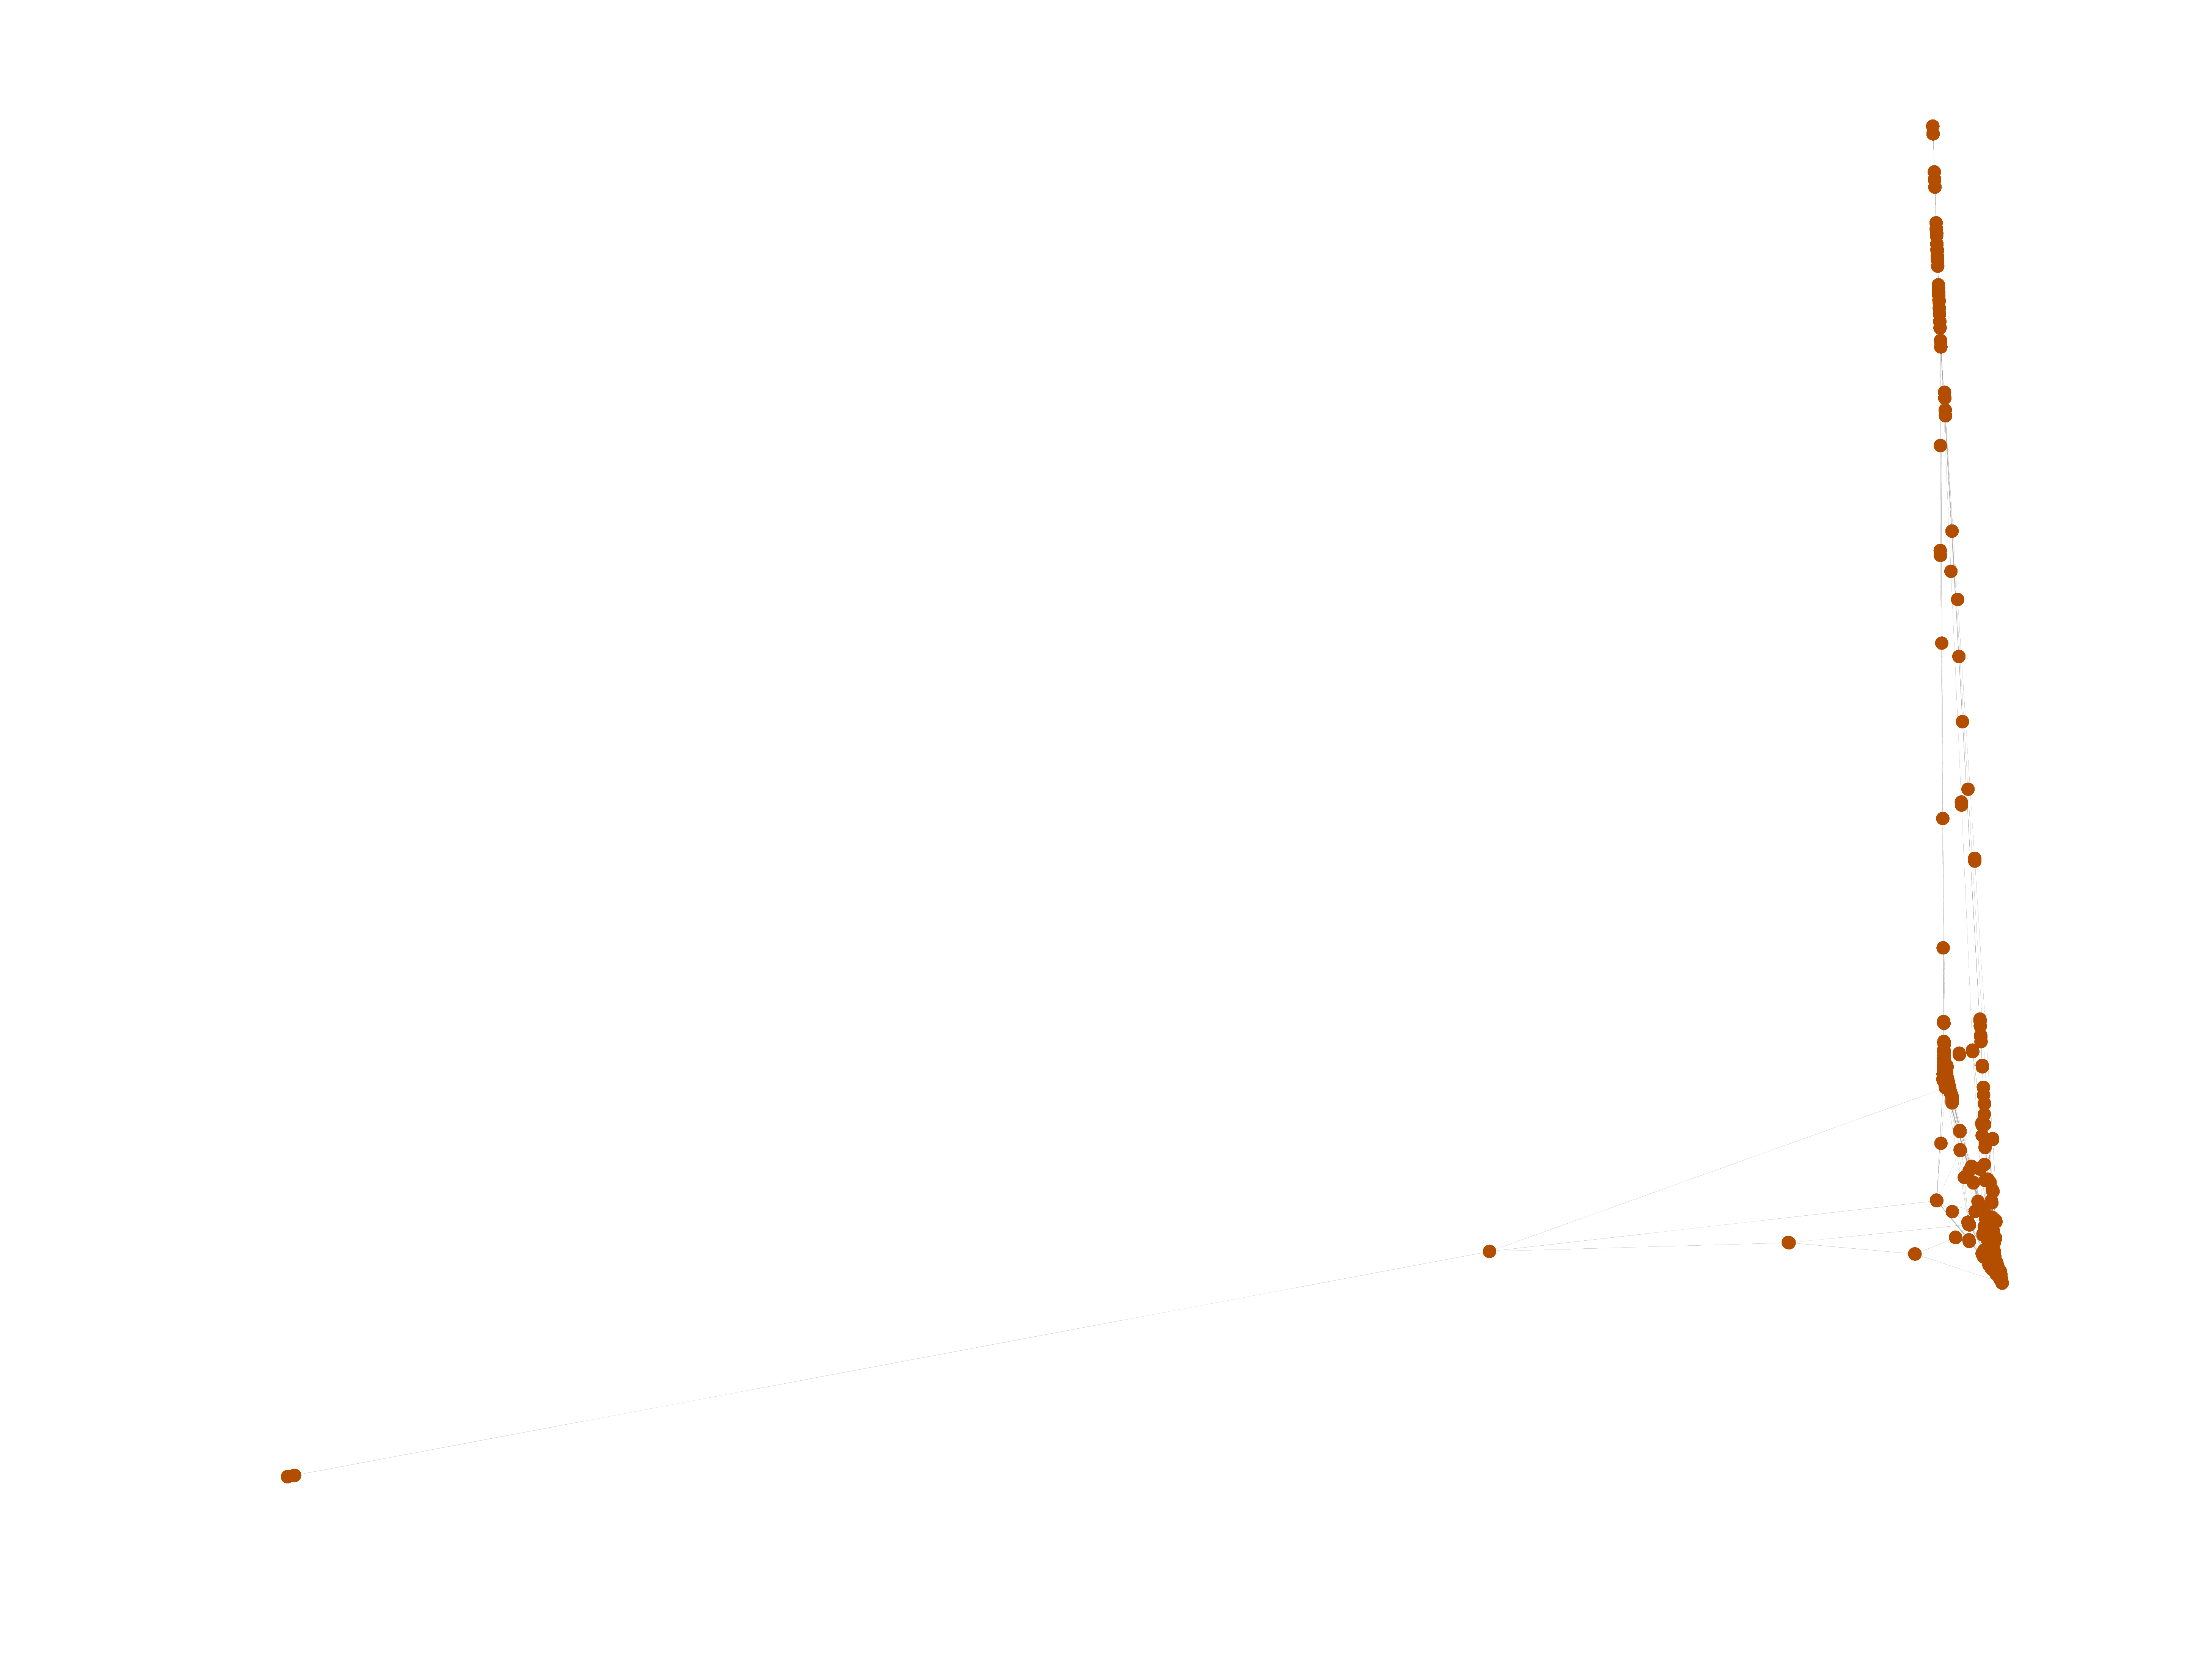
Matrix decompositions plots


Downloads
References
|
[1]
|
Jérôme Kunegis.
KONECT – The Koblenz Network Collection.
In Proc. Int. Conf. on World Wide Web Companion, pages
1343–1350, 2013.
[ http ]
|
|
[2]
|
Wikimedia Foundation.
Wikimedia downloads.
http://dumps.wikimedia.org/, January 2010.
|
 KONECT ‣ Networks ‣
Buy Me a Coffee
KONECT ‣ Networks ‣
Buy Me a Coffee