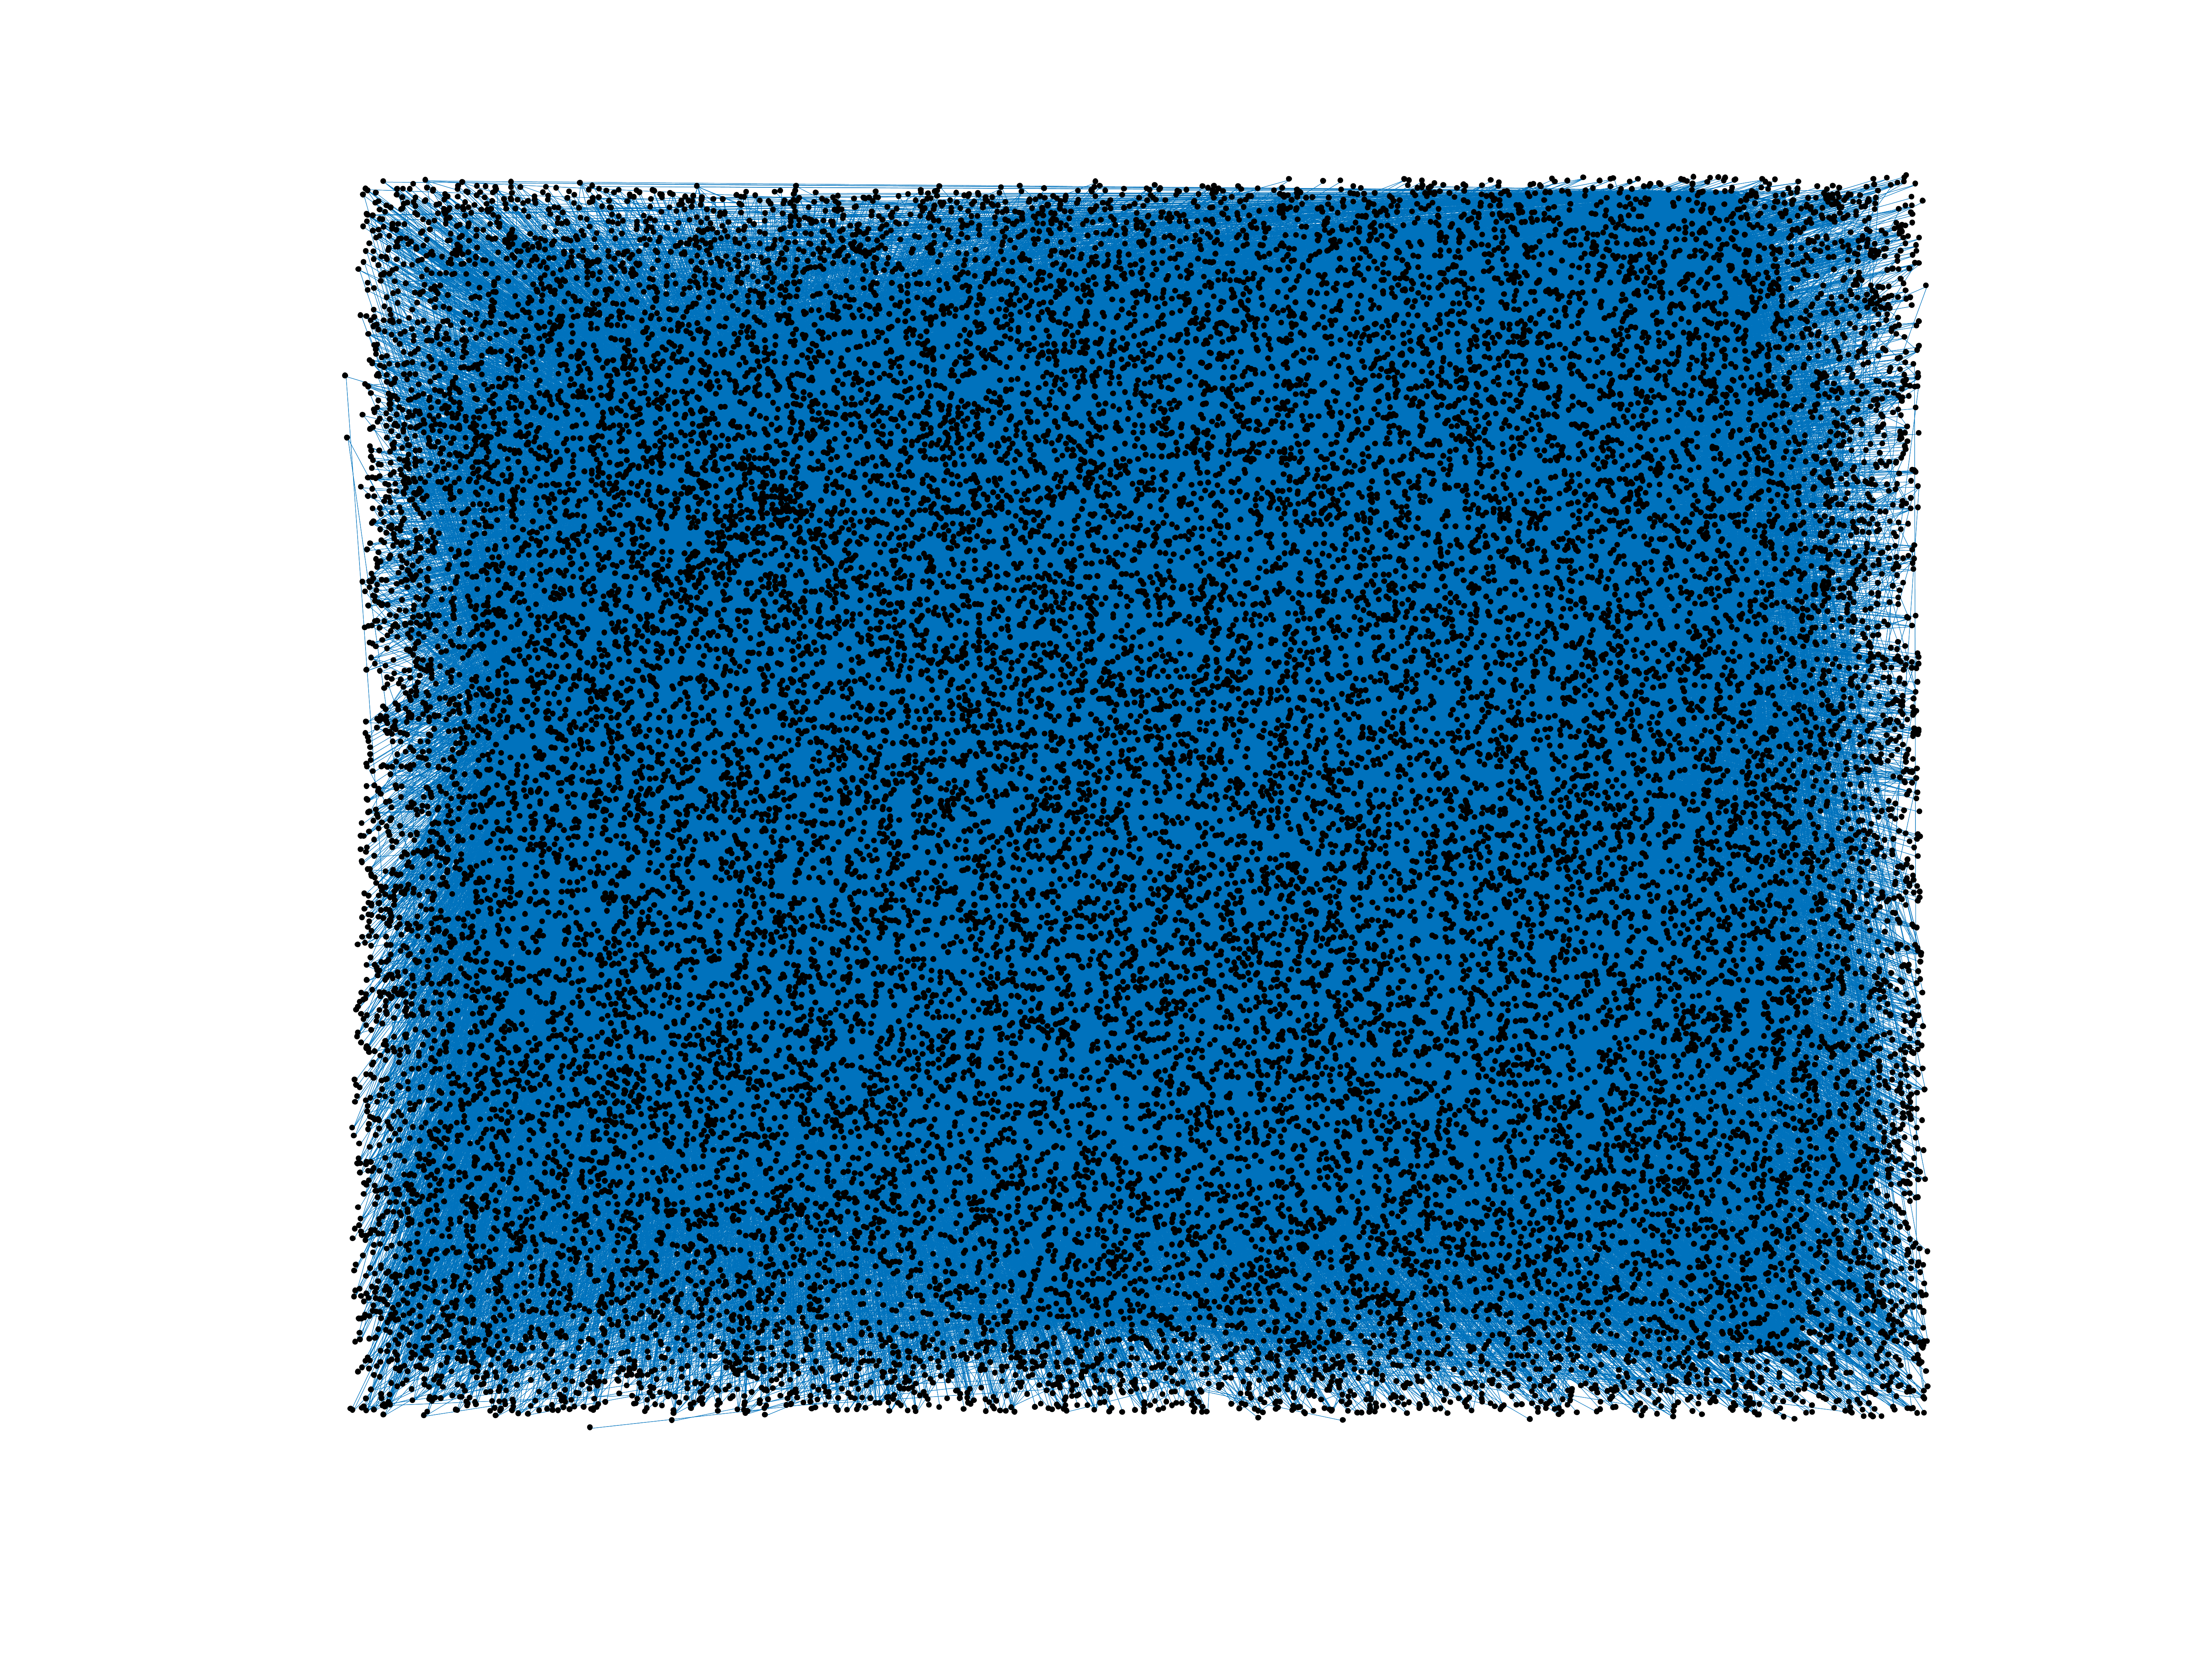
Wiktionary edits (scn)
This is the bipartite edit network of the Sicilian Wiktionary. It contains
users and pages from the Sicilian Wiktionary, connected by edit events. Each
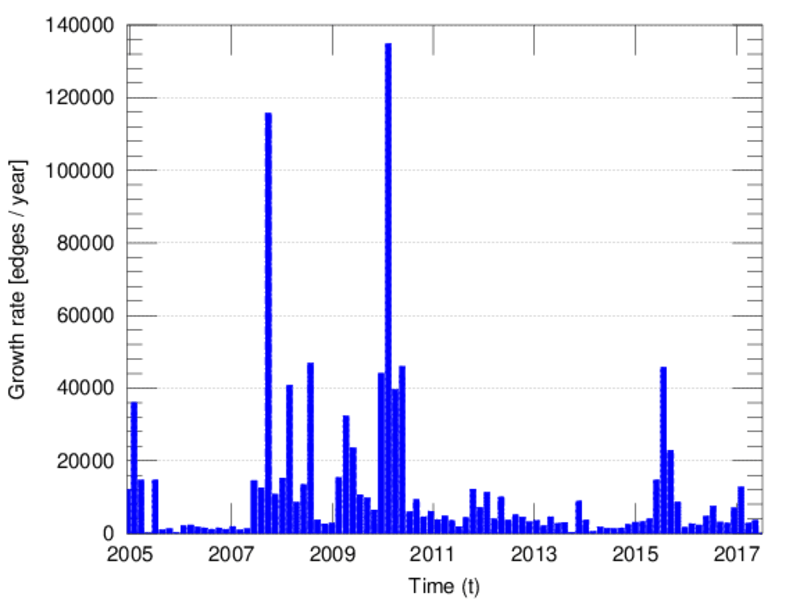
edge represents an edit. The dataset includes the timestamp of each edit.
Metadata
Statistics
| Size | n = | 28,112
|
| Left size | n1 = | 405
|
| Right size | n2 = | 27,707
|
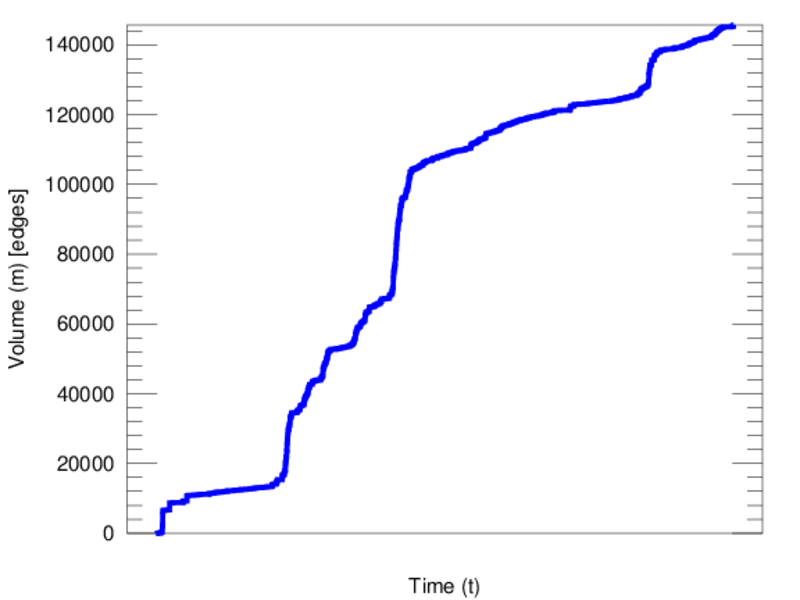
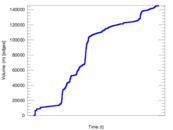
| Volume | m = | 145,672
|
| Unique edge count | m̿ = | 62,152
|
| Wedge count | s = | 404,010,381
|
| Claw count | z = | 3,125,987,139,118
|
| Cross count | x = | 20,138,866,515,404,768
|
| Square count | q = | 82,338,279
|
| 4-Tour count | T4 = | 2,274,873,364
|
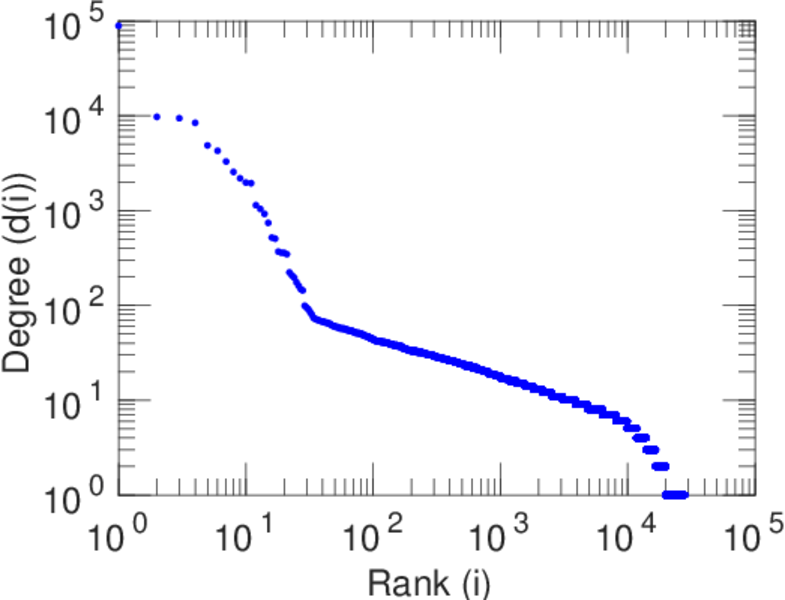
| Maximum degree | dmax = | 88,928
|
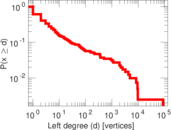
| Maximum left degree | d1max = | 88,928
|
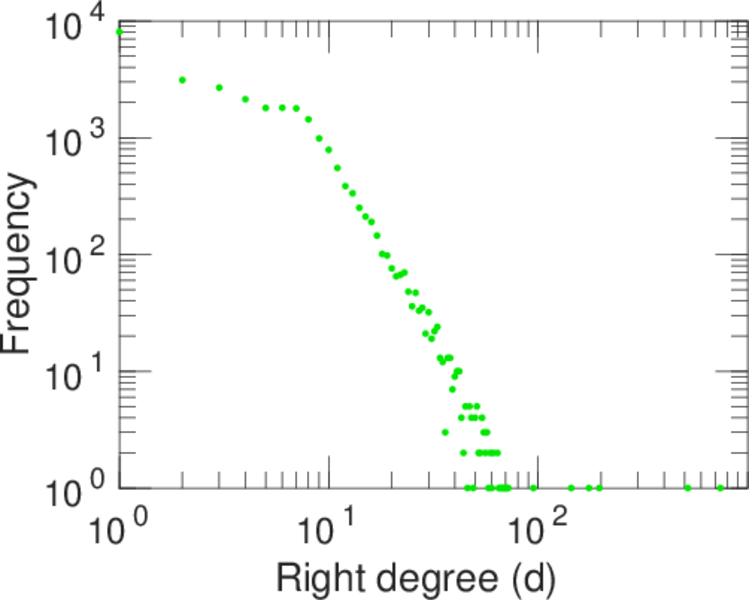
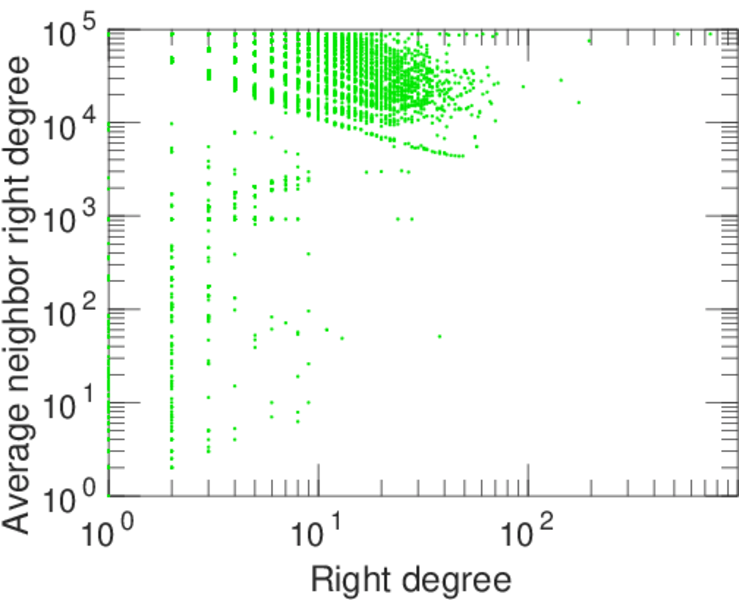
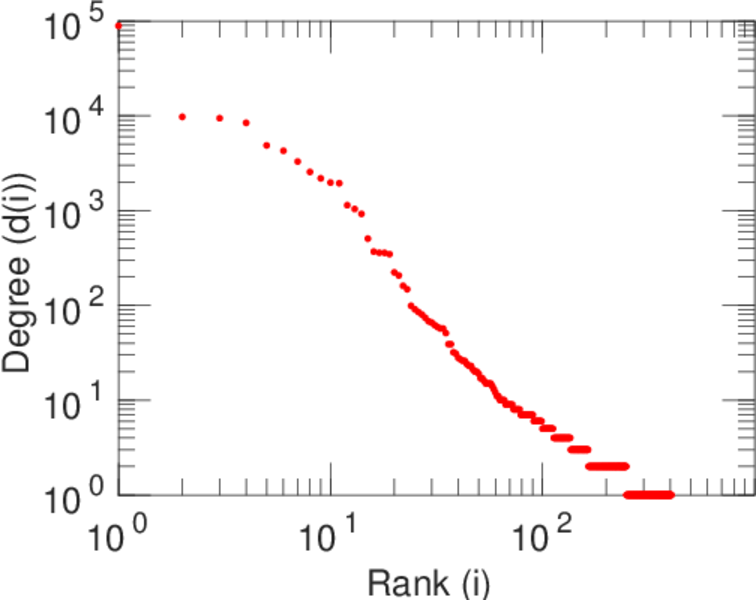
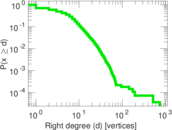
| Maximum right degree | d2max = | 742
|
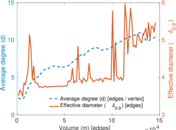
| Average degree | d = | 10.363 7
|
| Average left degree | d1 = | 359.684
|
| Average right degree | d2 = | 5.257 59
|
| Fill | p = | 0.005 538 73
|
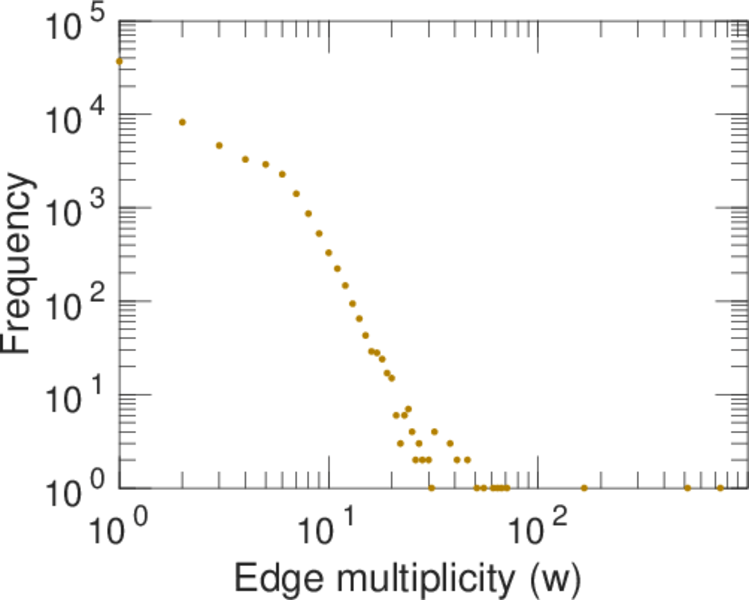
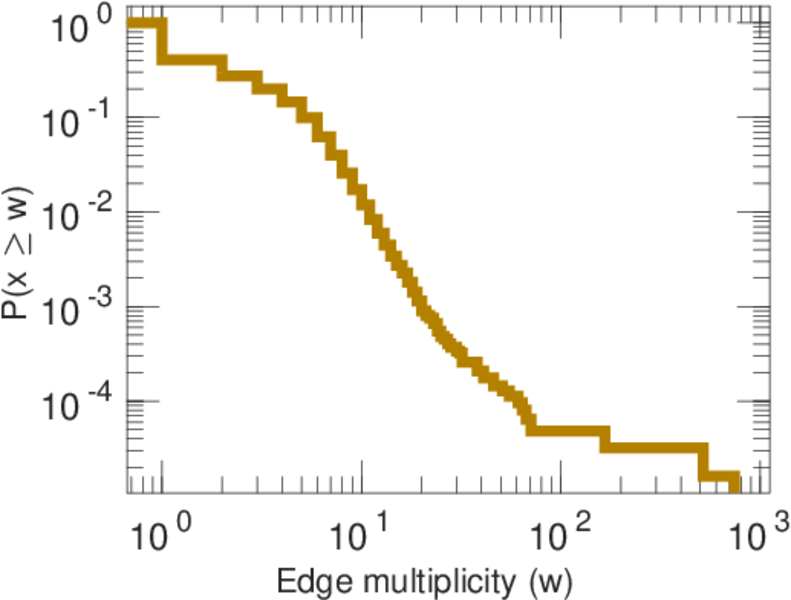
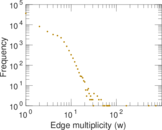
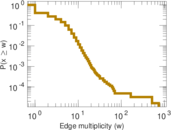
| Average edge multiplicity | m̃ = | 2.343 80
|
| Size of LCC | N = | 27,732
|
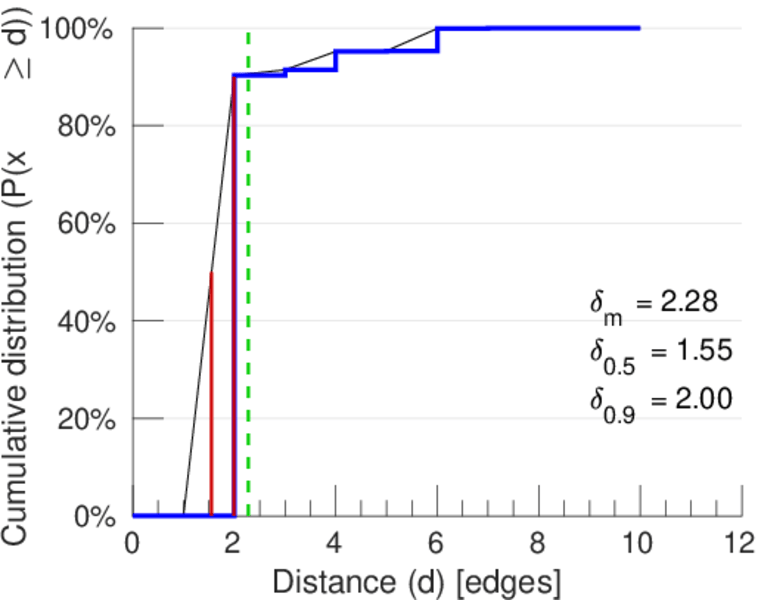
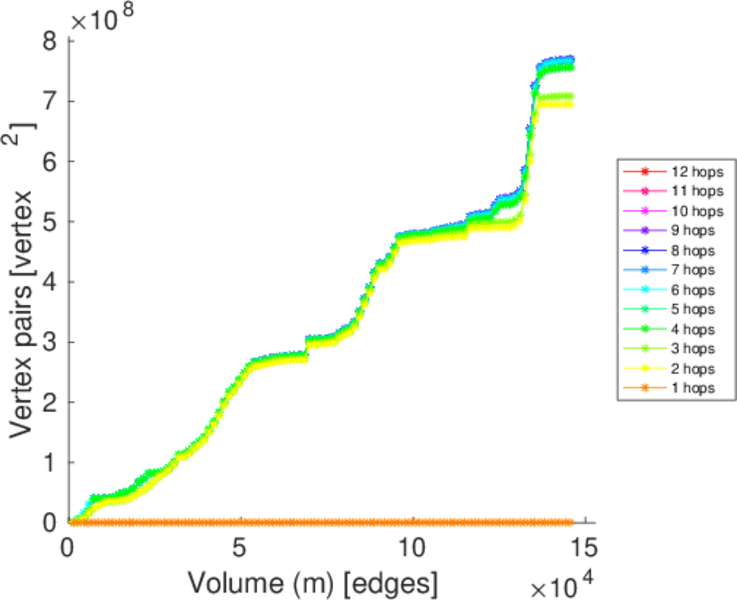
| Diameter | δ = | 12
|
| 50-Percentile effective diameter | δ0.5 = | 1.553 69
|
| 90-Percentile effective diameter | δ0.9 = | 1.996 79
|
| Median distance | δM = | 2
|
| Mean distance | δm = | 2.279 52
|
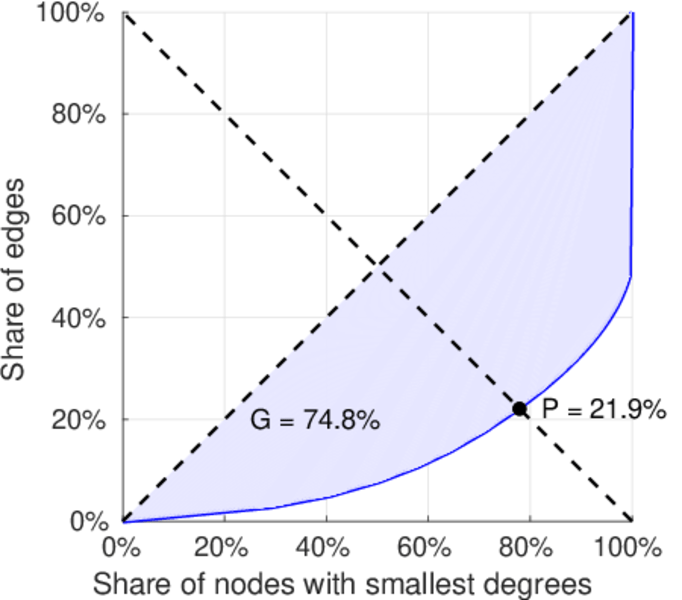
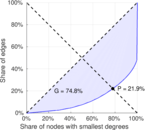
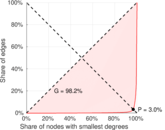
| Gini coefficient | G = | 0.748 367
|
| Balanced inequality ratio | P = | 0.218 975
|
| Left balanced inequality ratio | P1 = | 0.030 472 6
|
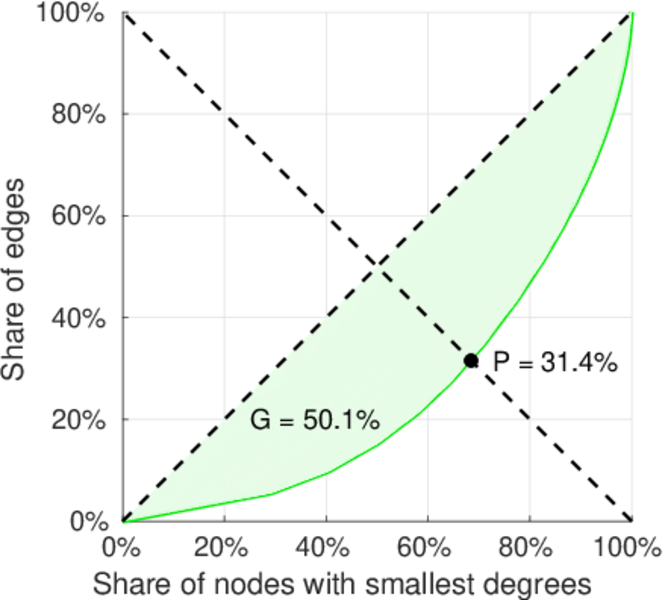
| Right balanced inequality ratio | P2 = | 0.313 979
|
| Relative edge distribution entropy | Her = | 0.668 877
|
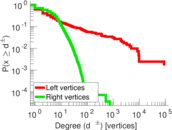
| Power law exponent | γ = | 2.712 29
|
| Tail power law exponent | γt = | 3.181 00
|
| Tail power law exponent with p | γ3 = | 3.181 00
|
| p-value | p = | 0.000 00
|
| Left tail power law exponent with p | γ3,1 = | 1.641 00
|
| Left p-value | p1 = | 0.000 00
|
| Right tail power law exponent with p | γ3,2 = | 3.291 00
|
| Right p-value | p2 = | 0.000 00
|
| Degree assortativity | ρ = | −0.467 690
|
| Degree assortativity p-value | pρ = | 0.000 00
|
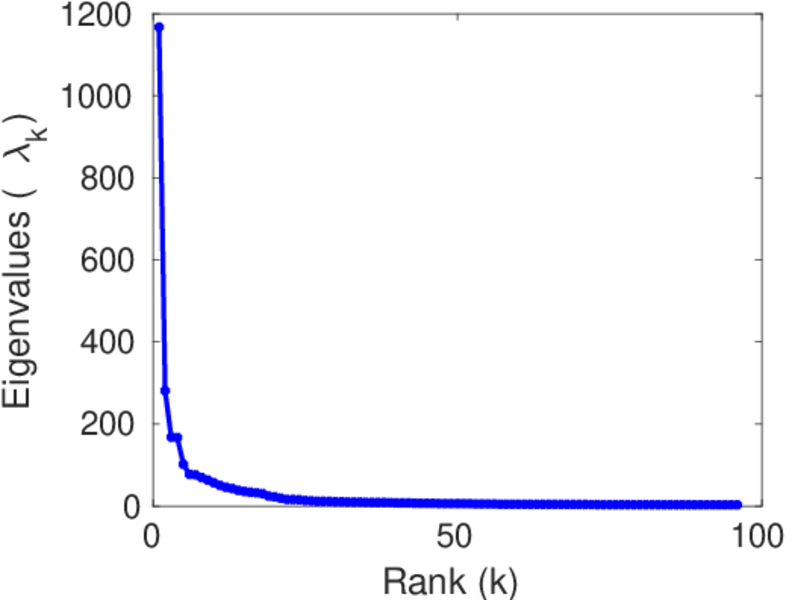
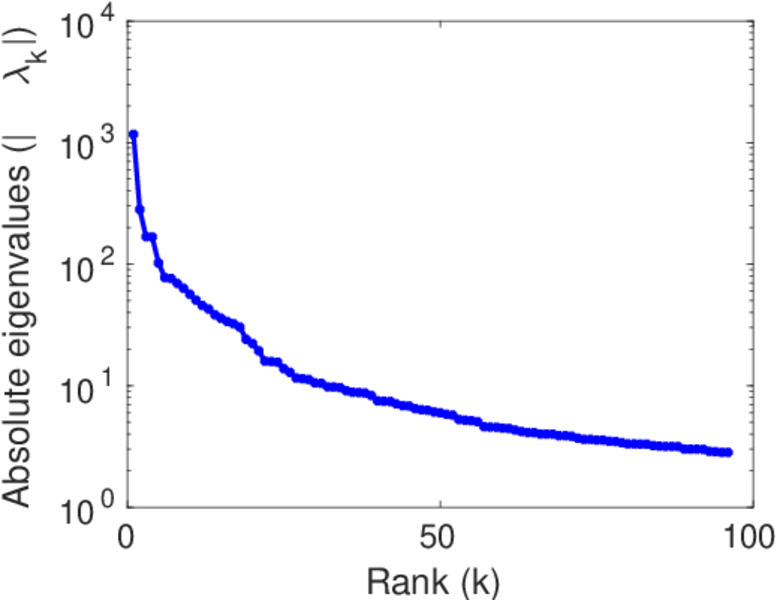
| Spectral norm | α = | 1,166.84
|
| Algebraic connectivity | a = | 0.043 915 5
|
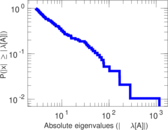
| Spectral separation | |λ1[A] / λ2[A]| = | 4.149 02
|
| Controllability | C = | 27,234
|
| Relative controllability | Cr = | 0.972 434
|
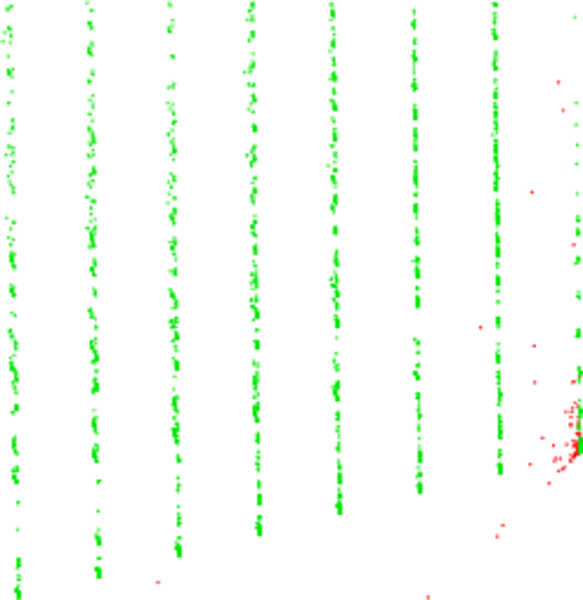
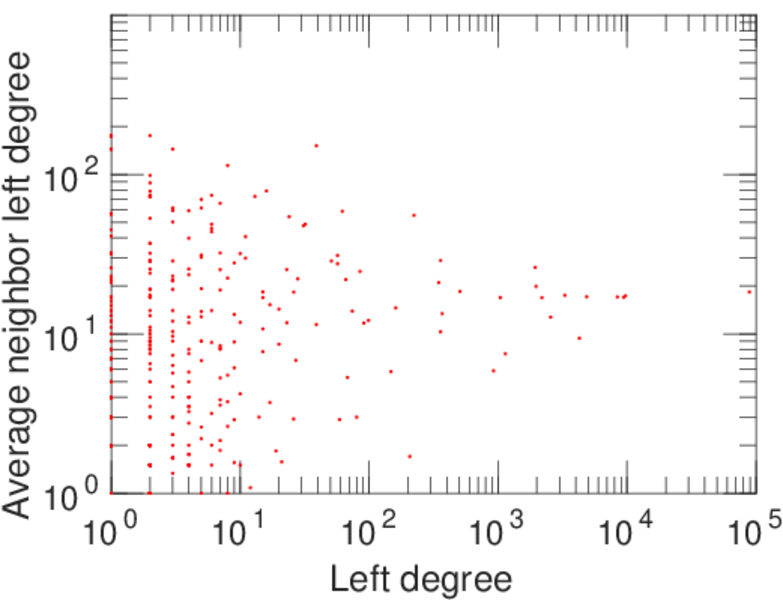
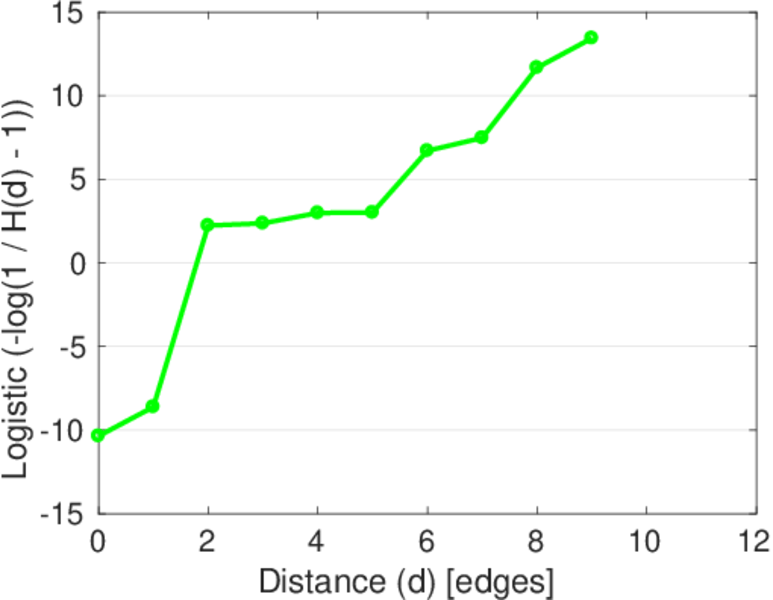
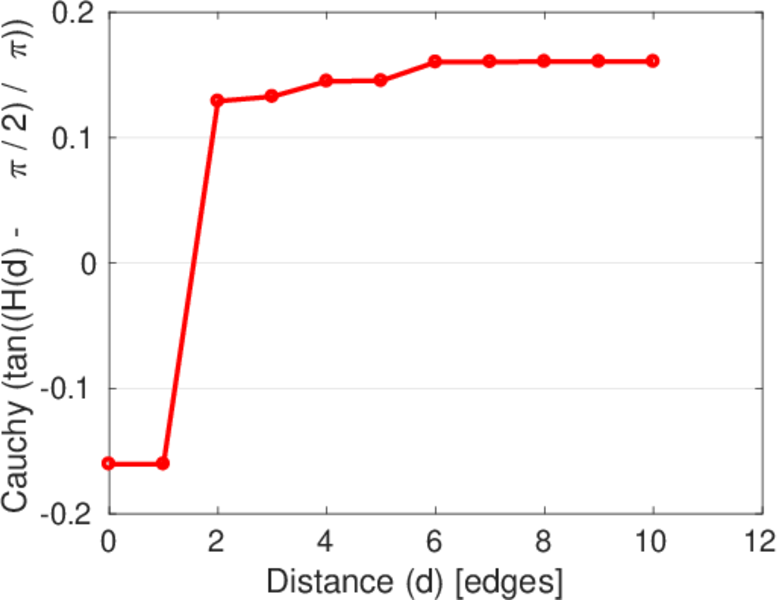
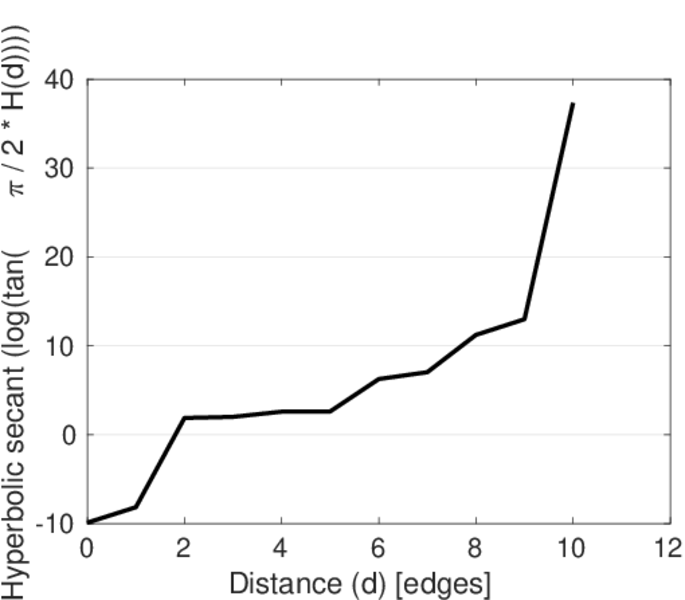
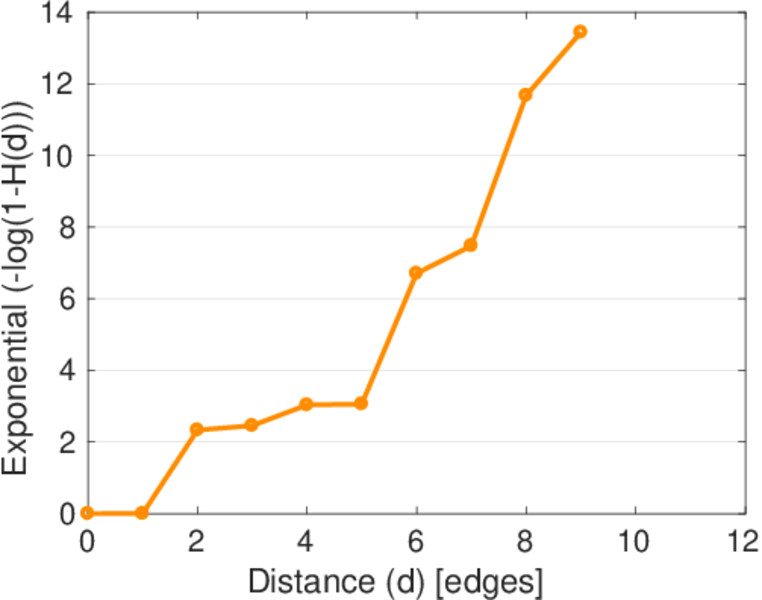
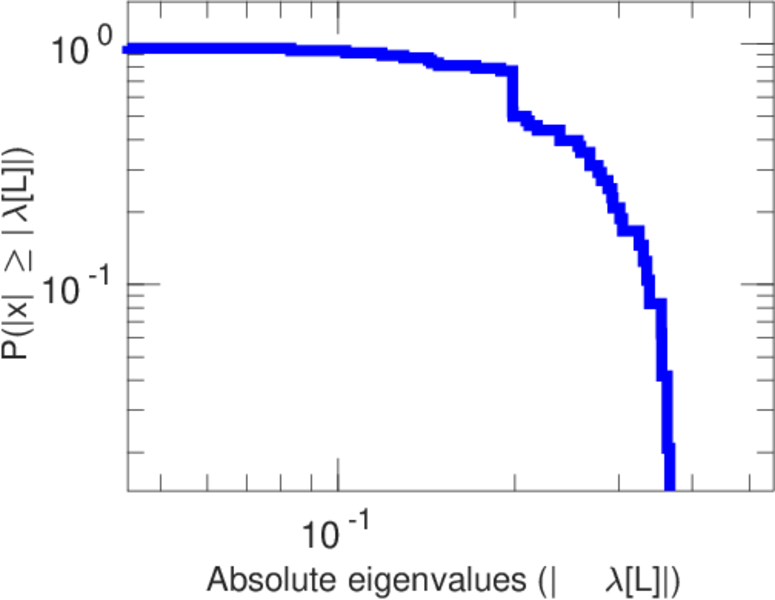
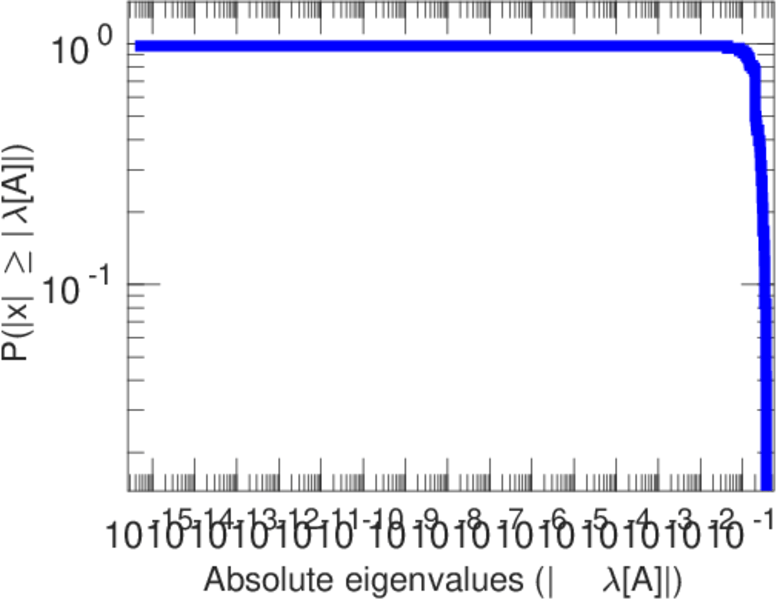
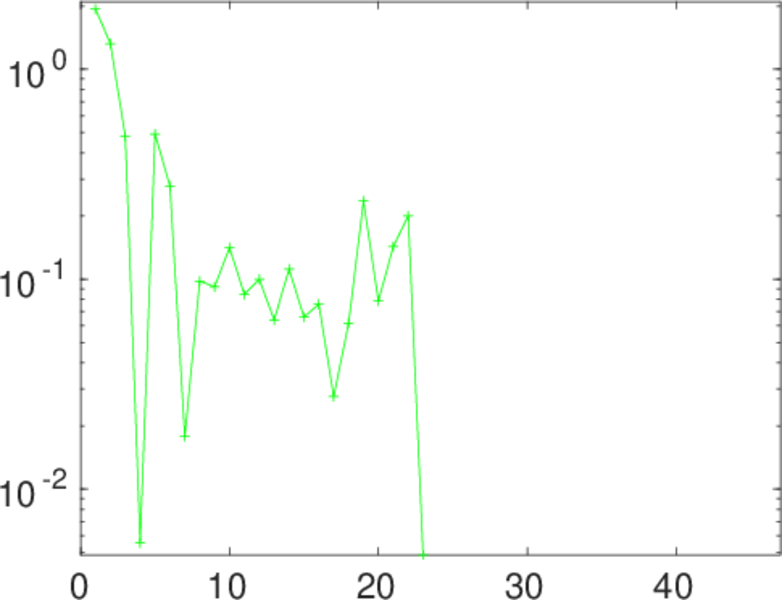
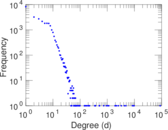
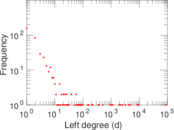
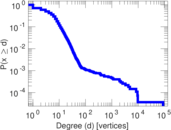
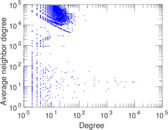
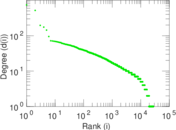
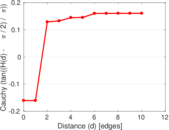
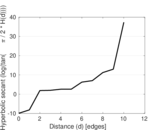
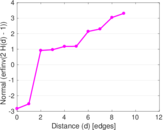
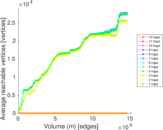
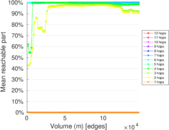
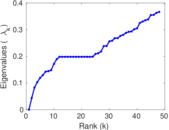
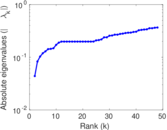
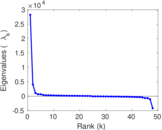
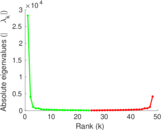
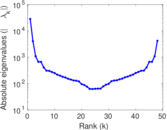
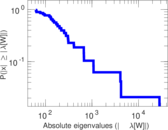
Plots


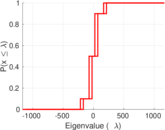
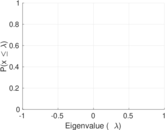
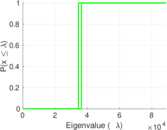


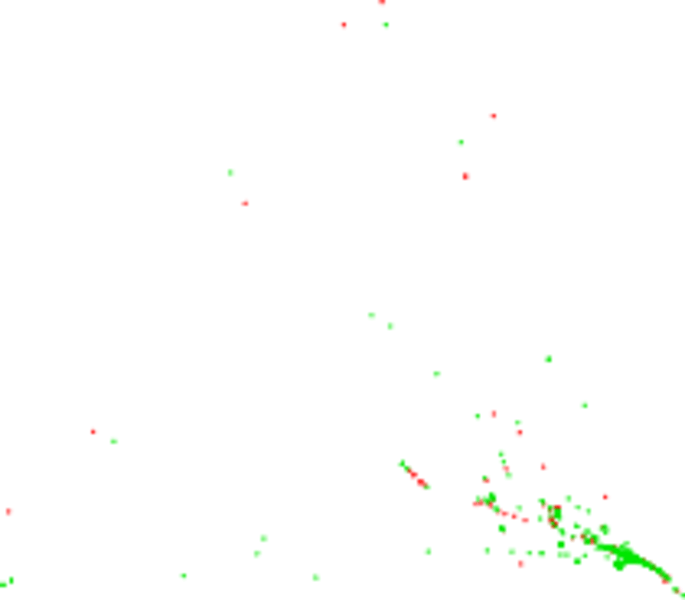
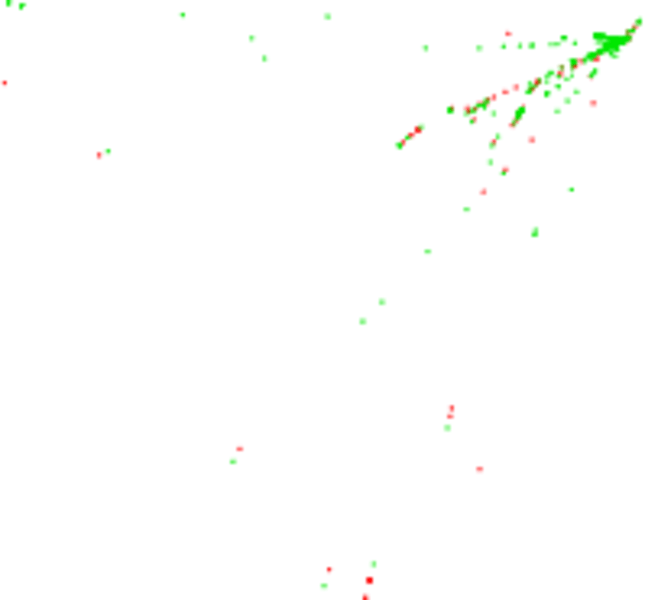
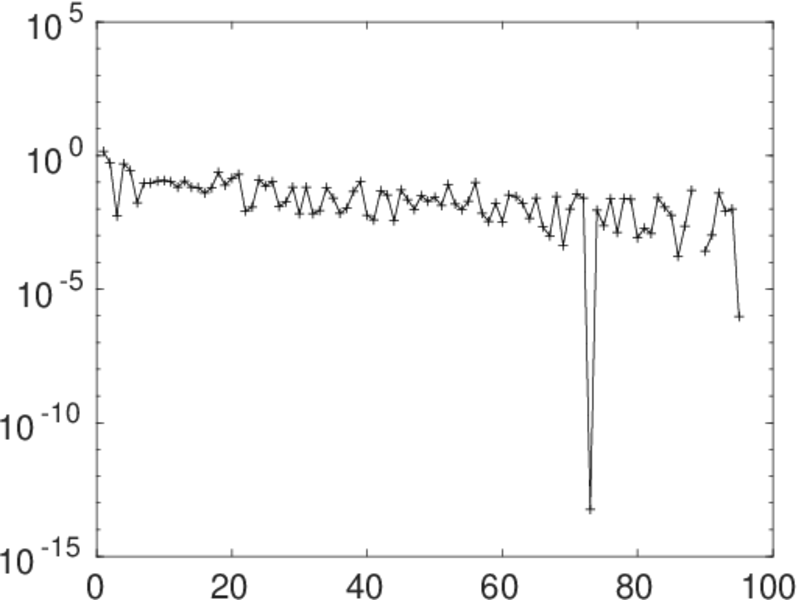
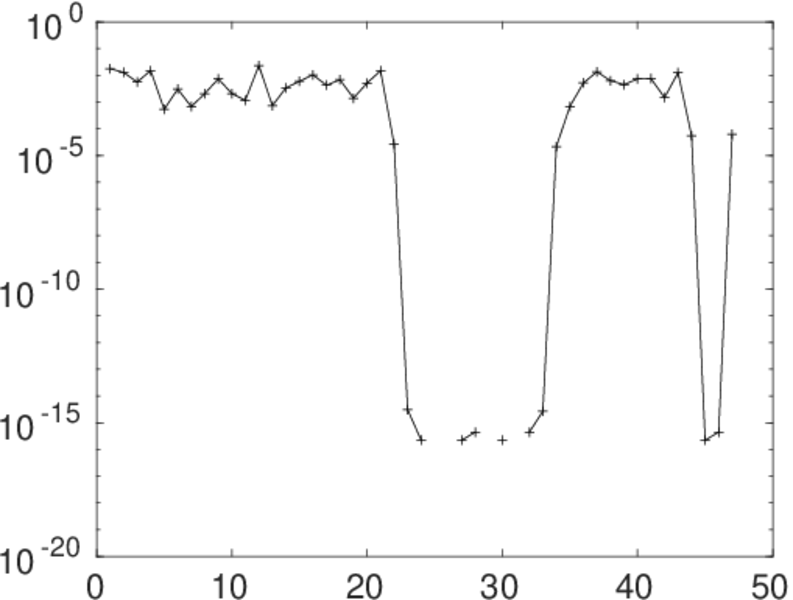
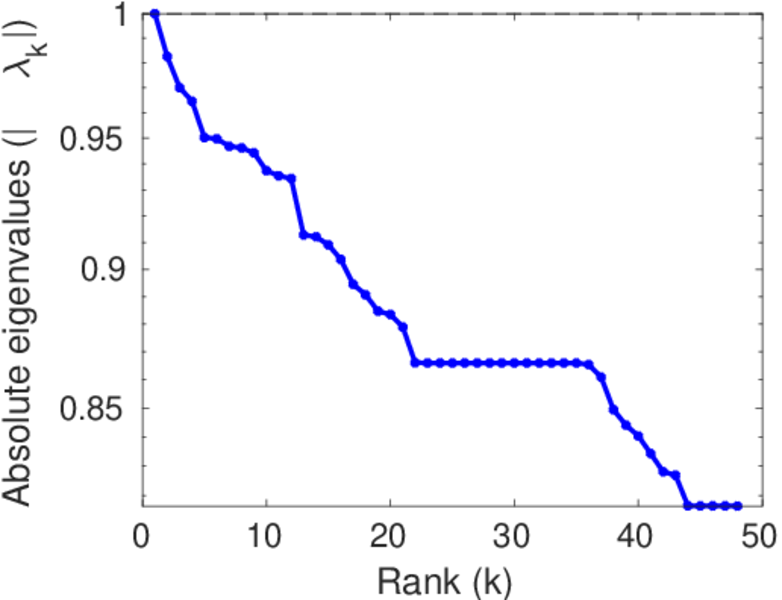
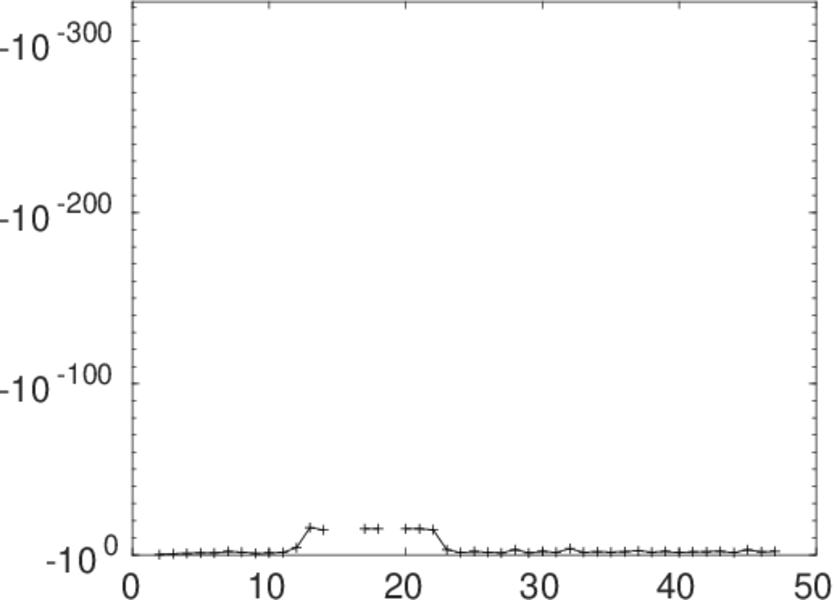
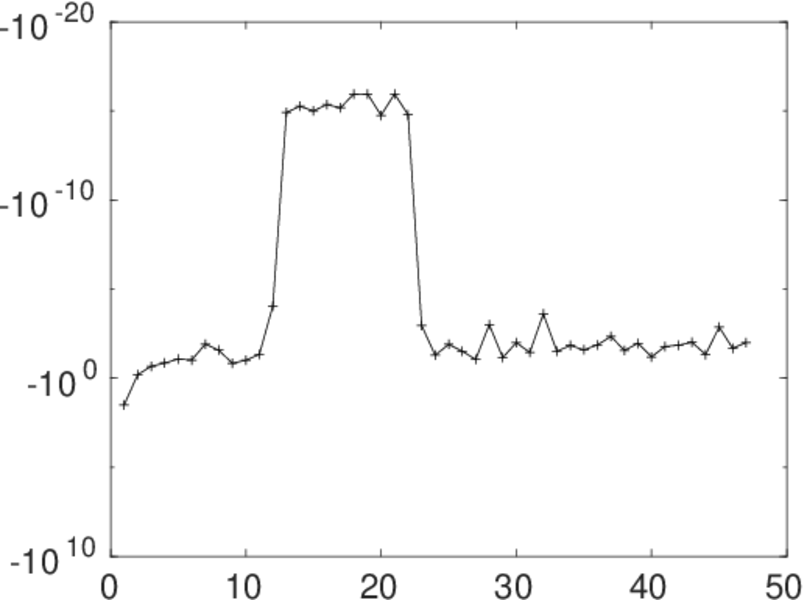
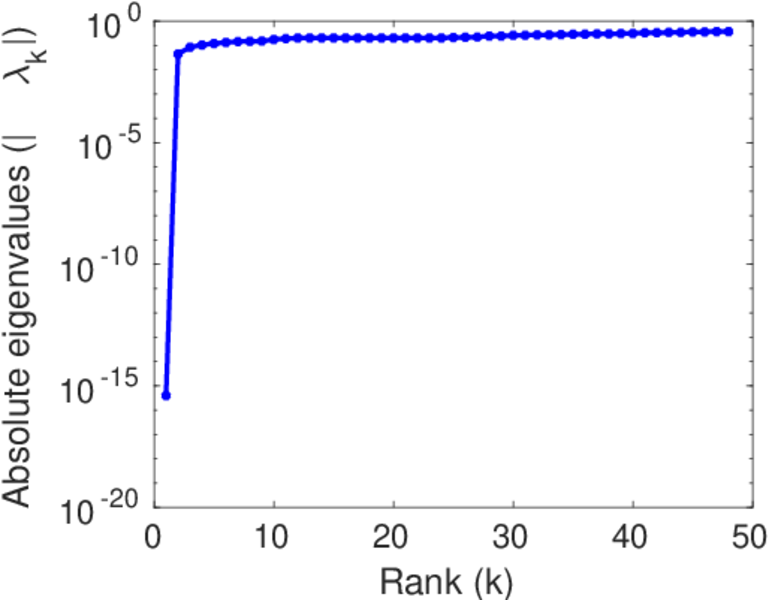
Matrix decompositions plots


Downloads
References
|
[1]
|
Jérôme Kunegis.
KONECT – The Koblenz Network Collection.
In Proc. Int. Conf. on World Wide Web Companion, pages
1343–1350, 2013.
[ http ]
|
|
[2]
|
Wikimedia Foundation.
Wikimedia downloads.
http://dumps.wikimedia.org/, January 2010.
|
 KONECT ‣ Networks ‣
Buy Me a Coffee
KONECT ‣ Networks ‣
Buy Me a Coffee