Wikipedia edits (sco)
This is the bipartite edit network of the Scots Wikipedia. It contains users
and pages from the Scots Wikipedia, connected by edit events. Each edge
represents an edit. The dataset includes the timestamp of each edit.
Metadata
Statistics
| Size | n = | 169,949
|
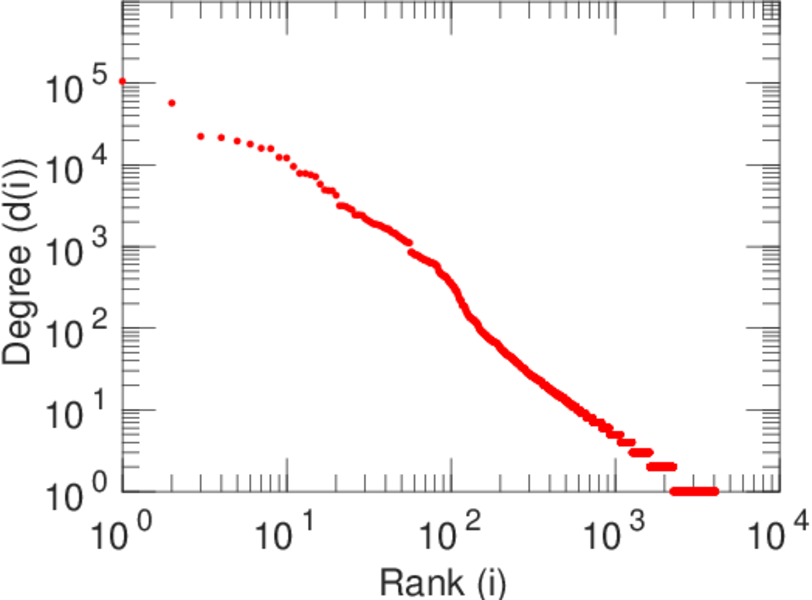
| Left size | n1 = | 4,055
|
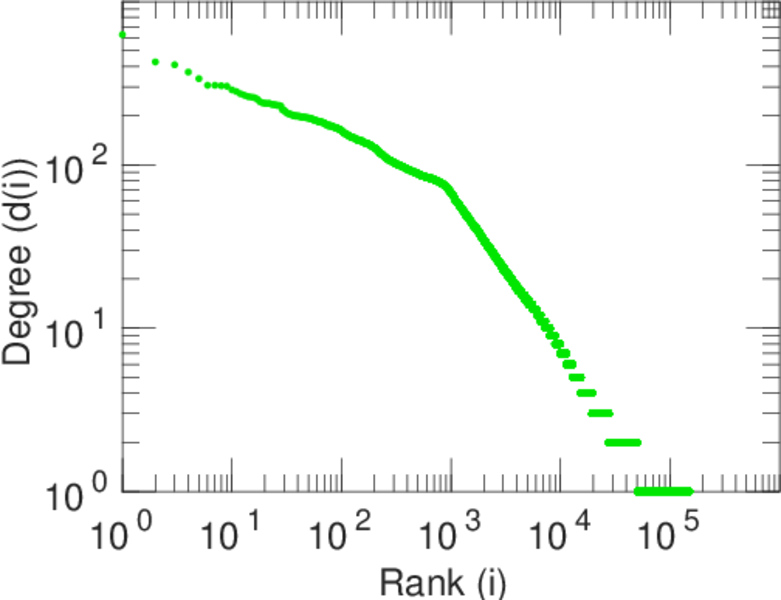
| Right size | n2 = | 165,894
|
| Volume | m = | 487,512
|
| Unique edge count | m̿ = | 315,873
|
| Wedge count | s = | 4,807,032,612
|
| Claw count | z = | 99,116,342,765,027
|
| Cross count | x = | 1,690,291,229,694,369,536
|
| Square count | q = | 693,570,867
|
| 4-Tour count | T4 = | 24,777,366,282
|
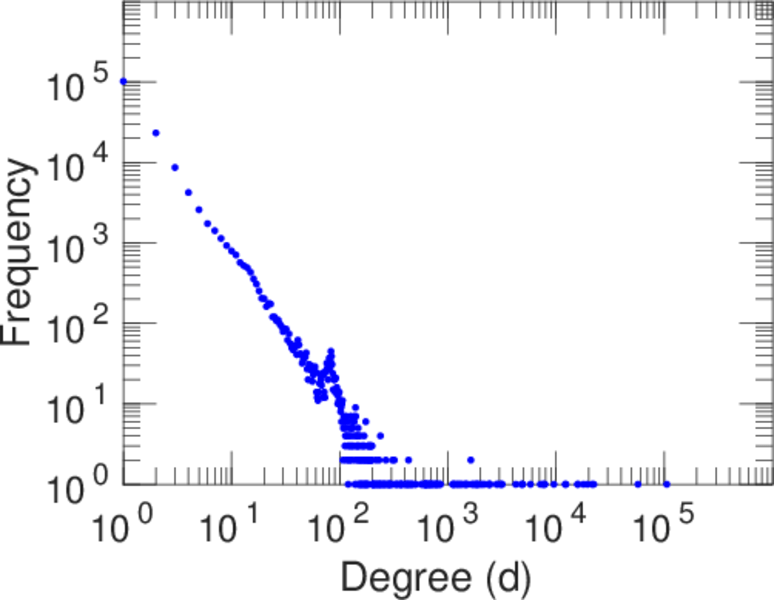
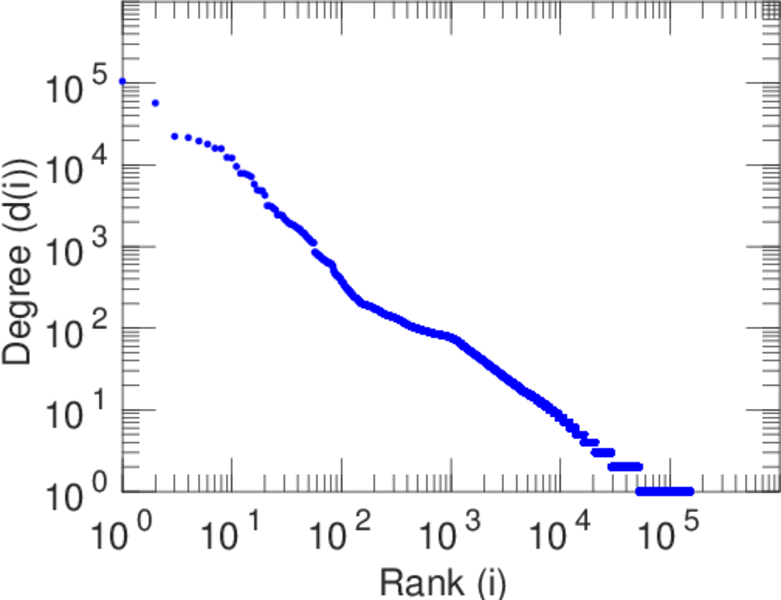
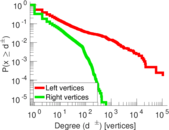
| Maximum degree | dmax = | 105,549
|
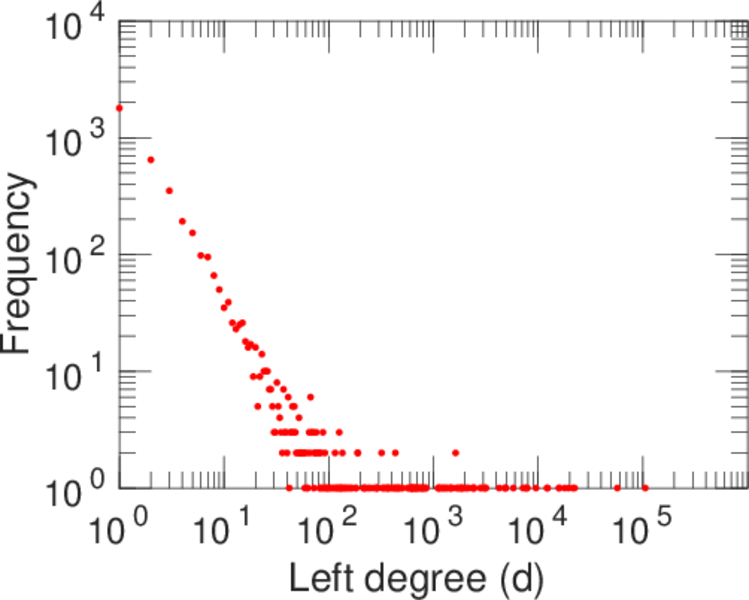
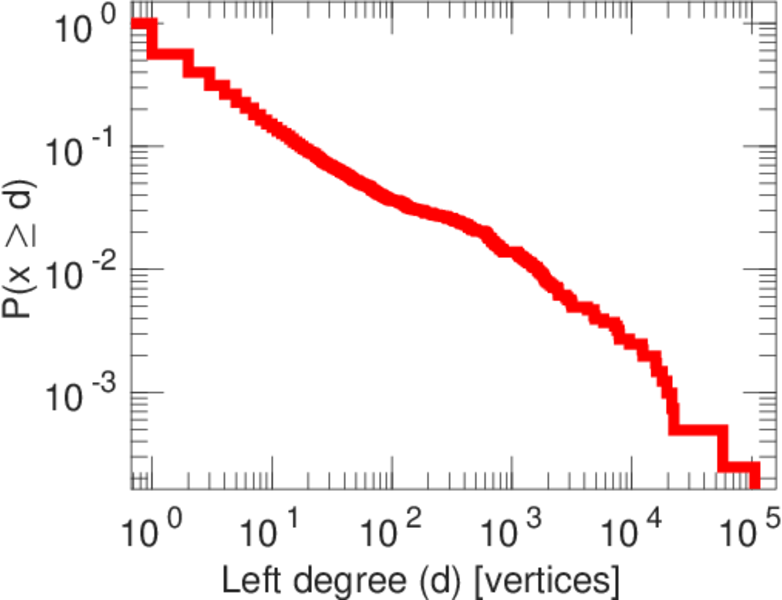
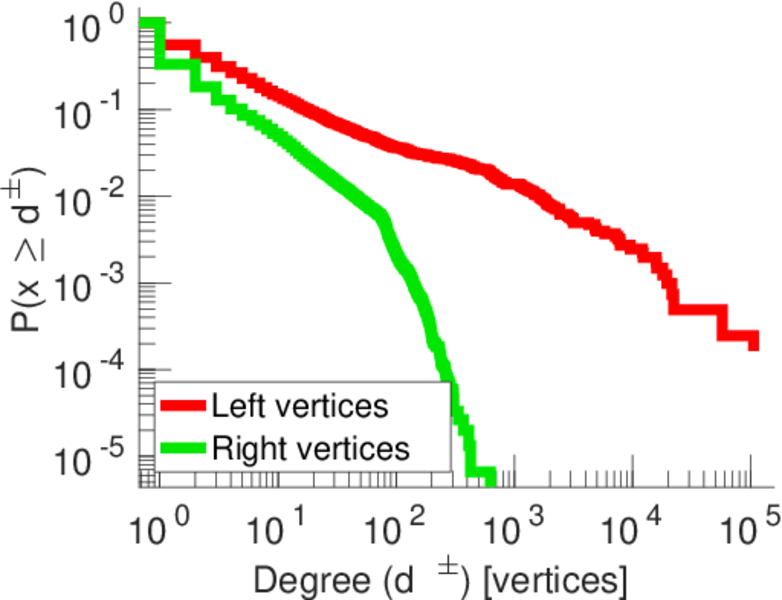
| Maximum left degree | d1max = | 105,549
|
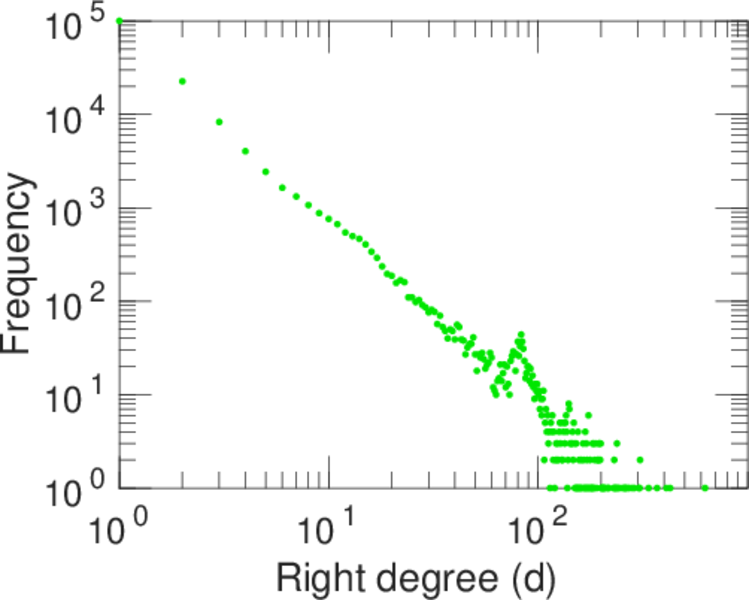
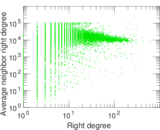
| Maximum right degree | d2max = | 627
|
| Average degree | d = | 5.737 16
|
| Average left degree | d1 = | 120.225
|
| Average right degree | d2 = | 2.938 70
|
| Fill | p = | 0.000 469 560
|
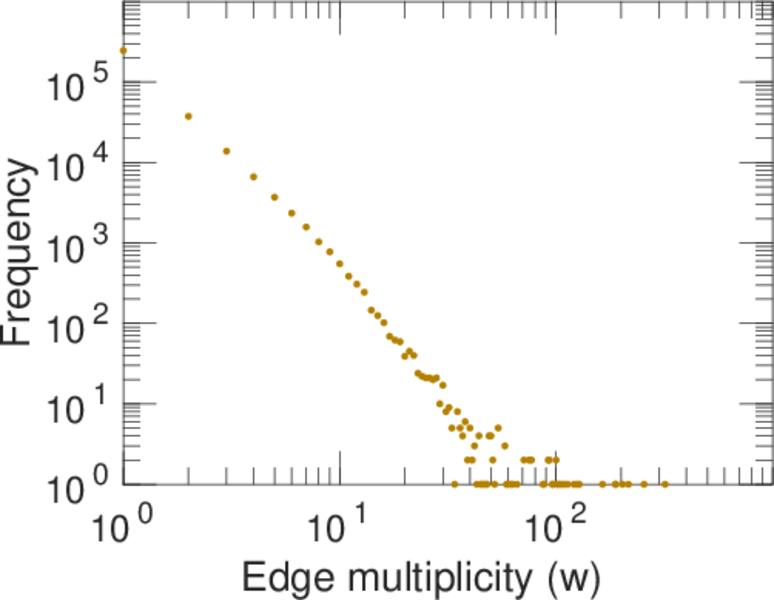
| Average edge multiplicity | m̃ = | 1.543 38
|
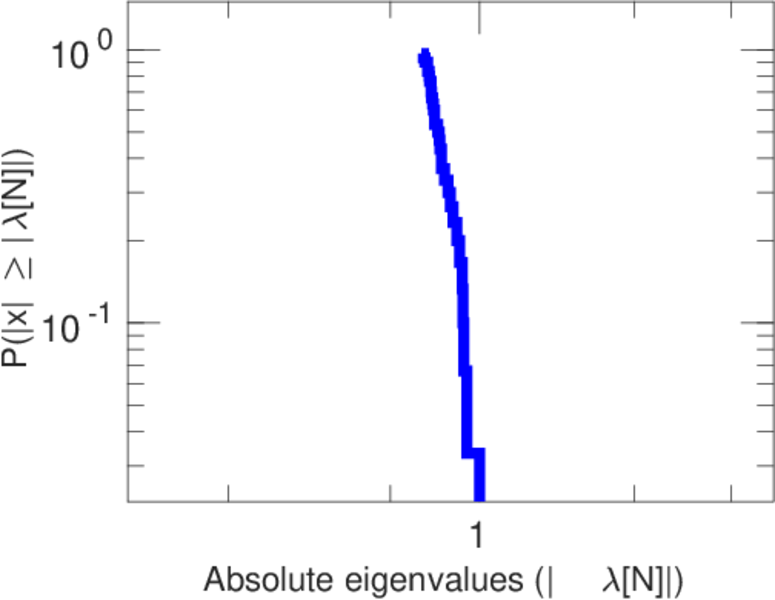
| Size of LCC | N = | 153,984
|
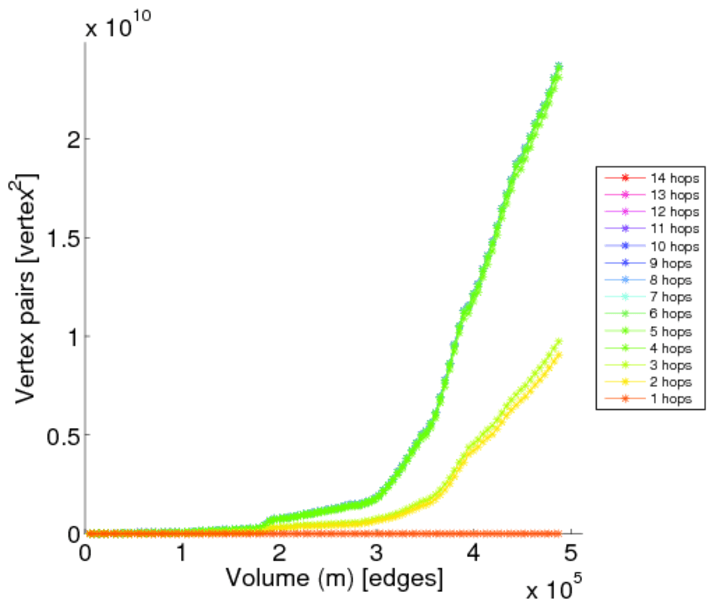
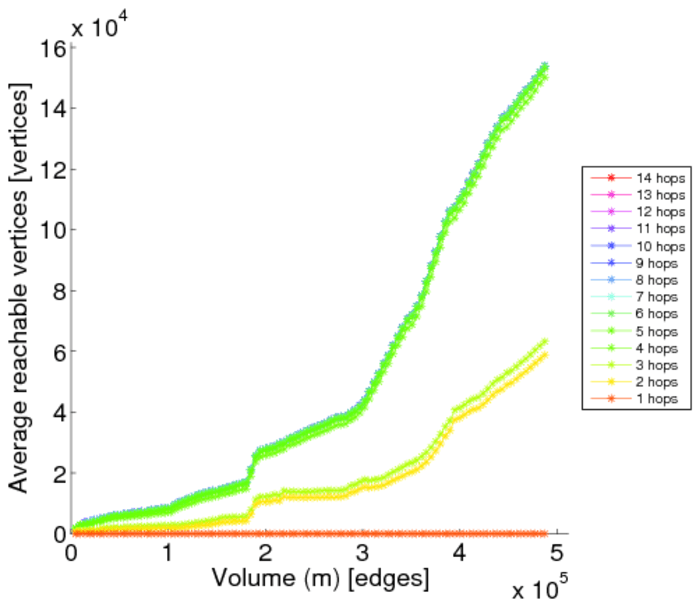
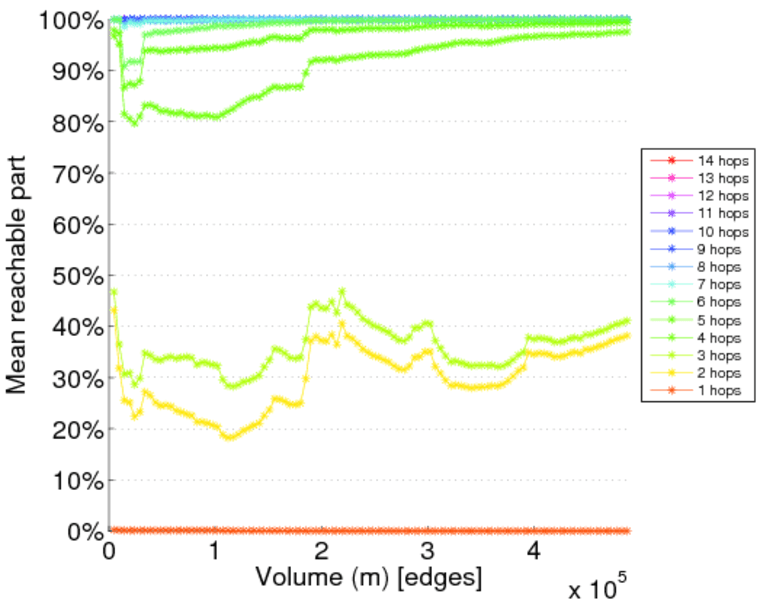
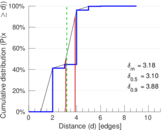
| Diameter | δ = | 11
|
| 50-Percentile effective diameter | δ0.5 = | 3.101 90
|
| 90-Percentile effective diameter | δ0.9 = | 3.880 33
|
| Median distance | δM = | 4
|
| Mean distance | δm = | 3.181 06
|
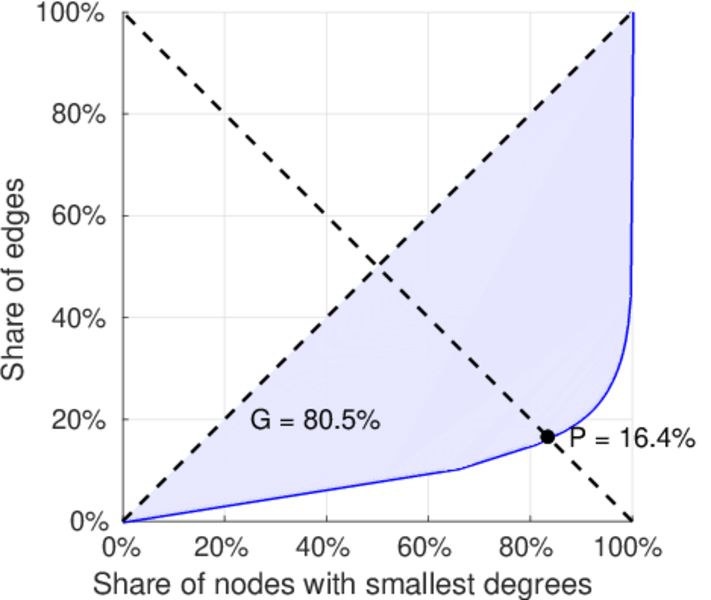
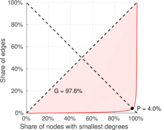
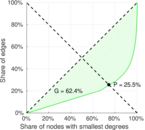
| Gini coefficient | G = | 0.809 106
|
| Balanced inequality ratio | P = | 0.160 075
|
| Left balanced inequality ratio | P1 = | 0.039 789 8
|
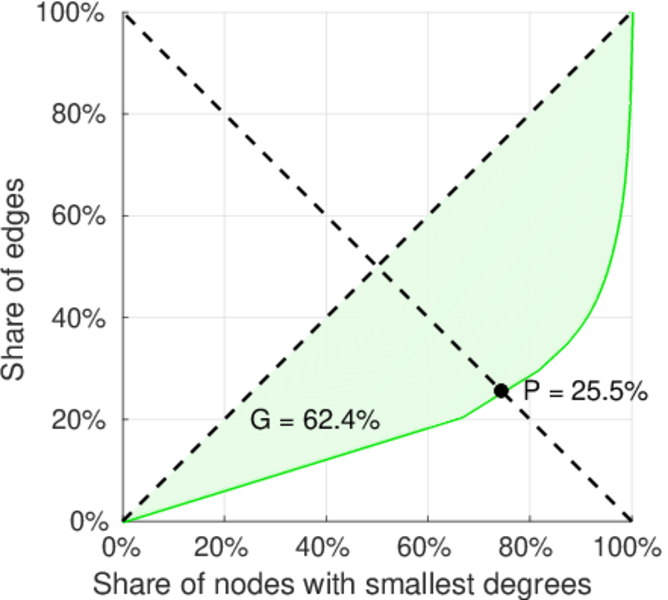
| Right balanced inequality ratio | P2 = | 0.254 796
|
| Relative edge distribution entropy | Her = | 0.681 620
|
| Power law exponent | γ = | 4.000 31
|
| Tail power law exponent | γt = | 2.381 00
|
| Tail power law exponent with p | γ3 = | 2.381 00
|
| p-value | p = | 0.000 00
|
| Left tail power law exponent with p | γ3,1 = | 1.781 00
|
| Left p-value | p1 = | 0.000 00
|
| Right tail power law exponent with p | γ3,2 = | 6.321 00
|
| Right p-value | p2 = | 0.933 000
|
| Degree assortativity | ρ = | −0.471 164
|
| Degree assortativity p-value | pρ = | 0.000 00
|
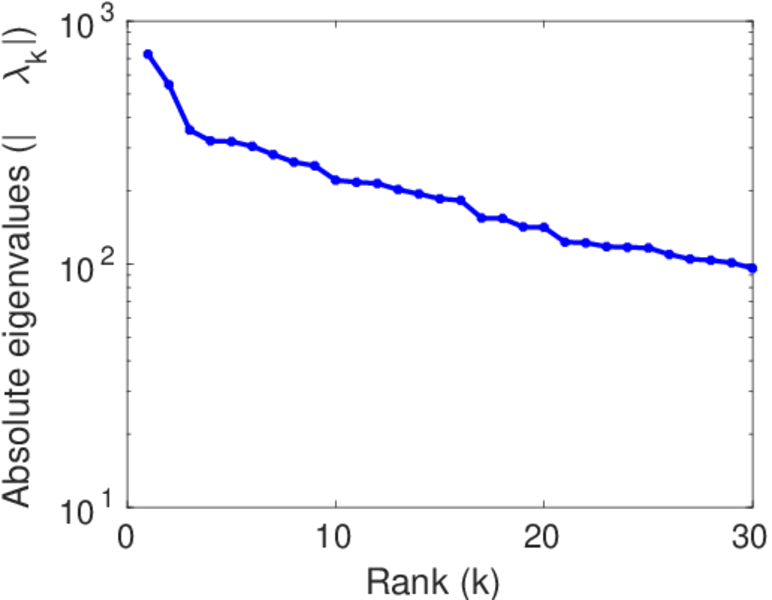
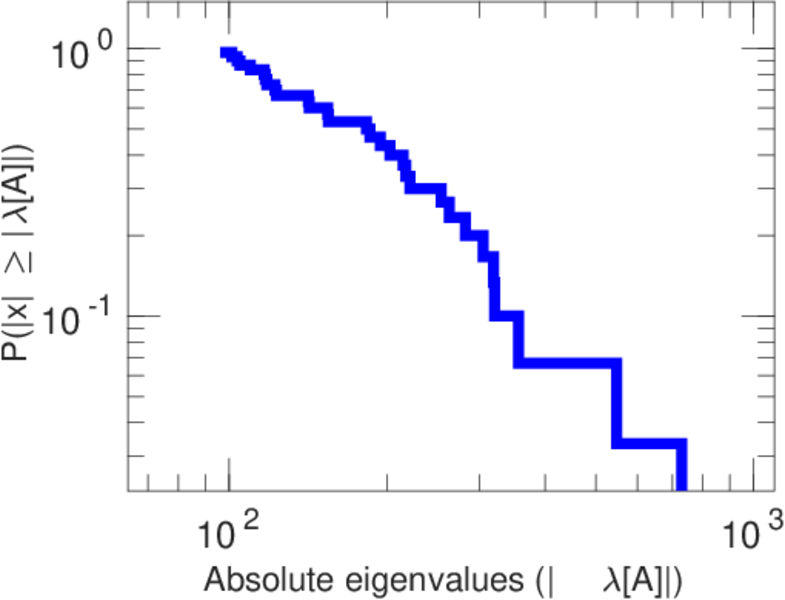
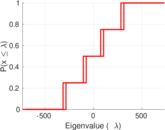
| Spectral norm | α = | 729.613
|
| Algebraic connectivity | a = | 0.046 135 6
|
| Spectral separation | |λ1[A] / λ2[A]| = | 1.332 43
|
| Controllability | C = | 148,289
|
| Relative controllability | Cr = | 0.958 051
|
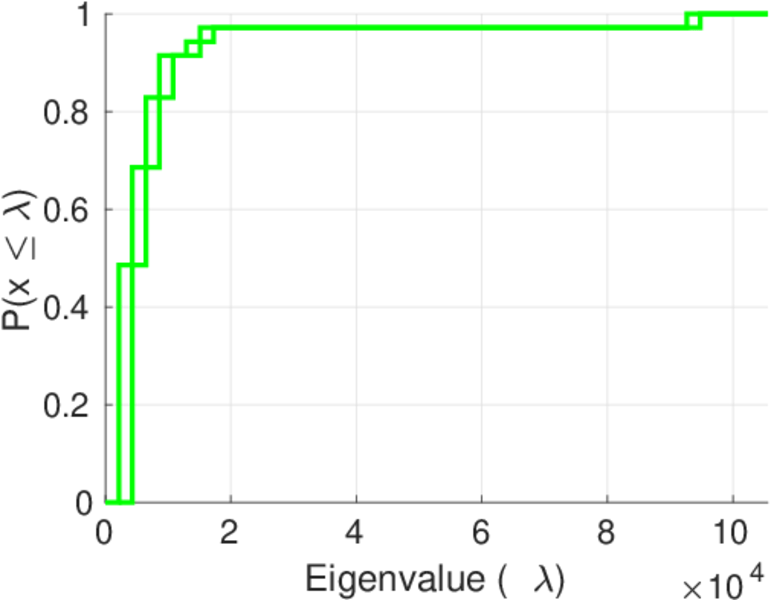
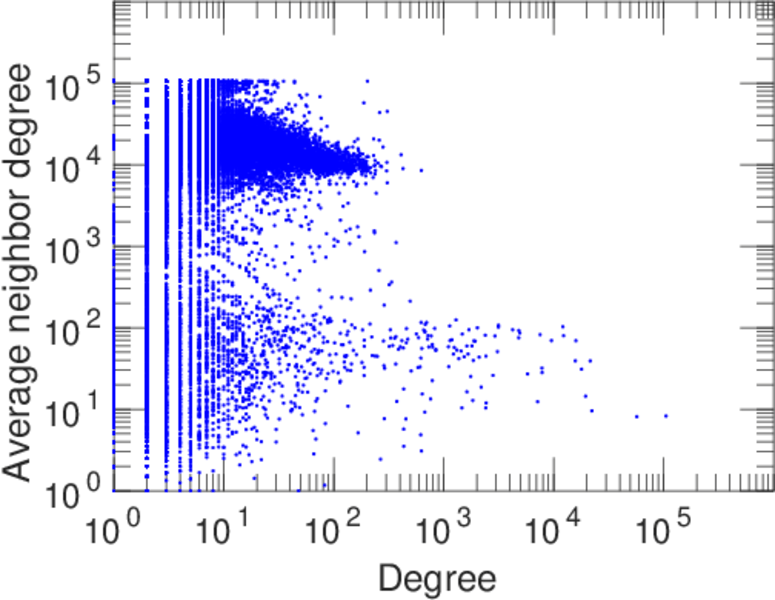
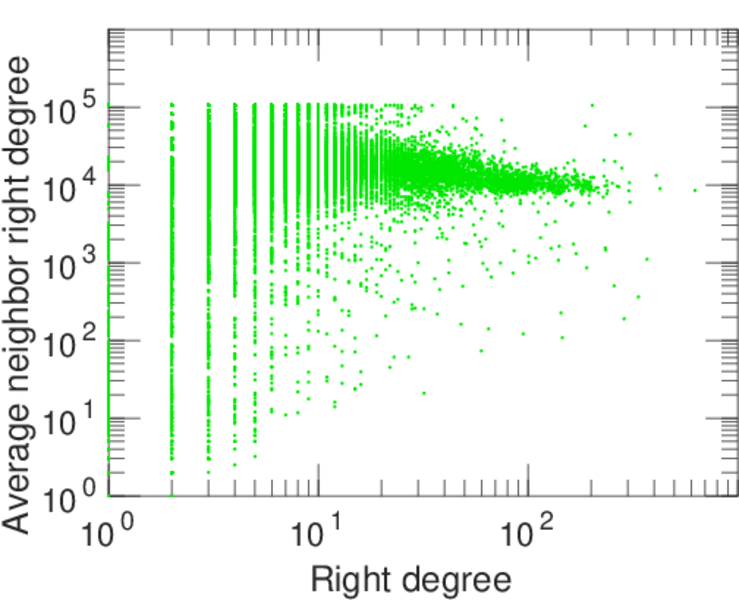
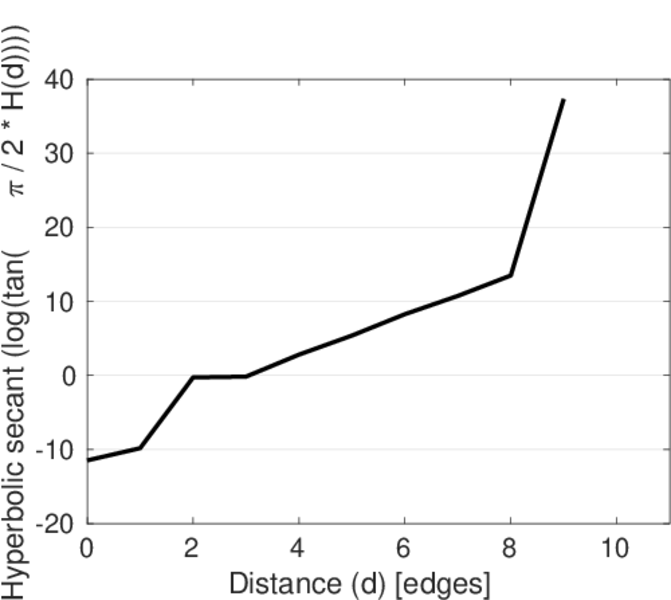
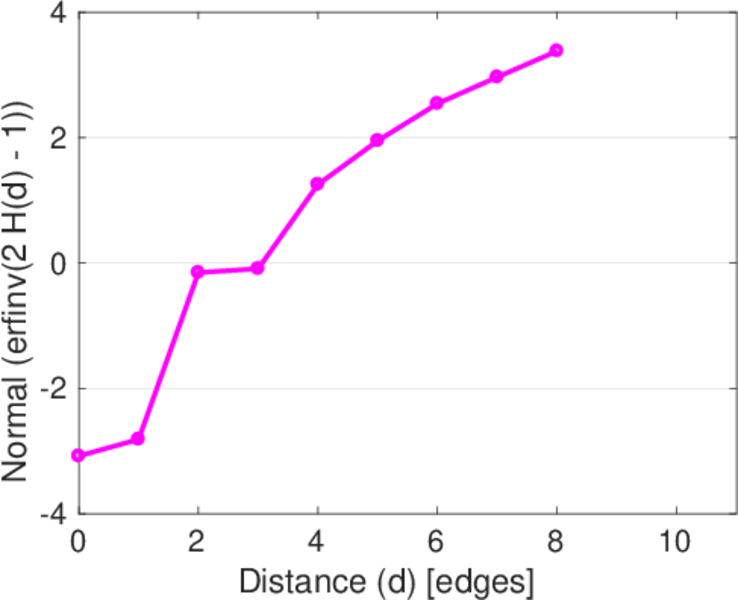
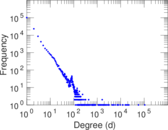
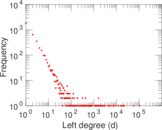
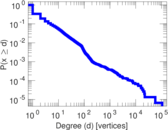
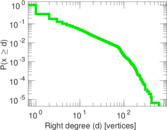
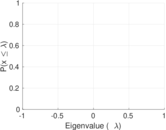
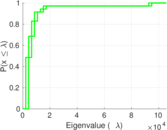
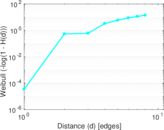
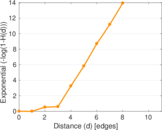
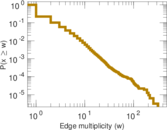
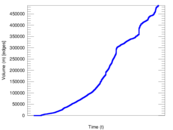
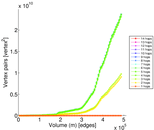
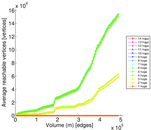
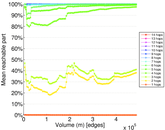
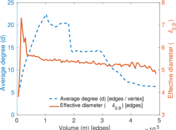
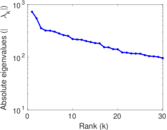
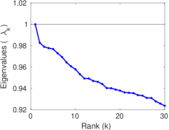
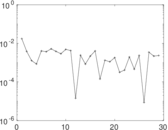
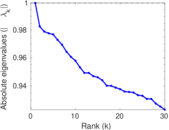
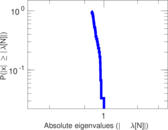
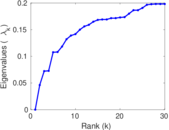
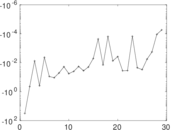
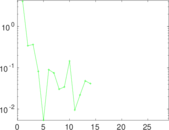
Plots


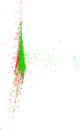
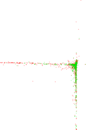


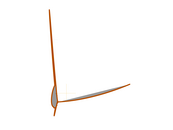


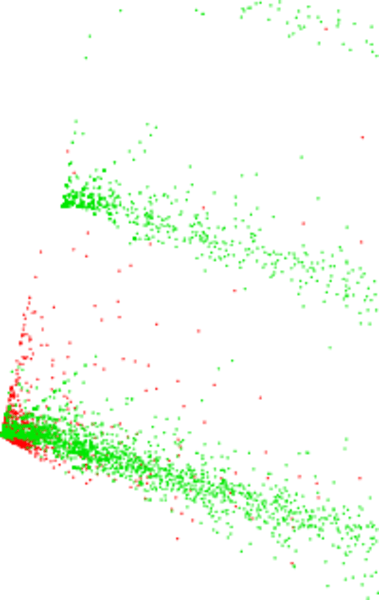
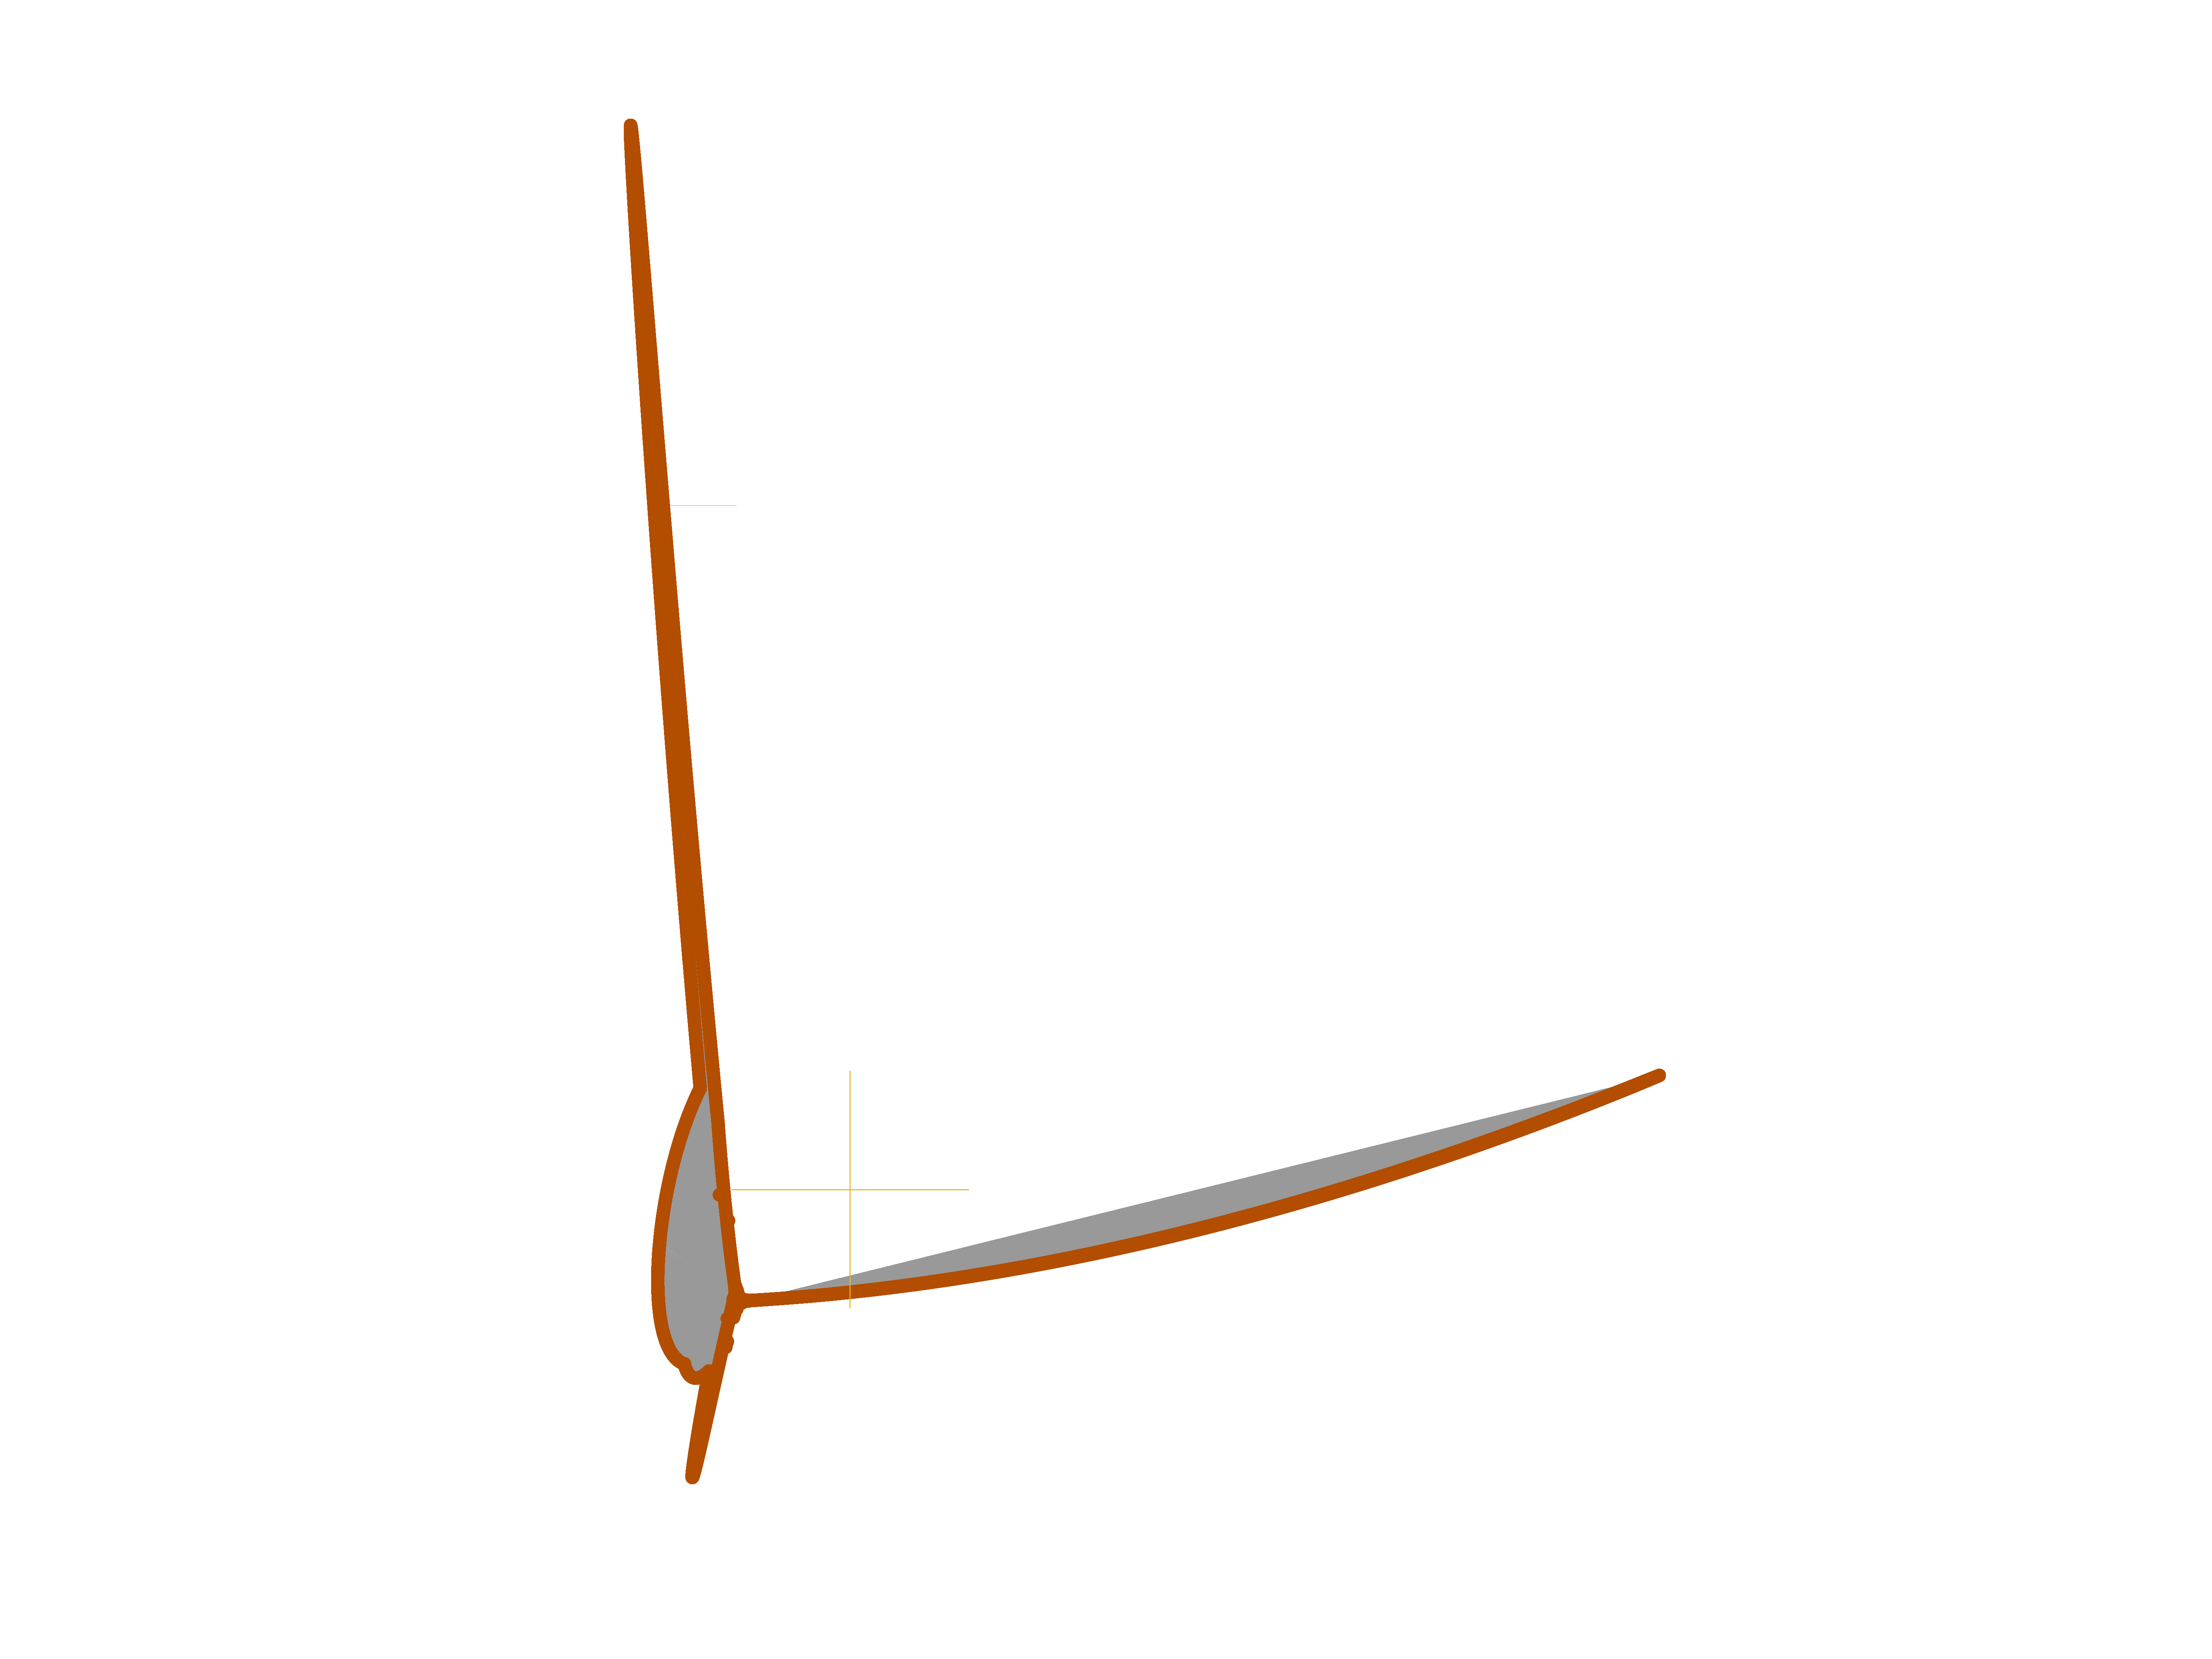
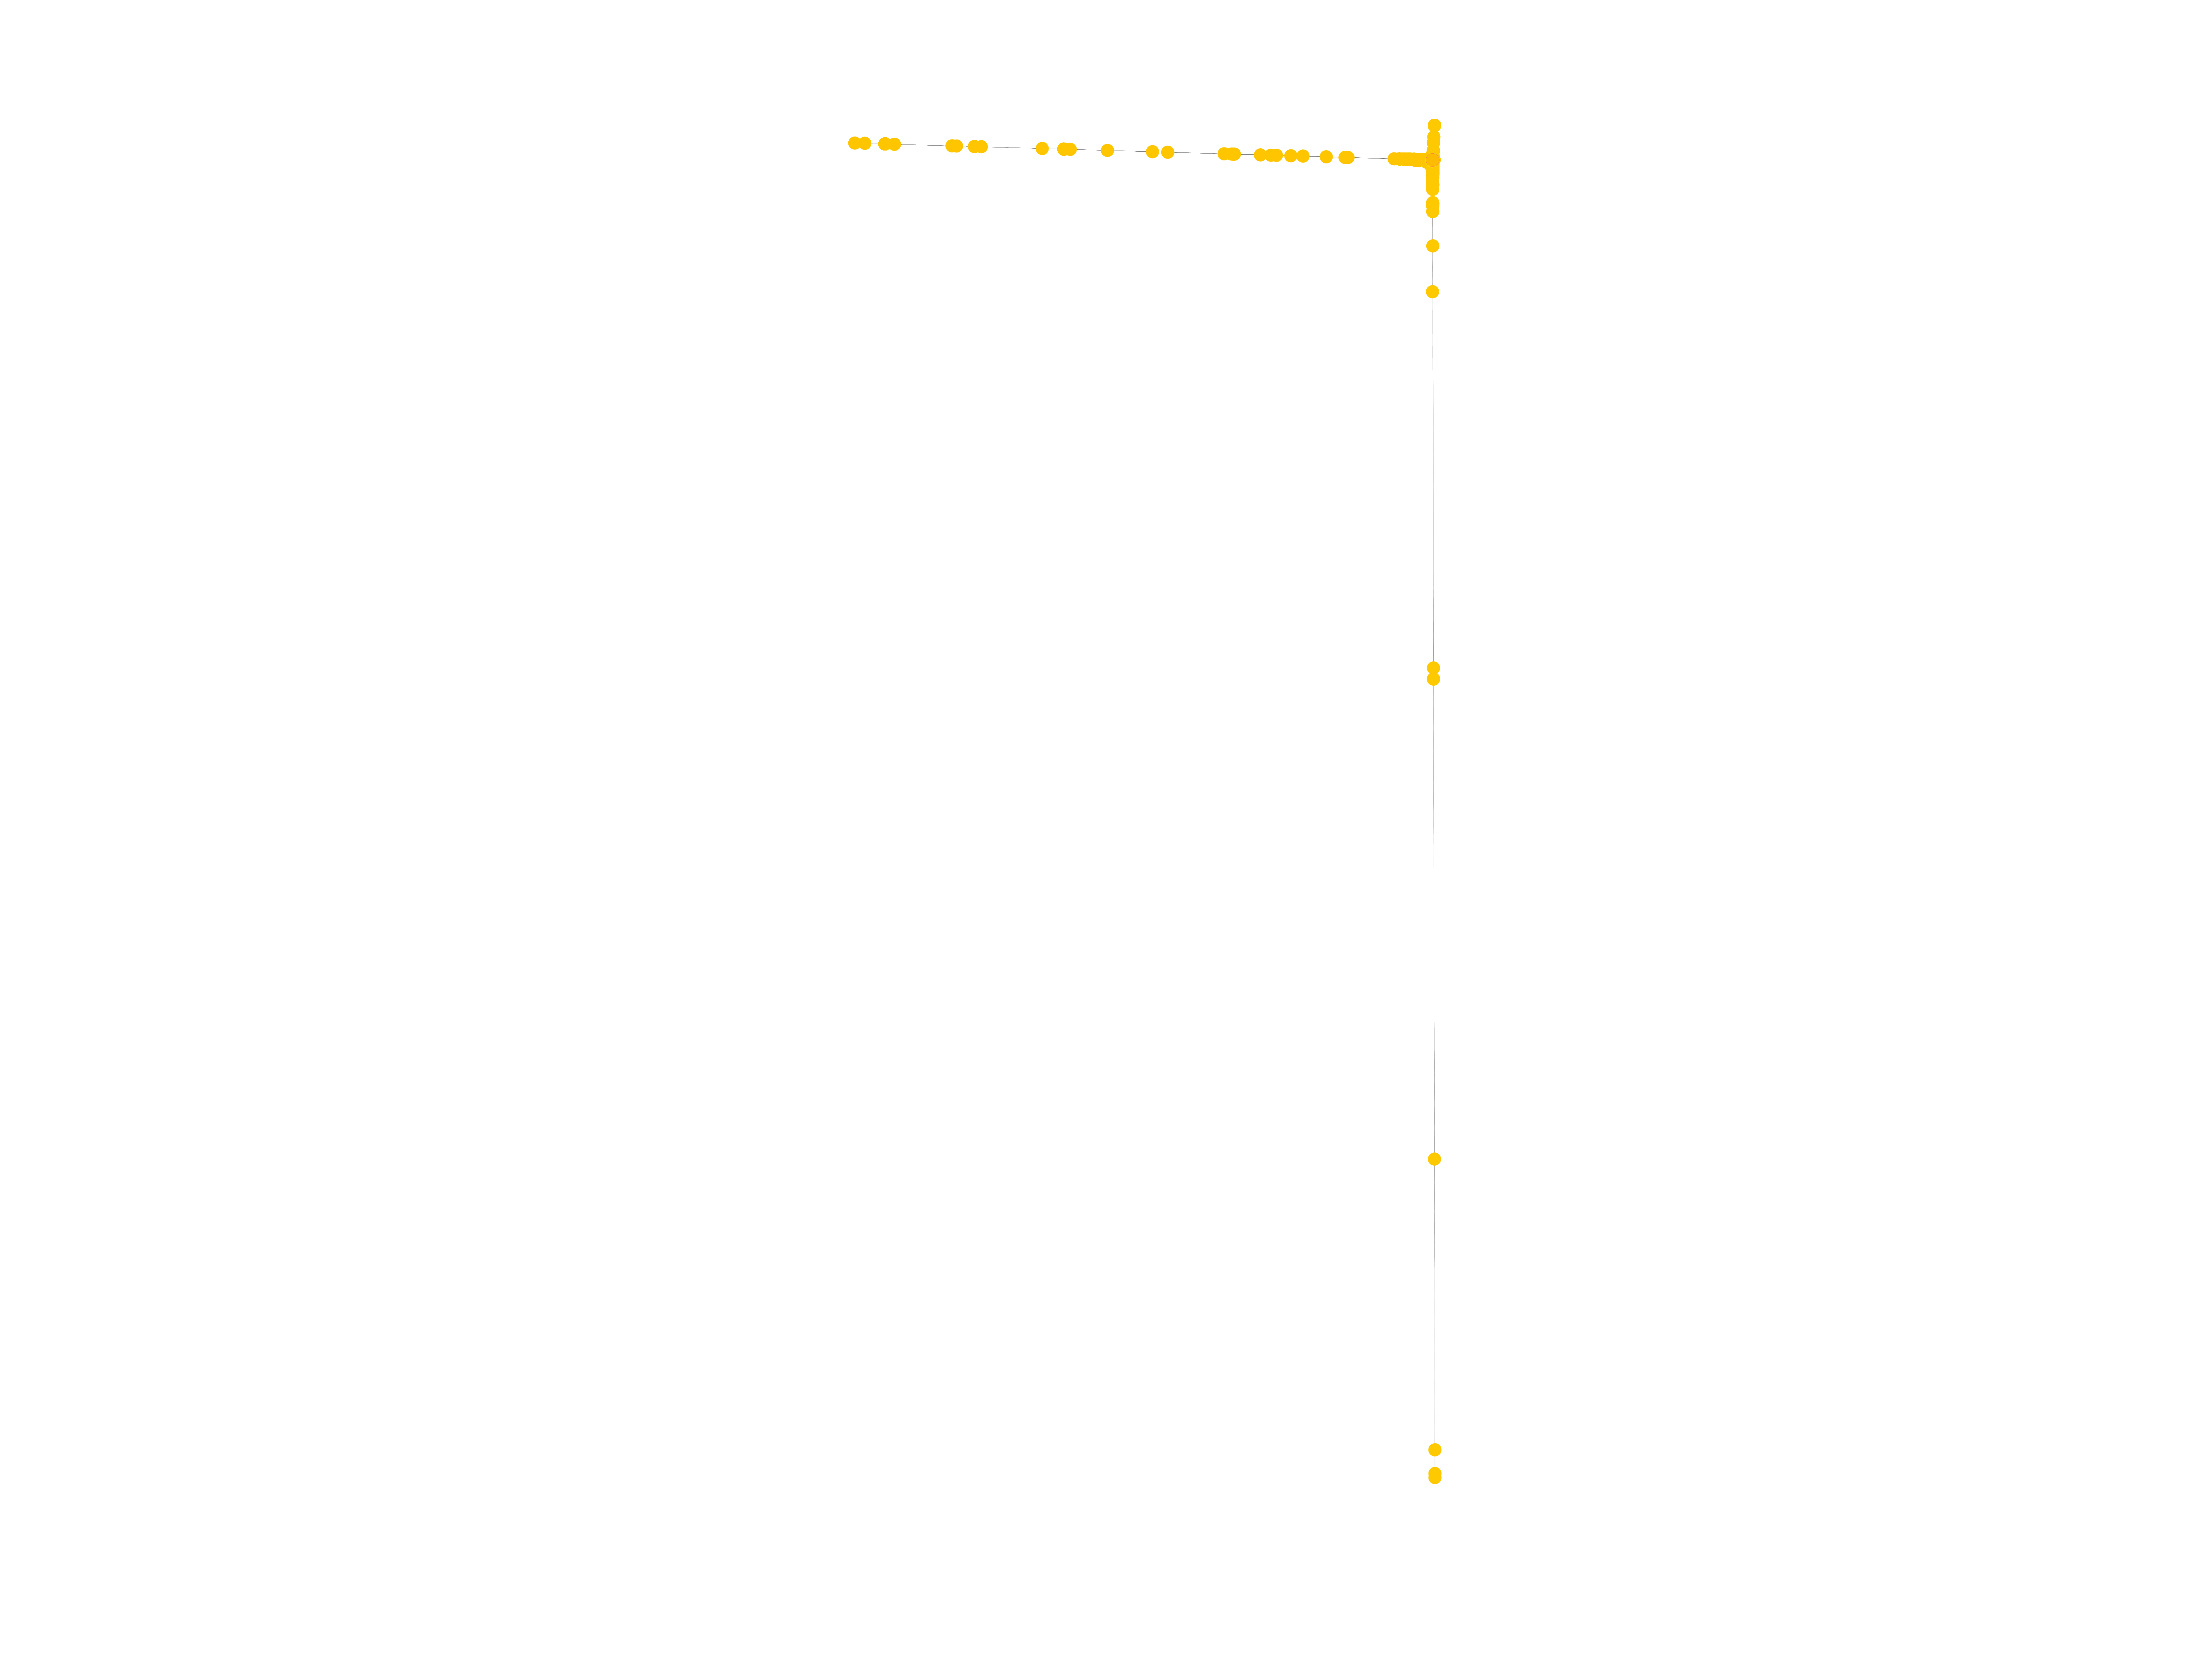
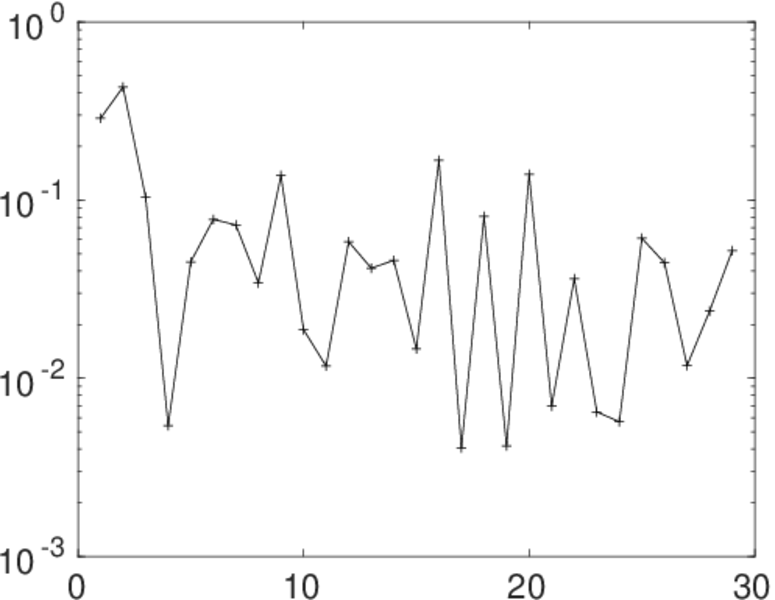
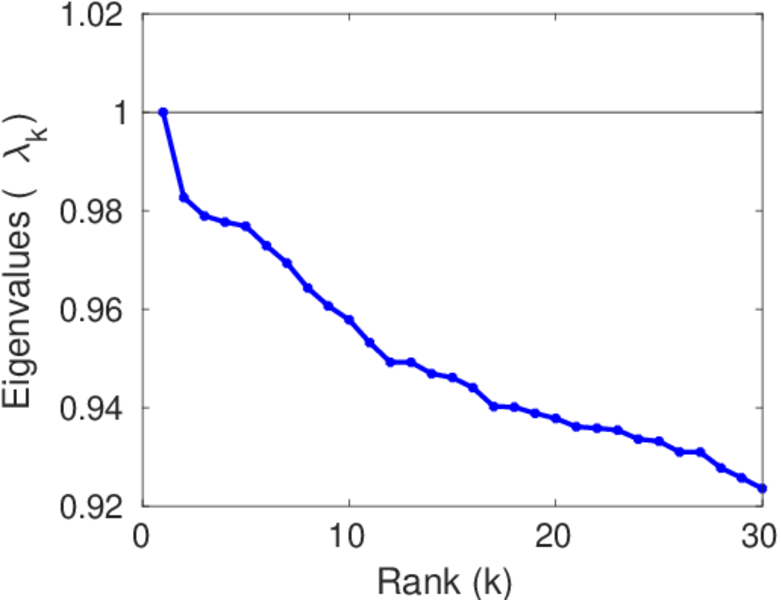
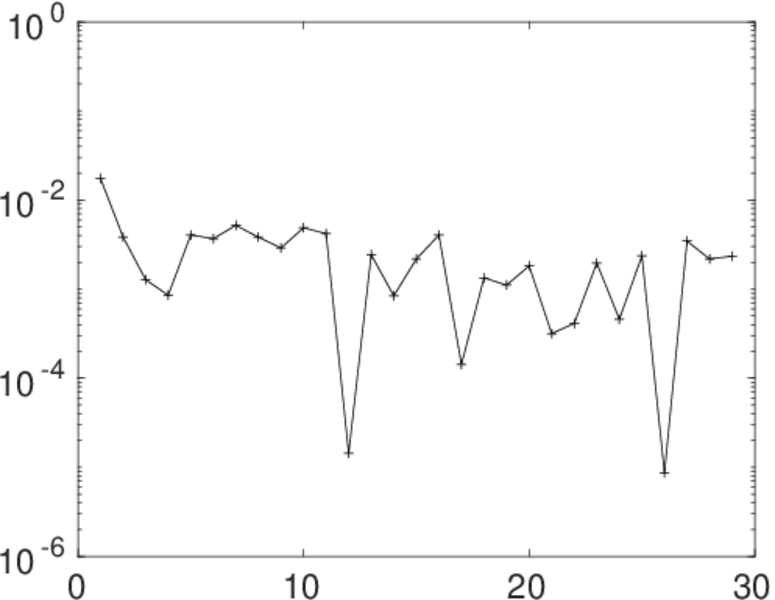
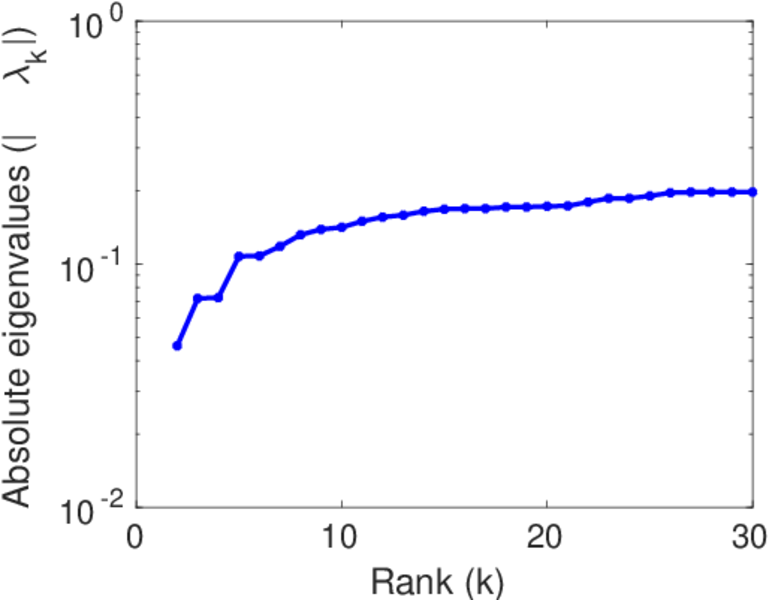
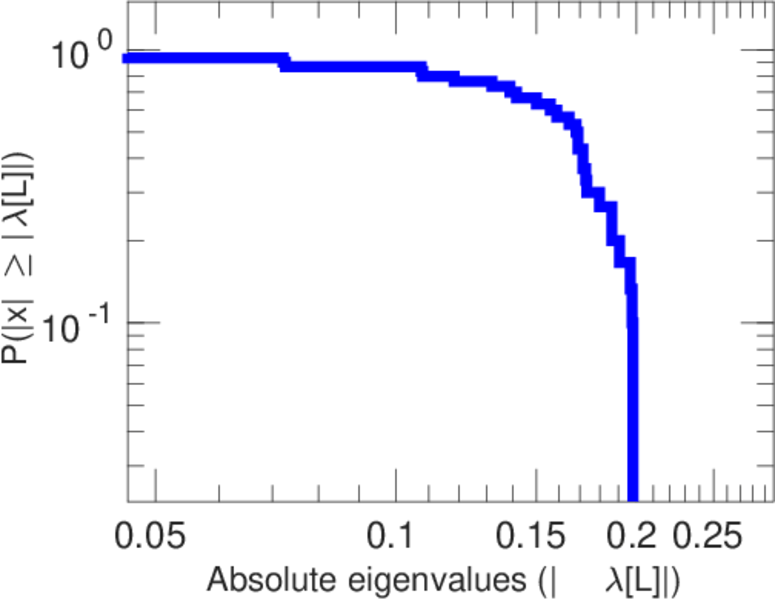
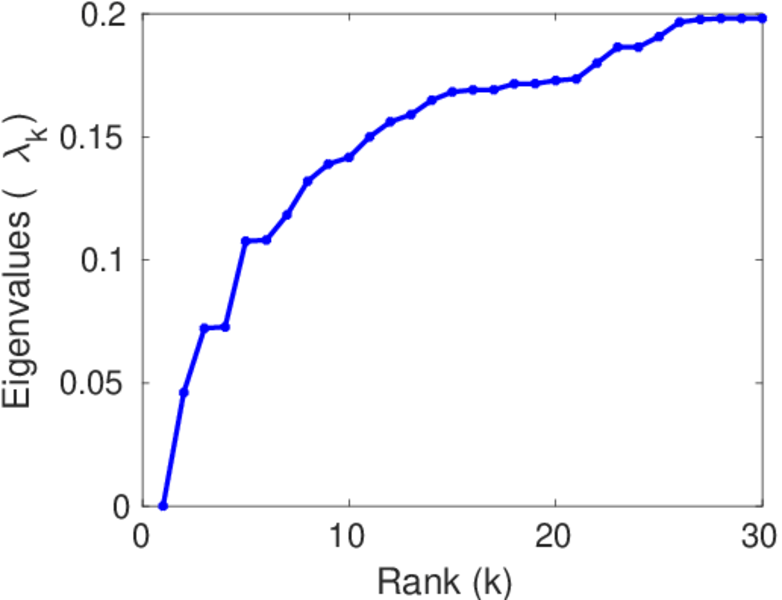
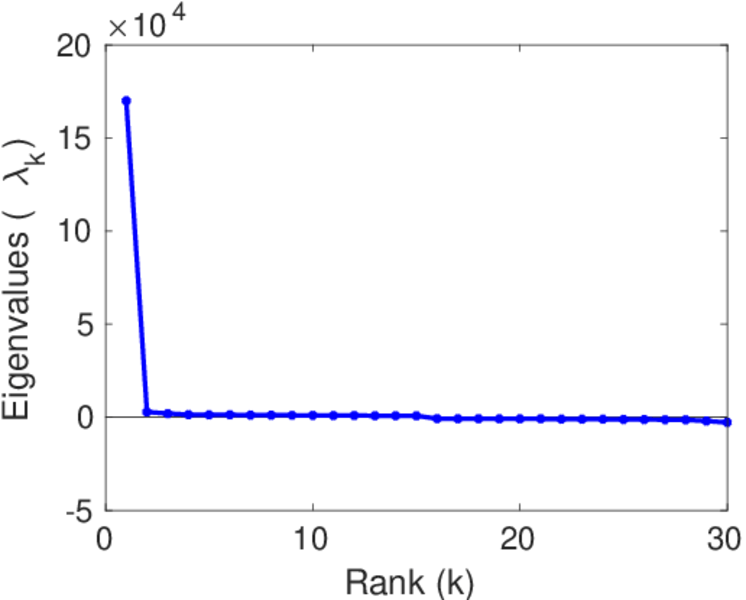
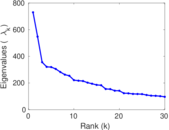
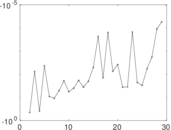
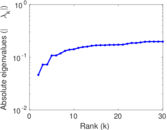
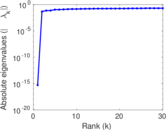
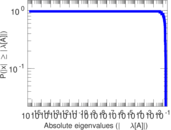
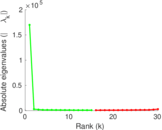
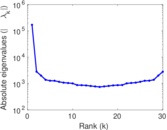
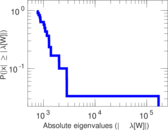
Matrix decompositions plots


Downloads
References
|
[1]
|
Jérôme Kunegis.
KONECT – The Koblenz Network Collection.
In Proc. Int. Conf. on World Wide Web Companion, pages
1343–1350, 2013.
[ http ]
|
|
[2]
|
Wikimedia Foundation.
Wikimedia downloads.
http://dumps.wikimedia.org/, January 2010.
|
 KONECT ‣ Networks ‣
Buy Me a Coffee
KONECT ‣ Networks ‣
Buy Me a Coffee