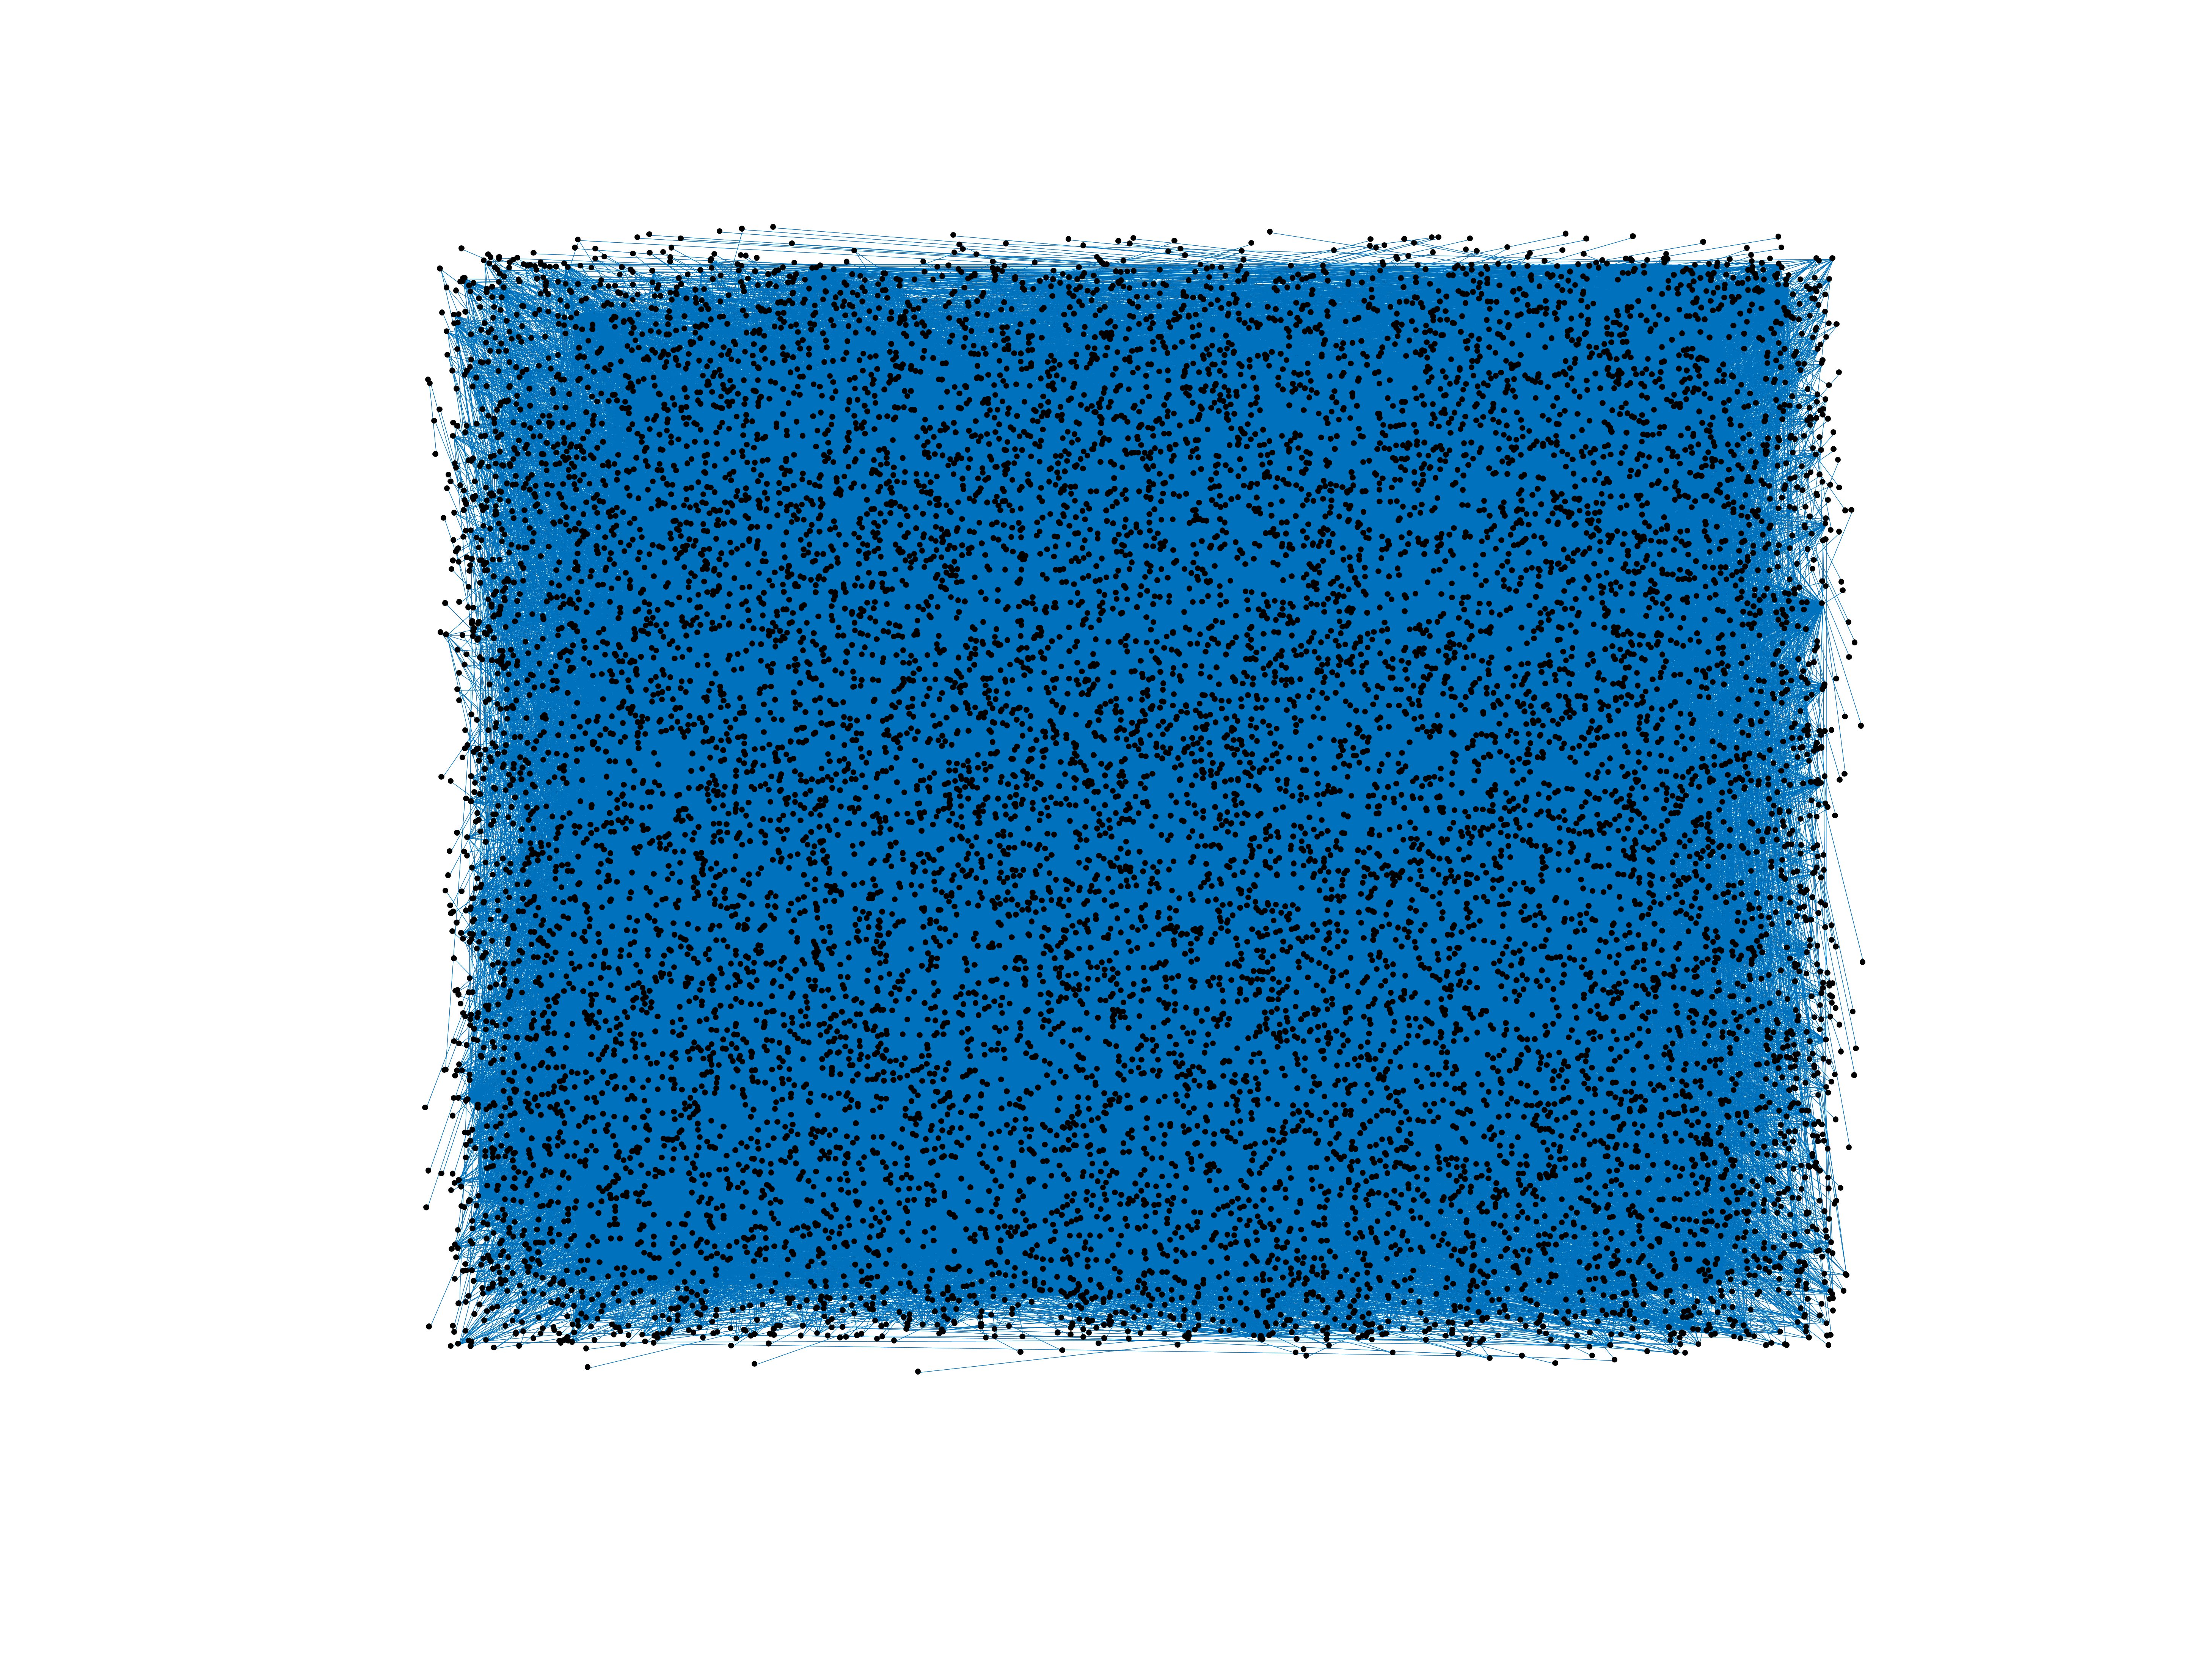
Wikipedia edits (sc)
This is the bipartite edit network of the Sardinian Wikipedia. It contains
users and pages from the Sardinian Wikipedia, connected by edit events. Each
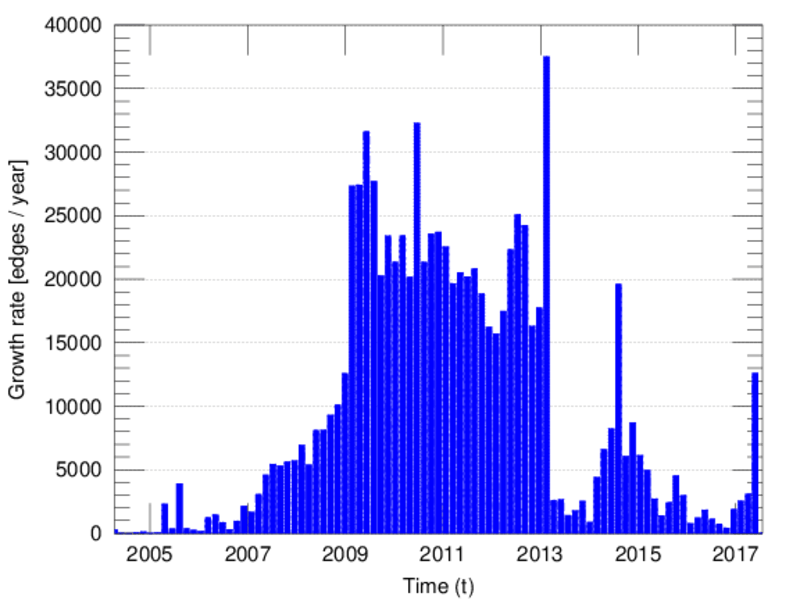
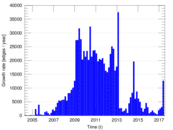
edge represents an edit. The dataset includes the timestamp of each edit.
Metadata
Statistics
| Size | n = | 13,682
|
| Left size | n1 = | 1,392
|
| Right size | n2 = | 12,290
|
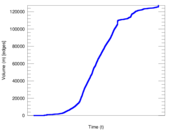
| Volume | m = | 127,309
|
| Unique edge count | m̿ = | 58,168
|
| Wedge count | s = | 39,311,803
|
| Claw count | z = | 28,164,571,640
|
| Cross count | x = | 17,664,583,431,553
|
| Square count | q = | 89,406,929
|
| 4-Tour count | T4 = | 872,651,884
|
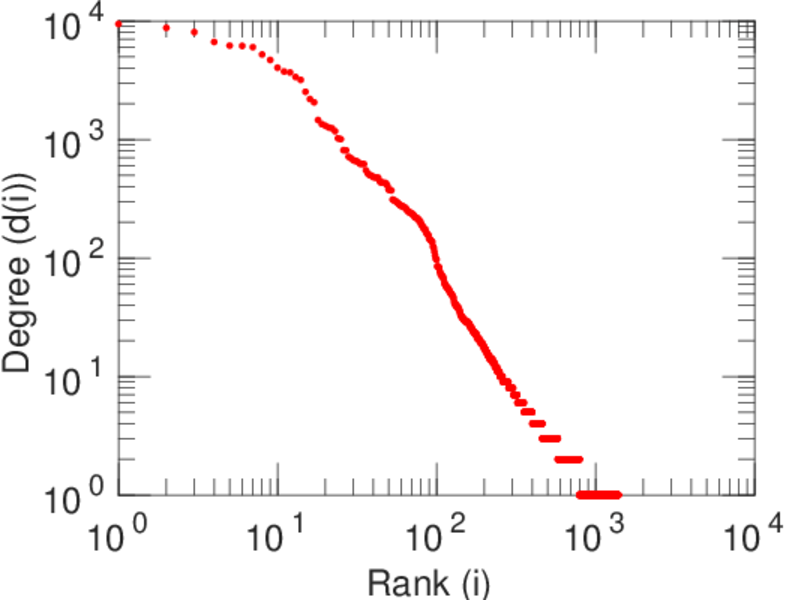
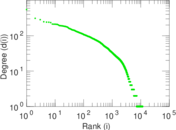
| Maximum degree | dmax = | 9,431
|
| Maximum left degree | d1max = | 9,431
|
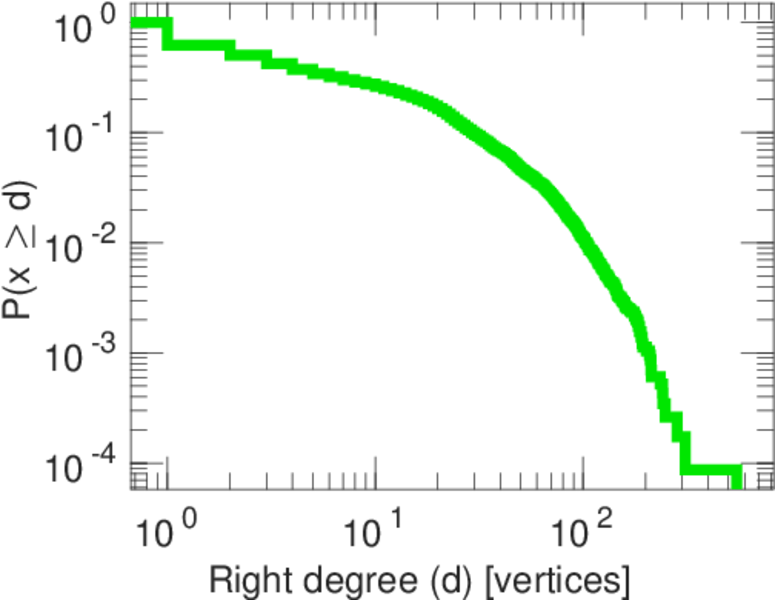
| Maximum right degree | d2max = | 549
|
| Average degree | d = | 18.609 7
|
| Average left degree | d1 = | 91.457 6
|
| Average right degree | d2 = | 10.358 7
|
| Fill | p = | 0.003 400 11
|
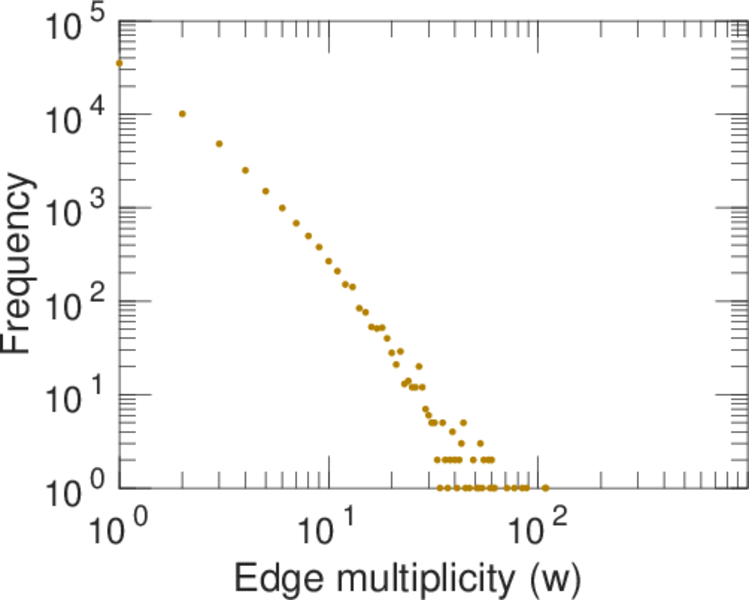
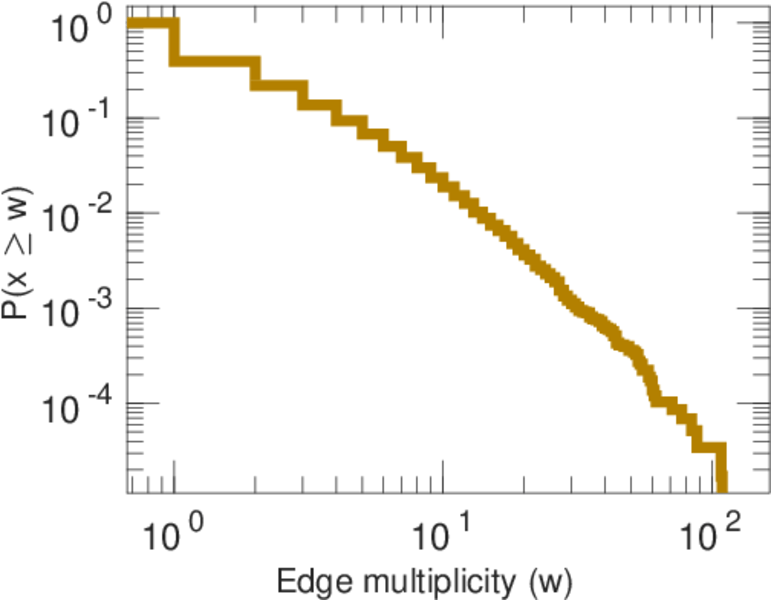
| Average edge multiplicity | m̃ = | 2.188 64
|
| Size of LCC | N = | 12,268
|
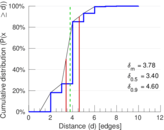
| Diameter | δ = | 12
|
| 50-Percentile effective diameter | δ0.5 = | 3.400 35
|
| 90-Percentile effective diameter | δ0.9 = | 4.598 68
|
| Median distance | δM = | 4
|
| Mean distance | δm = | 3.776 38
|
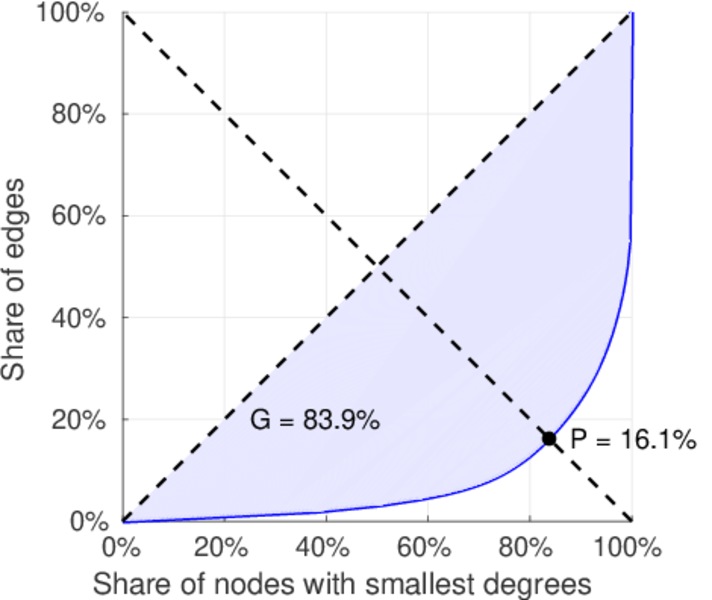
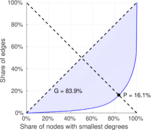
| Gini coefficient | G = | 0.836 702
|
| Balanced inequality ratio | P = | 0.162 530
|
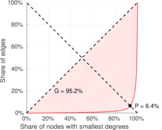
| Left balanced inequality ratio | P1 = | 0.063 538 3
|
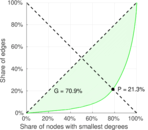
| Right balanced inequality ratio | P2 = | 0.213 323
|
| Relative edge distribution entropy | Her = | 0.763 525
|
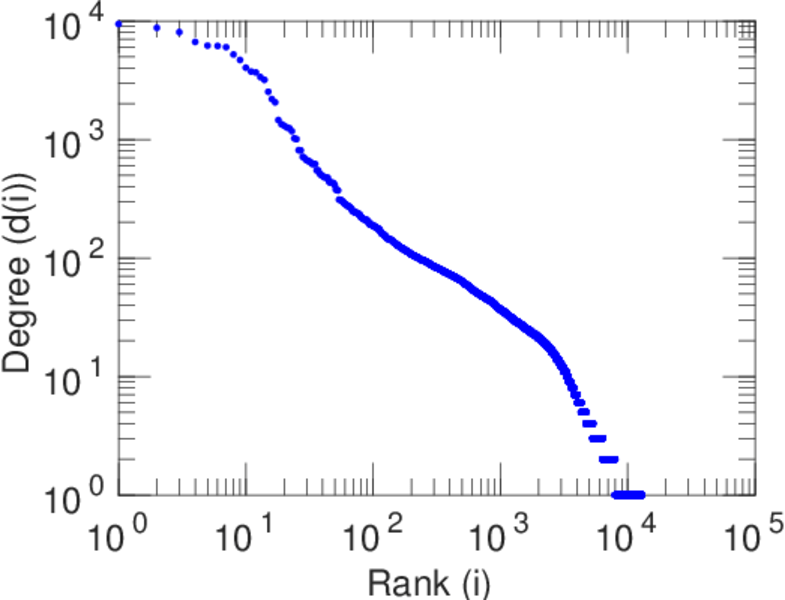
| Power law exponent | γ = | 2.139 49
|
| Tail power law exponent | γt = | 2.671 00
|
| Tail power law exponent with p | γ3 = | 2.671 00
|
| p-value | p = | 0.000 00
|
| Left tail power law exponent with p | γ3,1 = | 1.701 00
|
| Left p-value | p1 = | 0.000 00
|
| Right tail power law exponent with p | γ3,2 = | 3.511 00
|
| Right p-value | p2 = | 0.000 00
|
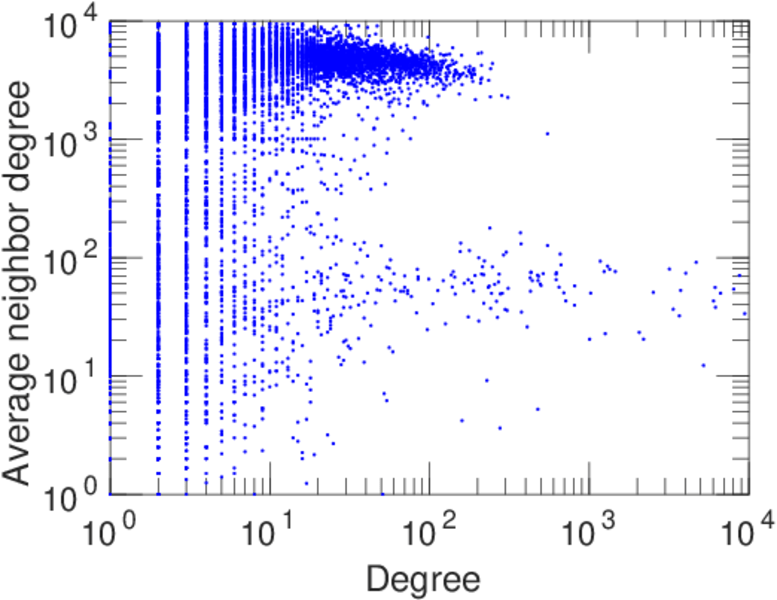
| Degree assortativity | ρ = | −0.197 256
|
| Degree assortativity p-value | pρ = | 0.000 00
|
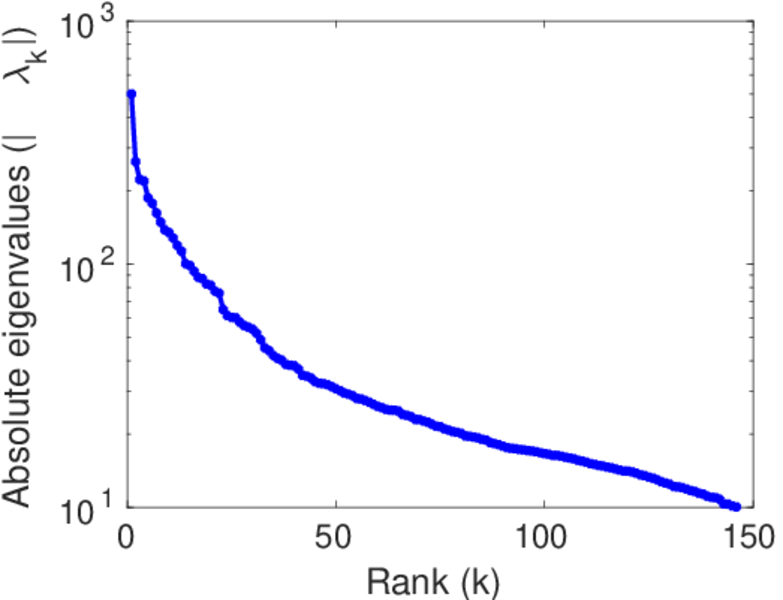
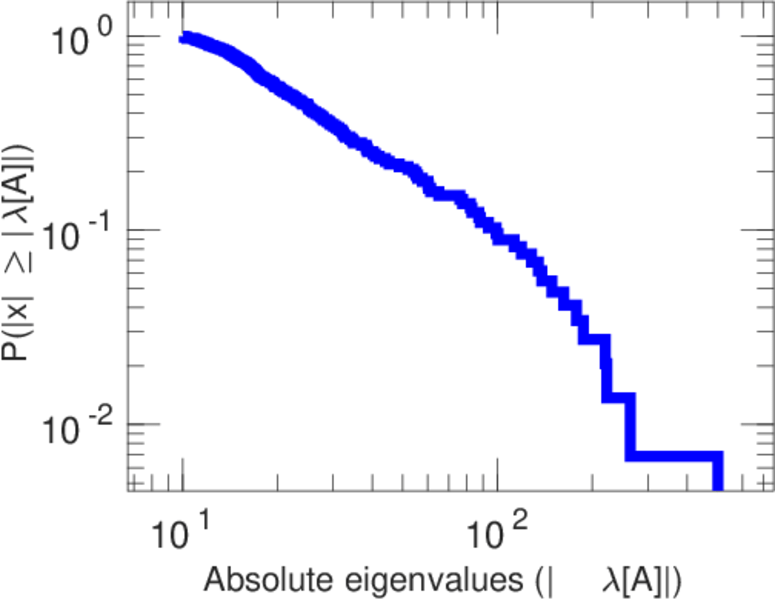
| Spectral norm | α = | 501.035
|
| Algebraic connectivity | a = | 0.040 792 8
|
| Spectral separation | |λ1[A] / λ2[A]| = | 1.898 99
|
| Controllability | C = | 10,319
|
| Relative controllability | Cr = | 0.800 419
|
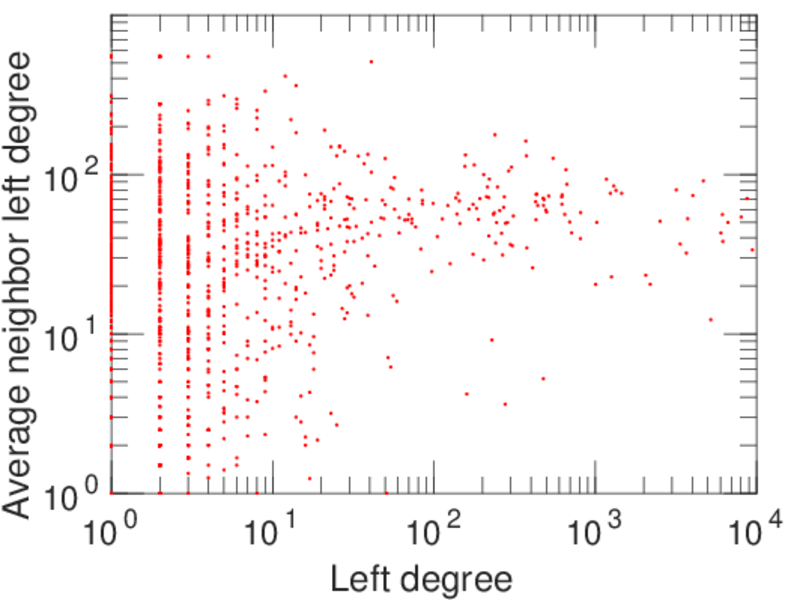
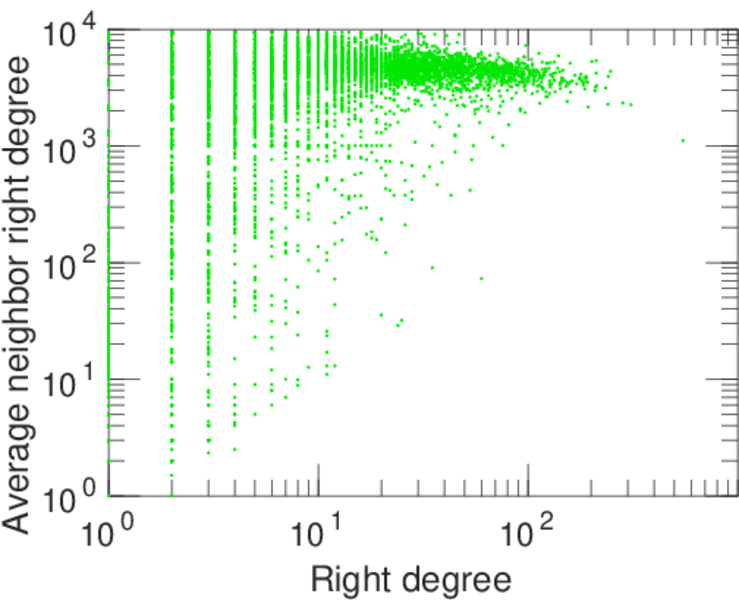
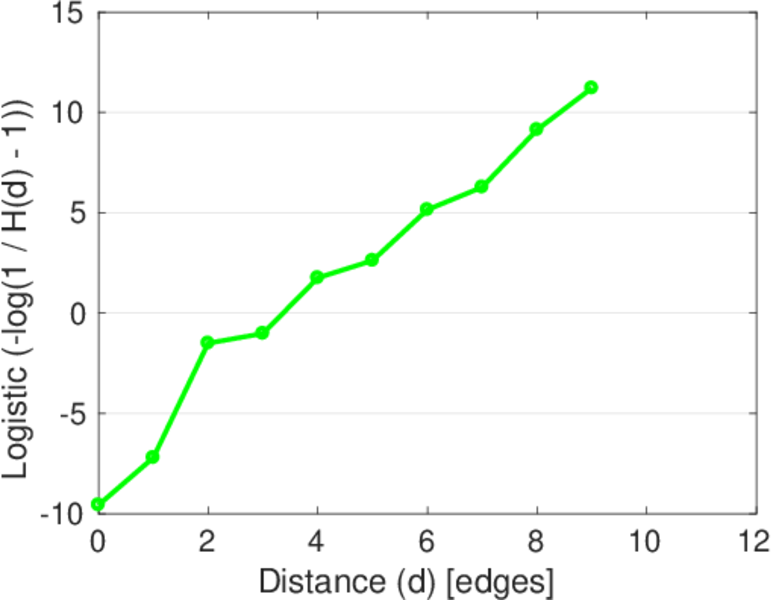
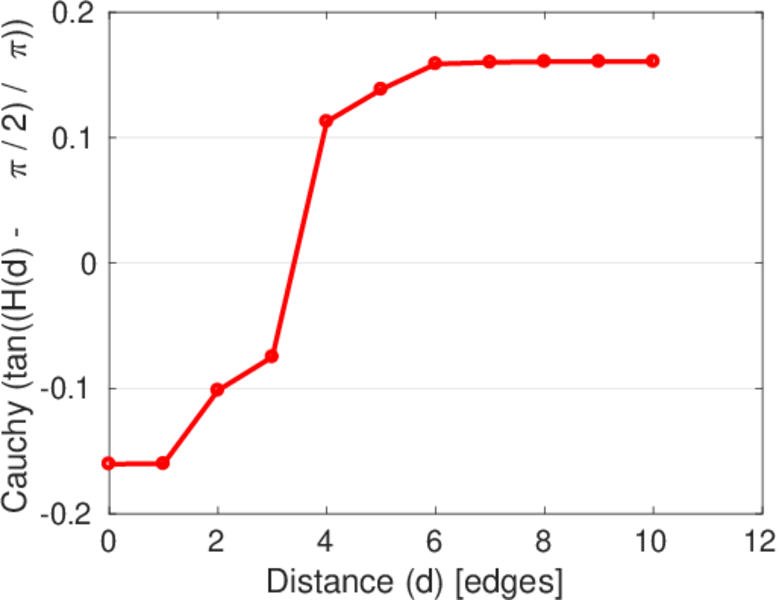
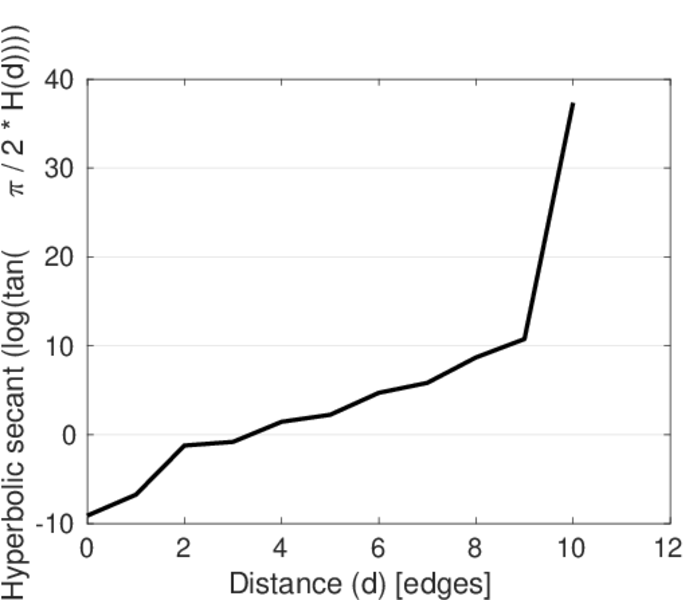
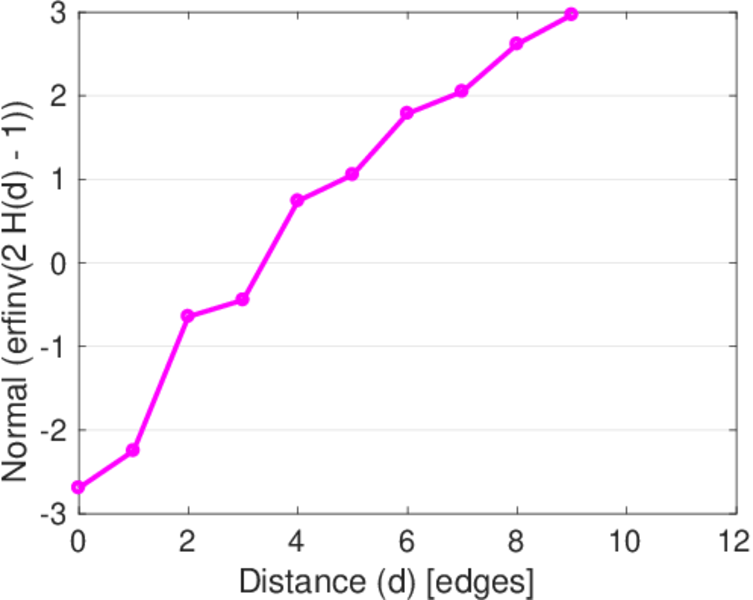
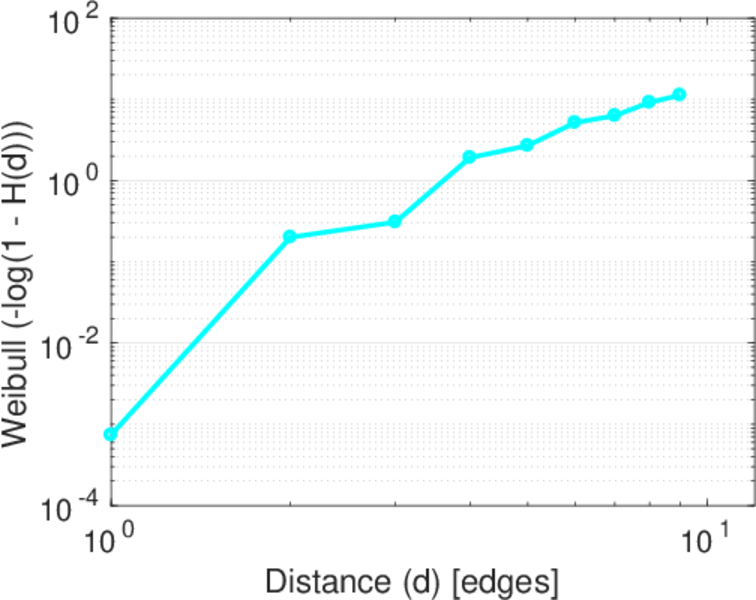
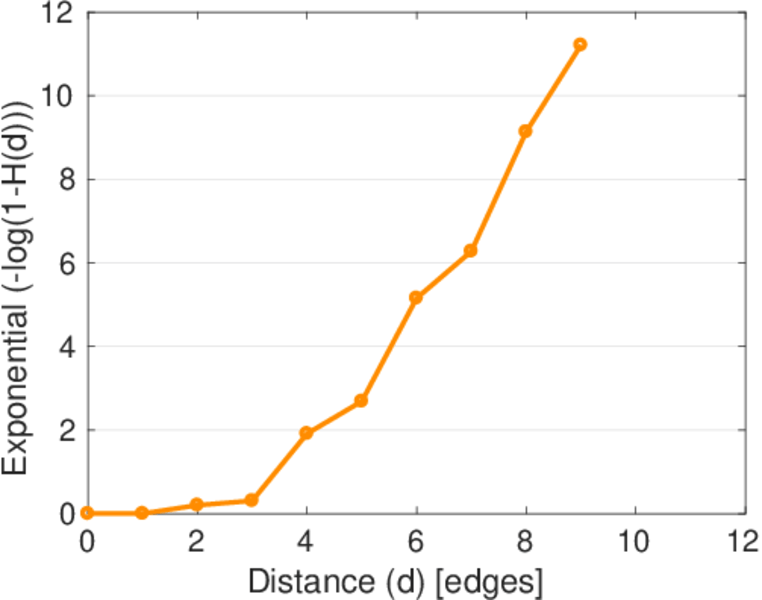
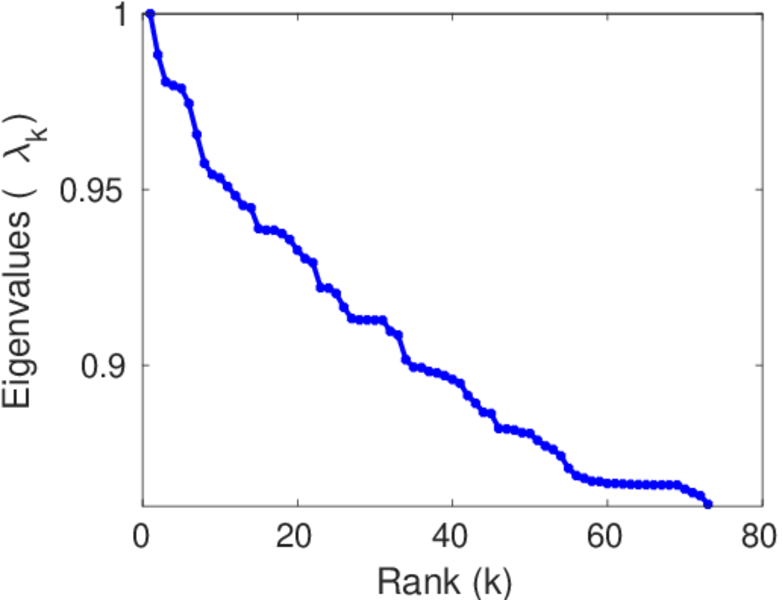
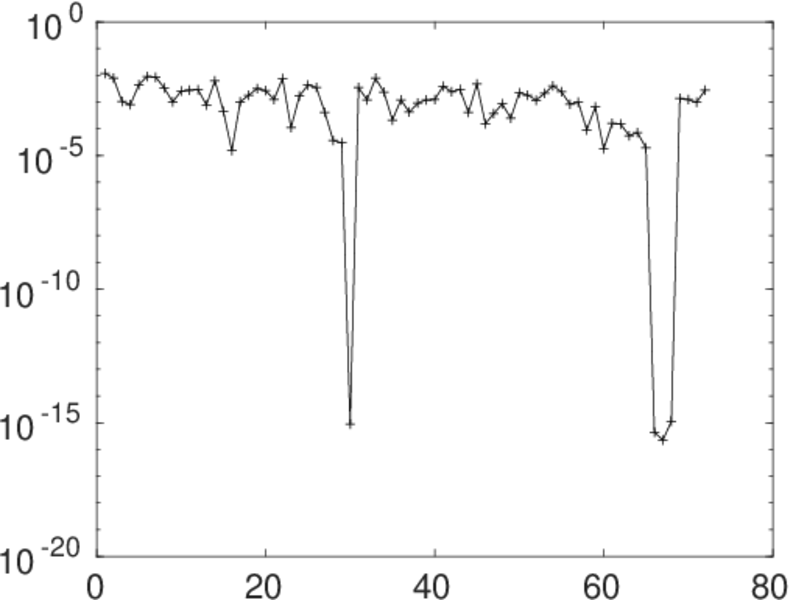
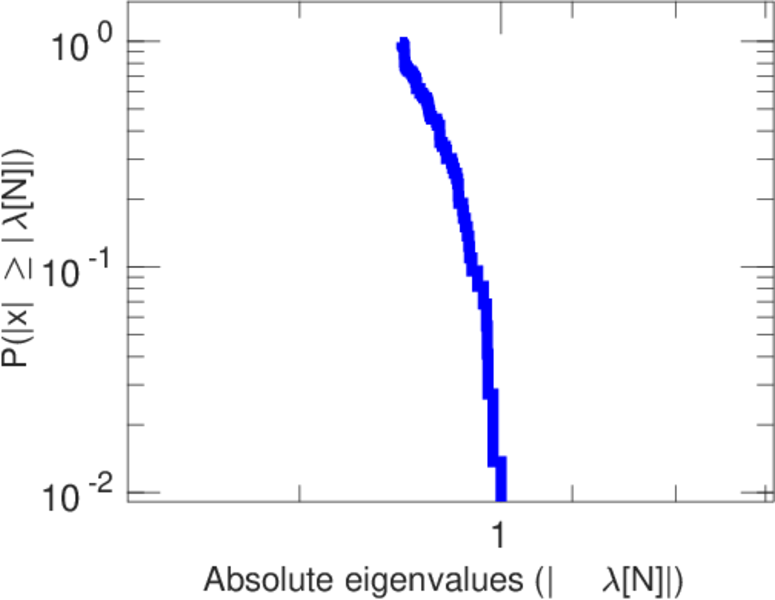
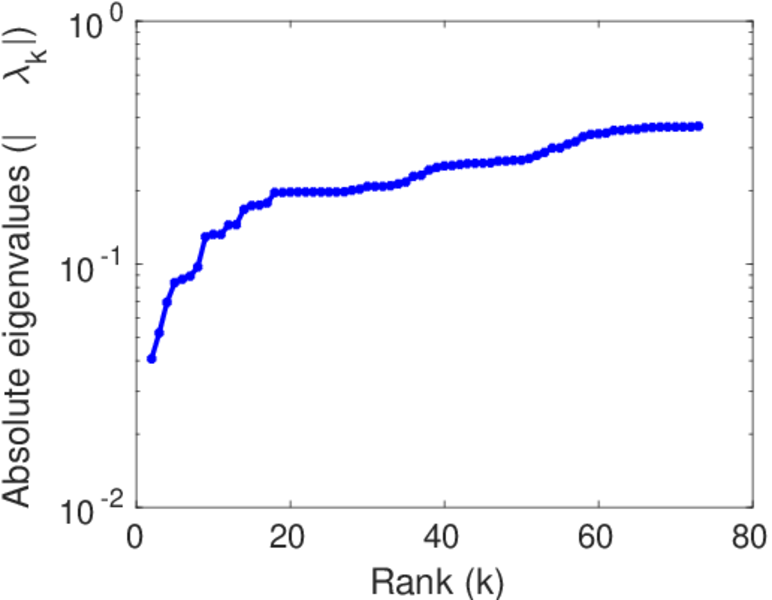
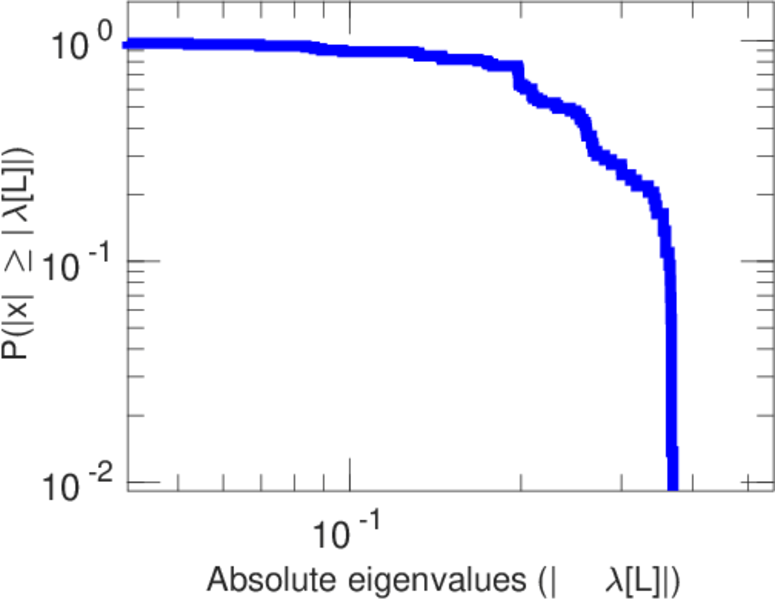
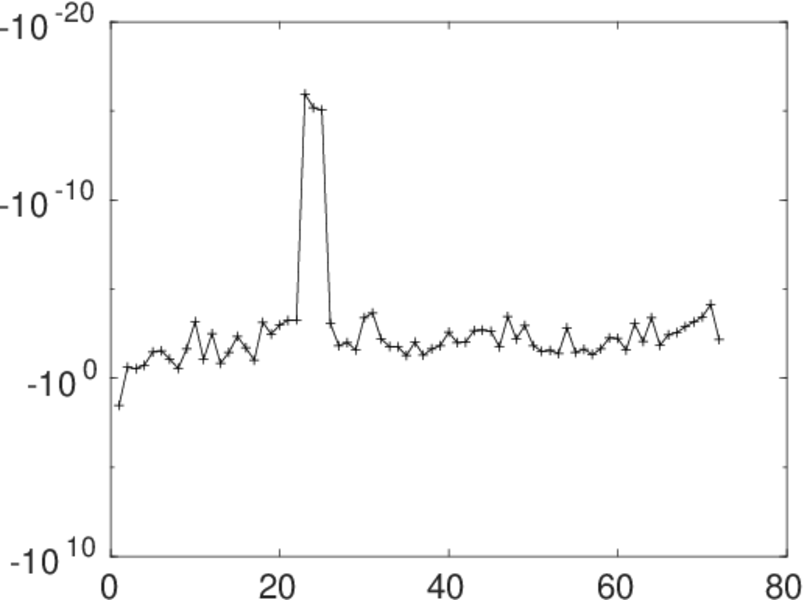
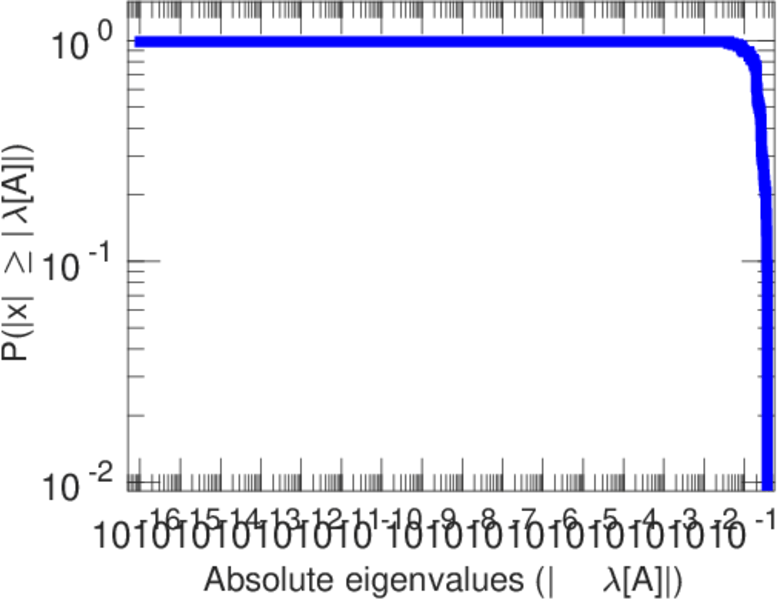
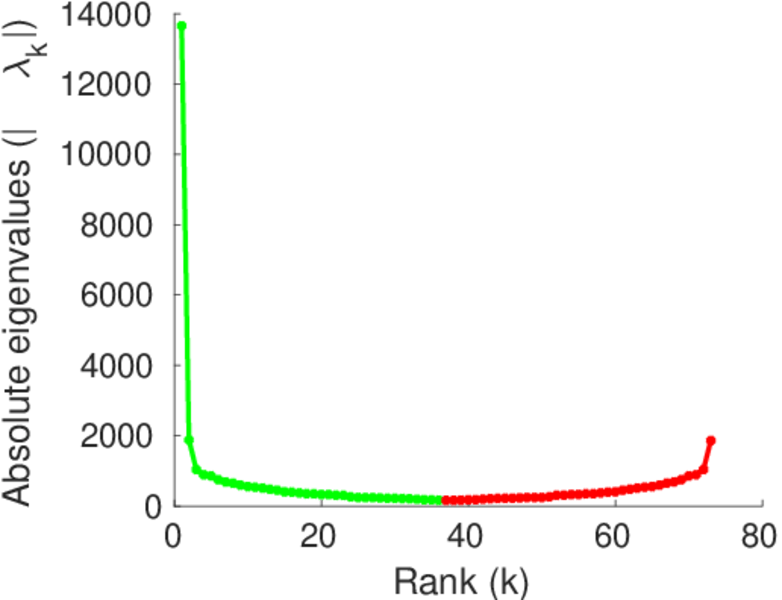
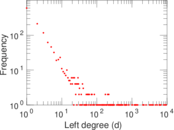
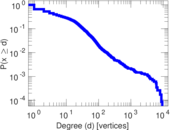
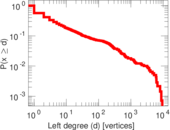
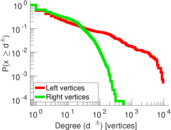
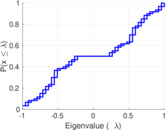
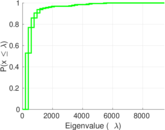
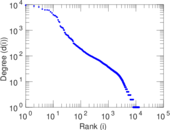
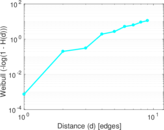
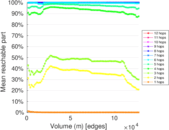
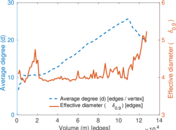
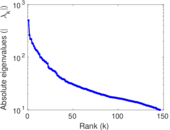
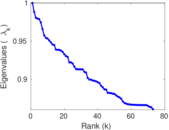
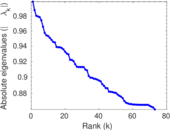
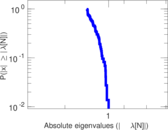
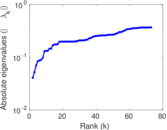
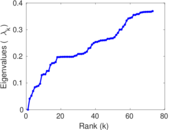
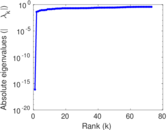
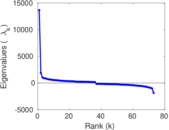
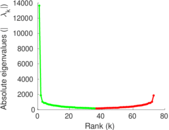
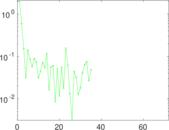
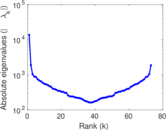
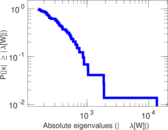
Plots


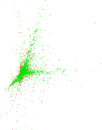


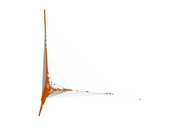


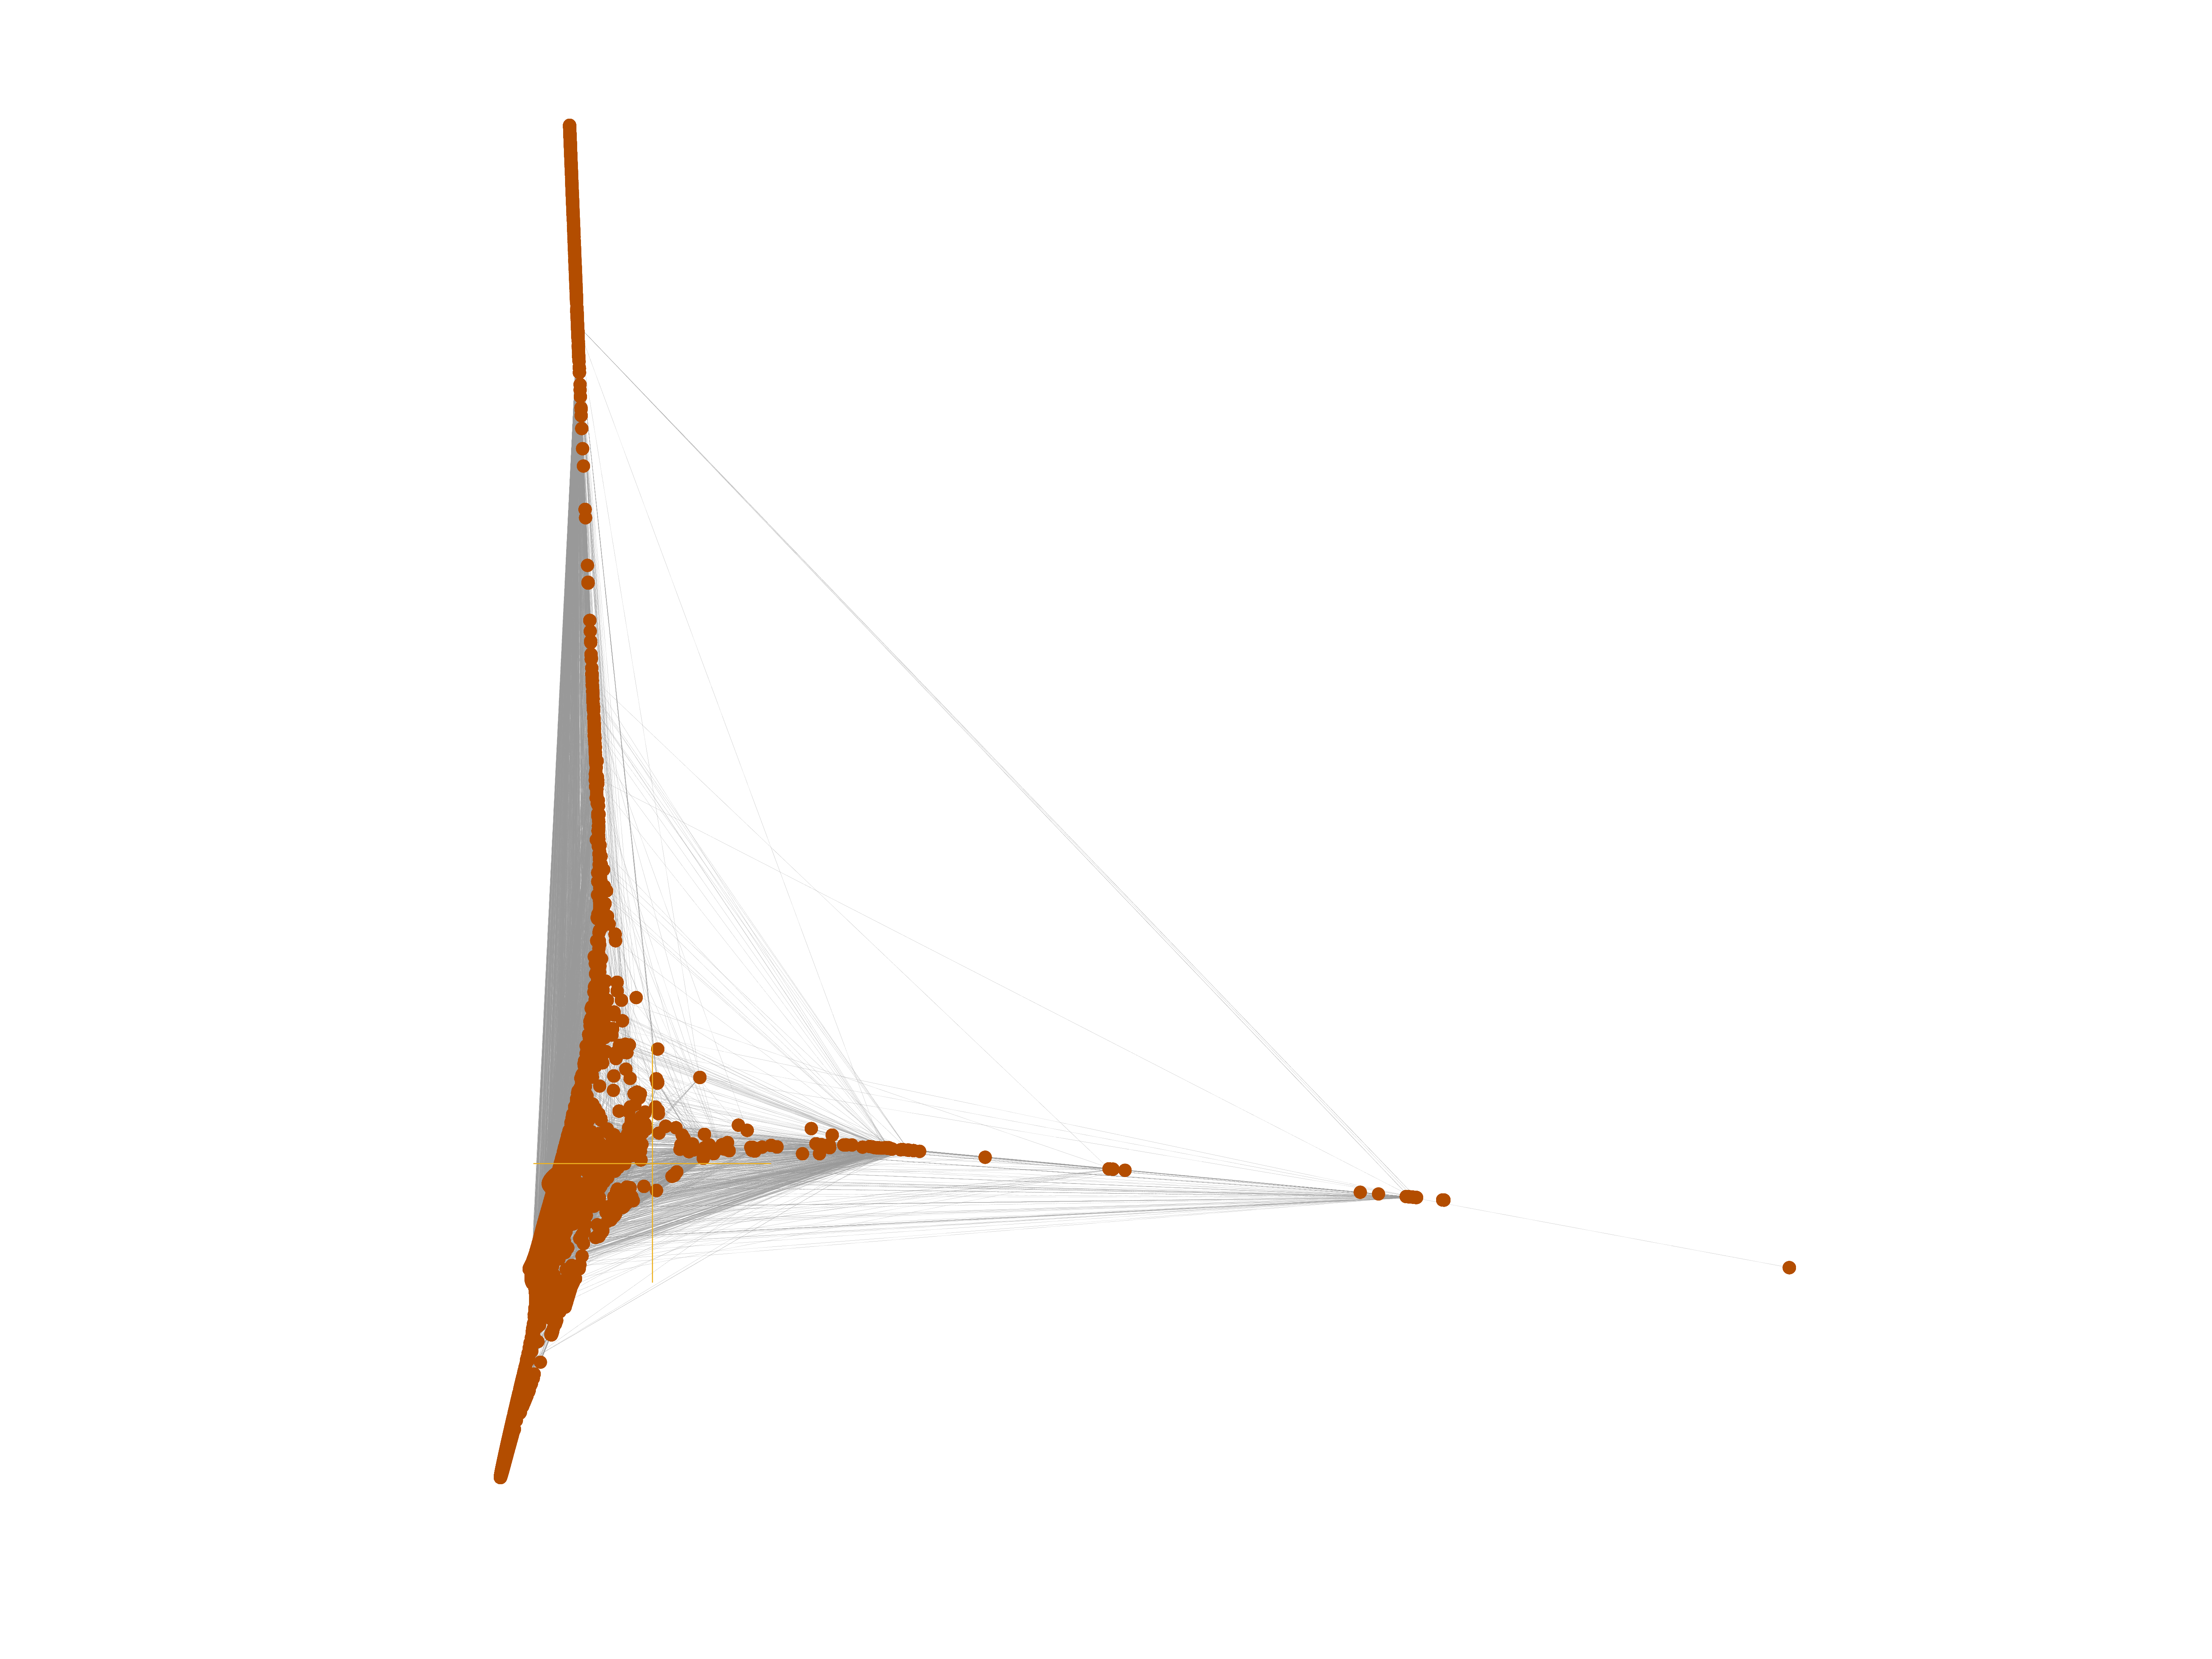
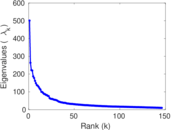
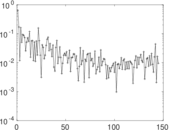
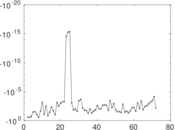
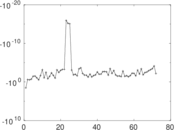
Matrix decompositions plots


Downloads
References
|
[1]
|
Jérôme Kunegis.
KONECT – The Koblenz Network Collection.
In Proc. Int. Conf. on World Wide Web Companion, pages
1343–1350, 2013.
[ http ]
|
|
[2]
|
Wikimedia Foundation.
Wikimedia downloads.
http://dumps.wikimedia.org/, January 2010.
|
 KONECT ‣ Networks ‣
Buy Me a Coffee
KONECT ‣ Networks ‣
Buy Me a Coffee