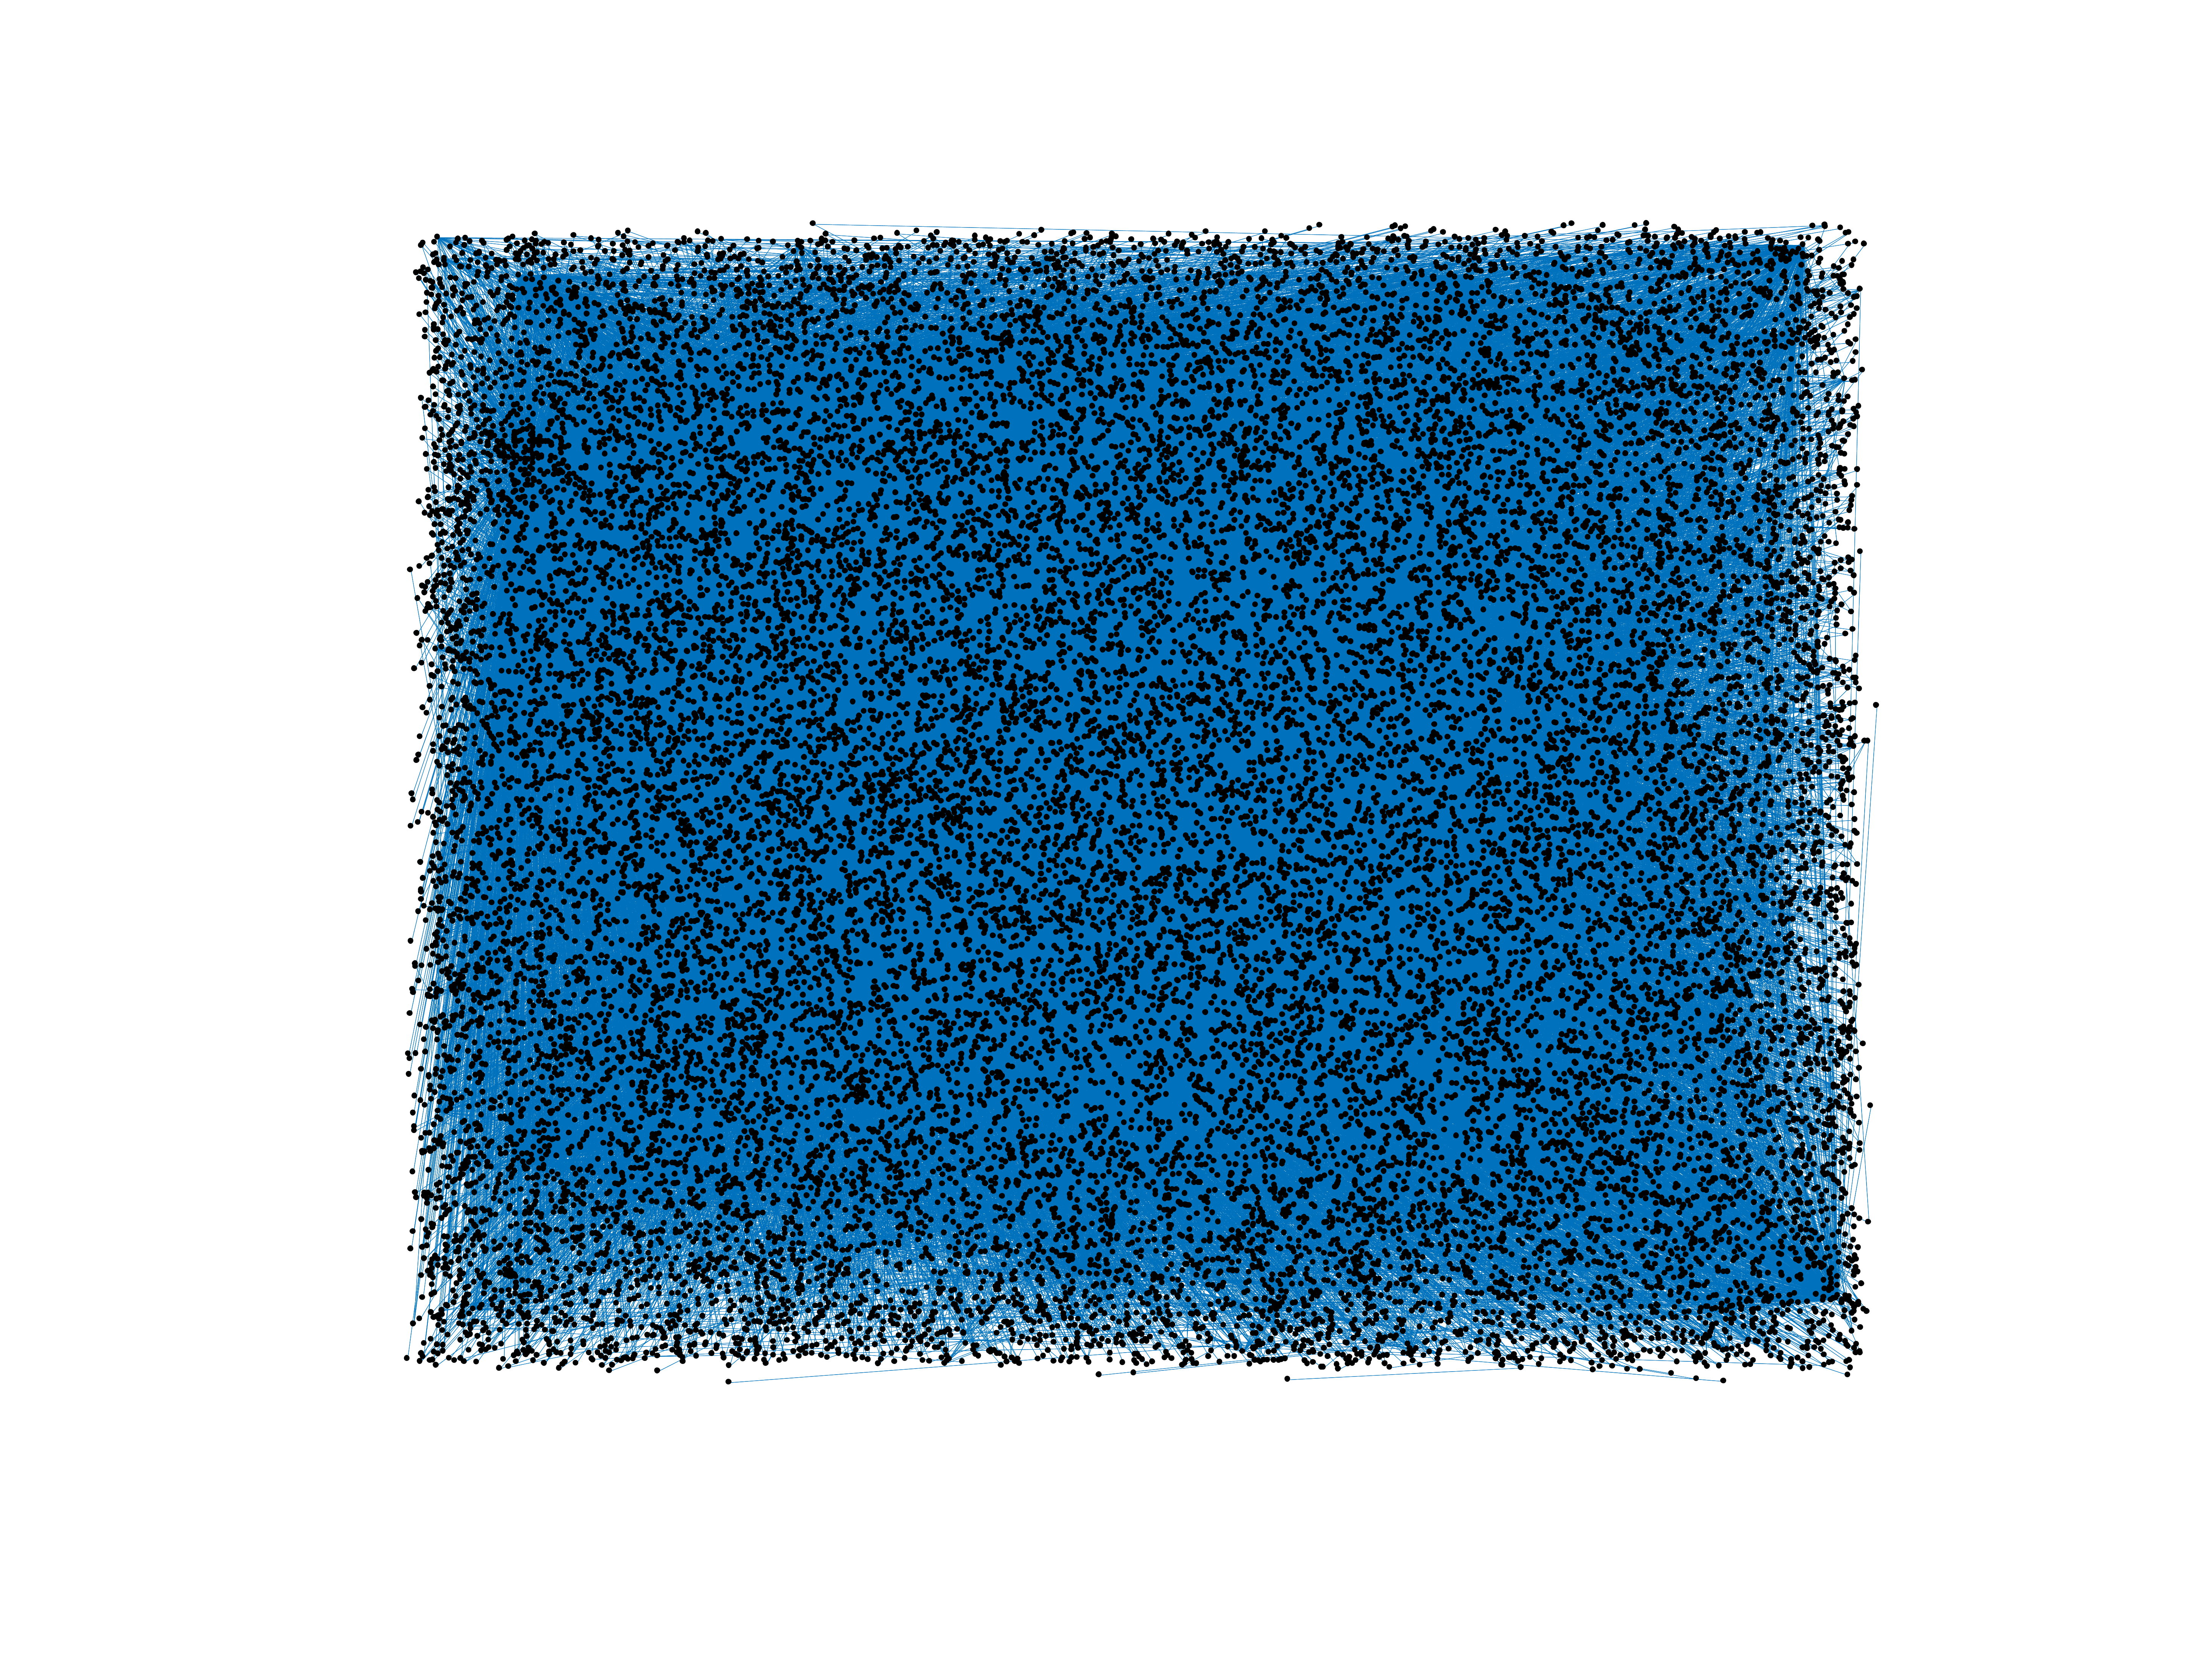
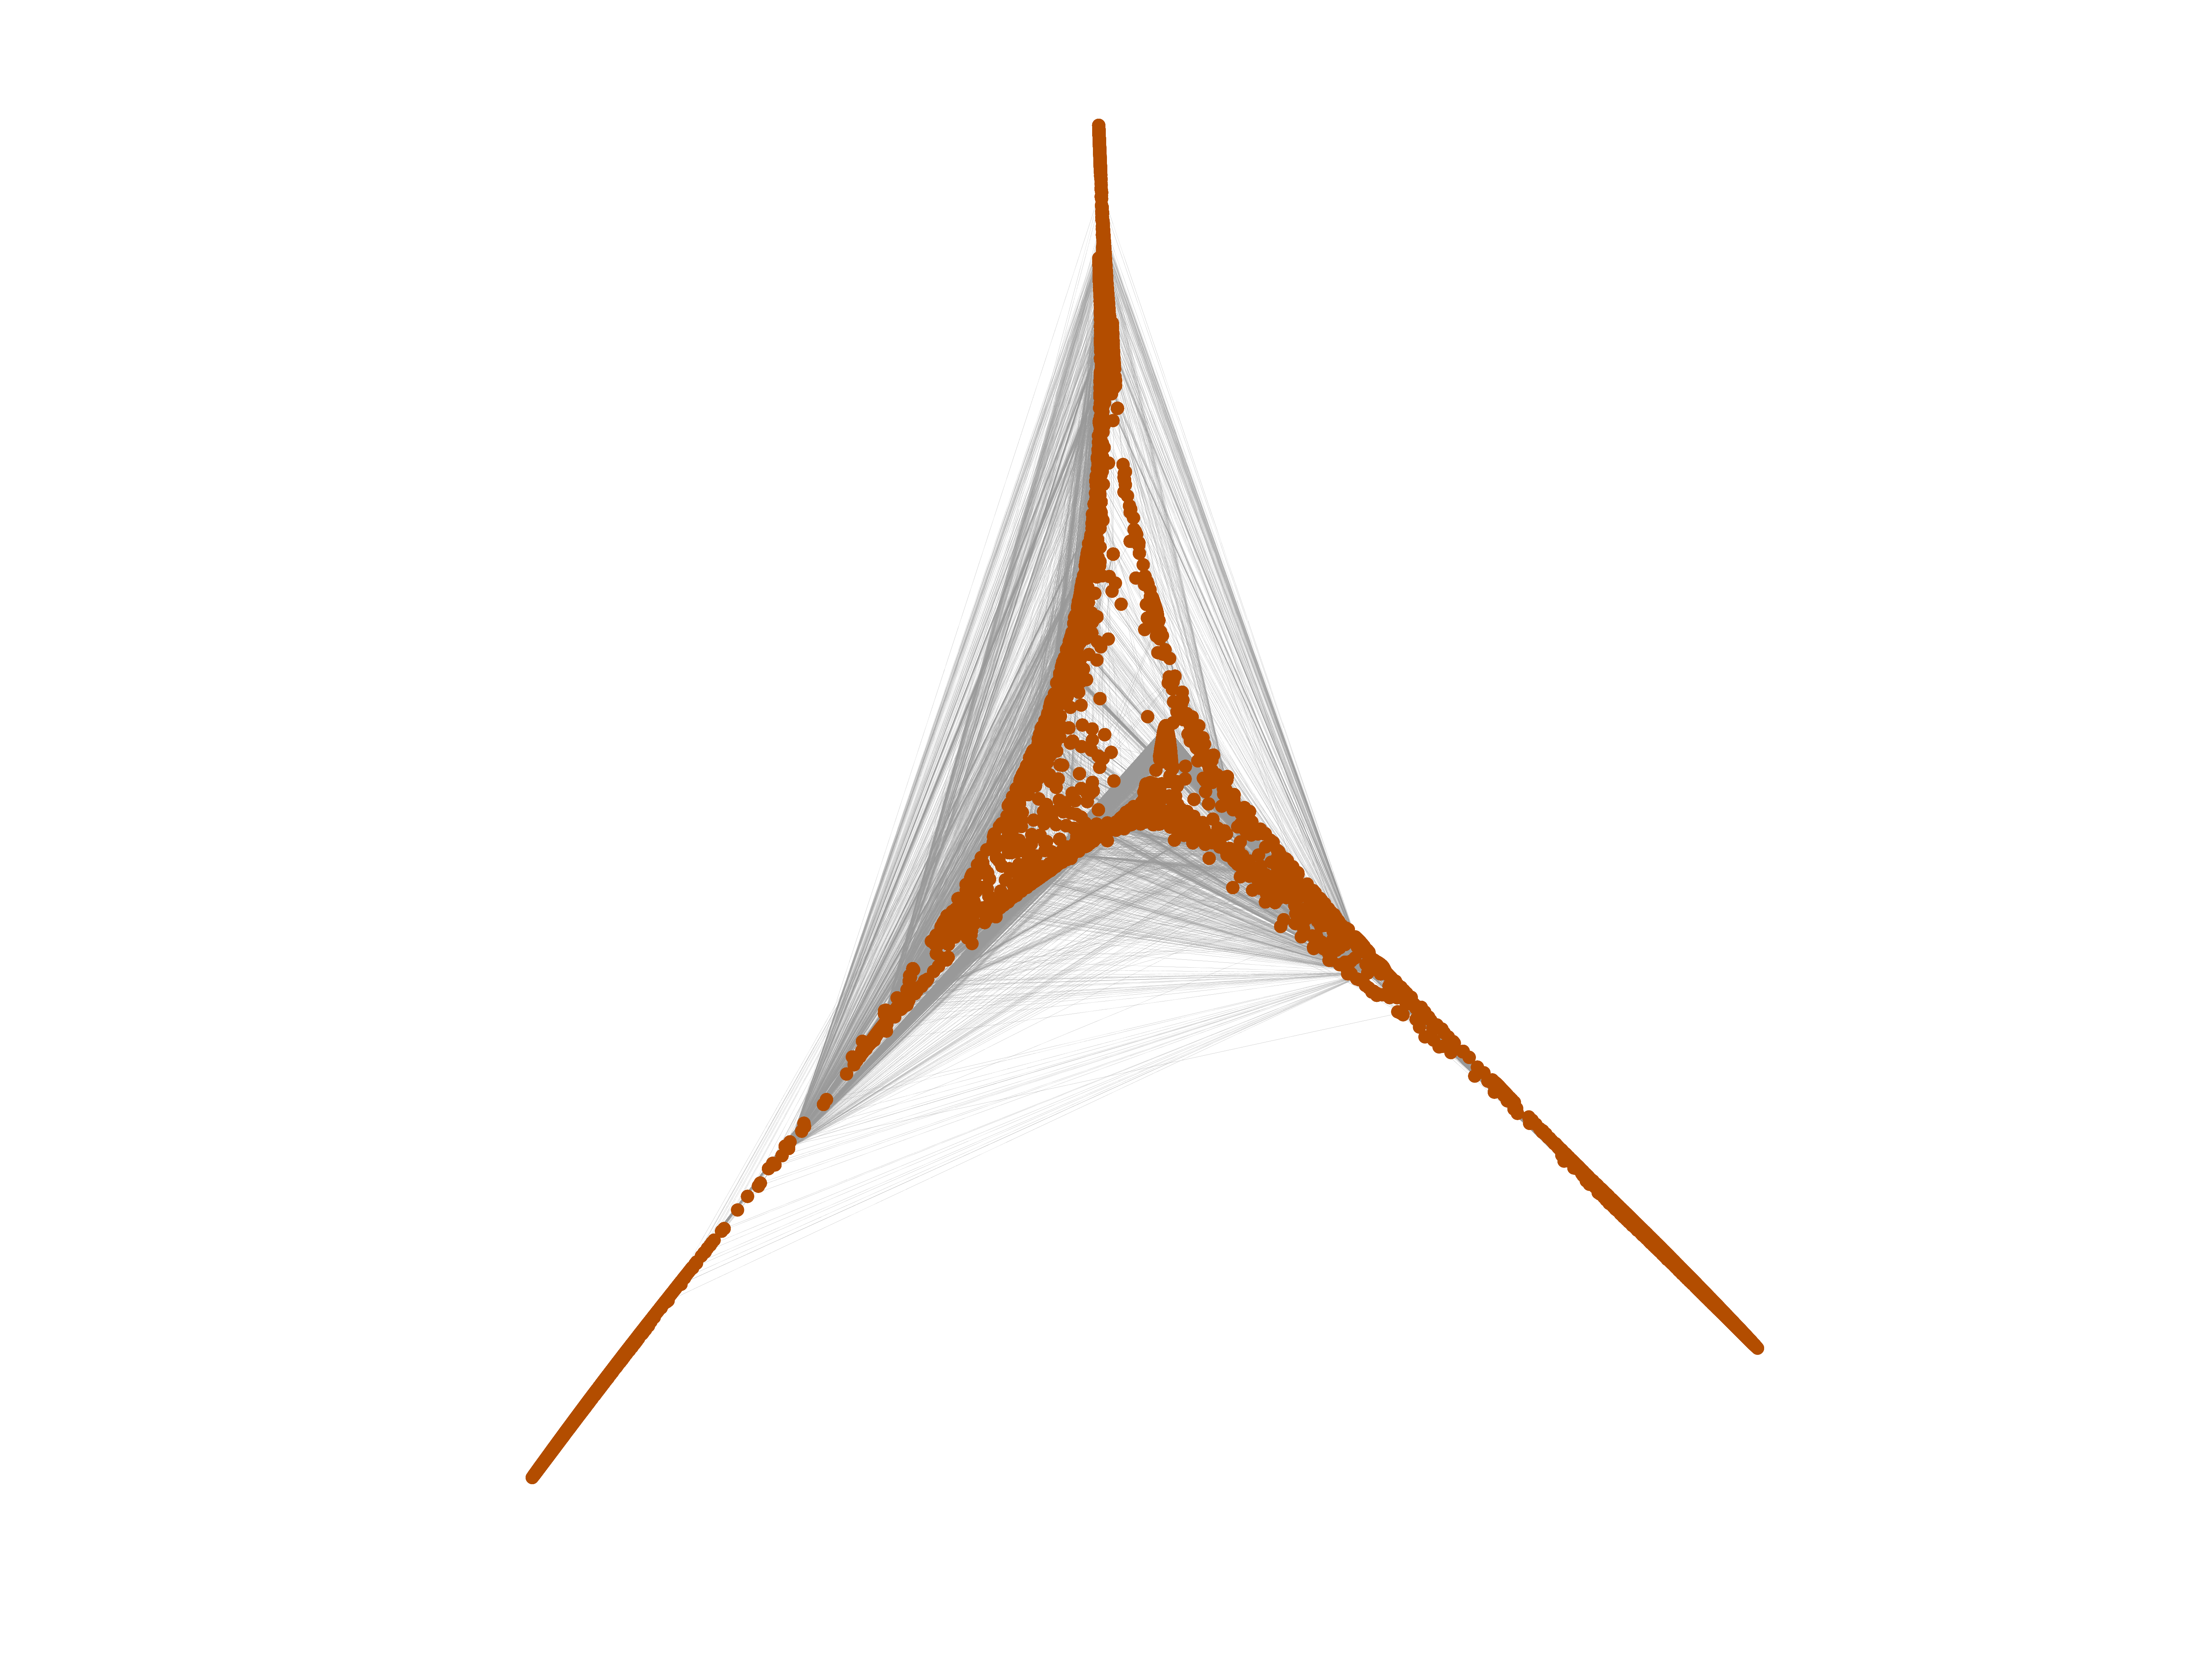
Wikipedia edits (sd)
This is the bipartite edit network of the Sindhi Wikipedia. It contains users
and pages from the Sindhi Wikipedia, connected by edit events. Each edge
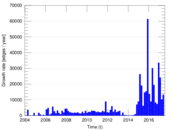
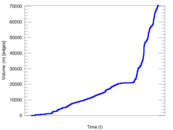
represents an edit. The dataset includes the timestamp of each edit.
Metadata
Statistics
| Size | n = | 25,887
|
| Left size | n1 = | 951
|
| Right size | n2 = | 24,936
|
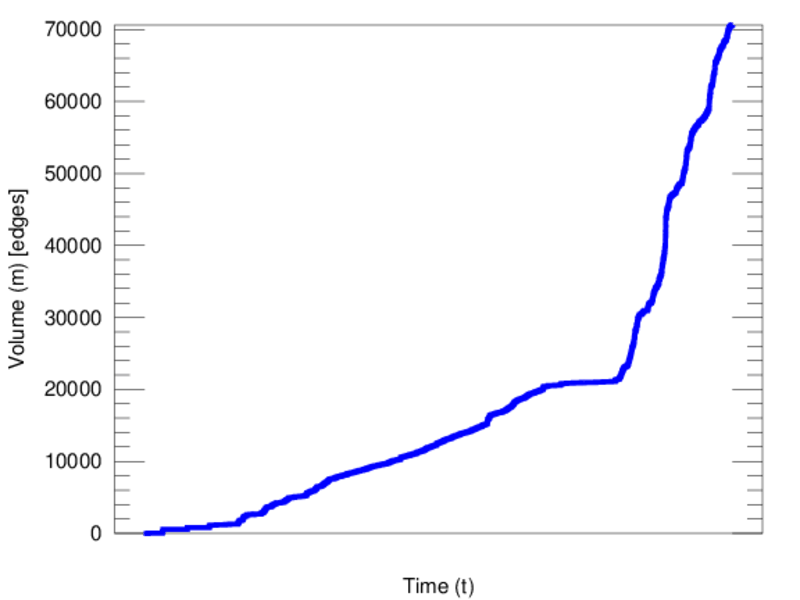
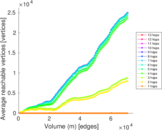
| Volume | m = | 70,629
|
| Unique edge count | m̿ = | 36,887
|
| Wedge count | s = | 104,301,350
|
| Claw count | z = | 314,136,293,280
|
| Cross count | x = | 769,817,396,654,295
|
| Square count | q = | 4,898,563
|
| 4-Tour count | T4 = | 456,475,690
|
| Maximum degree | dmax = | 17,819
|
| Maximum left degree | d1max = | 17,819
|
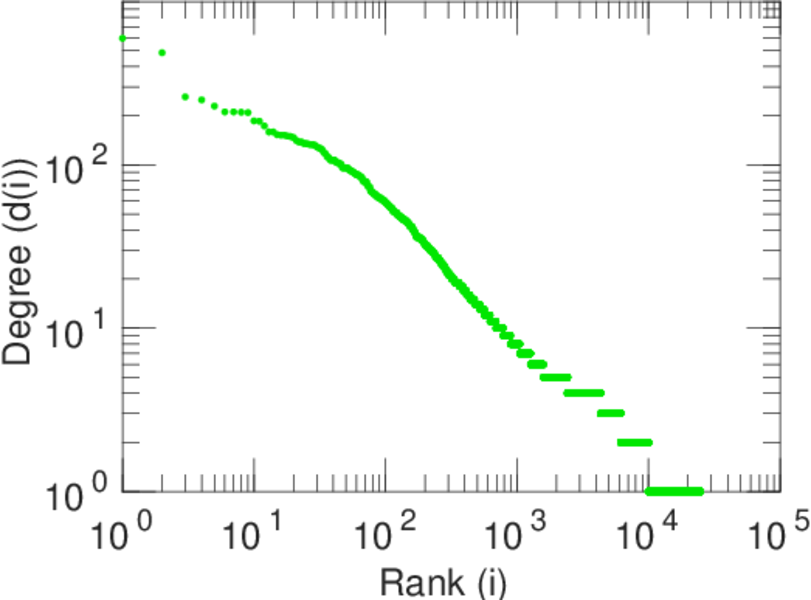
| Maximum right degree | d2max = | 596
|
| Average degree | d = | 5.456 72
|
| Average left degree | d1 = | 74.268 1
|
| Average right degree | d2 = | 2.832 41
|
| Fill | p = | 0.001 555 49
|
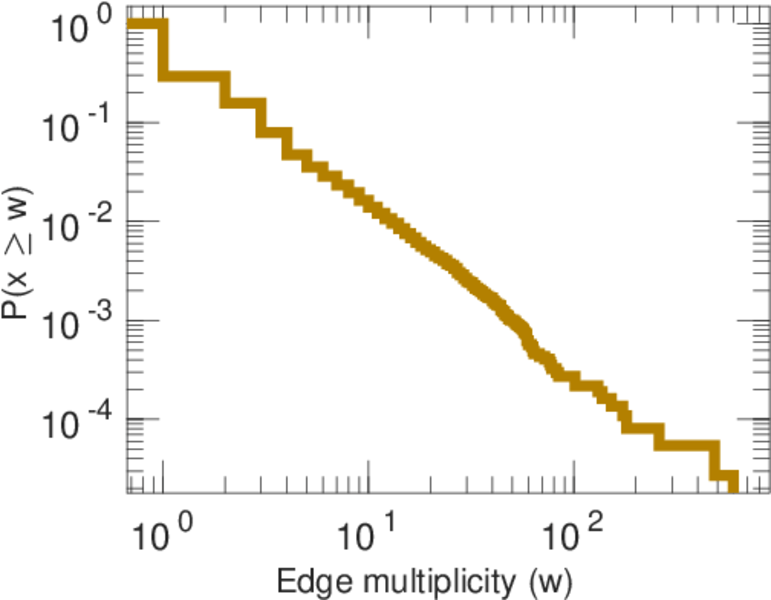
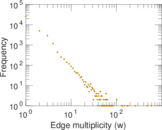
| Average edge multiplicity | m̃ = | 1.914 74
|
| Size of LCC | N = | 24,942
|
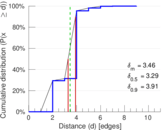
| Diameter | δ = | 11
|
| 50-Percentile effective diameter | δ0.5 = | 3.289 51
|
| 90-Percentile effective diameter | δ0.9 = | 3.913 82
|
| Median distance | δM = | 4
|
| Mean distance | δm = | 3.456 30
|
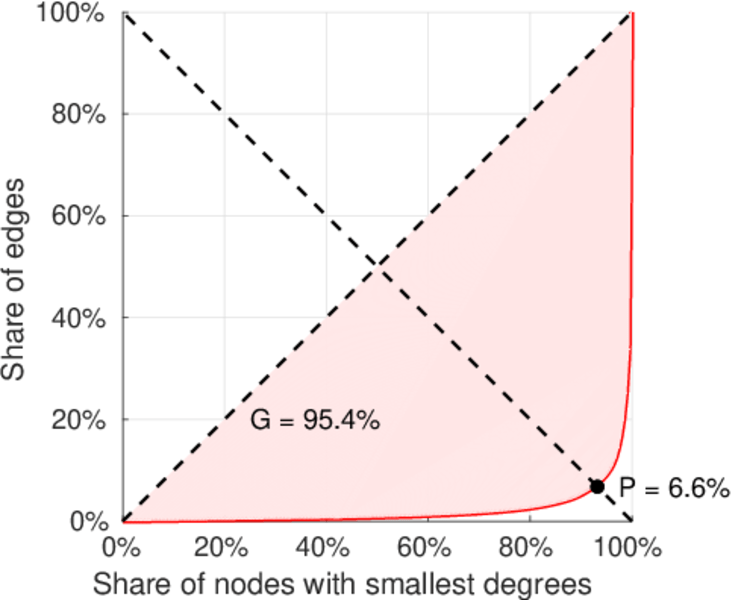
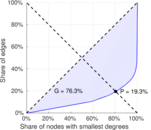
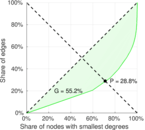
| Gini coefficient | G = | 0.770 574
|
| Balanced inequality ratio | P = | 0.189 278
|
| Left balanced inequality ratio | P1 = | 0.066 205 1
|
| Right balanced inequality ratio | P2 = | 0.288 125
|
| Relative edge distribution entropy | Her = | 0.699 634
|
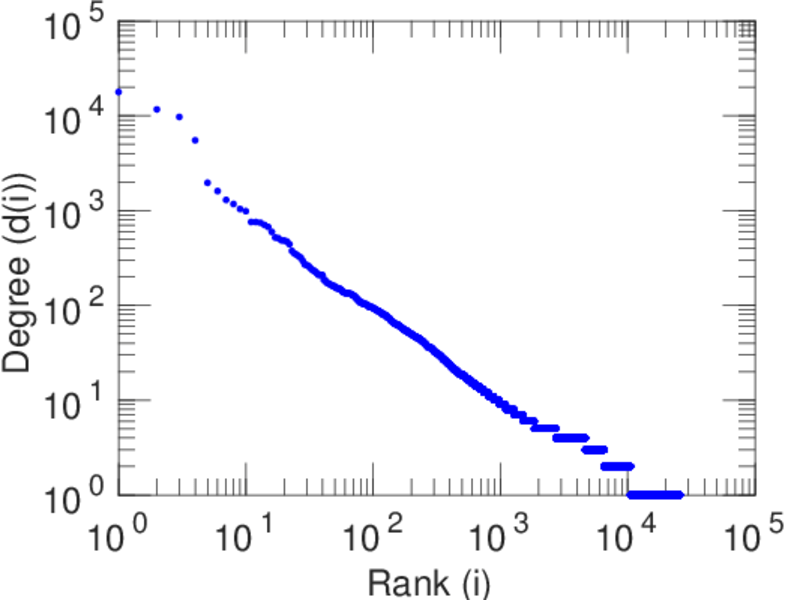
| Power law exponent | γ = | 4.896 30
|
| Tail power law exponent | γt = | 2.601 00
|
| Tail power law exponent with p | γ3 = | 2.601 00
|
| p-value | p = | 0.000 00
|
| Left tail power law exponent with p | γ3,1 = | 1.661 00
|
| Left p-value | p1 = | 0.195 000
|
| Right tail power law exponent with p | γ3,2 = | 2.691 00
|
| Right p-value | p2 = | 0.000 00
|
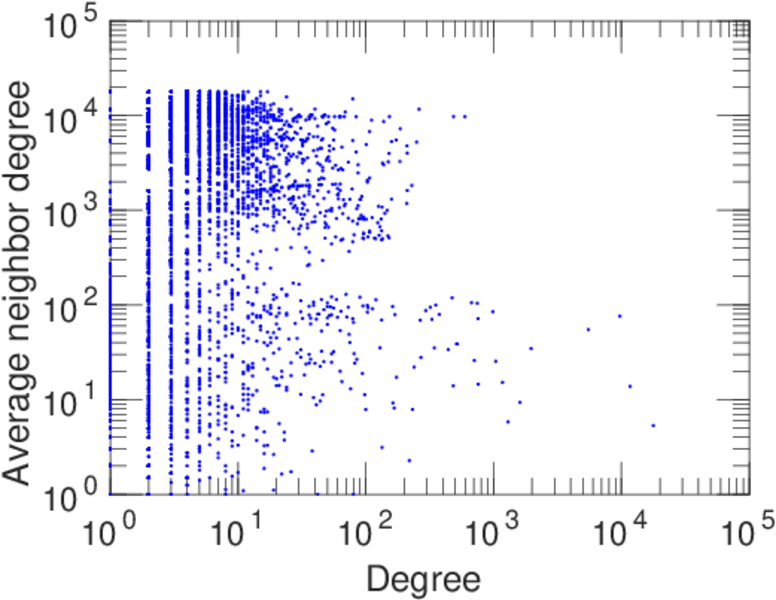
| Degree assortativity | ρ = | −0.393 491
|
| Degree assortativity p-value | pρ = | 0.000 00
|
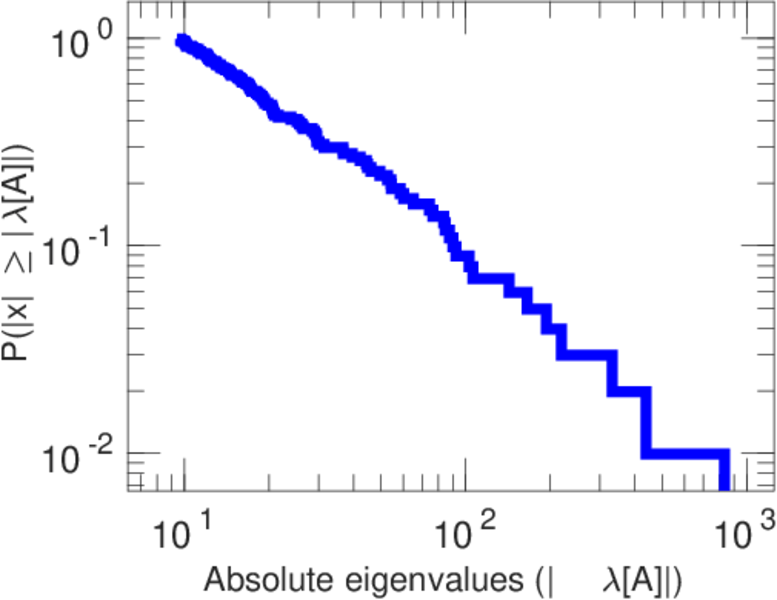
| Spectral norm | α = | 832.225
|
| Algebraic connectivity | a = | 0.040 800 9
|
| Spectral separation | |λ1[A] / λ2[A]| = | 1.899 46
|
| Controllability | C = | 23,852
|
| Relative controllability | Cr = | 0.930 410
|
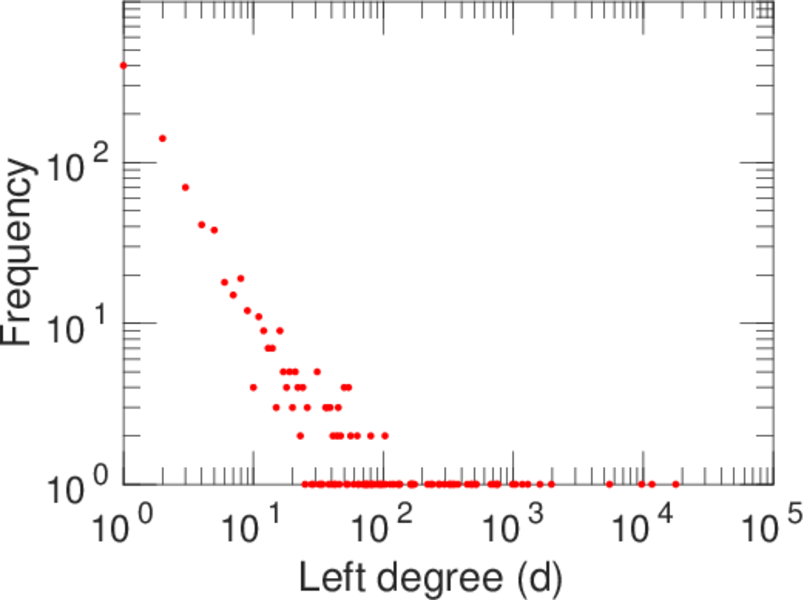
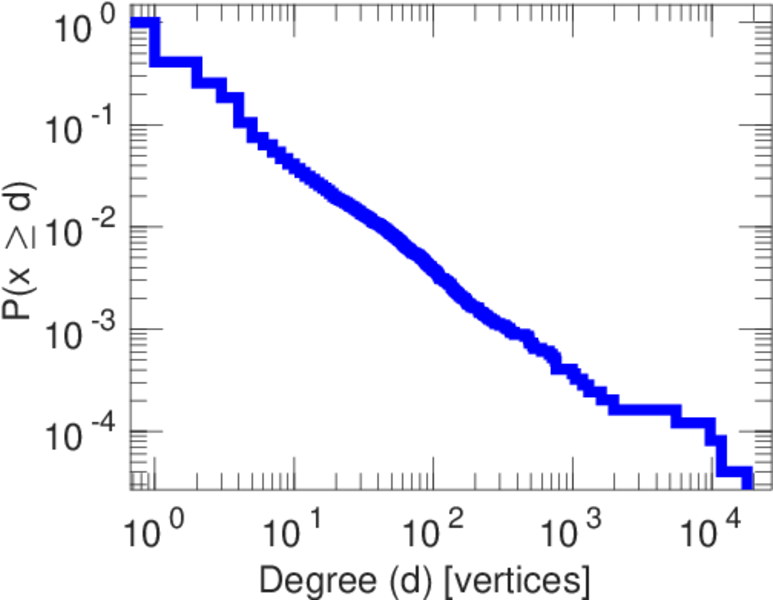
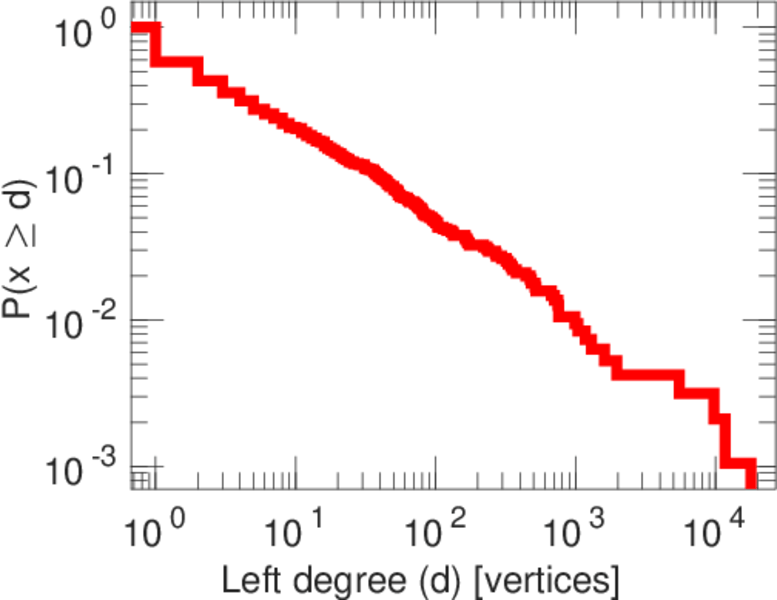
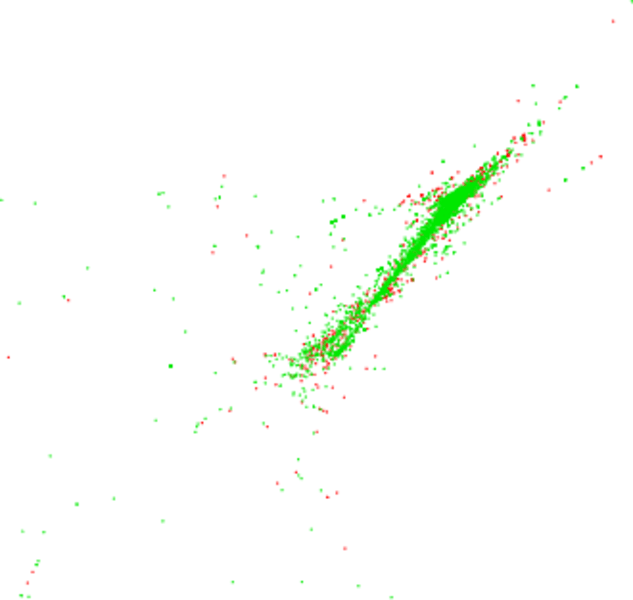
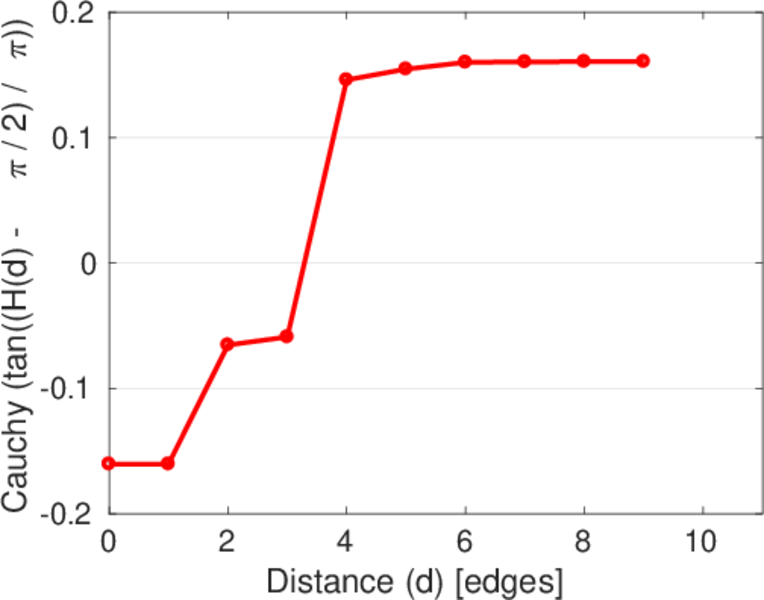
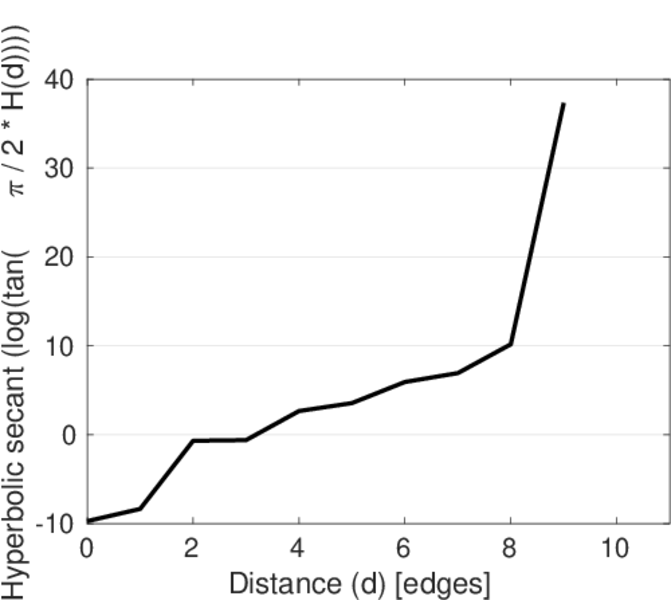
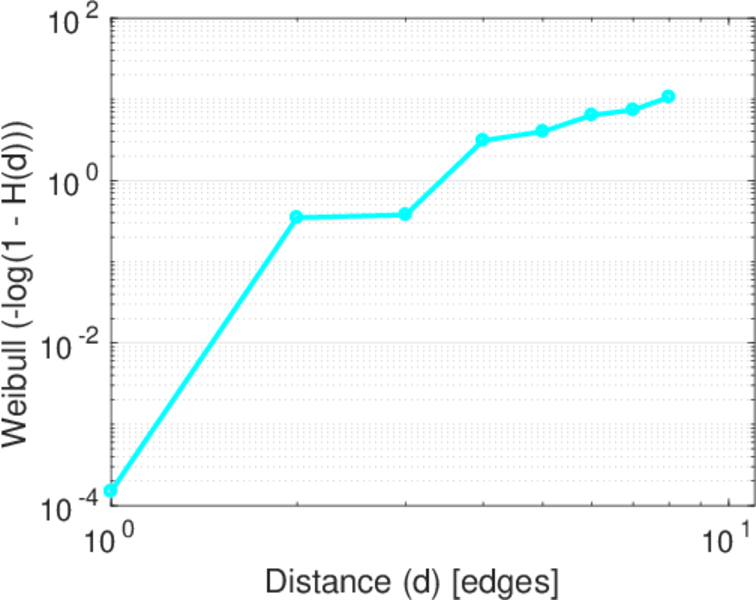
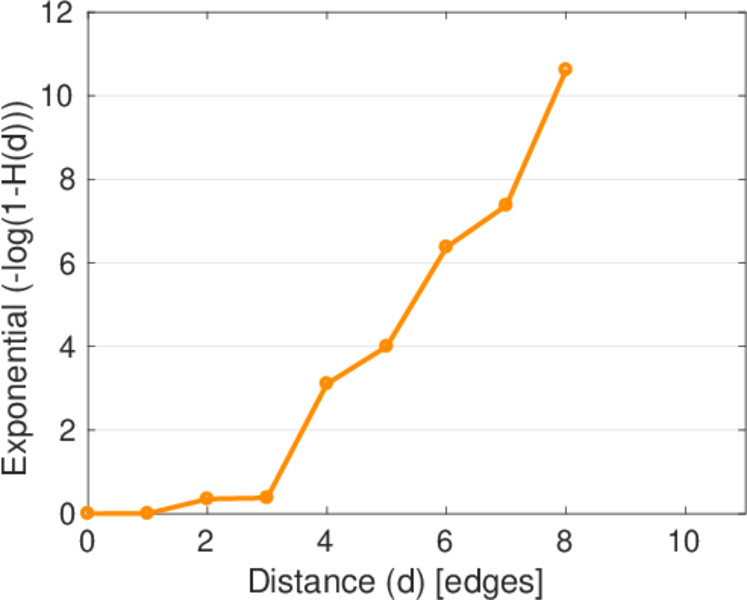
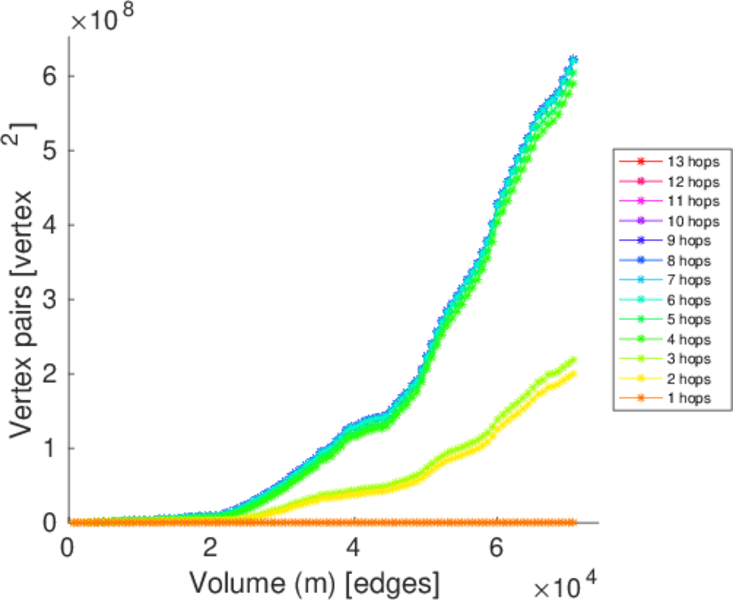
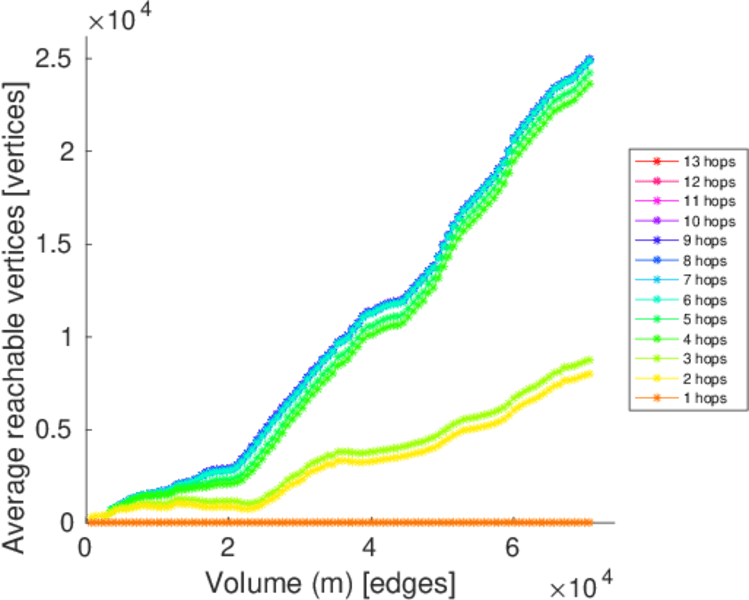
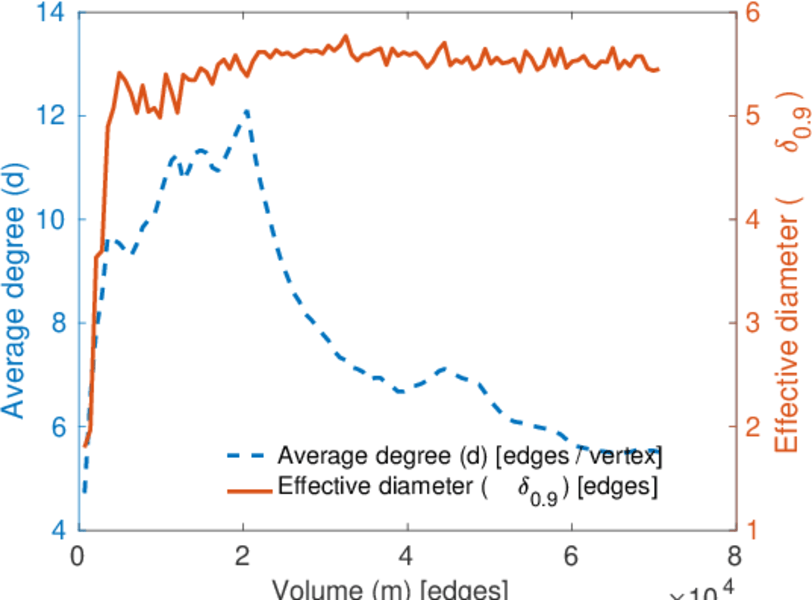
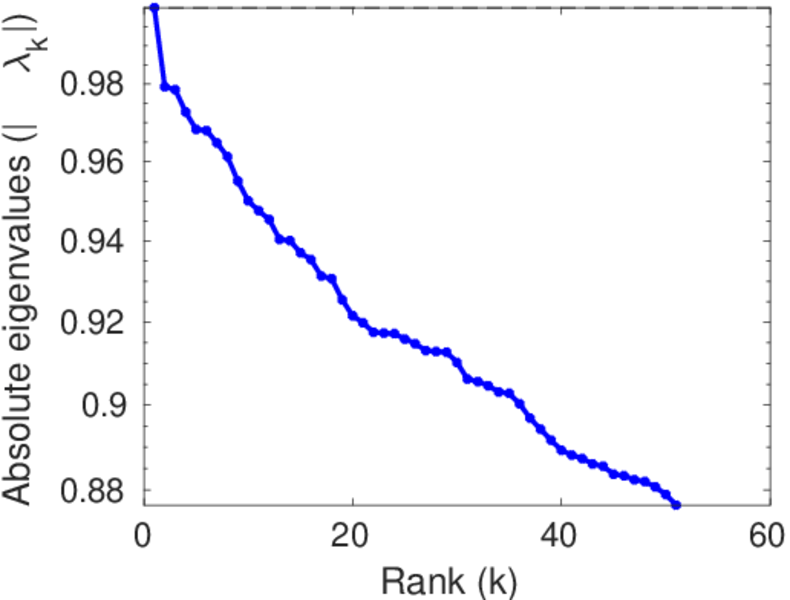
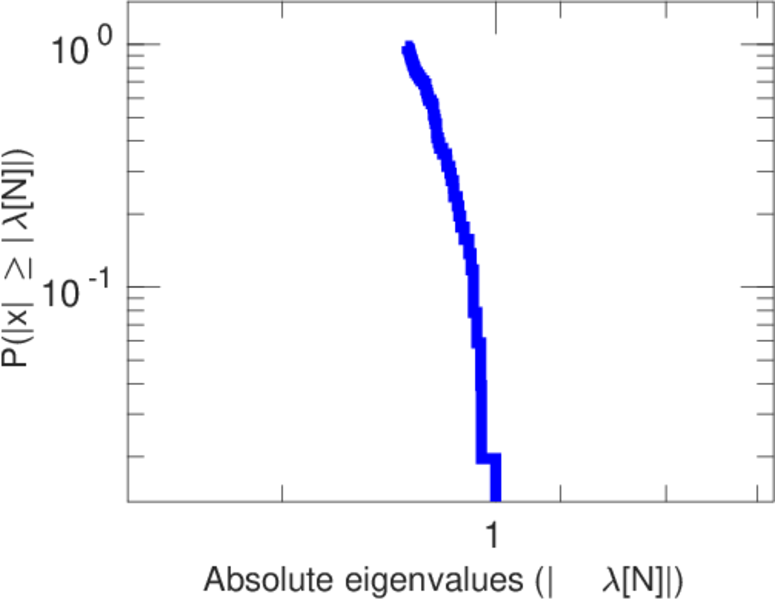
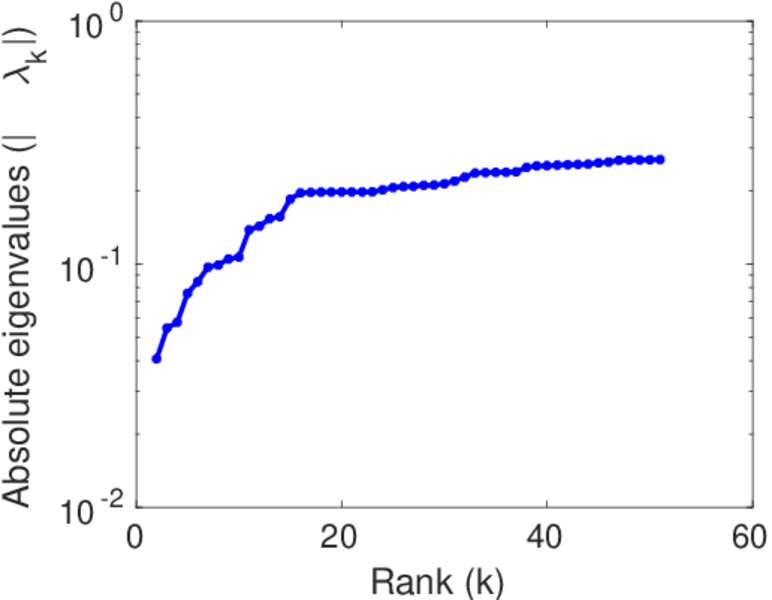
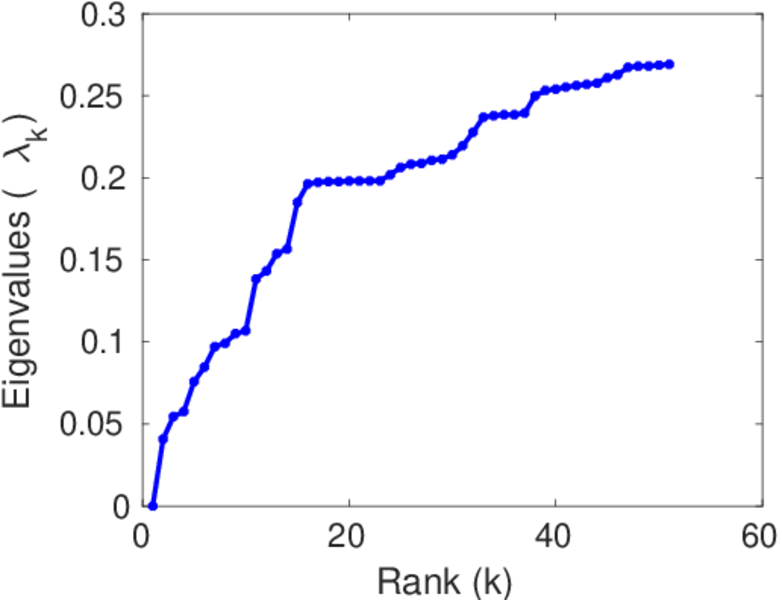
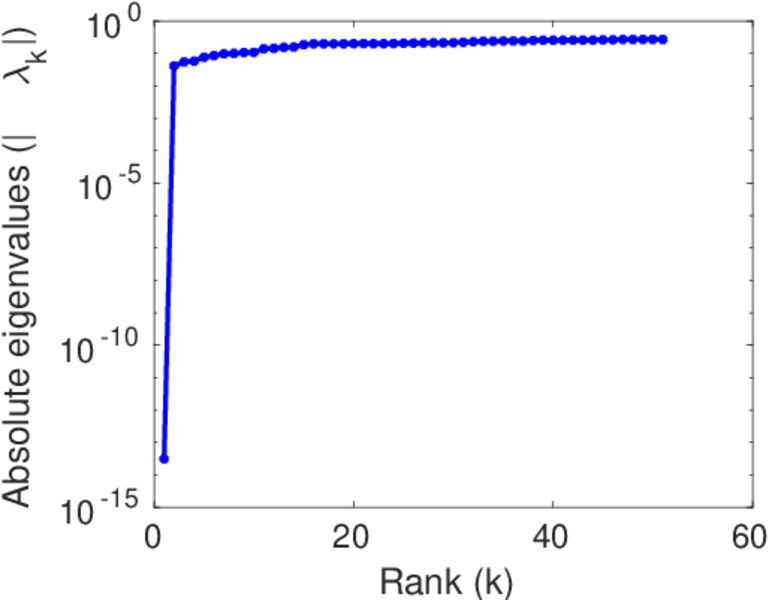
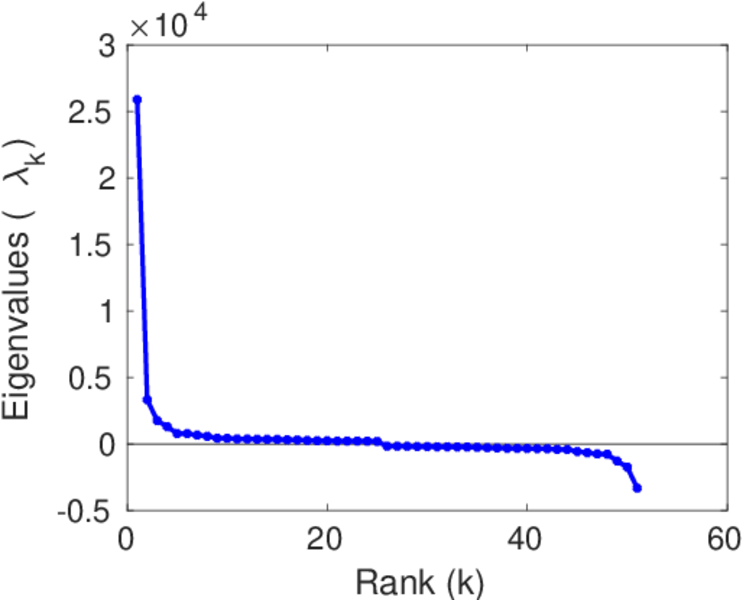
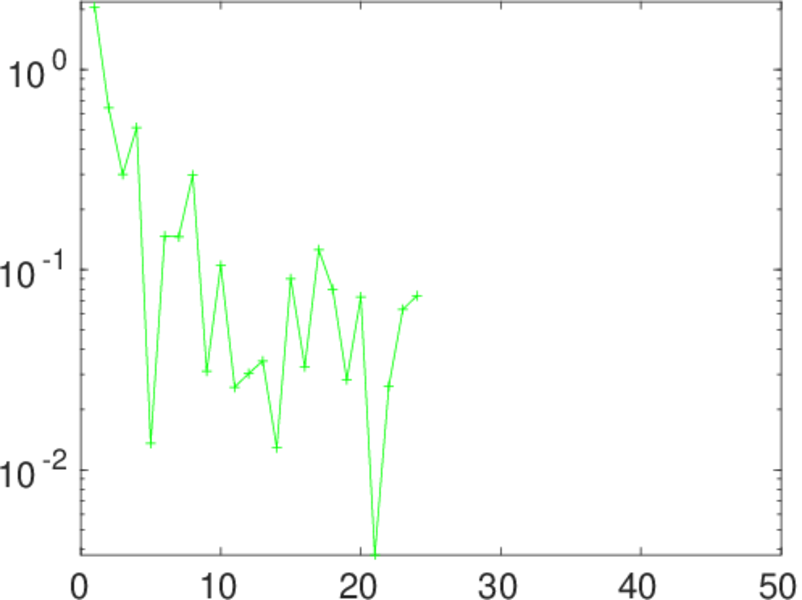
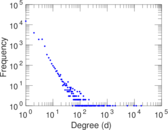
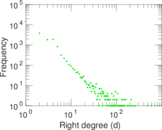
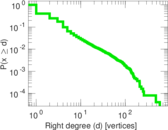
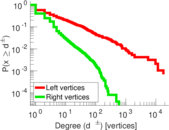
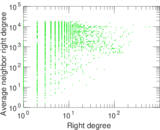
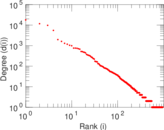
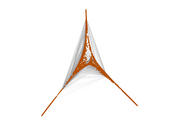
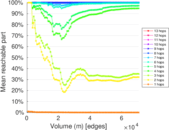
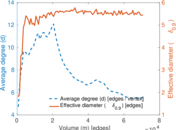
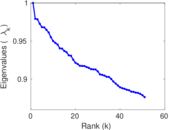
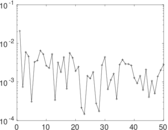
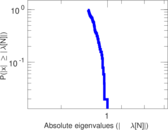
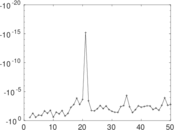
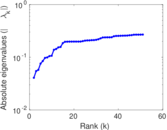
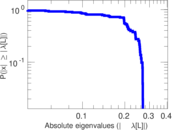
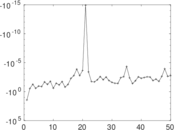
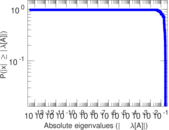
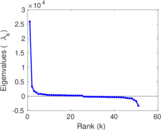
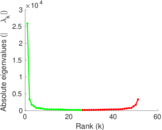
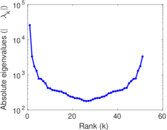
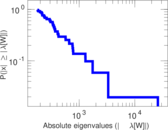
Plots


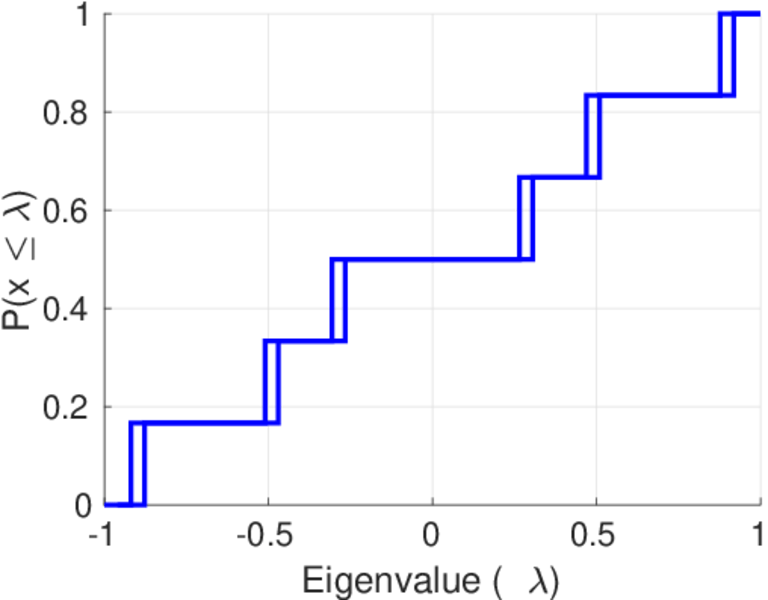
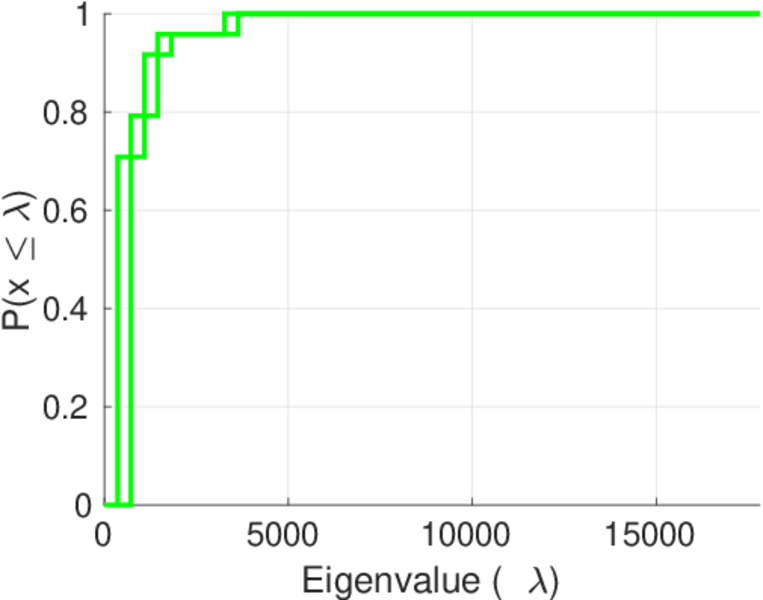
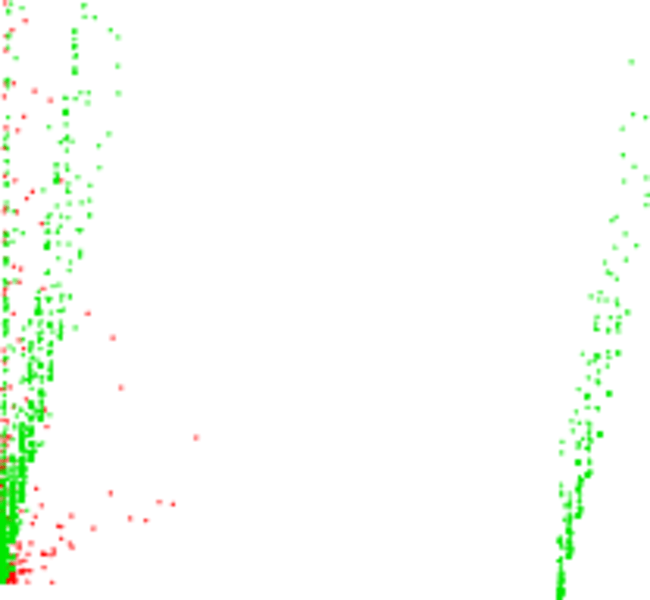
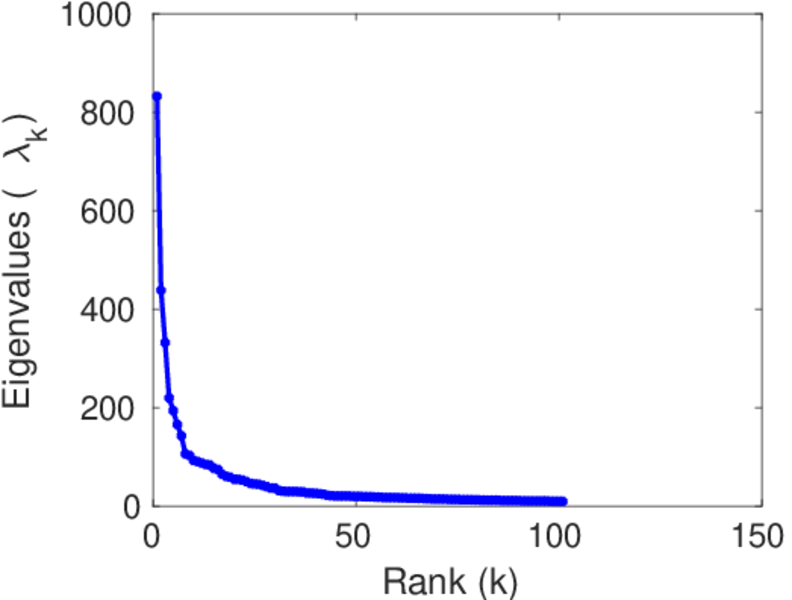
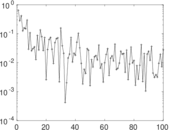
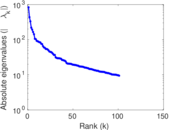
Matrix decompositions plots


Downloads
References
|
[1]
|
Jérôme Kunegis.
KONECT – The Koblenz Network Collection.
In Proc. Int. Conf. on World Wide Web Companion, pages
1343–1350, 2013.
[ http ]
|
|
[2]
|
Wikimedia Foundation.
Wikimedia downloads.
http://dumps.wikimedia.org/, January 2010.
|
 KONECT ‣ Networks ‣
Buy Me a Coffee
KONECT ‣ Networks ‣
Buy Me a Coffee