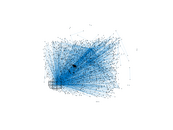
Wikinews edits (sd)
This is the bipartite edit network of the Sindhi Wikinews. It contains users
and pages from the Sindhi Wikinews, connected by edit events. Each edge
represents an edit. The dataset includes the timestamp of each edit.
Metadata
Statistics
| Size | n = | 2,208
|
| Left size | n1 = | 106
|
| Right size | n2 = | 2,102
|
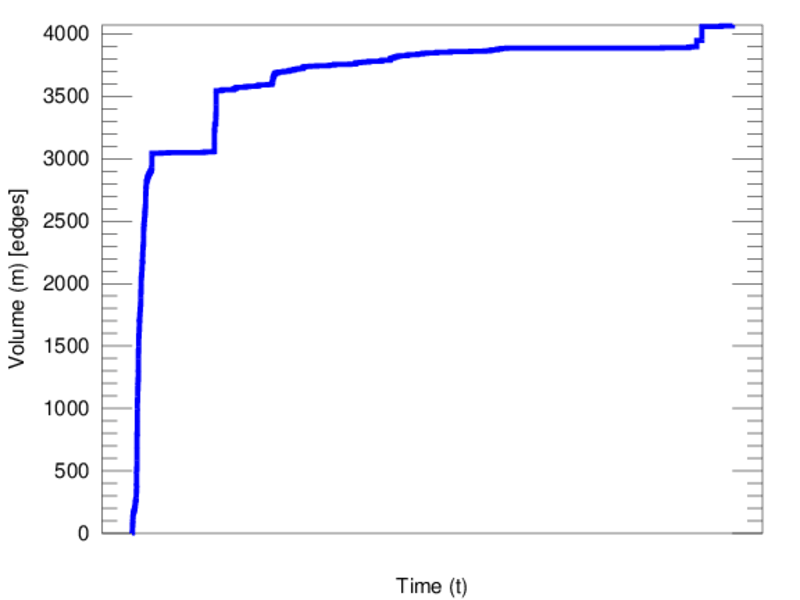
| Volume | m = | 4,069
|
| Unique edge count | m̿ = | 2,753
|
| Wedge count | s = | 1,276,118
|
| Claw count | z = | 600,985,303
|
| Cross count | x = | 224,571,666,148
|
| Square count | q = | 82,324
|
| 4-Tour count | T4 = | 5,776,318
|
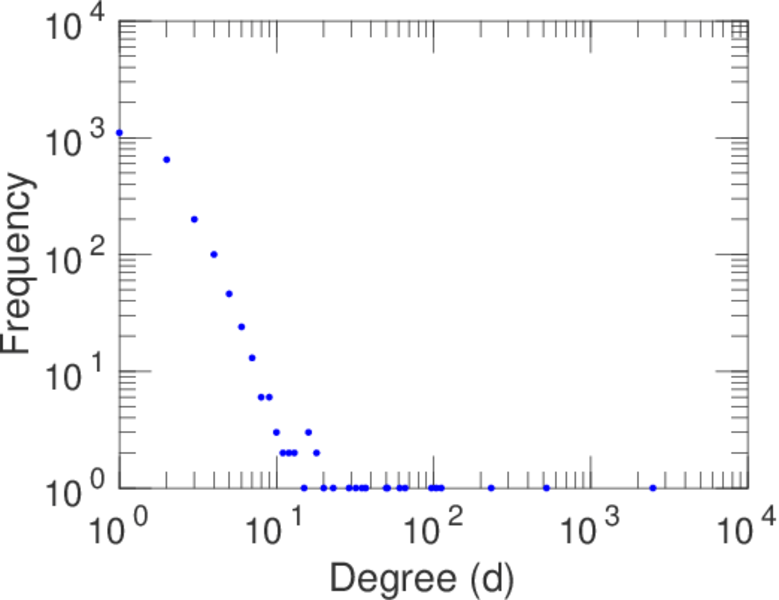
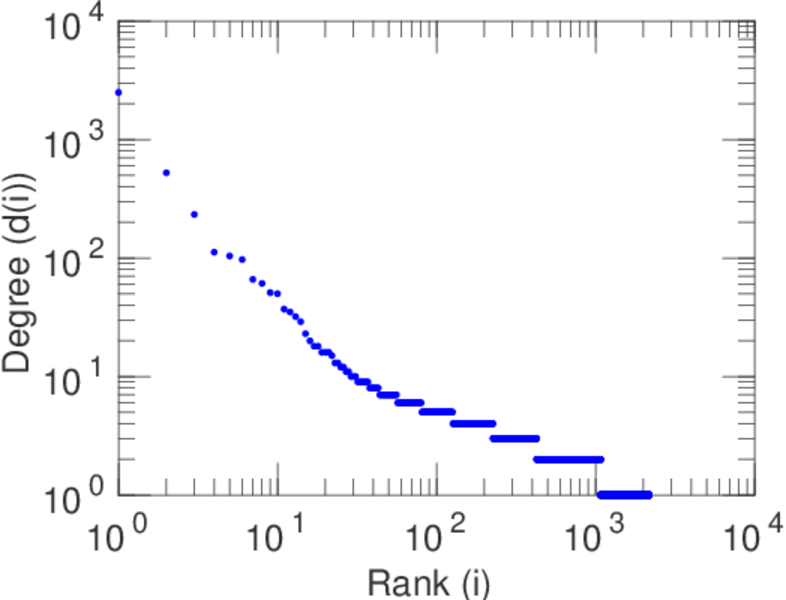
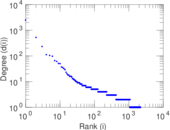
| Maximum degree | dmax = | 2,495
|
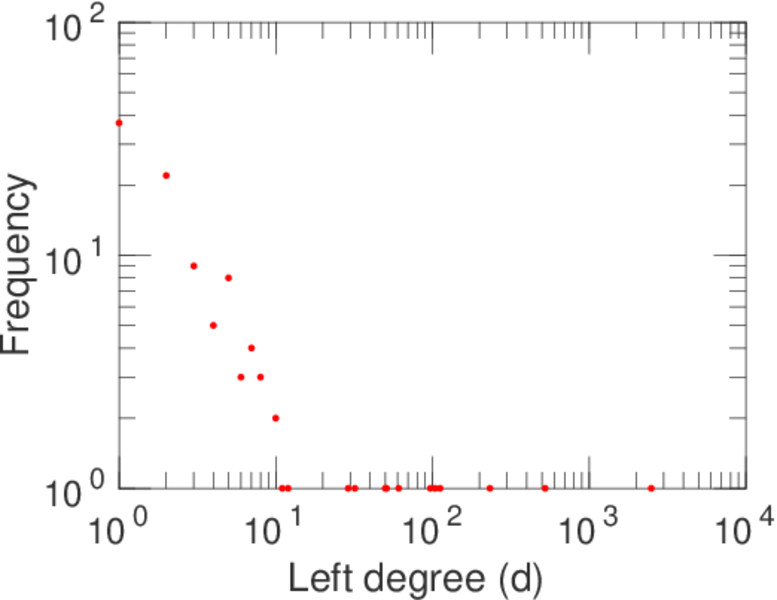
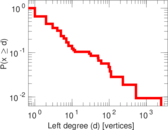
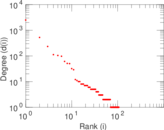
| Maximum left degree | d1max = | 2,495
|
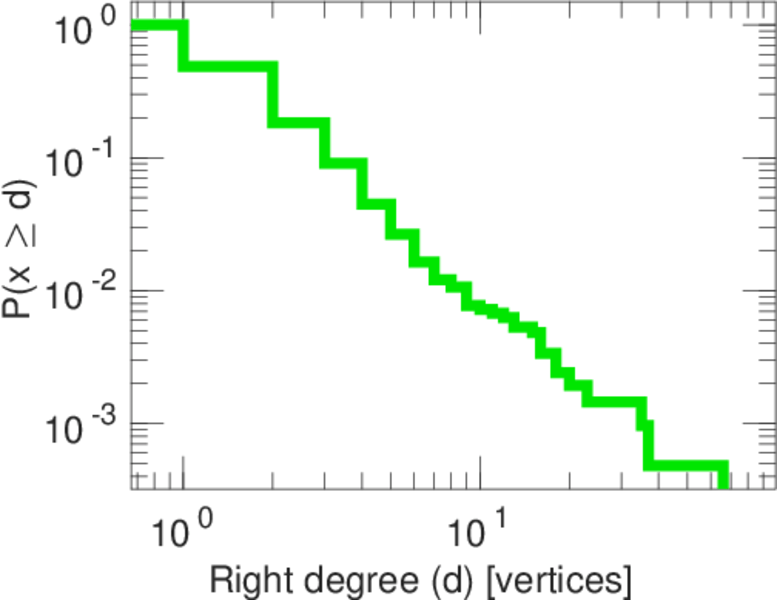
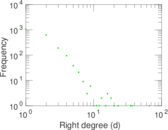
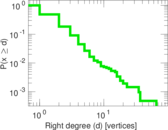
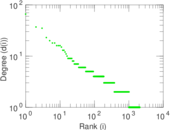
| Maximum right degree | d2max = | 66
|
| Average degree | d = | 3.685 69
|
| Average left degree | d1 = | 38.386 8
|
| Average right degree | d2 = | 1.935 78
|
| Fill | p = | 0.012 355 7
|
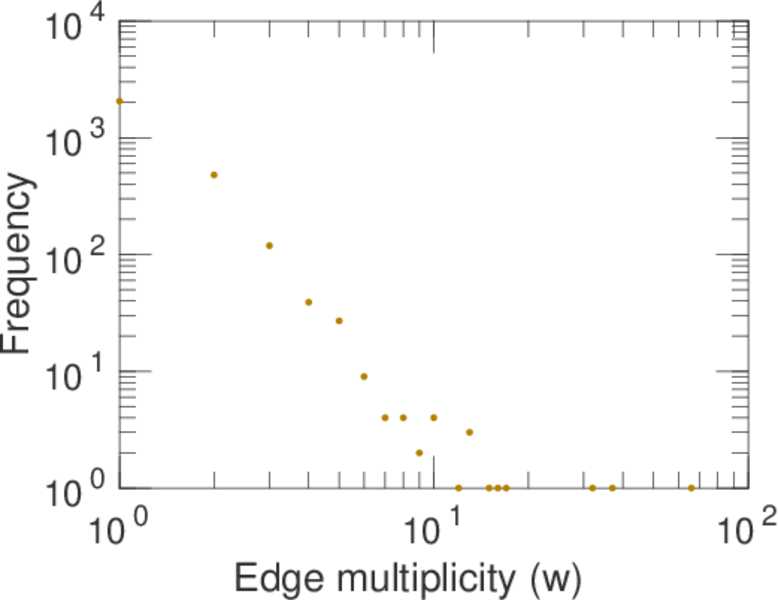
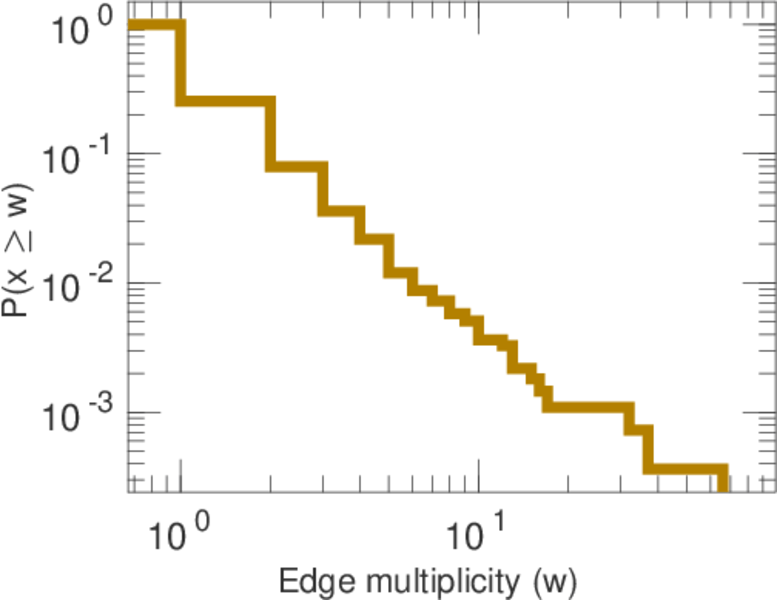
| Average edge multiplicity | m̃ = | 1.478 02
|
| Size of LCC | N = | 2,011
|
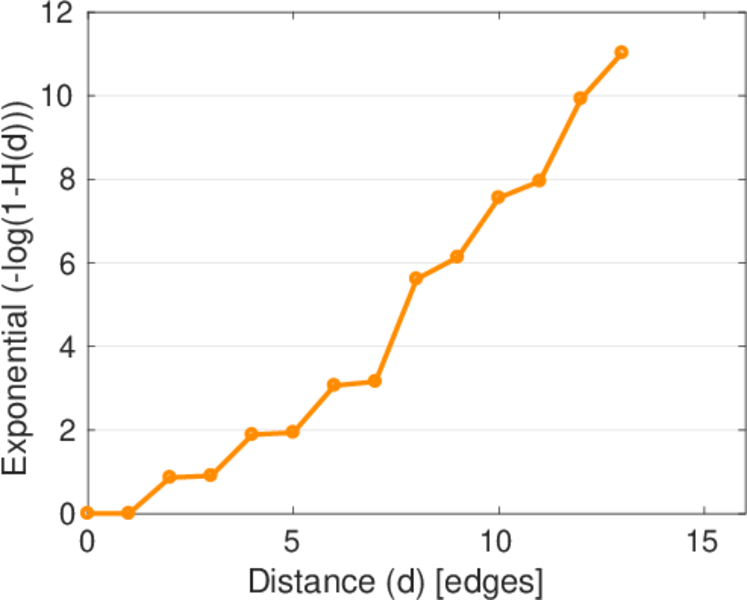
| Diameter | δ = | 15
|
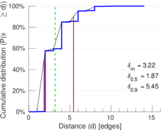
| 50-Percentile effective diameter | δ0.5 = | 1.865 01
|
| 90-Percentile effective diameter | δ0.9 = | 5.450 67
|
| Median distance | δM = | 2
|
| Mean distance | δm = | 3.215 22
|
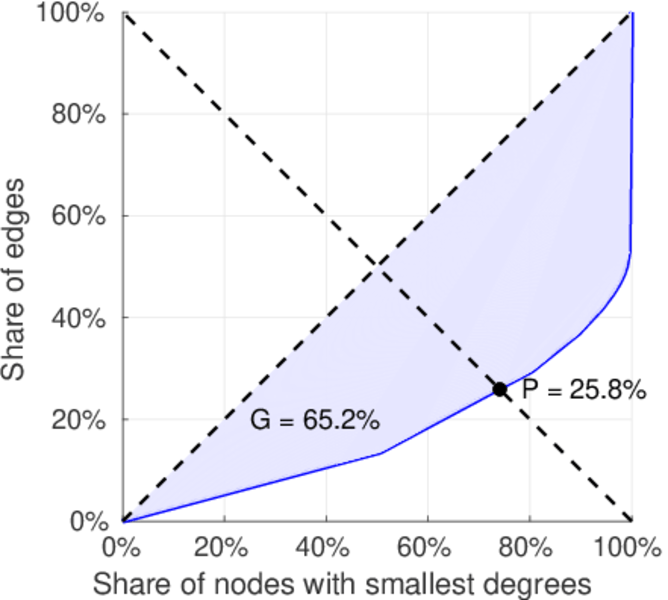
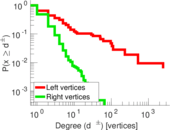
| Gini coefficient | G = | 0.665 201
|
| Balanced inequality ratio | P = | 0.251 905
|
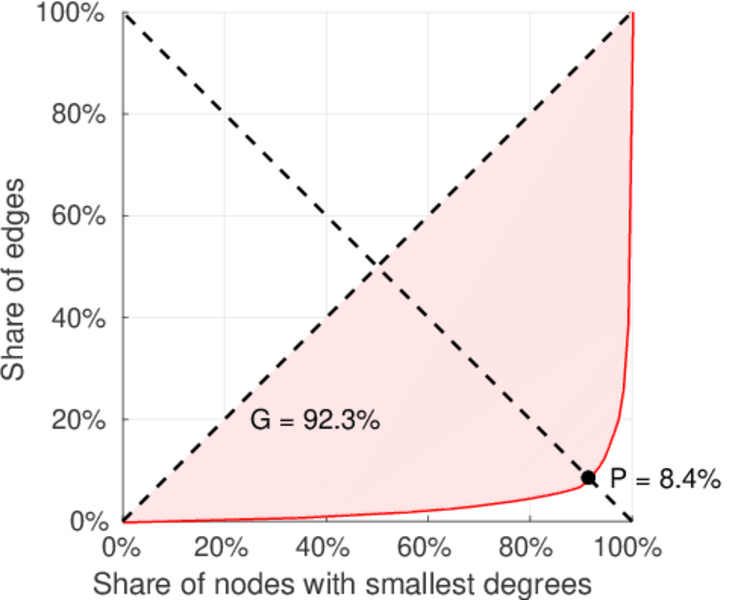
| Left balanced inequality ratio | P1 = | 0.084 050 1
|
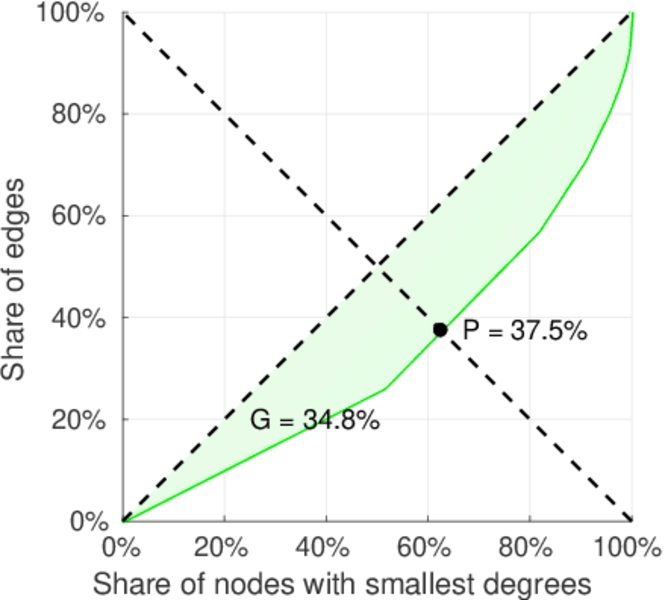
| Right balanced inequality ratio | P2 = | 0.374 539
|
| Relative edge distribution entropy | Her = | 0.705 490
|
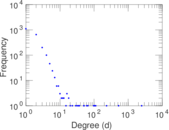
| Power law exponent | γ = | 4.992 54
|
| Tail power law exponent | γt = | 2.621 00
|
| Tail power law exponent with p | γ3 = | 2.621 00
|
| p-value | p = | 0.000 00
|
| Left tail power law exponent with p | γ3,1 = | 1.681 00
|
| Left p-value | p1 = | 0.294 000
|
| Right tail power law exponent with p | γ3,2 = | 5.841 00
|
| Right p-value | p2 = | 0.465 000
|
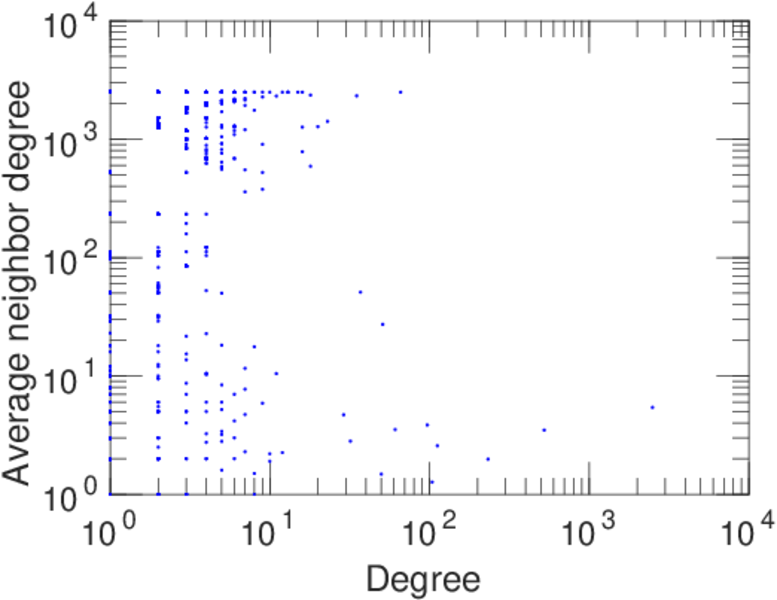
| Degree assortativity | ρ = | −0.218 982
|
| Degree assortativity p-value | pρ = | 3.041 95 × 10−31
|
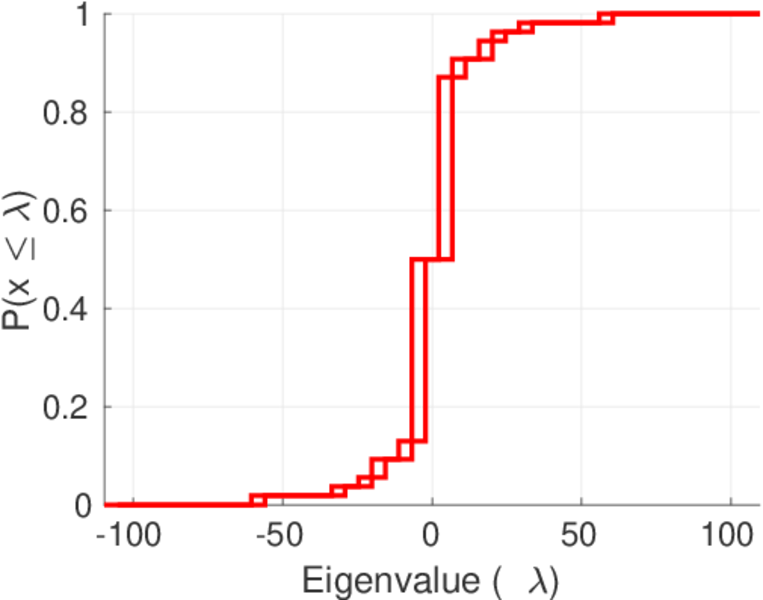
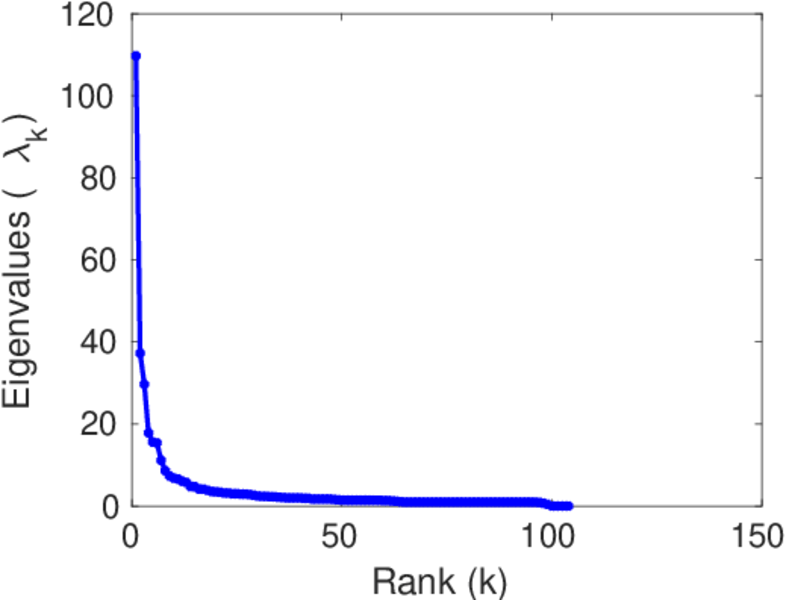
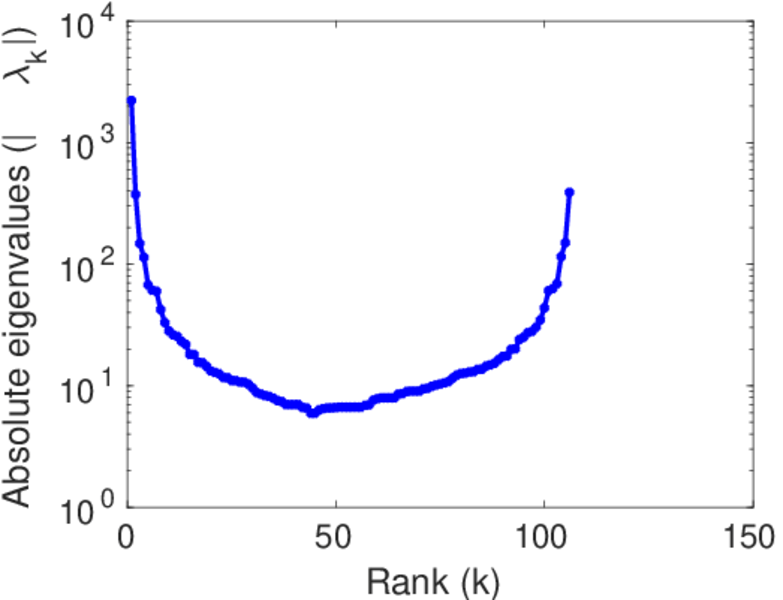
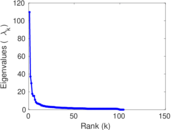
| Spectral norm | α = | 109.703
|
| Algebraic connectivity | a = | 0.004 623 28
|
| Spectral separation | |λ1[A] / λ2[A]| = | 2.943 52
|
| Controllability | C = | 1,980
|
| Relative controllability | Cr = | 0.909 091
|
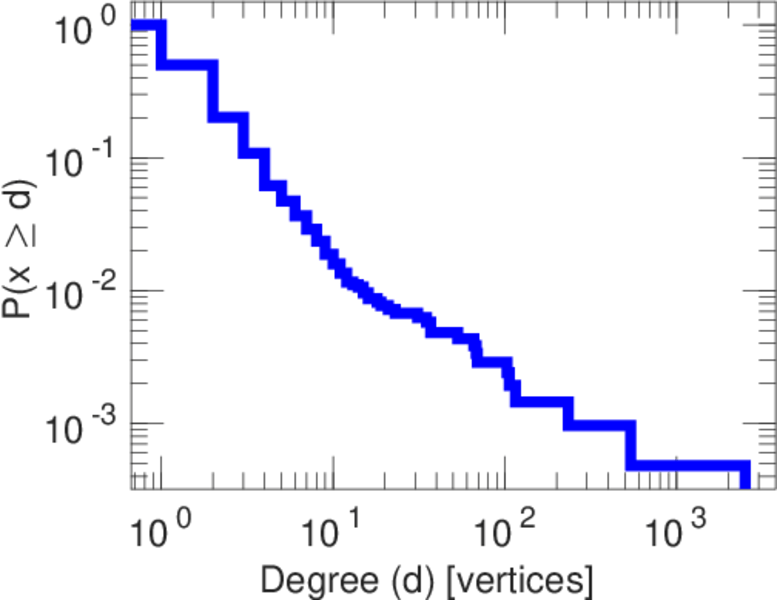
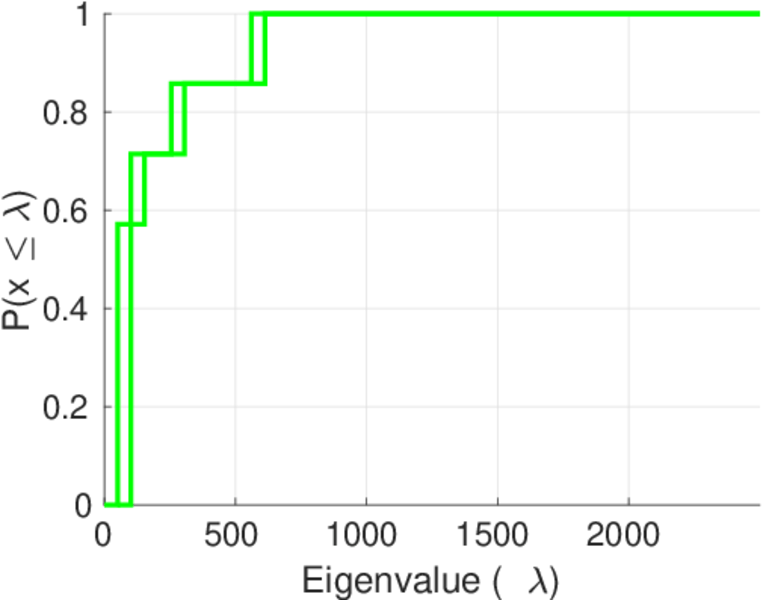
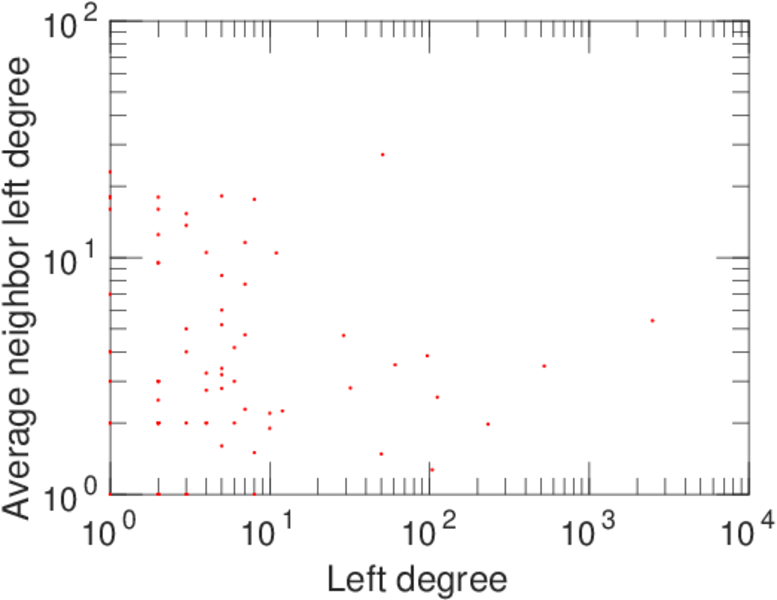
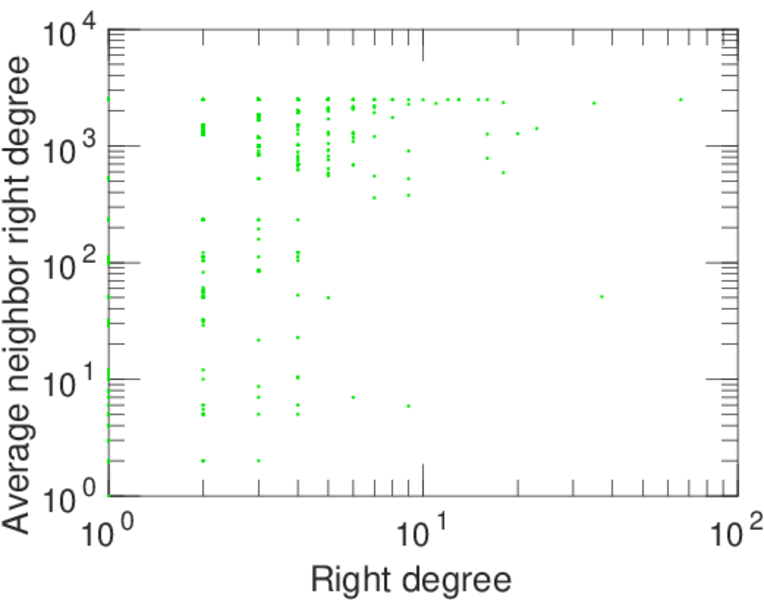
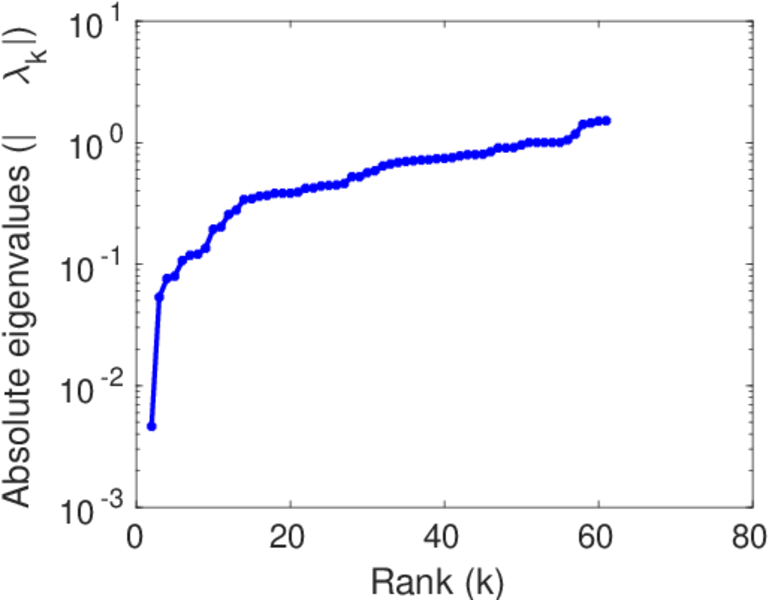
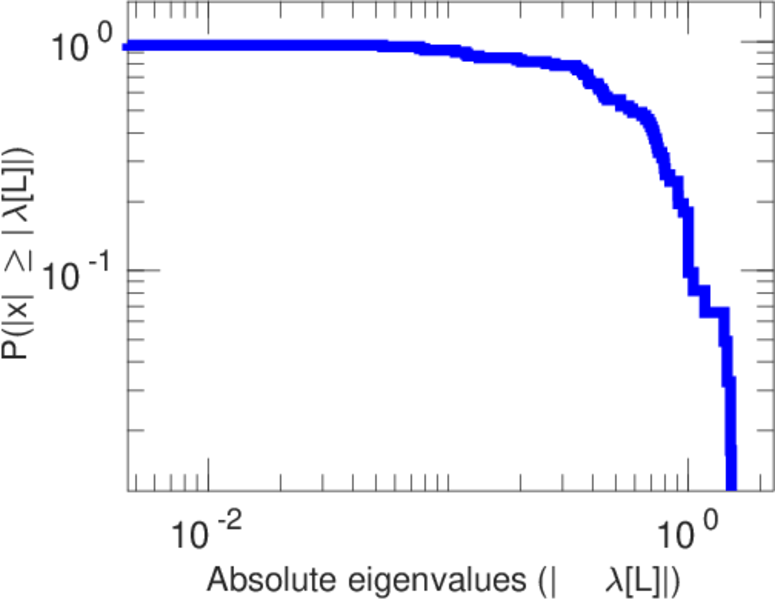
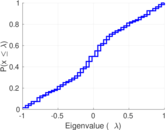
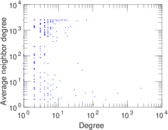
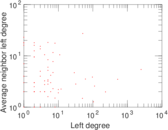
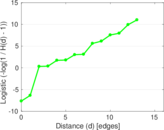
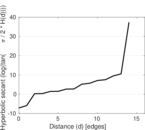
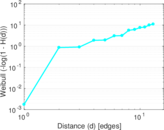
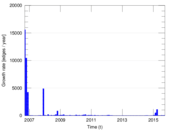
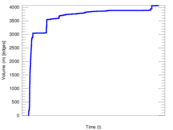
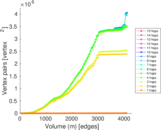
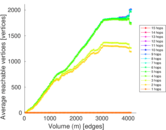
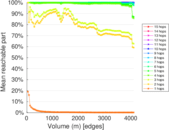
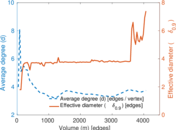
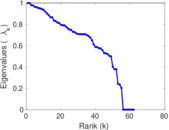
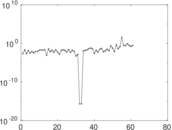
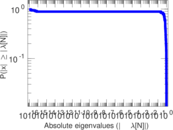
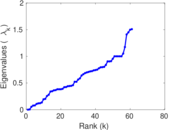
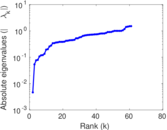
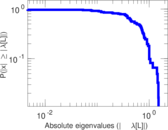
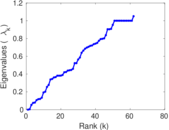
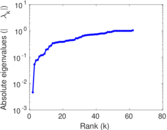
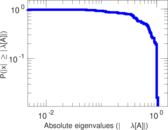
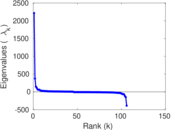
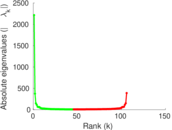
Plots


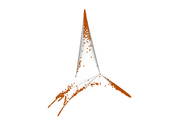


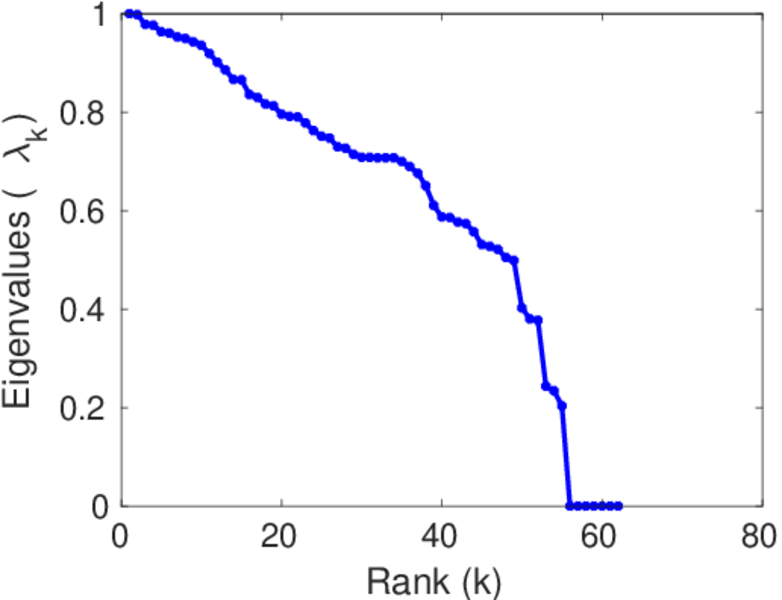
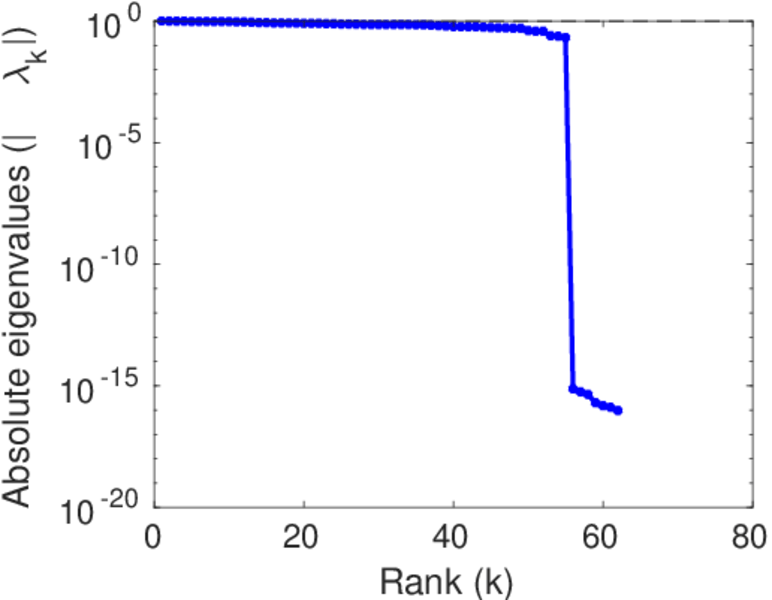
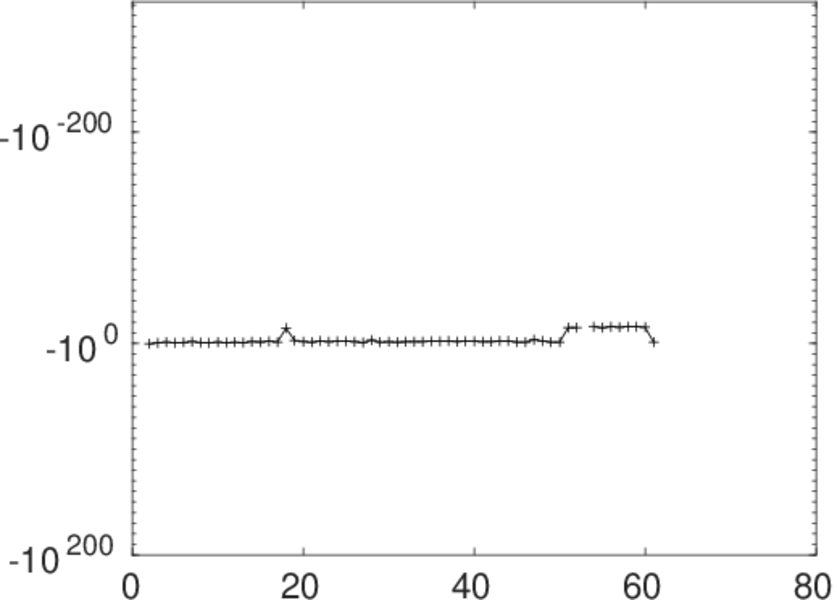
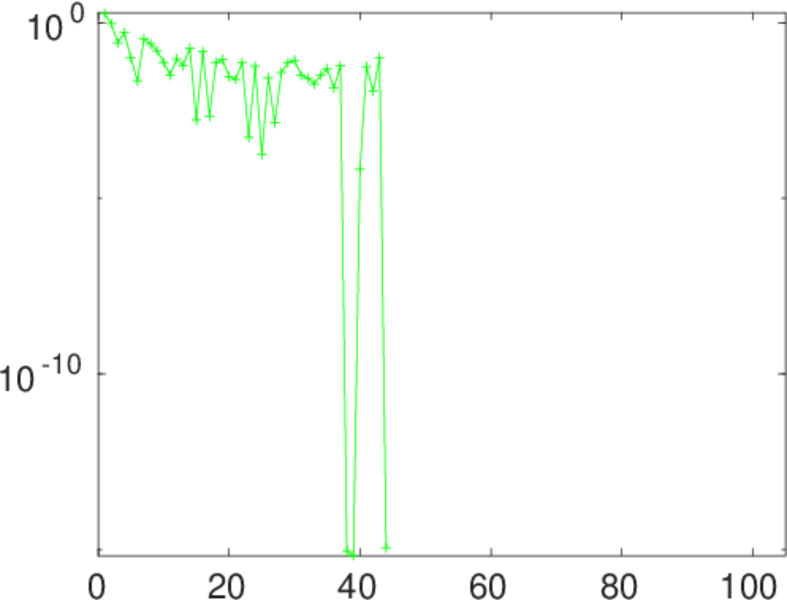
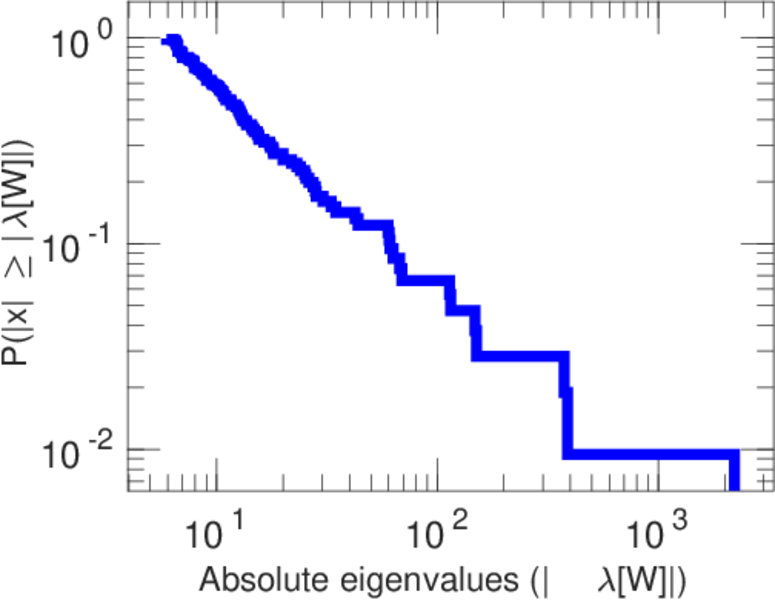
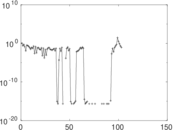
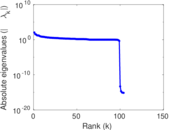
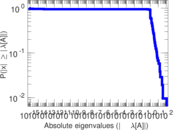
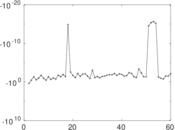
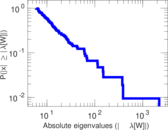
Matrix decompositions plots


Downloads
References
|
[1]
|
Jérôme Kunegis.
KONECT – The Koblenz Network Collection.
In Proc. Int. Conf. on World Wide Web Companion, pages
1343–1350, 2013.
[ http ]
|
|
[2]
|
Wikimedia Foundation.
Wikimedia downloads.
http://dumps.wikimedia.org/, January 2010.
|
 KONECT ‣ Networks ‣
Buy Me a Coffee
KONECT ‣ Networks ‣
Buy Me a Coffee