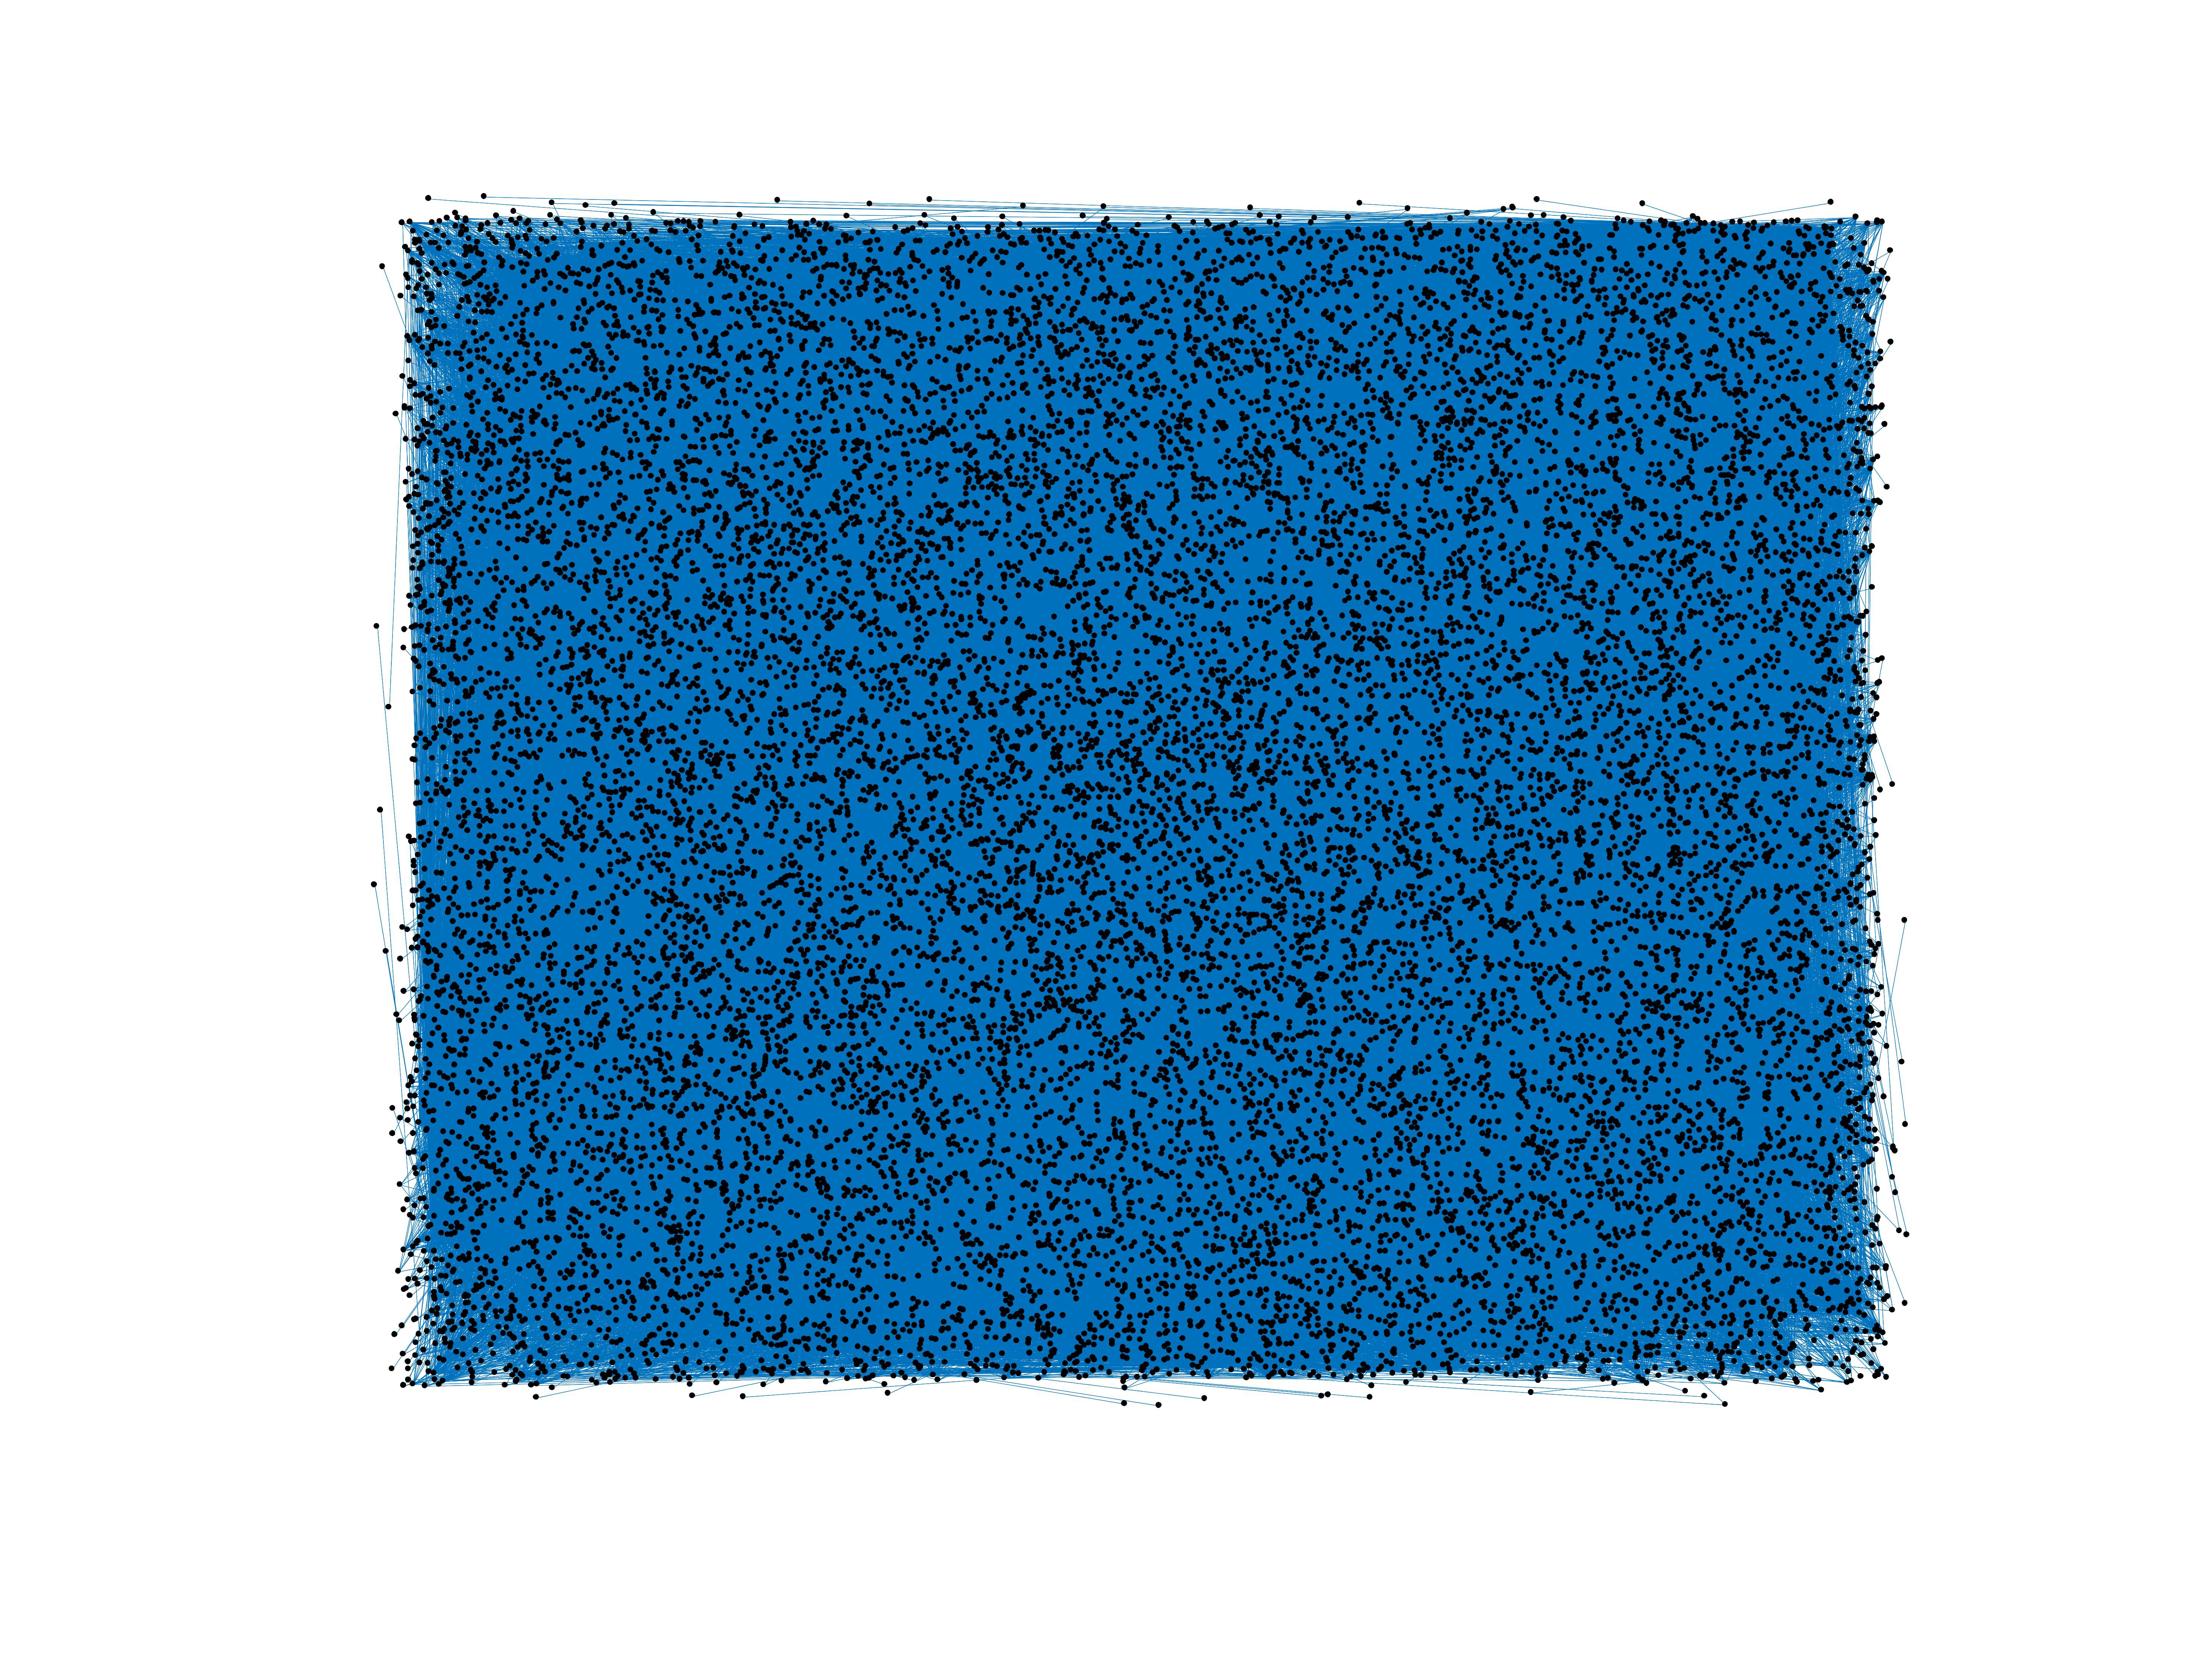
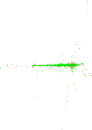
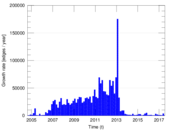
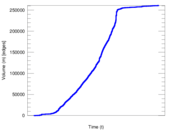
Wikipedia edits (se)
This is the bipartite edit network of the Northern Sami Wikipedia. It contains
users and pages from the Northern Sami Wikipedia, connected by edit events.
Each edge represents an edit. The dataset includes the timestamp of each edit.
Metadata
Statistics
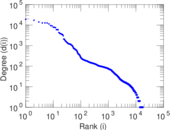
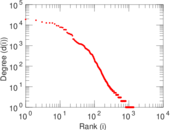
| Size | n = | 18,055
|
| Left size | n1 = | 1,372
|
| Right size | n2 = | 16,683
|
| Volume | m = | 261,169
|
| Unique edge count | m̿ = | 127,406
|
| Wedge count | s = | 180,572,996
|
| Claw count | z = | 289,670,471,393
|
| Cross count | x = | 425,219,060,395,663
|
| Square count | q = | 447,730,751
|
| 4-Tour count | T4 = | 4,304,418,604
|
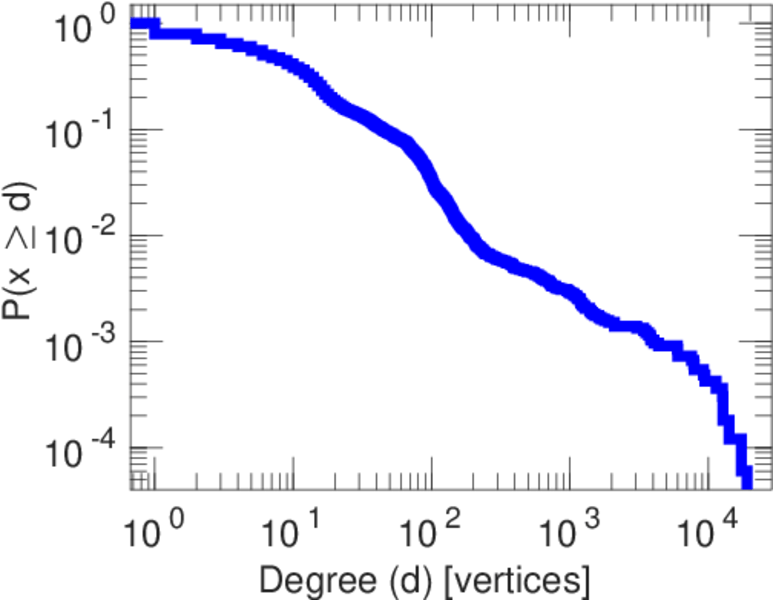
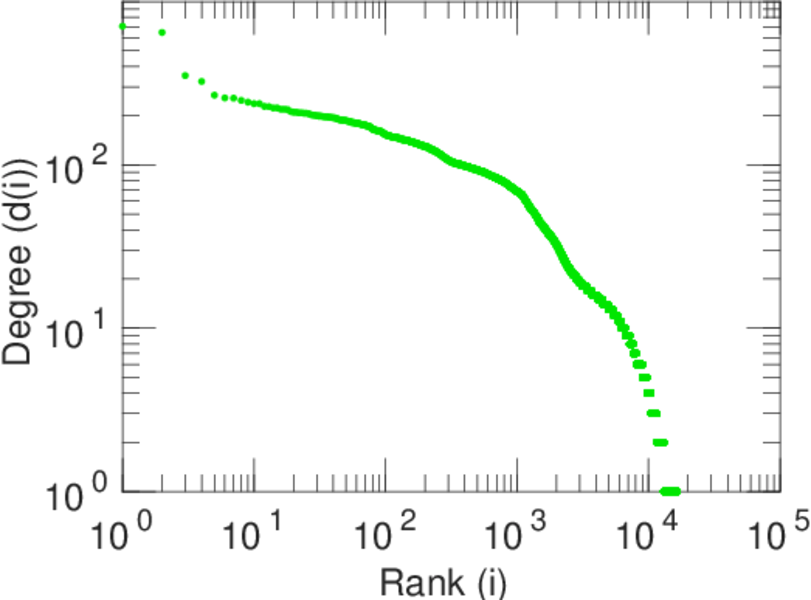
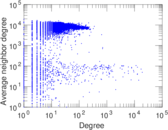
| Maximum degree | dmax = | 19,019
|
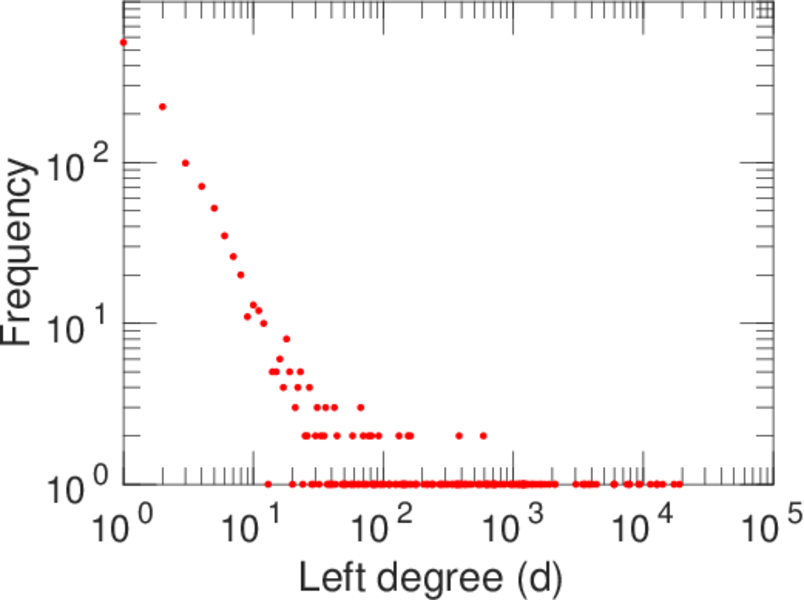
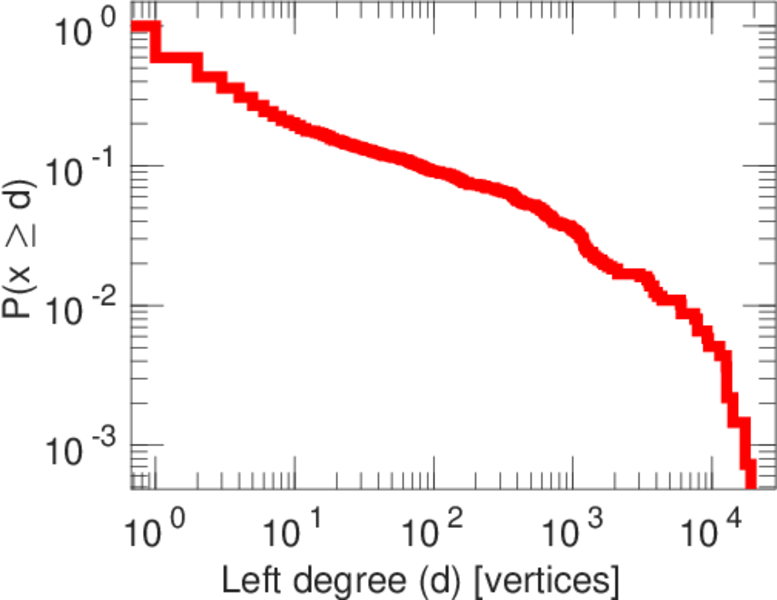
| Maximum left degree | d1max = | 19,019
|
| Maximum right degree | d2max = | 706
|
| Average degree | d = | 28.930 4
|
| Average left degree | d1 = | 190.356
|
| Average right degree | d2 = | 15.654 8
|
| Fill | p = | 0.005 566 24
|
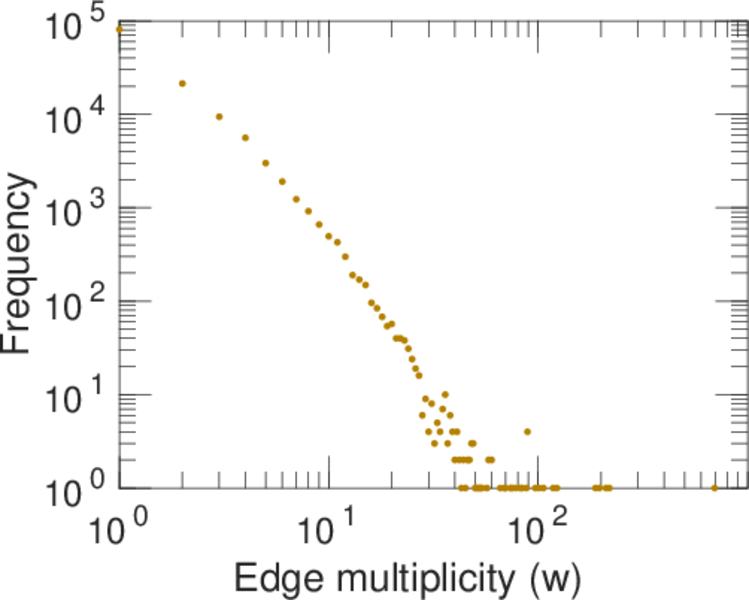
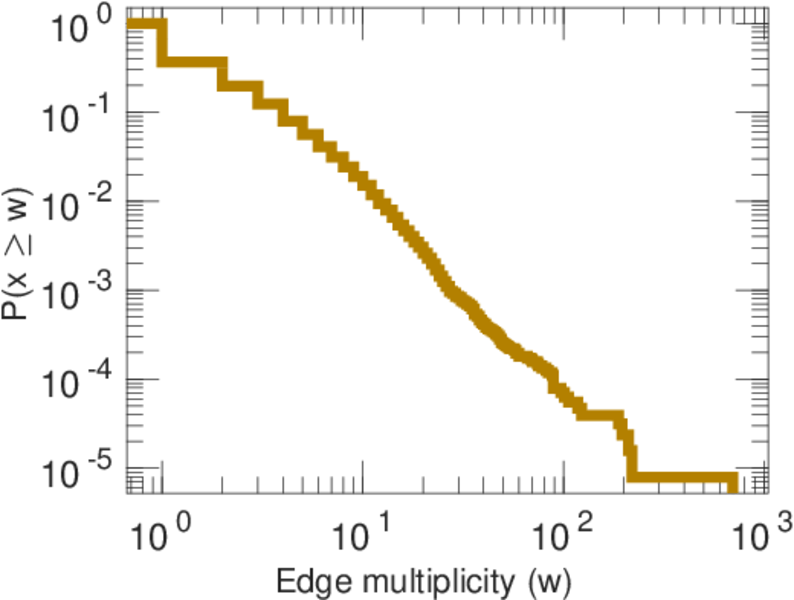
| Average edge multiplicity | m̃ = | 2.049 90
|
| Size of LCC | N = | 17,247
|
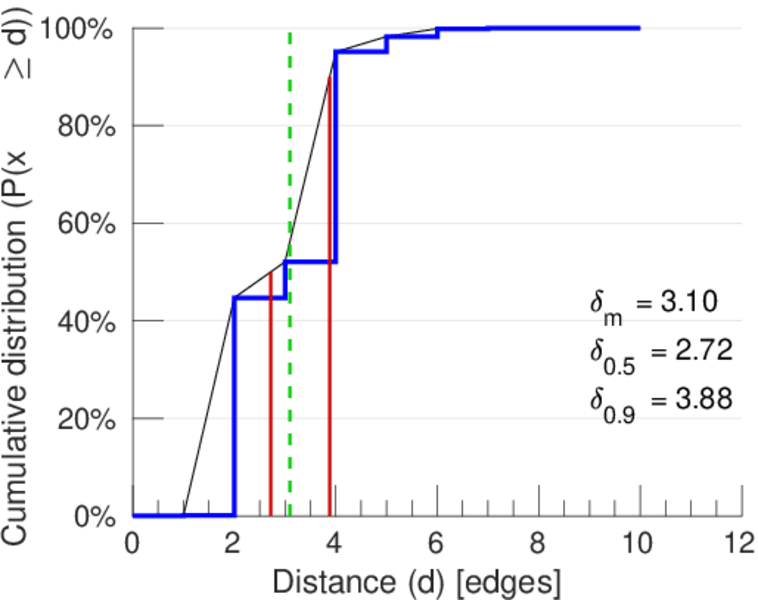
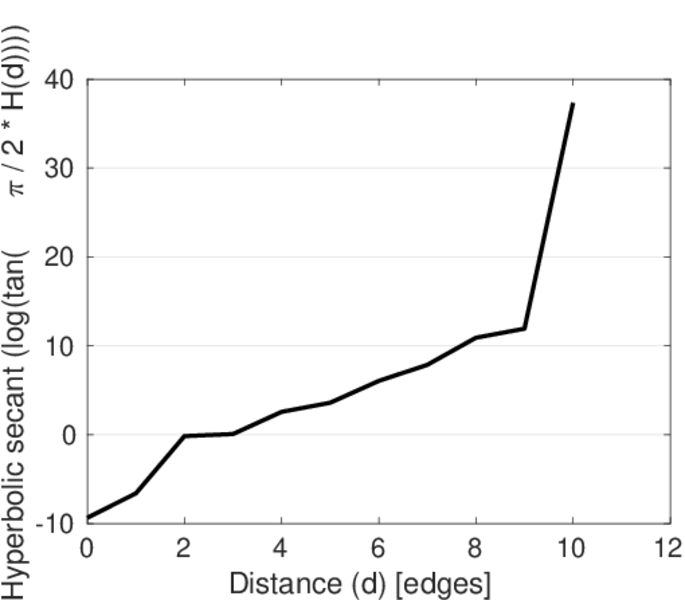
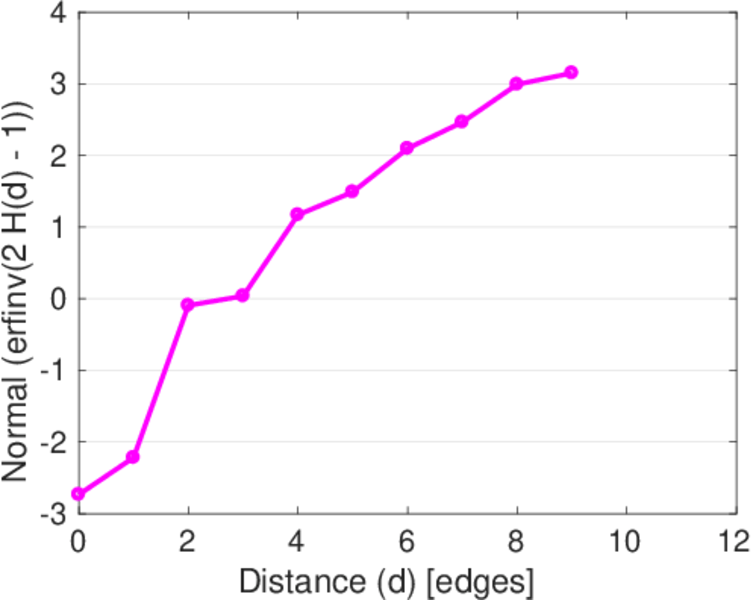
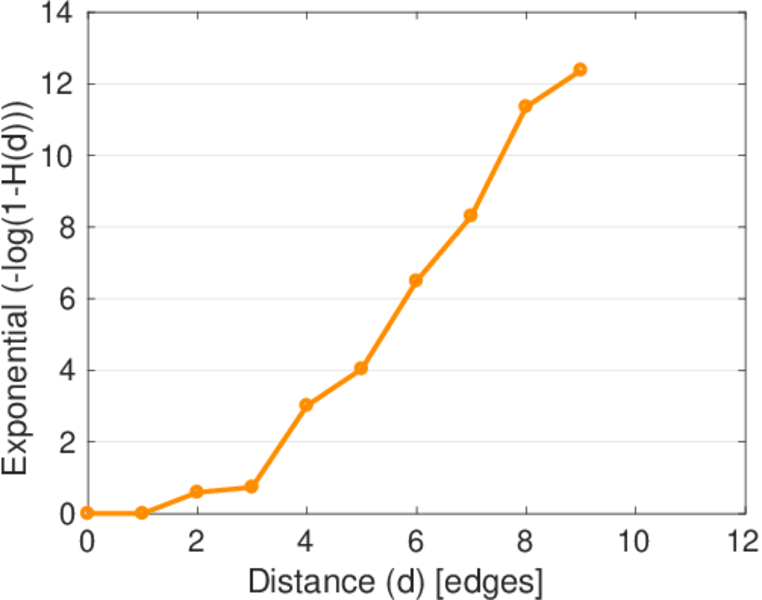
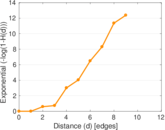
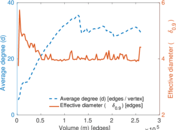
| Diameter | δ = | 11
|
| 50-Percentile effective diameter | δ0.5 = | 2.718 71
|
| 90-Percentile effective diameter | δ0.9 = | 3.881 55
|
| Median distance | δM = | 3
|
| Mean distance | δm = | 3.099 78
|
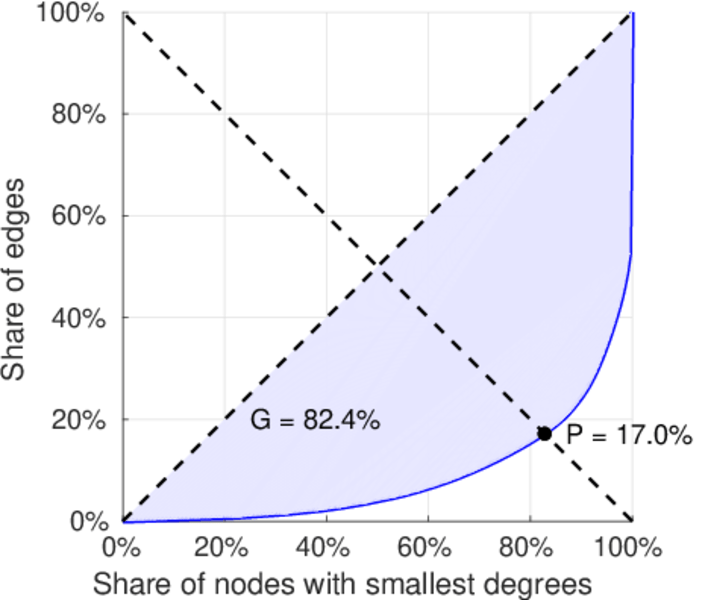
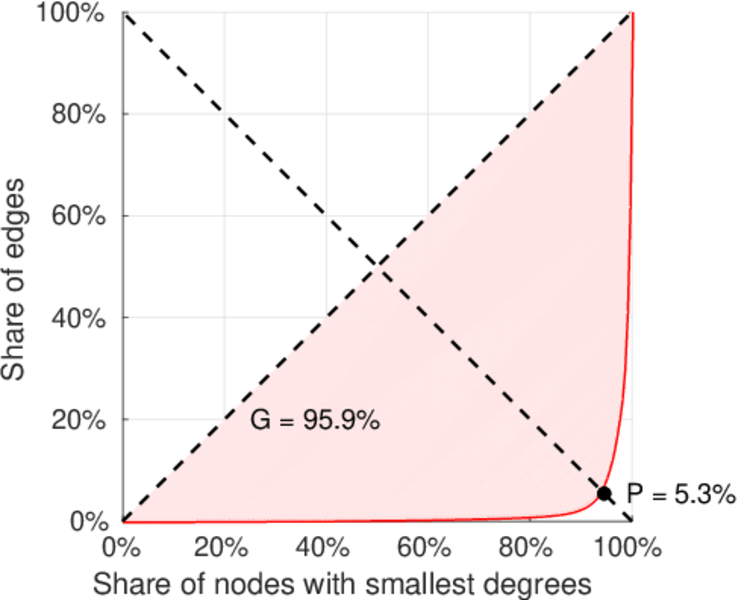
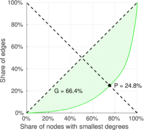
| Gini coefficient | G = | 0.821 692
|
| Balanced inequality ratio | P = | 0.171 155
|
| Left balanced inequality ratio | P1 = | 0.052 732 1
|
| Right balanced inequality ratio | P2 = | 0.248 050
|
| Relative edge distribution entropy | Her = | 0.762 172
|
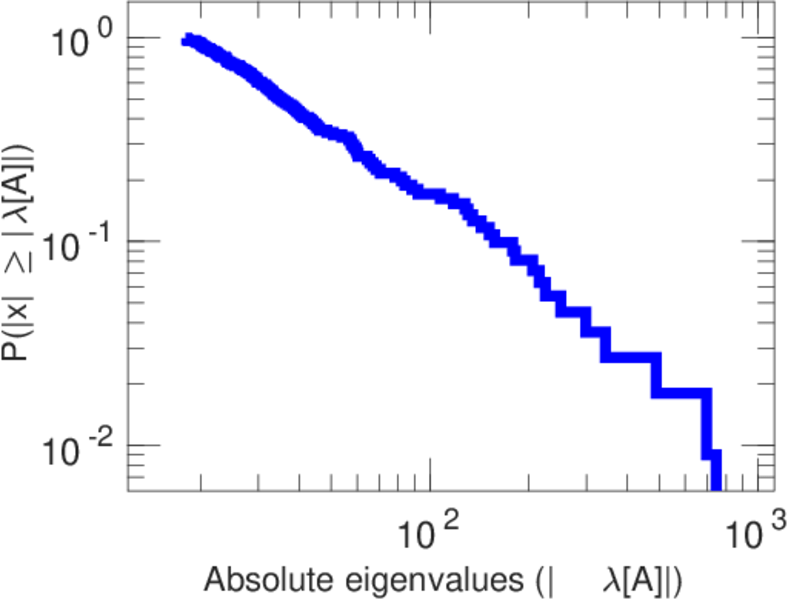
| Power law exponent | γ = | 1.733 32
|
| Tail power law exponent | γt = | 2.321 00
|
| Tail power law exponent with p | γ3 = | 2.321 00
|
| p-value | p = | 0.000 00
|
| Left tail power law exponent with p | γ3,1 = | 1.611 00
|
| Left p-value | p1 = | 0.000 00
|
| Right tail power law exponent with p | γ3,2 = | 2.471 00
|
| Right p-value | p2 = | 0.000 00
|
| Degree assortativity | ρ = | −0.324 174
|
| Degree assortativity p-value | pρ = | 0.000 00
|
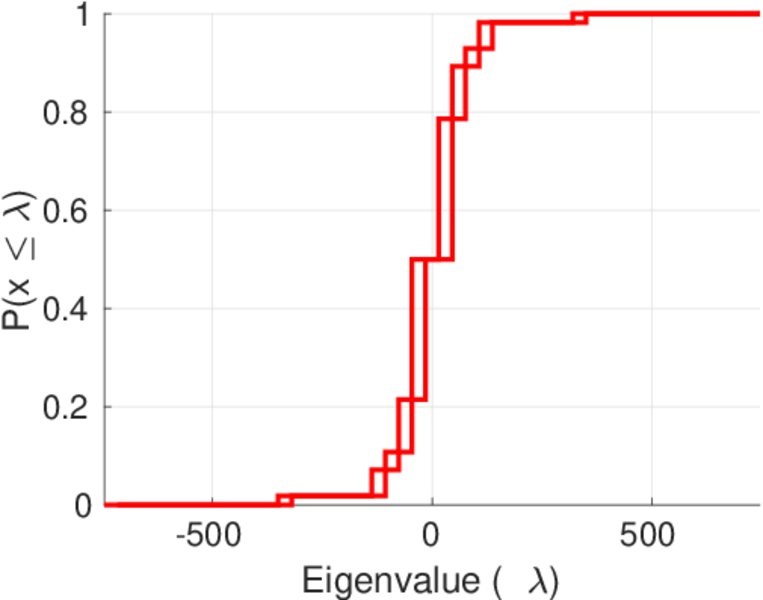
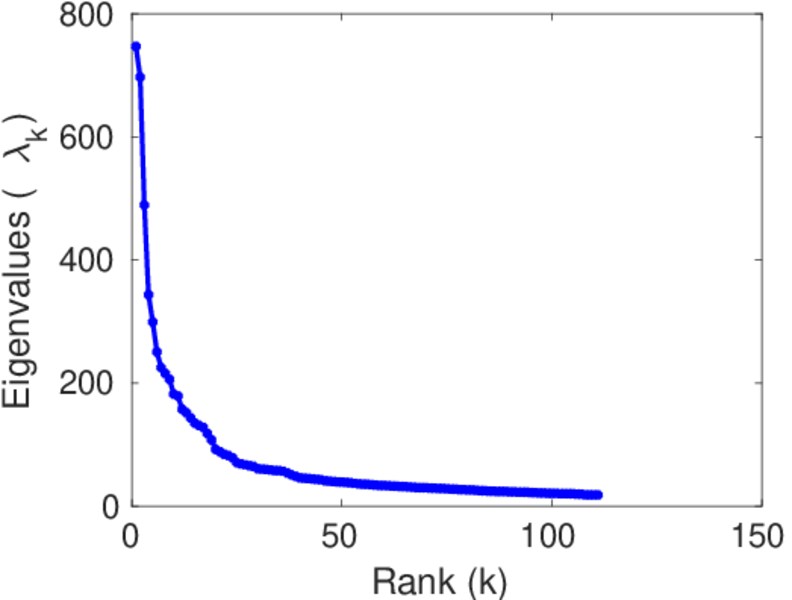
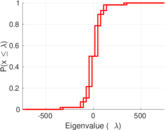
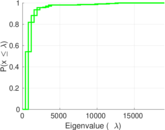
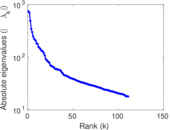
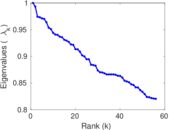
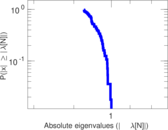
| Spectral norm | α = | 746.875
|
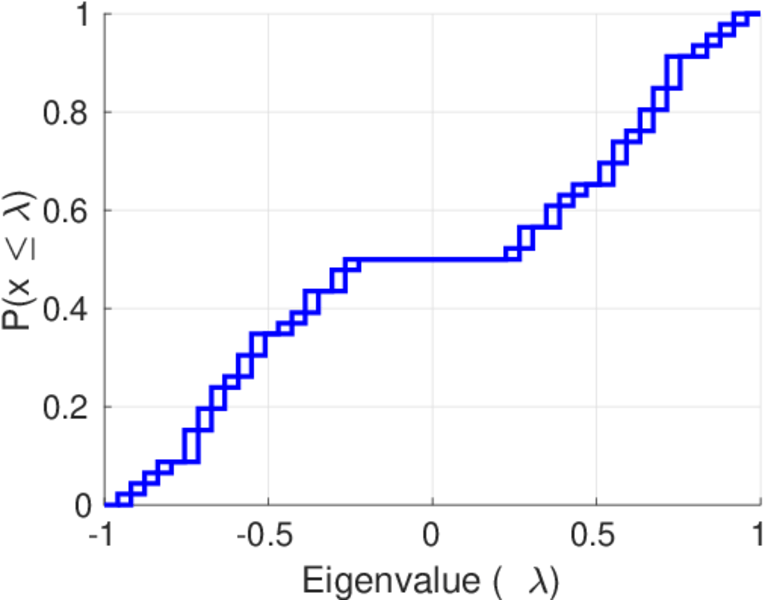
| Algebraic connectivity | a = | 0.049 840 6
|
| Spectral separation | |λ1[A] / λ2[A]| = | 1.071 47
|
| Controllability | C = | 15,453
|
| Relative controllability | Cr = | 0.864 745
|
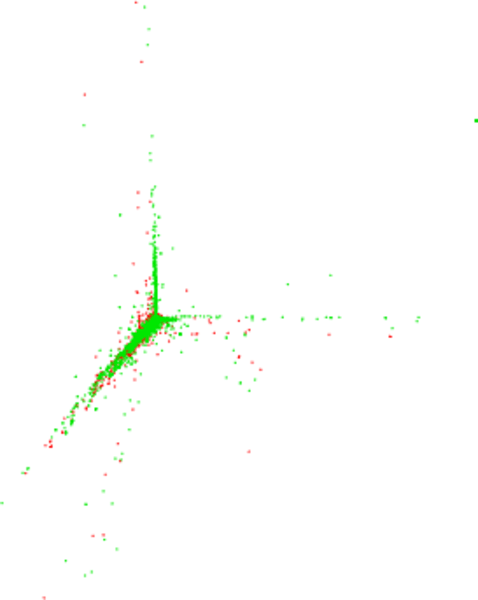
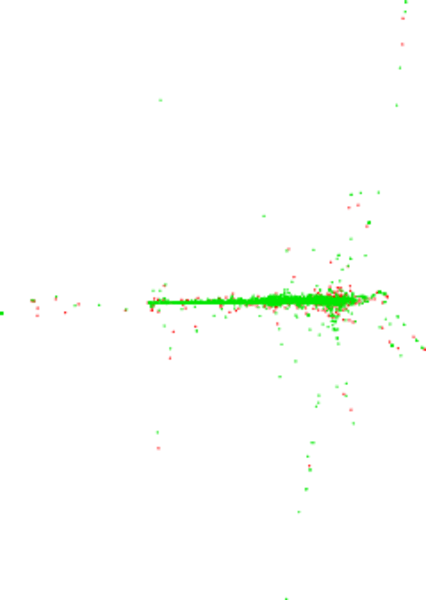
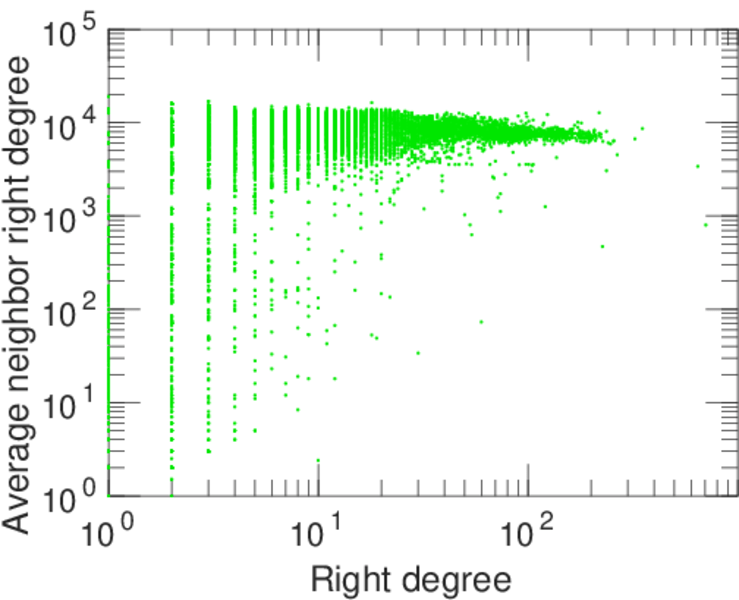
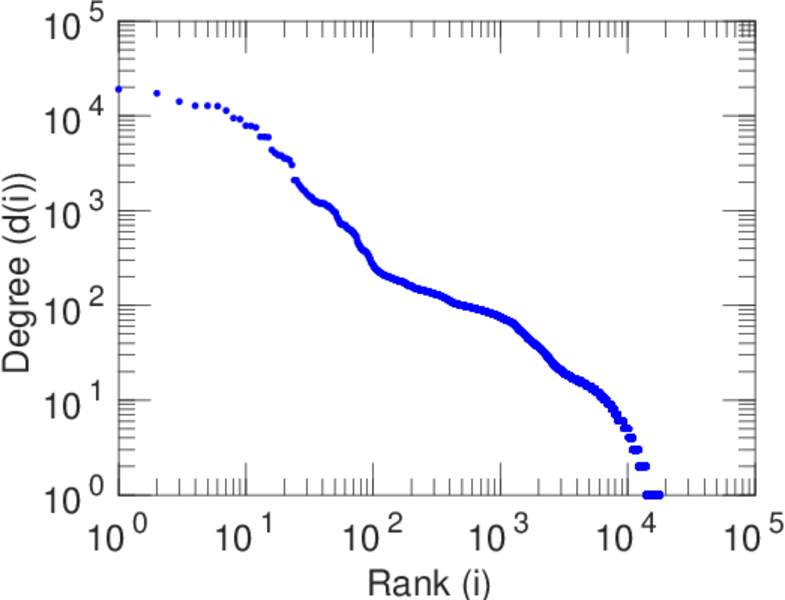
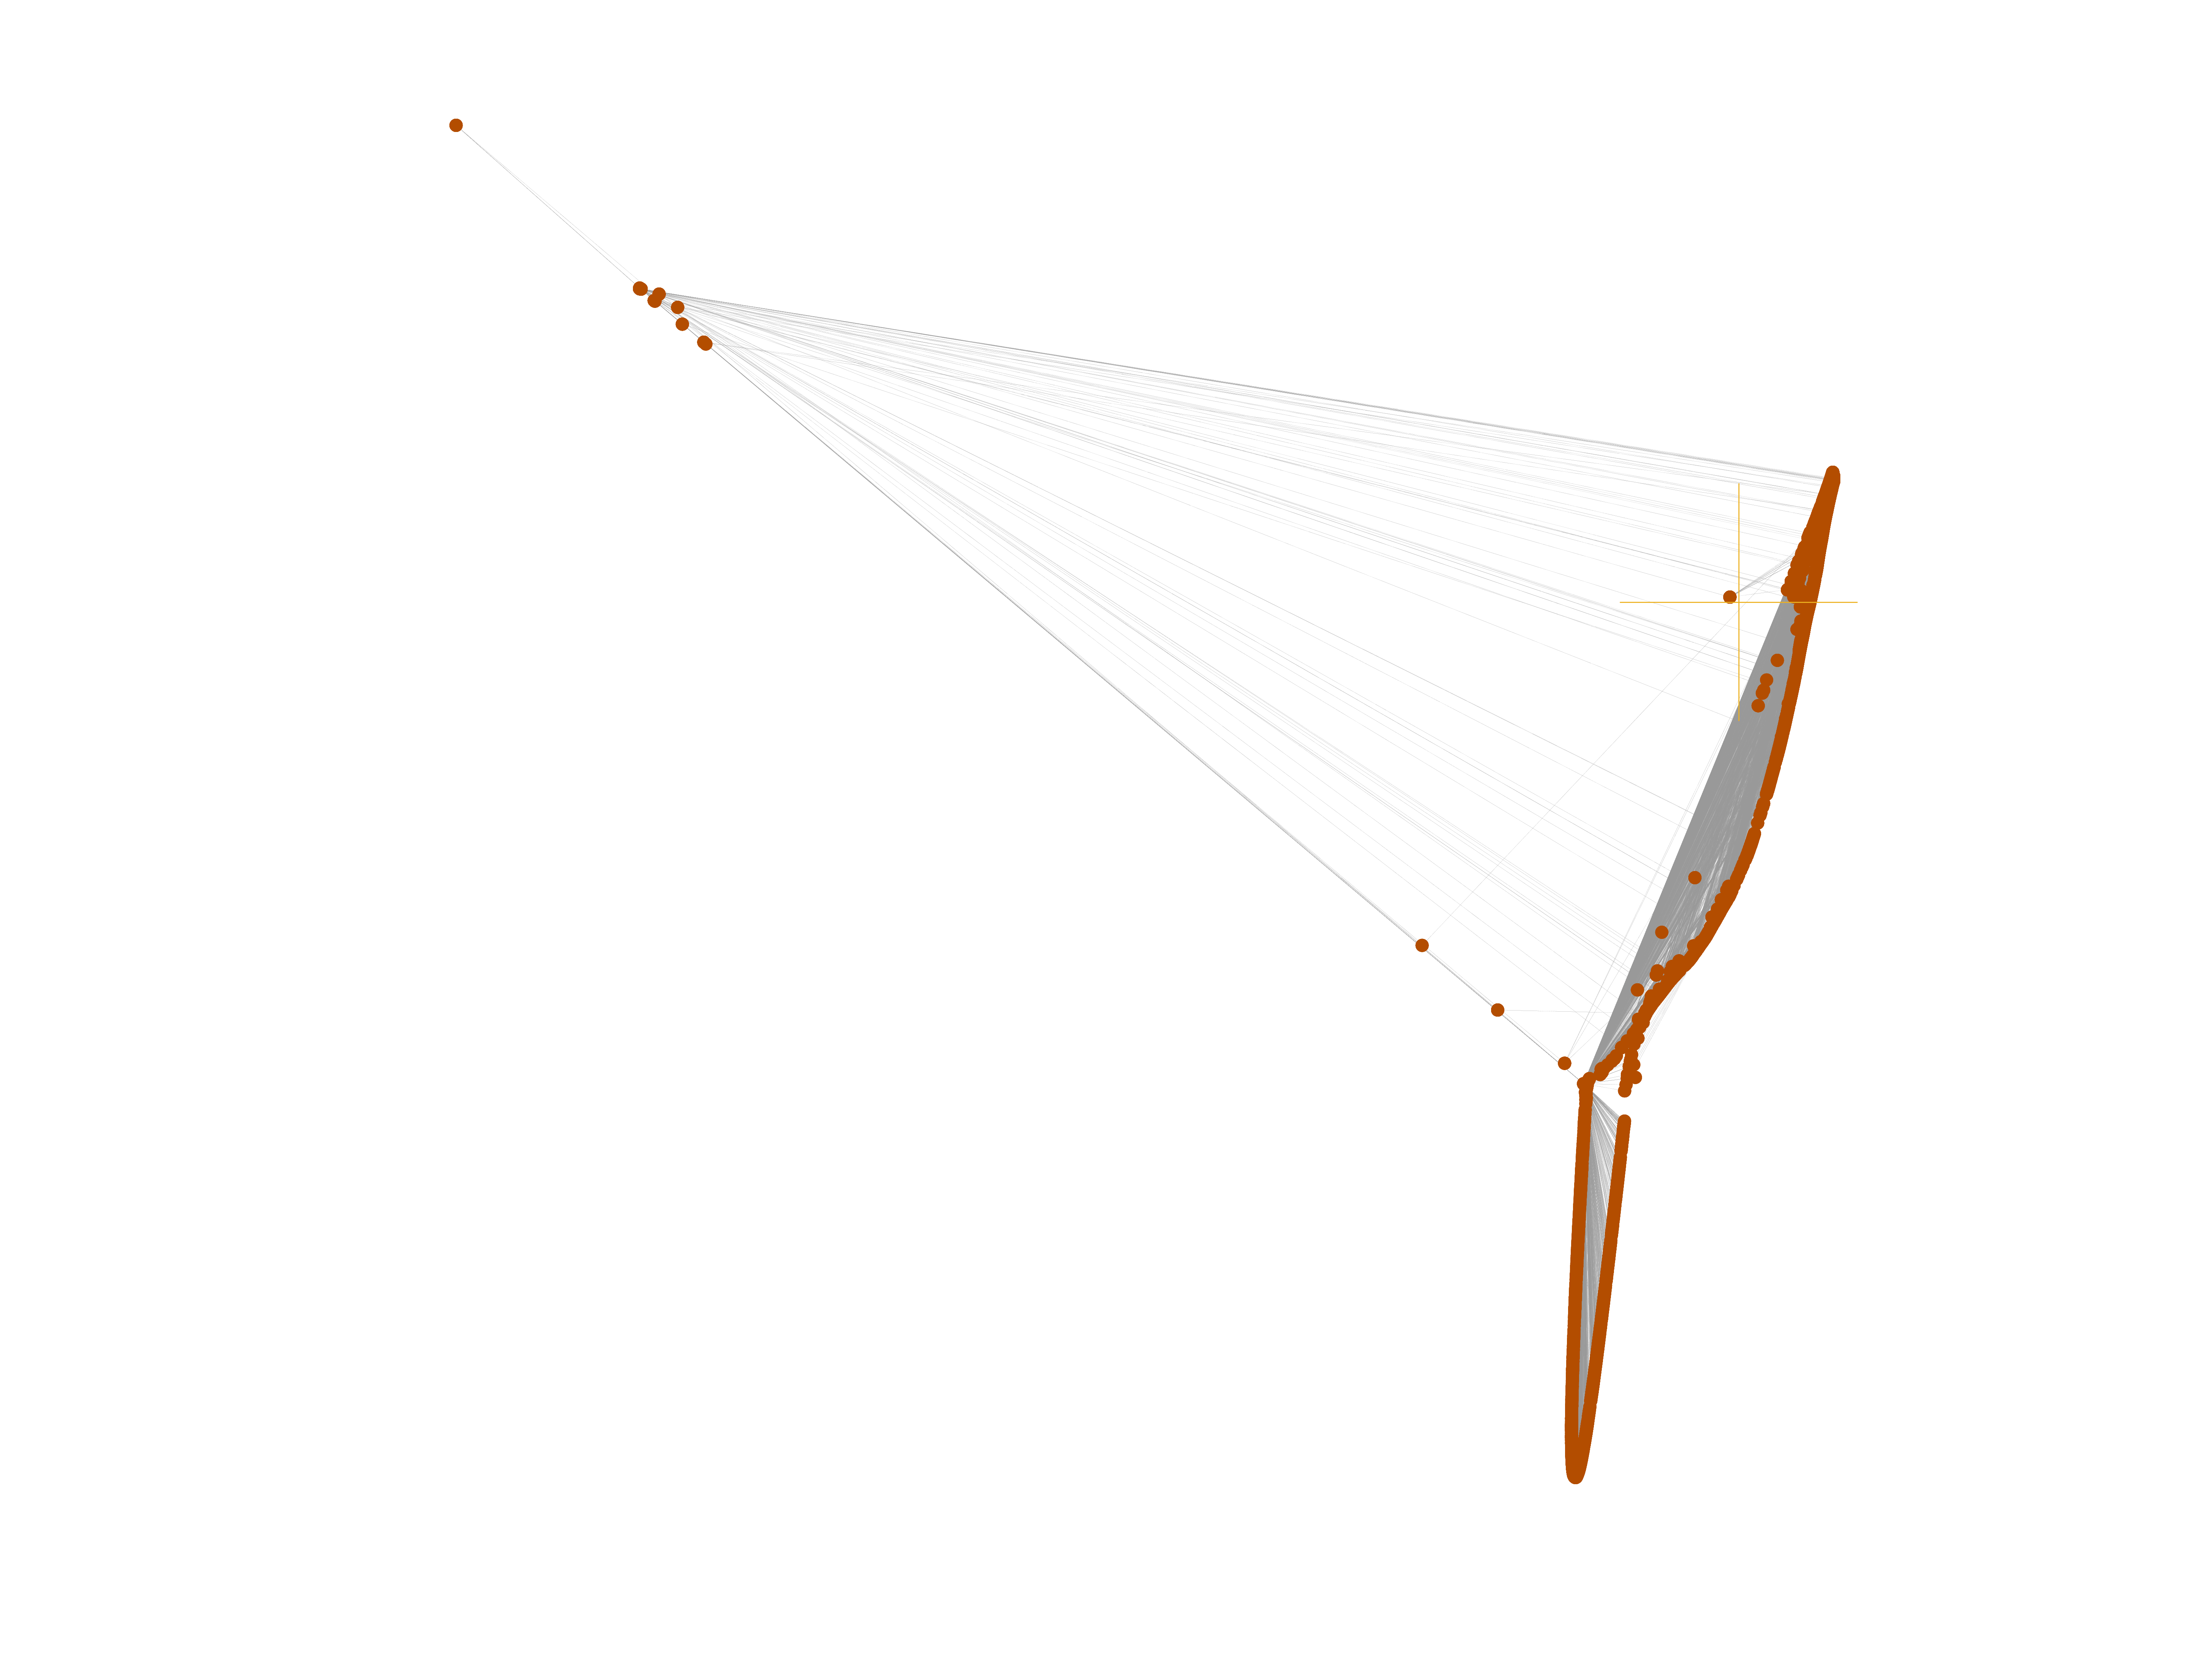
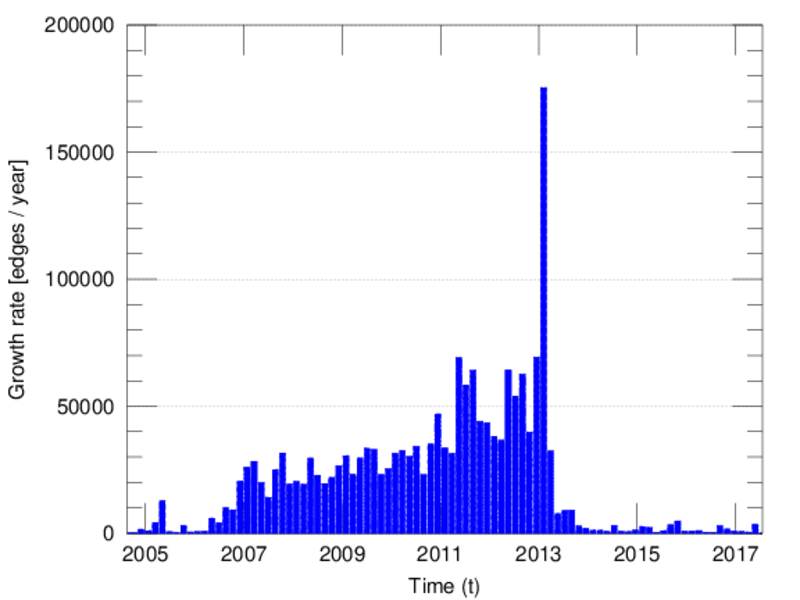
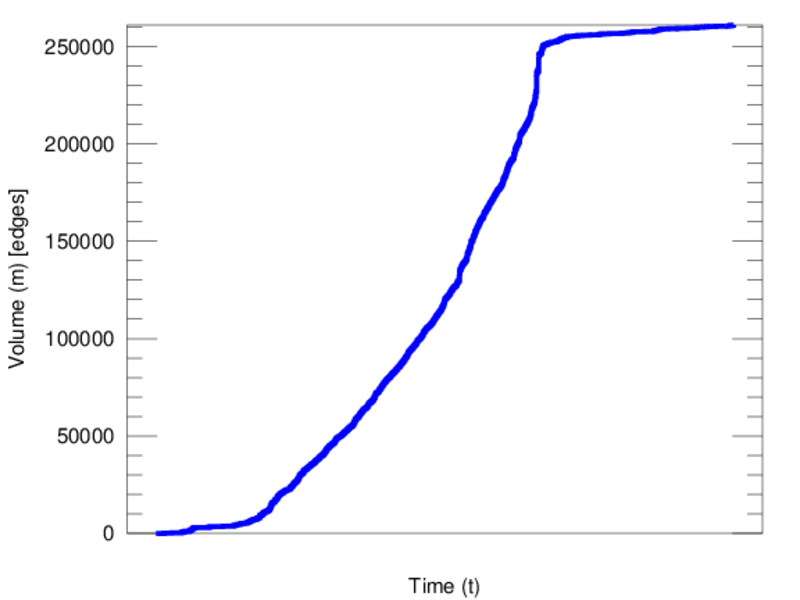
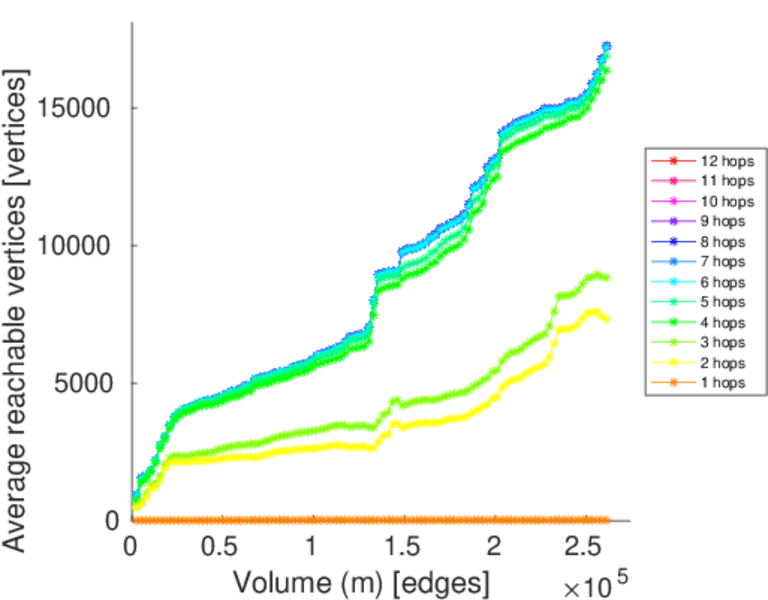
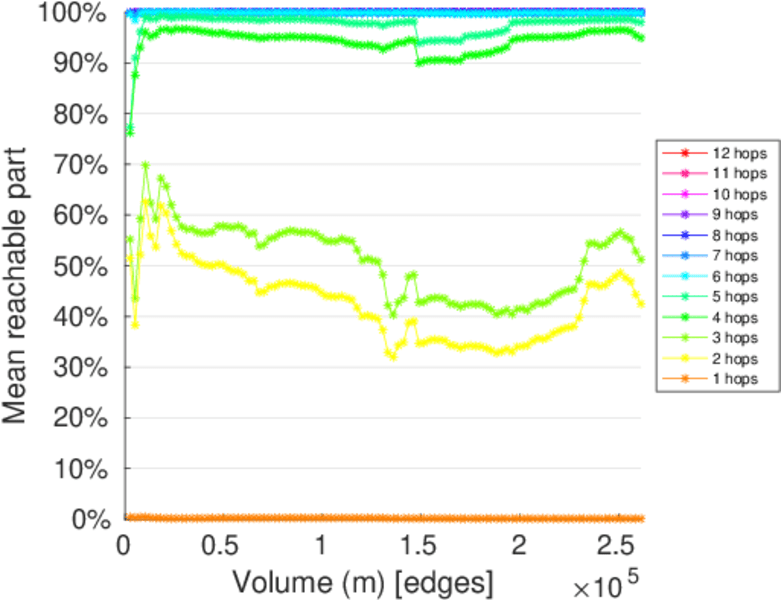
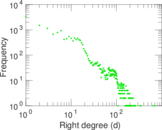
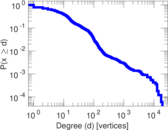
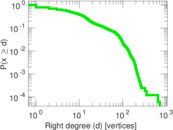
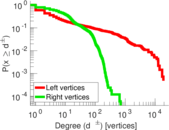
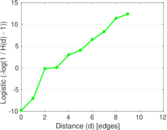
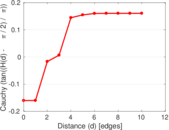
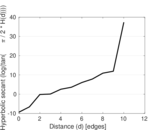
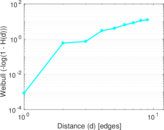
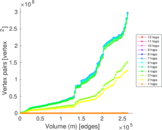
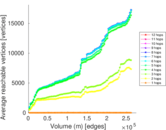
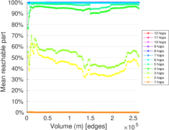
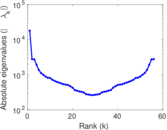
Plots


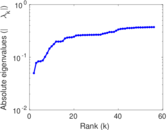
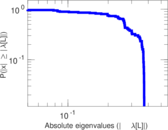
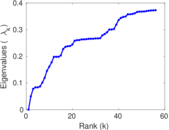
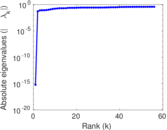
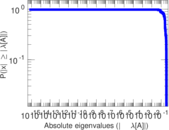
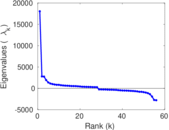
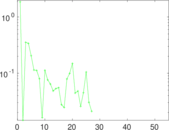
Matrix decompositions plots


Downloads
References
|
[1]
|
Jérôme Kunegis.
KONECT – The Koblenz Network Collection.
In Proc. Int. Conf. on World Wide Web Companion, pages
1343–1350, 2013.
[ http ]
|
|
[2]
|
Wikimedia Foundation.
Wikimedia downloads.
http://dumps.wikimedia.org/, January 2010.
|
 KONECT ‣ Networks ‣
Buy Me a Coffee
KONECT ‣ Networks ‣
Buy Me a Coffee